South Jacksonville, IL Map & Demographics
South Jacksonville Map
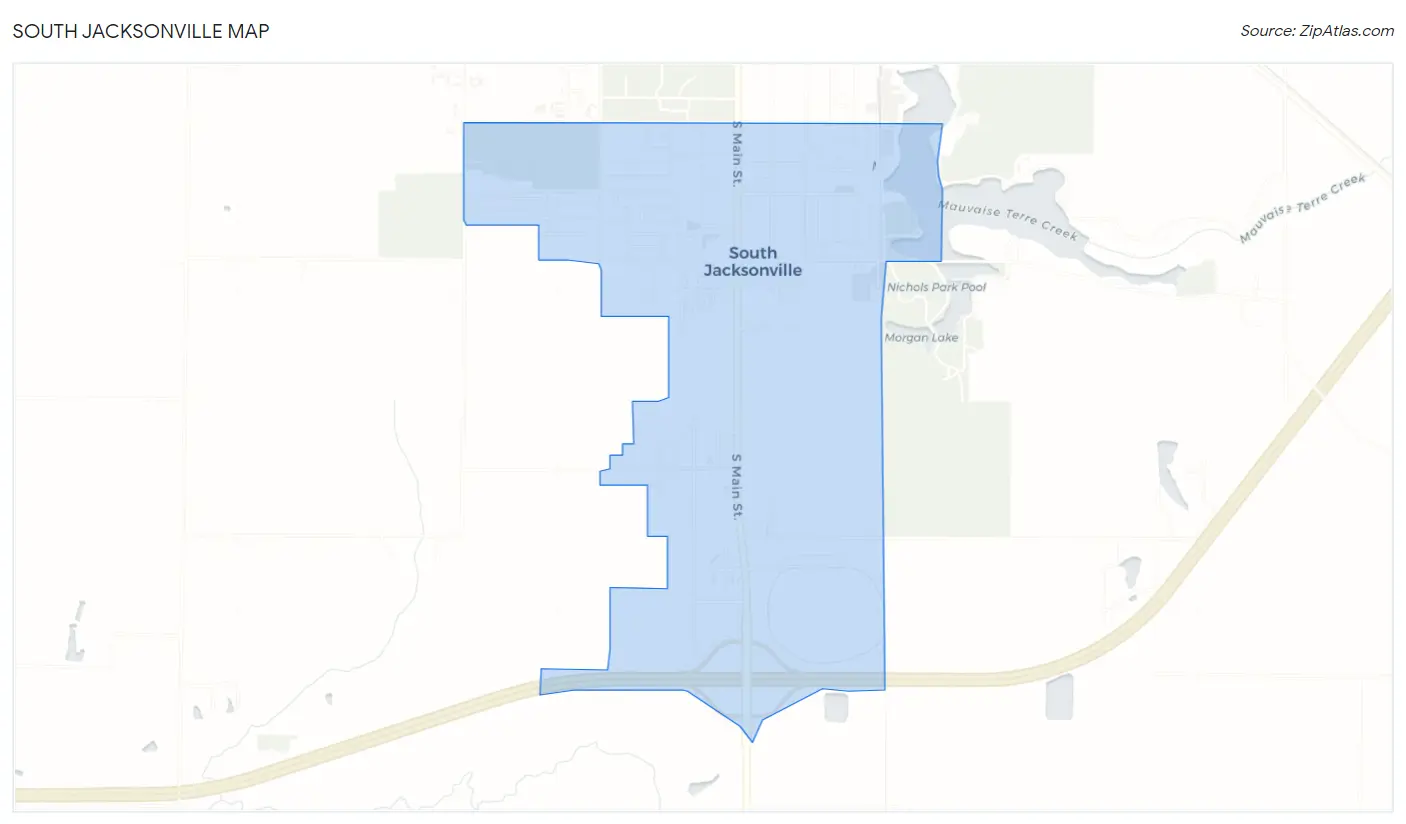
South Jacksonville Overview
$32,334
PER CAPITA INCOME
$85,020
AVG FAMILY INCOME
$52,083
AVG HOUSEHOLD INCOME
33.6%
WAGE / INCOME GAP [ % ]
66.4¢/ $1
WAGE / INCOME GAP [ $ ]
0.37
INEQUALITY / GINI INDEX
3,286
TOTAL POPULATION
1,518
MALE POPULATION
1,768
FEMALE POPULATION
85.86
MALES / 100 FEMALES
116.47
FEMALES / 100 MALES
48.2
MEDIAN AGE
2.7
AVG FAMILY SIZE
2.0
AVG HOUSEHOLD SIZE
1,477
LABOR FORCE [ PEOPLE ]
55.2%
PERCENT IN LABOR FORCE
10.4%
UNEMPLOYMENT RATE
South Jacksonville Area Codes
Income in South Jacksonville
Income Overview in South Jacksonville
Per Capita Income in South Jacksonville is $32,334, while median incomes of families and households are $85,020 and $52,083 respectively.
| Characteristic | Number | Measure |
| Per Capita Income | 3,286 | $32,334 |
| Median Family Income | 875 | $85,020 |
| Mean Family Income | 875 | $79,585 |
| Median Household Income | 1,645 | $52,083 |
| Mean Household Income | 1,645 | $63,010 |
| Income Deficit | 875 | $0 |
| Wage / Income Gap (%) | 3,286 | 33.55% |
| Wage / Income Gap ($) | 3,286 | 66.45¢ per $1 |
| Gini / Inequality Index | 3,286 | 0.37 |
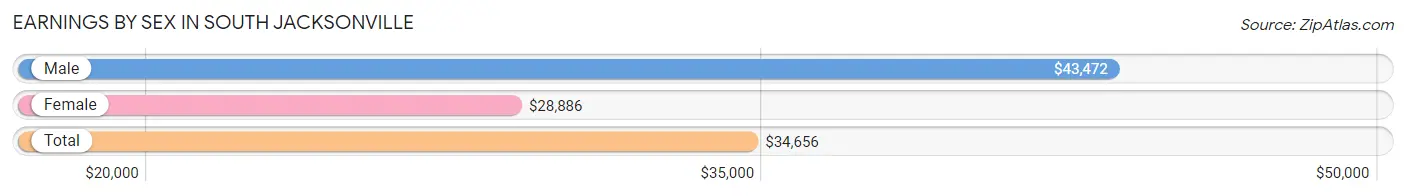
Earnings by Sex in South Jacksonville
Average Earnings in South Jacksonville are $34,656, $43,472 for men and $28,886 for women, a difference of 33.6%.
| Sex | Number | Average Earnings |
| Male | 807 (50.6%) | $43,472 |
| Female | 787 (49.4%) | $28,886 |
| Total | 1,594 (100.0%) | $34,656 |
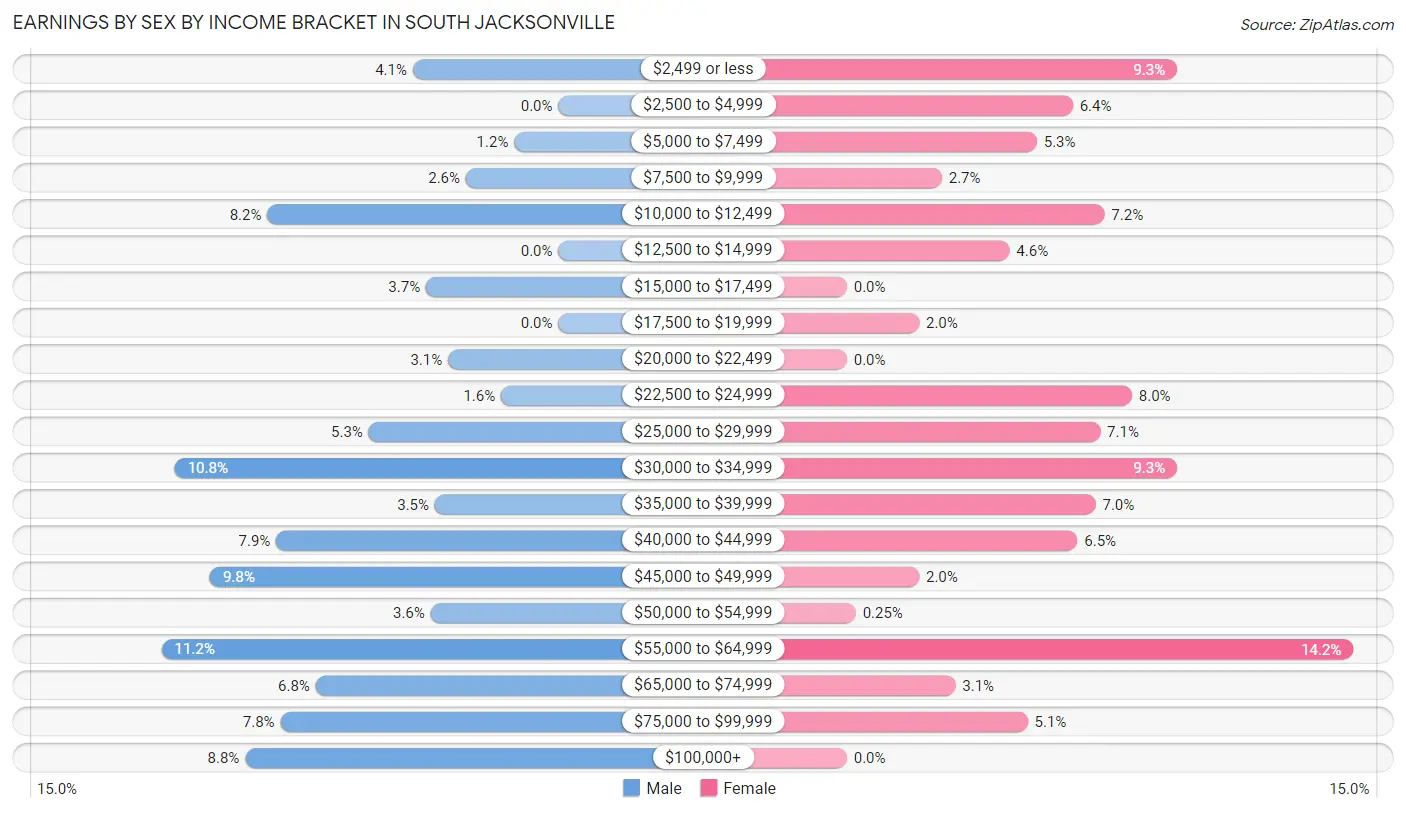
Earnings by Sex by Income Bracket in South Jacksonville
The most common earnings brackets in South Jacksonville are $55,000 to $64,999 for men (90 | 11.2%) and $55,000 to $64,999 for women (112 | 14.2%).
| Income | Male | Female |
| $2,499 or less | 33 (4.1%) | 73 (9.3%) |
| $2,500 to $4,999 | 0 (0.0%) | 50 (6.4%) |
| $5,000 to $7,499 | 10 (1.2%) | 42 (5.3%) |
| $7,500 to $9,999 | 21 (2.6%) | 21 (2.7%) |
| $10,000 to $12,499 | 66 (8.2%) | 57 (7.2%) |
| $12,500 to $14,999 | 0 (0.0%) | 36 (4.6%) |
| $15,000 to $17,499 | 30 (3.7%) | 0 (0.0%) |
| $17,500 to $19,999 | 0 (0.0%) | 16 (2.0%) |
| $20,000 to $22,499 | 25 (3.1%) | 0 (0.0%) |
| $22,500 to $24,999 | 13 (1.6%) | 63 (8.0%) |
| $25,000 to $29,999 | 43 (5.3%) | 56 (7.1%) |
| $30,000 to $34,999 | 87 (10.8%) | 73 (9.3%) |
| $35,000 to $39,999 | 28 (3.5%) | 55 (7.0%) |
| $40,000 to $44,999 | 64 (7.9%) | 51 (6.5%) |
| $45,000 to $49,999 | 79 (9.8%) | 16 (2.0%) |
| $50,000 to $54,999 | 29 (3.6%) | 2 (0.3%) |
| $55,000 to $64,999 | 90 (11.2%) | 112 (14.2%) |
| $65,000 to $74,999 | 55 (6.8%) | 24 (3.0%) |
| $75,000 to $99,999 | 63 (7.8%) | 40 (5.1%) |
| $100,000+ | 71 (8.8%) | 0 (0.0%) |
| Total | 807 (100.0%) | 787 (100.0%) |
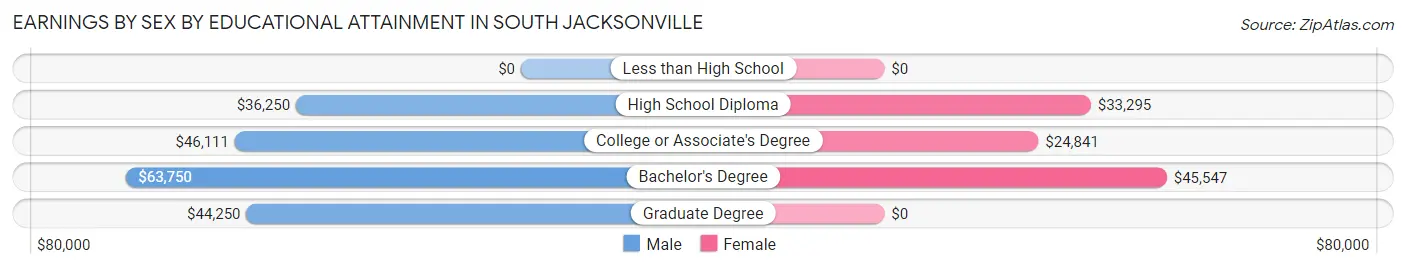
Earnings by Sex by Educational Attainment in South Jacksonville
Average earnings in South Jacksonville are $45,823 for men and $34,167 for women, a difference of 25.4%. Men with an educational attainment of bachelor's degree enjoy the highest average annual earnings of $63,750, while those with high school diploma education earn the least with $36,250. Women with an educational attainment of bachelor's degree earn the most with the average annual earnings of $45,547, while those with college or associate's degree education have the smallest earnings of $24,841.
| Educational Attainment | Male Income | Female Income |
| Less than High School | - | - |
| High School Diploma | $36,250 | $33,295 |
| College or Associate's Degree | $46,111 | $24,841 |
| Bachelor's Degree | $63,750 | $45,547 |
| Graduate Degree | $44,250 | $0 |
| Total | $45,823 | $34,167 |
Family Income in South Jacksonville
Family Income Brackets in South Jacksonville
According to the South Jacksonville family income data, there are 287 families falling into the $75,000 to $99,999 income range, which is the most common income bracket and makes up 32.8% of all families. Conversely, the $200,000+ income bracket is the least frequent group with only 8 families (0.9%) belonging to this category.
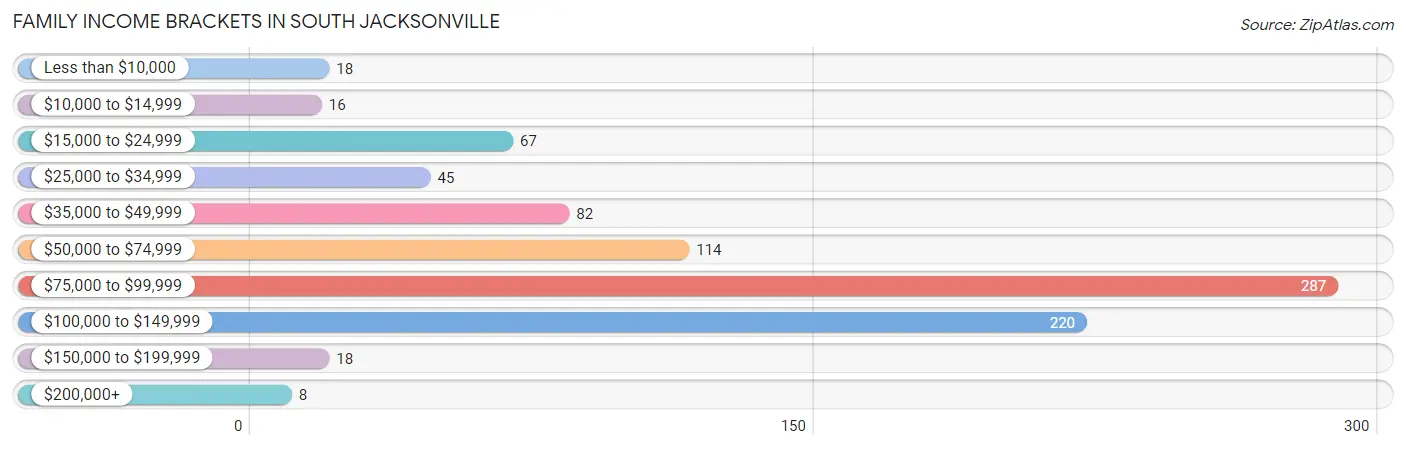
| Income Bracket | # Families | % Families |
| Less than $10,000 | 18 | 2.1% |
| $10,000 to $14,999 | 16 | 1.8% |
| $15,000 to $24,999 | 67 | 7.7% |
| $25,000 to $34,999 | 45 | 5.1% |
| $35,000 to $49,999 | 82 | 9.4% |
| $50,000 to $74,999 | 114 | 13.0% |
| $75,000 to $99,999 | 287 | 32.8% |
| $100,000 to $149,999 | 220 | 25.1% |
| $150,000 to $199,999 | 18 | 2.1% |
| $200,000+ | 8 | 0.9% |
Family Income by Famaliy Size in South Jacksonville
4-person families (89 | 10.2%) account for the highest median family income in South Jacksonville with $127,538 per family, while 2-person families (616 | 70.4%) have the highest median income of $41,371 per family member.
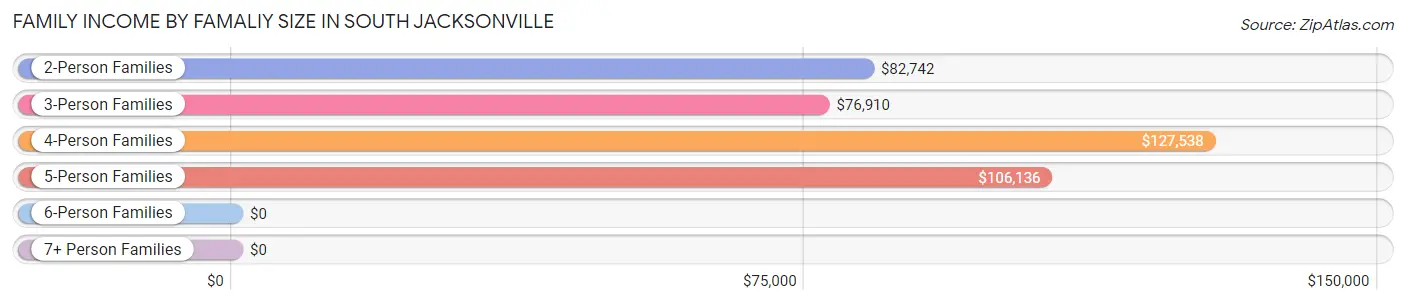
| Income Bracket | # Families | Median Income |
| 2-Person Families | 616 (70.4%) | $82,742 |
| 3-Person Families | 119 (13.6%) | $76,910 |
| 4-Person Families | 89 (10.2%) | $127,538 |
| 5-Person Families | 50 (5.7%) | $106,136 |
| 6-Person Families | 1 (0.1%) | $0 |
| 7+ Person Families | 0 (0.0%) | $0 |
| Total | 875 (100.0%) | $85,020 |
Family Income by Number of Earners in South Jacksonville
The median family income in South Jacksonville is $85,020, with families comprising 2 earners (275) having the highest median family income of $107,656, while families with 1 earner (323) have the lowest median family income of $61,531, accounting for 31.4% and 36.9% of families, respectively.
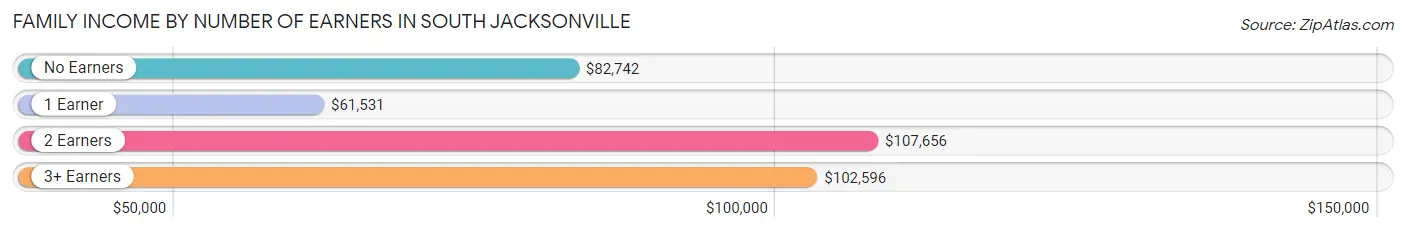
| Number of Earners | # Families | Median Income |
| No Earners | 214 (24.5%) | $82,742 |
| 1 Earner | 323 (36.9%) | $61,531 |
| 2 Earners | 275 (31.4%) | $107,656 |
| 3+ Earners | 63 (7.2%) | $102,596 |
| Total | 875 (100.0%) | $85,020 |
Household Income in South Jacksonville
Household Income Brackets in South Jacksonville
With 334 households falling in the category, the $75,000 to $99,999 income range is the most frequent in South Jacksonville, accounting for 20.3% of all households. In contrast, only 8 households (0.5%) fall into the $200,000+ income bracket, making it the least populous group.
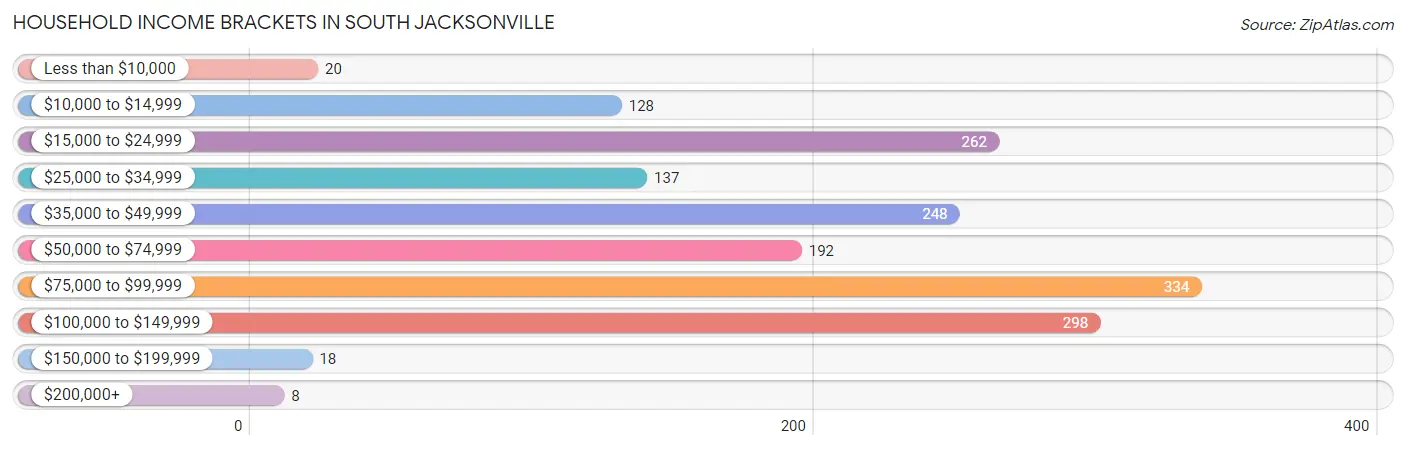
| Income Bracket | # Households | % Households |
| Less than $10,000 | 20 | 1.2% |
| $10,000 to $14,999 | 128 | 7.8% |
| $15,000 to $24,999 | 262 | 15.9% |
| $25,000 to $34,999 | 137 | 8.3% |
| $35,000 to $49,999 | 248 | 15.1% |
| $50,000 to $74,999 | 192 | 11.7% |
| $75,000 to $99,999 | 334 | 20.3% |
| $100,000 to $149,999 | 298 | 18.1% |
| $150,000 to $199,999 | 18 | 1.1% |
| $200,000+ | 8 | 0.5% |
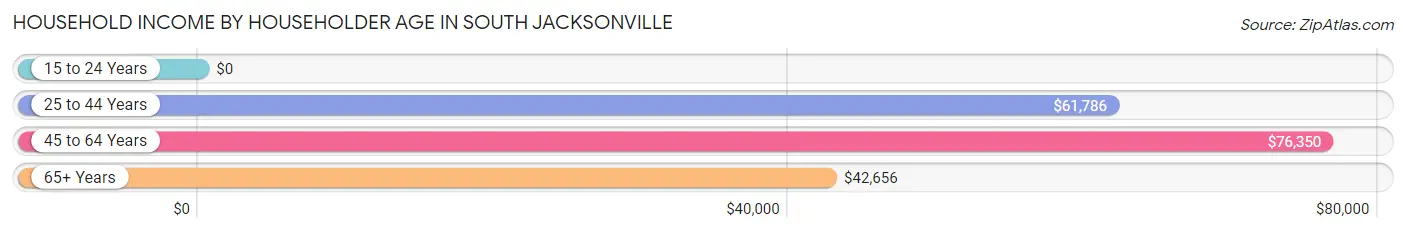
Household Income by Householder Age in South Jacksonville
The median household income in South Jacksonville is $52,083, with the highest median household income of $76,350 found in the 45 to 64 years age bracket for the primary householder. A total of 486 households (29.5%) fall into this category. Meanwhile, the 15 to 24 years age bracket for the primary householder has the lowest median household income of $0, with 28 households (1.7%) in this group.
| Income Bracket | # Households | Median Income |
| 15 to 24 Years | 28 (1.7%) | $0 |
| 25 to 44 Years | 414 (25.2%) | $61,786 |
| 45 to 64 Years | 486 (29.5%) | $76,350 |
| 65+ Years | 717 (43.6%) | $42,656 |
| Total | 1,645 (100.0%) | $52,083 |
Poverty in South Jacksonville
Income Below Poverty by Sex and Age in South Jacksonville
With 4.2% poverty level for males and 14.2% for females among the residents of South Jacksonville, 18 to 24 year old males and under 5 year old females are the most vulnerable to poverty, with 17 males (21.5%) and 57 females (86.4%) in their respective age groups living below the poverty level.
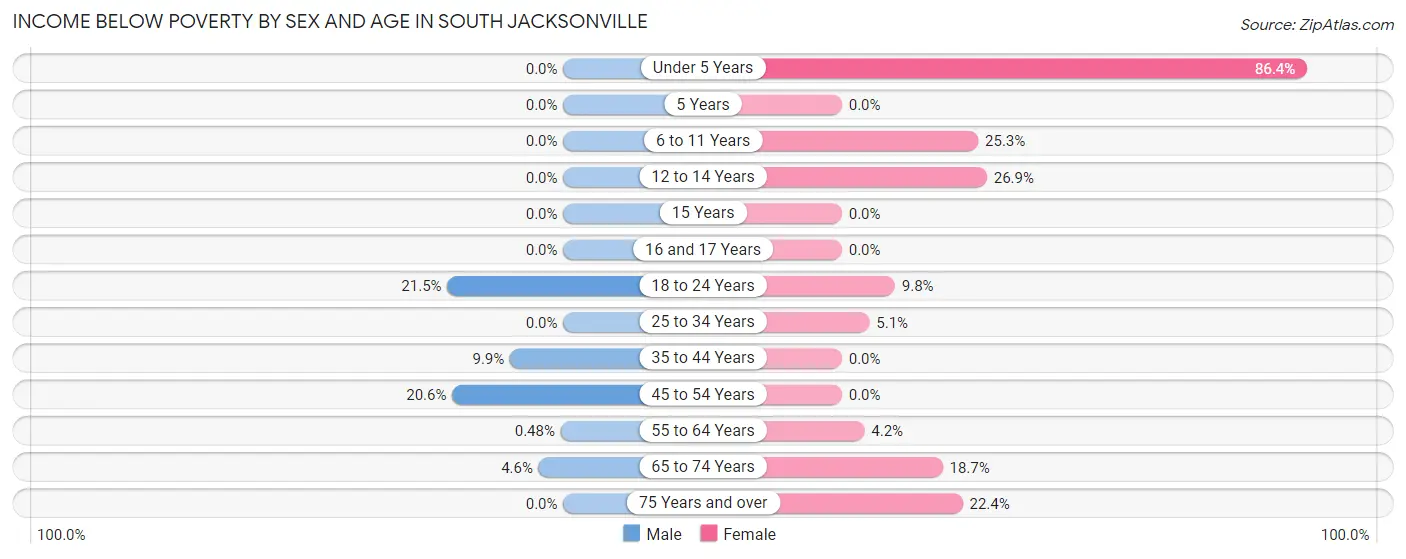
| Age Bracket | Male | Female |
| Under 5 Years | 0 (0.0%) | 57 (86.4%) |
| 5 Years | 0 (0.0%) | 0 (0.0%) |
| 6 to 11 Years | 0 (0.0%) | 21 (25.3%) |
| 12 to 14 Years | 0 (0.0%) | 21 (26.9%) |
| 15 Years | 0 (0.0%) | 0 (0.0%) |
| 16 and 17 Years | 0 (0.0%) | 0 (0.0%) |
| 18 to 24 Years | 17 (21.5%) | 18 (9.8%) |
| 25 to 34 Years | 0 (0.0%) | 11 (5.1%) |
| 35 to 44 Years | 16 (9.9%) | 0 (0.0%) |
| 45 to 54 Years | 20 (20.6%) | 0 (0.0%) |
| 55 to 64 Years | 1 (0.5%) | 13 (4.2%) |
| 65 to 74 Years | 9 (4.5%) | 46 (18.7%) |
| 75 Years and over | 0 (0.0%) | 65 (22.4%) |
| Total | 63 (4.2%) | 252 (14.2%) |
Income Above Poverty by Sex and Age in South Jacksonville
According to the poverty statistics in South Jacksonville, males aged under 5 years and females aged 15 years are the age groups that are most secure financially, with 100.0% of males and 100.0% of females in these age groups living above the poverty line.
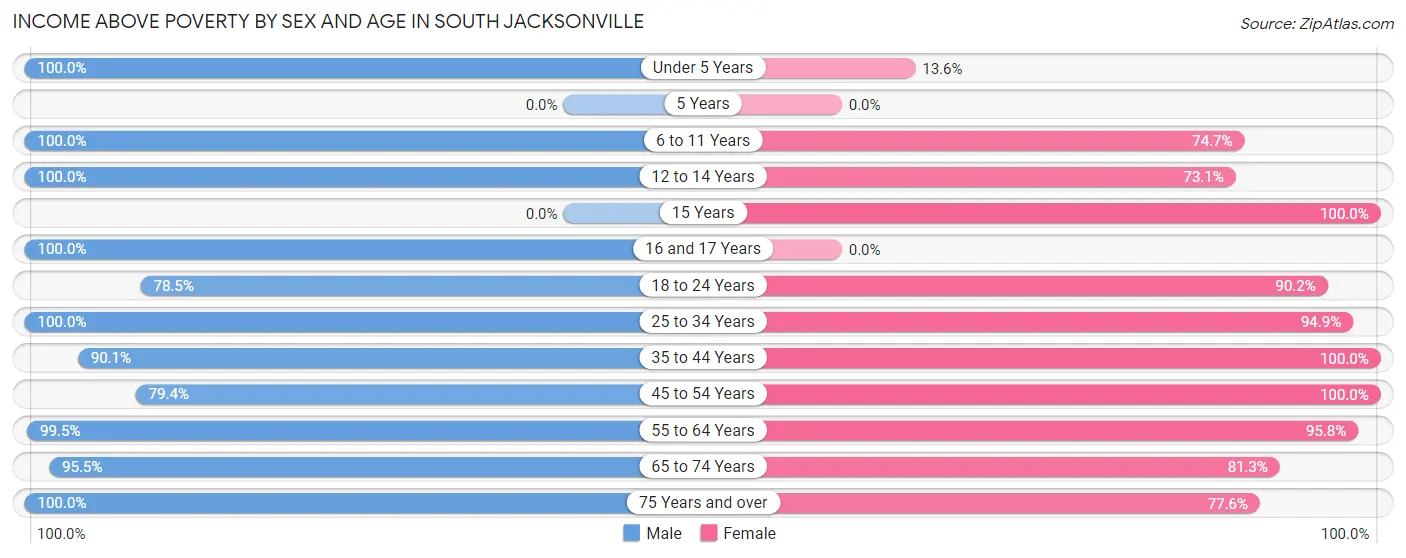
| Age Bracket | Male | Female |
| Under 5 Years | 44 (100.0%) | 9 (13.6%) |
| 5 Years | 0 (0.0%) | 0 (0.0%) |
| 6 to 11 Years | 92 (100.0%) | 62 (74.7%) |
| 12 to 14 Years | 208 (100.0%) | 57 (73.1%) |
| 15 Years | 0 (0.0%) | 29 (100.0%) |
| 16 and 17 Years | 29 (100.0%) | 0 (0.0%) |
| 18 to 24 Years | 62 (78.5%) | 165 (90.2%) |
| 25 to 34 Years | 193 (100.0%) | 204 (94.9%) |
| 35 to 44 Years | 146 (90.1%) | 144 (100.0%) |
| 45 to 54 Years | 77 (79.4%) | 124 (100.0%) |
| 55 to 64 Years | 207 (99.5%) | 297 (95.8%) |
| 65 to 74 Years | 189 (95.5%) | 200 (81.3%) |
| 75 Years and over | 198 (100.0%) | 225 (77.6%) |
| Total | 1,445 (95.8%) | 1,516 (85.8%) |
Income Below Poverty Among Married-Couple Families in South Jacksonville
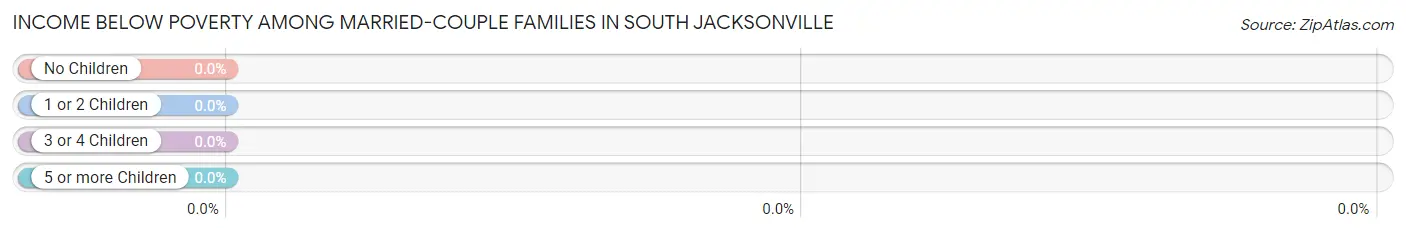
| Children | Above Poverty | Below Poverty |
| No Children | 484 (100.0%) | 0 (0.0%) |
| 1 or 2 Children | 75 (100.0%) | 0 (0.0%) |
| 3 or 4 Children | 35 (100.0%) | 0 (0.0%) |
| 5 or more Children | 0 (0.0%) | 0 (0.0%) |
| Total | 594 (100.0%) | 0 (0.0%) |
Income Below Poverty Among Single-Parent Households in South Jacksonville
According to the poverty data in South Jacksonville, 47.1% or 16 single-father households and 12.6% or 31 single-mother households are living below the poverty line. Among single-father households, those with 3 or 4 children have the highest poverty rate, with 16 households (100.0%) experiencing poverty. Likewise, among single-mother households, those with no children have the highest poverty rate, with 13 households (16.5%) falling below the poverty line.
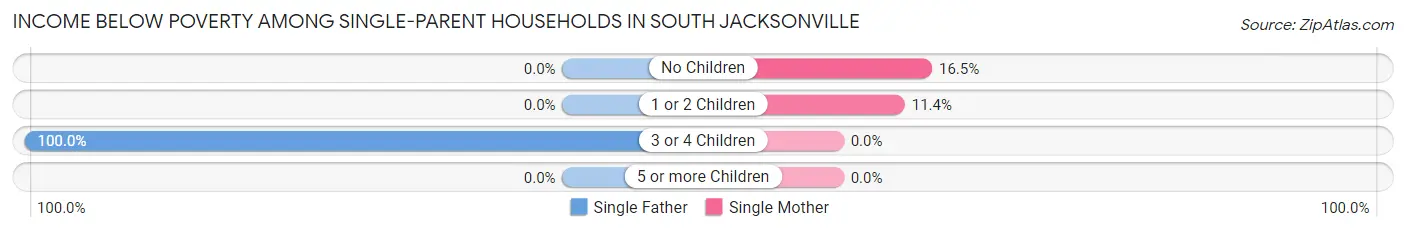
| Children | Single Father | Single Mother |
| No Children | 0 (0.0%) | 13 (16.5%) |
| 1 or 2 Children | 0 (0.0%) | 18 (11.4%) |
| 3 or 4 Children | 16 (100.0%) | 0 (0.0%) |
| 5 or more Children | 0 (0.0%) | 0 (0.0%) |
| Total | 16 (47.1%) | 31 (12.6%) |
Income Below Poverty Among Married-Couple vs Single-Parent Households in South Jacksonville
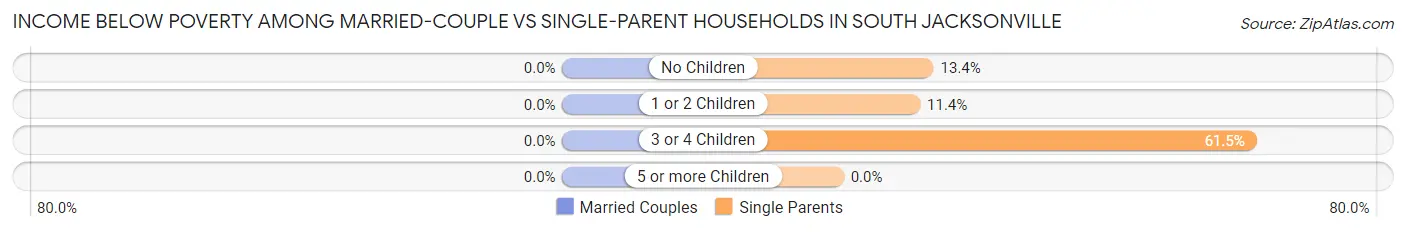
| Children | Married-Couple Families | Single-Parent Households |
| No Children | 0 (0.0%) | 13 (13.4%) |
| 1 or 2 Children | 0 (0.0%) | 18 (11.4%) |
| 3 or 4 Children | 0 (0.0%) | 16 (61.5%) |
| 5 or more Children | 0 (0.0%) | 0 (0.0%) |
| Total | 0 (0.0%) | 47 (16.7%) |
Race in South Jacksonville
The most populous races in South Jacksonville are White / Caucasian (3,018 | 91.8%), Black / African American (116 | 3.5%), and Two or more Races (110 | 3.4%).
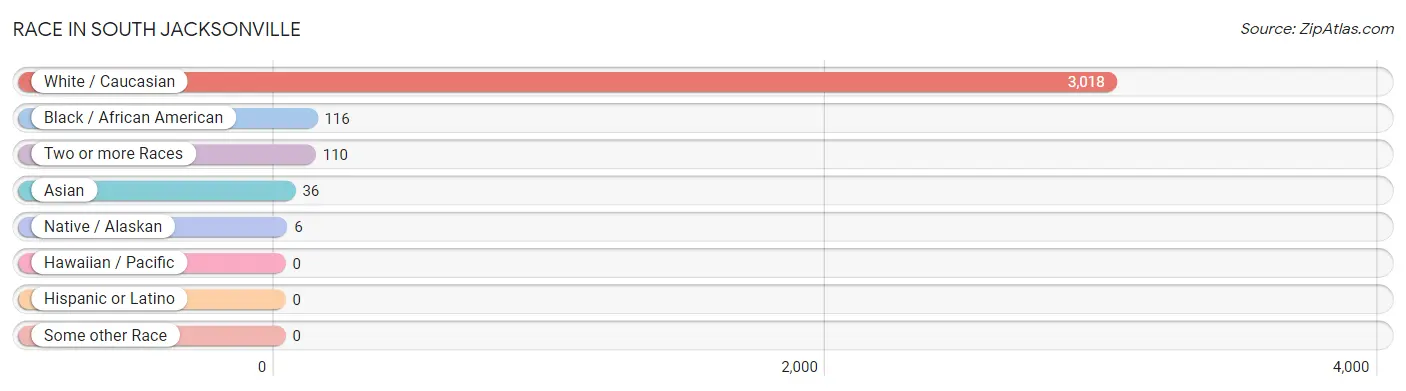
| Race | # Population | % Population |
| Asian | 36 | 1.1% |
| Black / African American | 116 | 3.5% |
| Hawaiian / Pacific | 0 | 0.0% |
| Hispanic or Latino | 0 | 0.0% |
| Native / Alaskan | 6 | 0.2% |
| White / Caucasian | 3,018 | 91.8% |
| Two or more Races | 110 | 3.4% |
| Some other Race | 0 | 0.0% |
| Total | 3,286 | 100.0% |
Ancestry in South Jacksonville
The most populous ancestries reported in South Jacksonville are German (655 | 19.9%), American (635 | 19.3%), Irish (632 | 19.2%), English (504 | 15.3%), and Italian (121 | 3.7%), together accounting for 77.5% of all South Jacksonville residents.
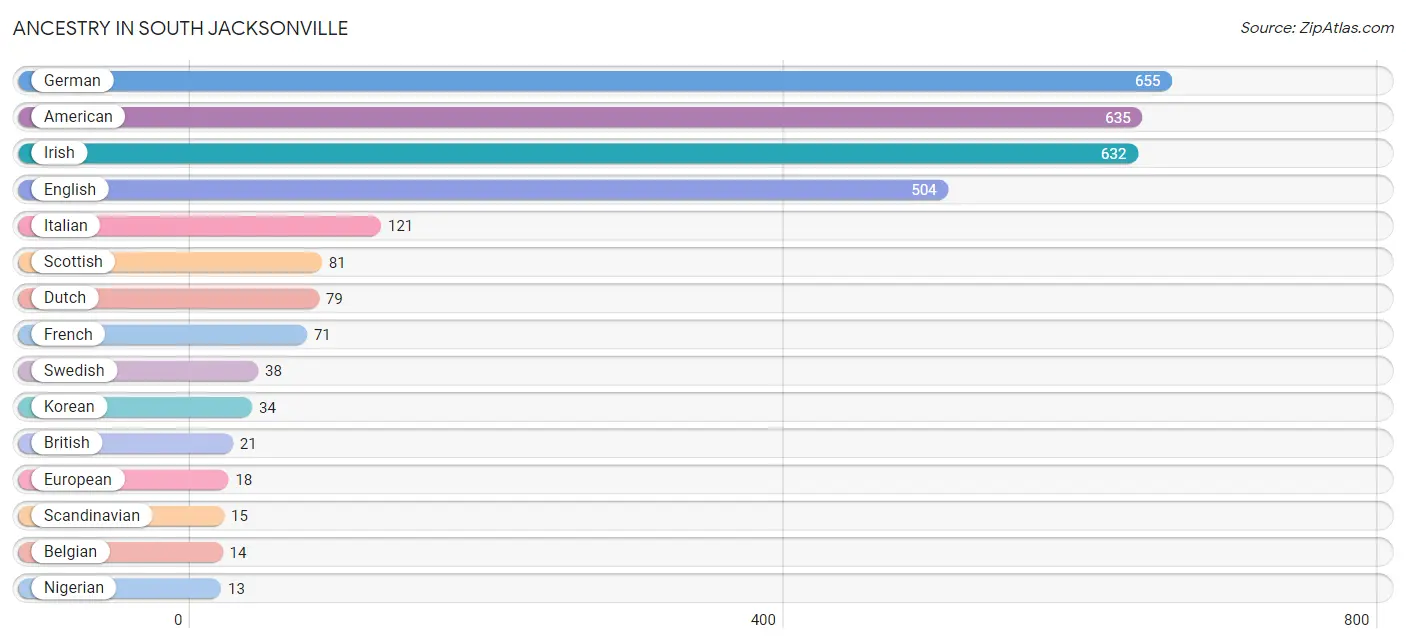
| Ancestry | # Population | % Population |
| American | 635 | 19.3% |
| Belgian | 14 | 0.4% |
| British | 21 | 0.6% |
| Cherokee | 6 | 0.2% |
| Danish | 6 | 0.2% |
| Dutch | 79 | 2.4% |
| English | 504 | 15.3% |
| European | 18 | 0.5% |
| French | 71 | 2.2% |
| German | 655 | 19.9% |
| Indian (Asian) | 4 | 0.1% |
| Irish | 632 | 19.2% |
| Italian | 121 | 3.7% |
| Korean | 34 | 1.0% |
| Nigerian | 13 | 0.4% |
| Polish | 12 | 0.4% |
| Russian | 11 | 0.3% |
| Scandinavian | 15 | 0.5% |
| Scotch-Irish | 13 | 0.4% |
| Scottish | 81 | 2.5% |
| Sioux | 1 | 0.0% |
| Subsaharan African | 13 | 0.4% |
| Swedish | 38 | 1.2% |
| Swiss | 4 | 0.1% |
| Welsh | 11 | 0.3% | View All 25 Rows |
Immigrants in South Jacksonville
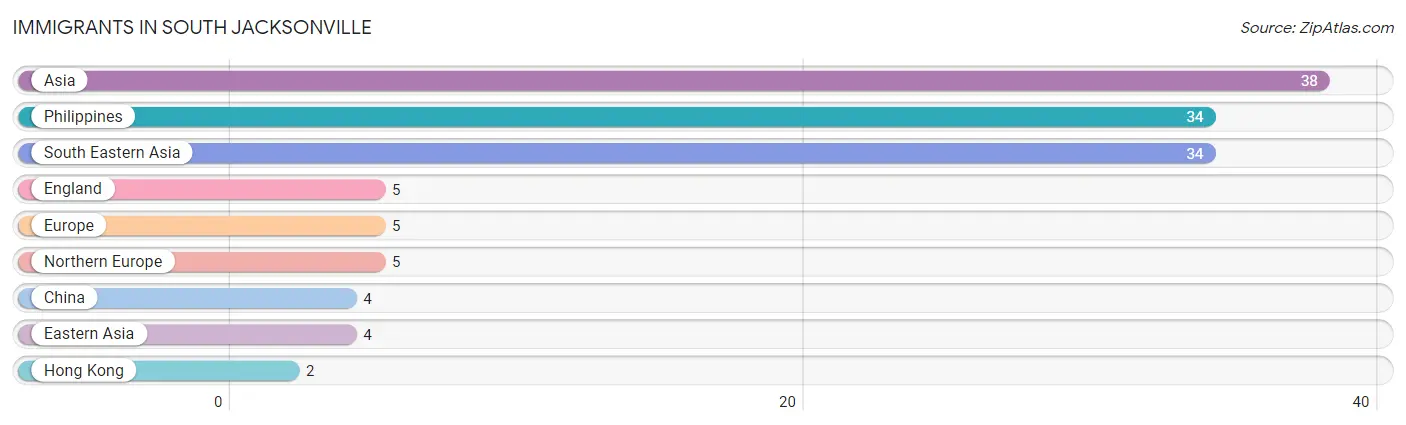
The most numerous immigrant groups reported in South Jacksonville came from Asia (38 | 1.2%), Philippines (34 | 1.0%), South Eastern Asia (34 | 1.0%), England (5 | 0.2%), and Europe (5 | 0.2%), together accounting for 3.5% of all South Jacksonville residents.
| Immigration Origin | # Population | % Population |
| Asia | 38 | 1.2% |
| China | 4 | 0.1% |
| Eastern Asia | 4 | 0.1% |
| England | 5 | 0.2% |
| Europe | 5 | 0.2% |
| Hong Kong | 2 | 0.1% |
| Northern Europe | 5 | 0.2% |
| Philippines | 34 | 1.0% |
| South Eastern Asia | 34 | 1.0% | View All 9 Rows |
Sex and Age in South Jacksonville
Sex and Age in South Jacksonville
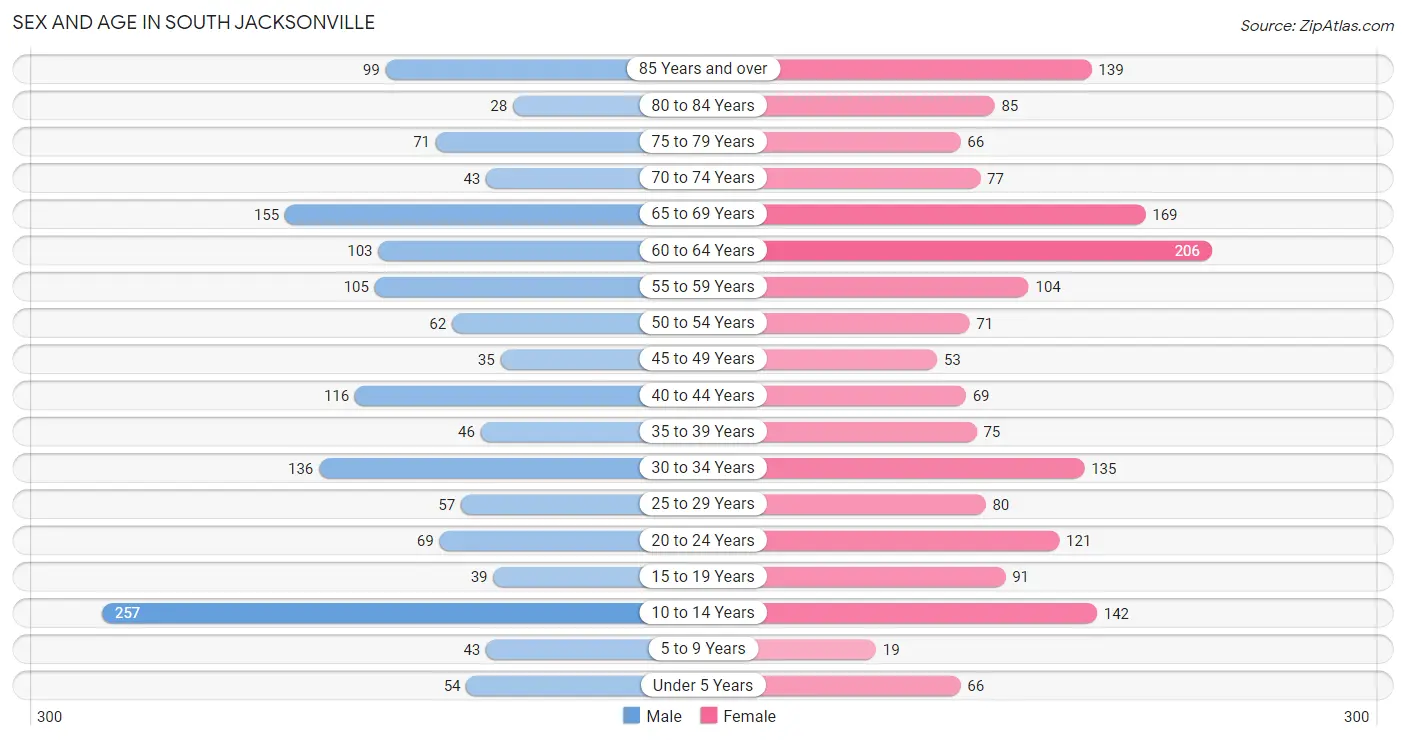
The most populous age groups in South Jacksonville are 10 to 14 Years (257 | 16.9%) for men and 60 to 64 Years (206 | 11.7%) for women.
| Age Bracket | Male | Female |
| Under 5 Years | 54 (3.6%) | 66 (3.7%) |
| 5 to 9 Years | 43 (2.8%) | 19 (1.1%) |
| 10 to 14 Years | 257 (16.9%) | 142 (8.0%) |
| 15 to 19 Years | 39 (2.6%) | 91 (5.1%) |
| 20 to 24 Years | 69 (4.5%) | 121 (6.8%) |
| 25 to 29 Years | 57 (3.7%) | 80 (4.5%) |
| 30 to 34 Years | 136 (9.0%) | 135 (7.6%) |
| 35 to 39 Years | 46 (3.0%) | 75 (4.2%) |
| 40 to 44 Years | 116 (7.6%) | 69 (3.9%) |
| 45 to 49 Years | 35 (2.3%) | 53 (3.0%) |
| 50 to 54 Years | 62 (4.1%) | 71 (4.0%) |
| 55 to 59 Years | 105 (6.9%) | 104 (5.9%) |
| 60 to 64 Years | 103 (6.8%) | 206 (11.7%) |
| 65 to 69 Years | 155 (10.2%) | 169 (9.6%) |
| 70 to 74 Years | 43 (2.8%) | 77 (4.4%) |
| 75 to 79 Years | 71 (4.7%) | 66 (3.7%) |
| 80 to 84 Years | 28 (1.8%) | 85 (4.8%) |
| 85 Years and over | 99 (6.5%) | 139 (7.9%) |
| Total | 1,518 (100.0%) | 1,768 (100.0%) |
Families and Households in South Jacksonville
Median Family Size in South Jacksonville
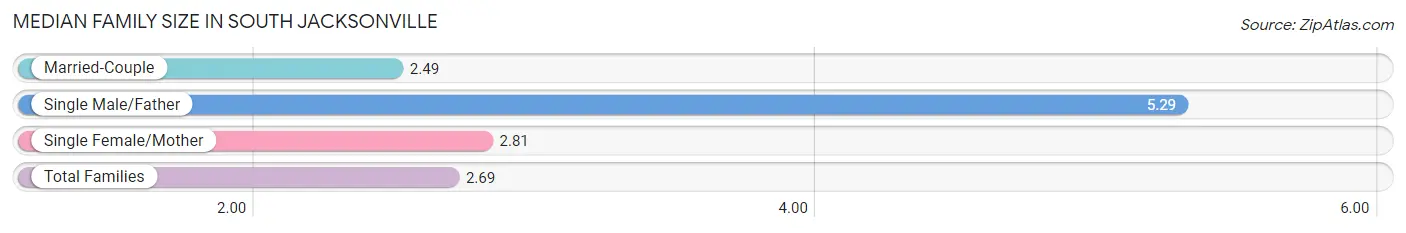
The median family size in South Jacksonville is 2.69 persons per family, with single male/father families (34 | 3.9%) accounting for the largest median family size of 5.29 persons per family. On the other hand, married-couple families (594 | 67.9%) represent the smallest median family size with 2.49 persons per family.
| Family Type | # Families | Family Size |
| Married-Couple | 594 (67.9%) | 2.49 |
| Single Male/Father | 34 (3.9%) | 5.29 |
| Single Female/Mother | 247 (28.2%) | 2.81 |
| Total Families | 875 (100.0%) | 2.69 |
Median Household Size in South Jacksonville
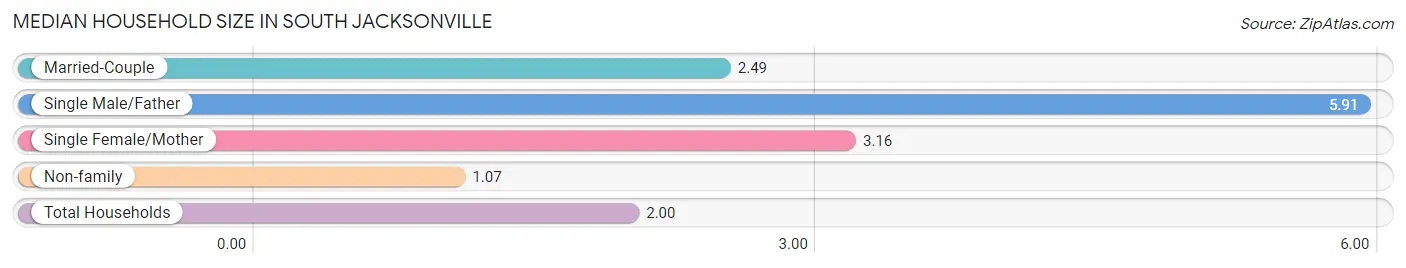
The median household size in South Jacksonville is 2.00 persons per household, with single male/father households (34 | 2.1%) accounting for the largest median household size of 5.91 persons per household. non-family households (770 | 46.8%) represent the smallest median household size with 1.07 persons per household.
| Household Type | # Households | Household Size |
| Married-Couple | 594 (36.1%) | 2.49 |
| Single Male/Father | 34 (2.1%) | 5.91 |
| Single Female/Mother | 247 (15.0%) | 3.16 |
| Non-family | 770 (46.8%) | 1.07 |
| Total Households | 1,645 (100.0%) | 2.00 |
Household Size by Marriage Status in South Jacksonville
Out of a total of 1,645 households in South Jacksonville, 875 (53.2%) are family households, while 770 (46.8%) are nonfamily households. The most numerous type of family households are 2-person households, comprising 579, and the most common type of nonfamily households are 1-person households, comprising 724.
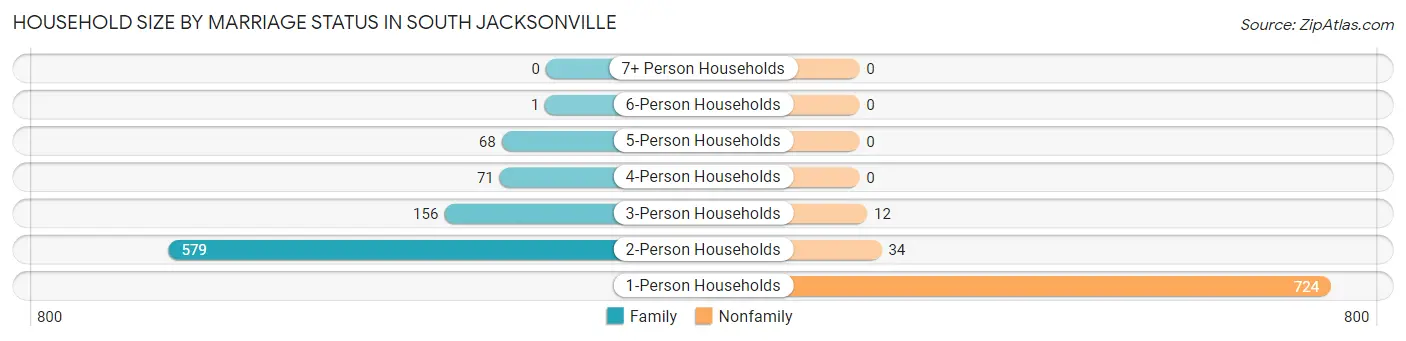
| Household Size | Family Households | Nonfamily Households |
| 1-Person Households | - | 724 (44.0%) |
| 2-Person Households | 579 (35.2%) | 34 (2.1%) |
| 3-Person Households | 156 (9.5%) | 12 (0.7%) |
| 4-Person Households | 71 (4.3%) | 0 (0.0%) |
| 5-Person Households | 68 (4.1%) | 0 (0.0%) |
| 6-Person Households | 1 (0.1%) | 0 (0.0%) |
| 7+ Person Households | 0 (0.0%) | 0 (0.0%) |
| Total | 875 (53.2%) | 770 (46.8%) |
Female Fertility in South Jacksonville
Fertility by Age in South Jacksonville
Average fertility rate in South Jacksonville is 18.0 births per 1,000 women. Women in the age bracket of 20 to 34 years have the highest fertility rate with 33.0 births per 1,000 women. Women in the age bracket of 20 to 34 years acount for 100.0% of all women with births.
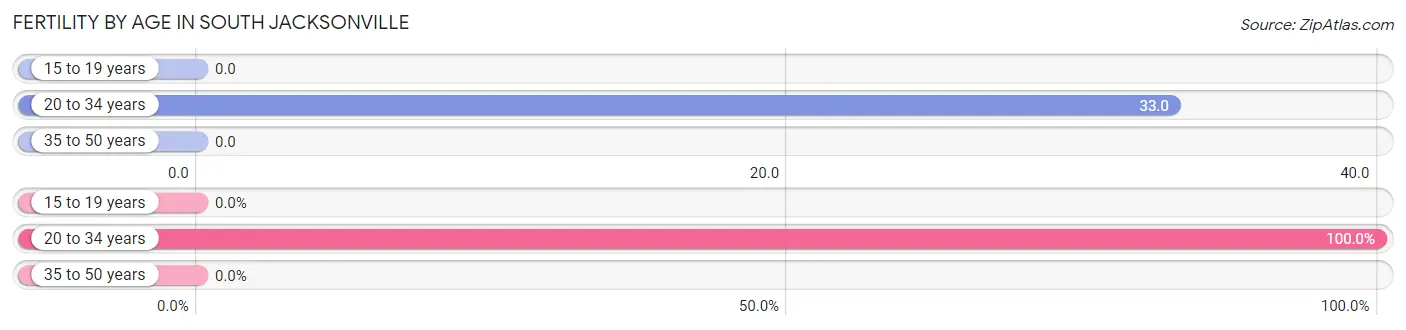
| Age Bracket | Women with Births | Births / 1,000 Women |
| 15 to 19 years | 0 (0.0%) | 0.0 |
| 20 to 34 years | 11 (100.0%) | 33.0 |
| 35 to 50 years | 0 (0.0%) | 0.0 |
| Total | 11 (100.0%) | 18.0 |
Fertility by Age by Marriage Status in South Jacksonville
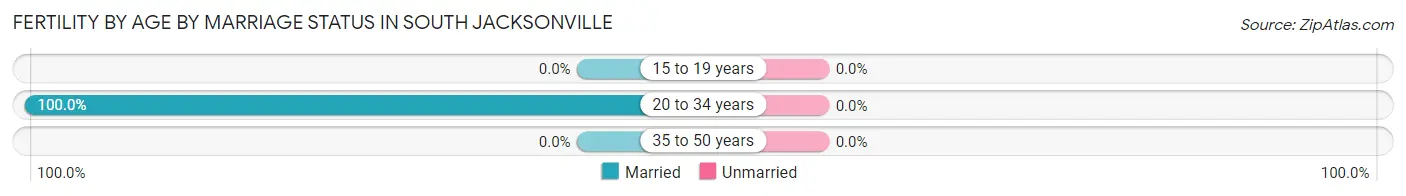
| Age Bracket | Married | Unmarried |
| 15 to 19 years | 0 (0.0%) | 0 (0.0%) |
| 20 to 34 years | 11 (100.0%) | 0 (0.0%) |
| 35 to 50 years | 0 (0.0%) | 0 (0.0%) |
| Total | 11 (100.0%) | 0 (0.0%) |
Fertility by Education in South Jacksonville
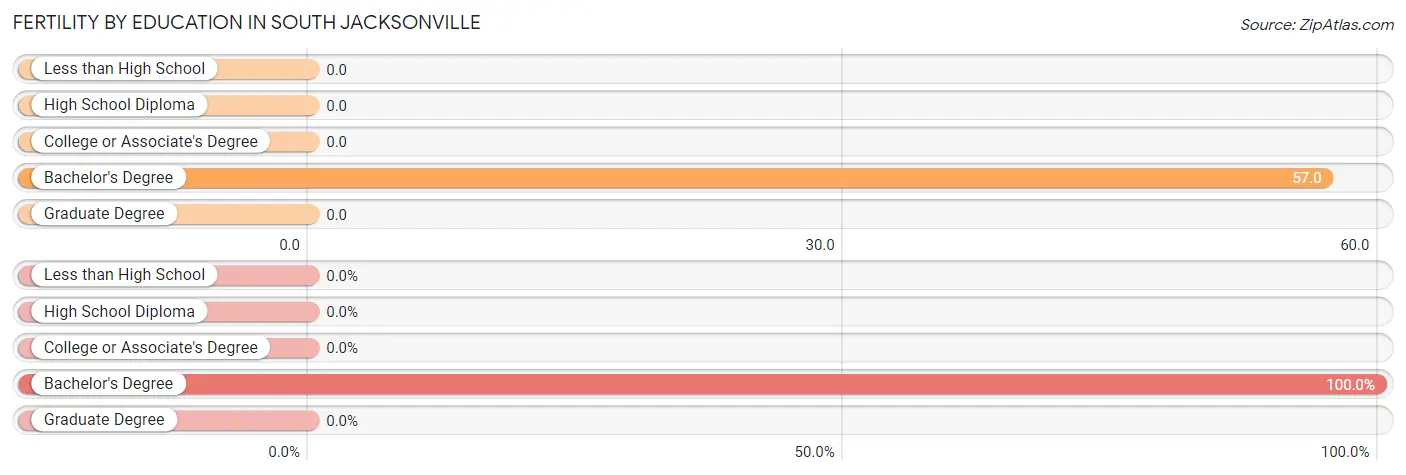
| Educational Attainment | Women with Births | Births / 1,000 Women |
| Less than High School | 0 (0.0%) | 0.0 |
| High School Diploma | 0 (0.0%) | 0.0 |
| College or Associate's Degree | 0 (0.0%) | 0.0 |
| Bachelor's Degree | 11 (100.0%) | 57.0 |
| Graduate Degree | 0 (0.0%) | 0.0 |
| Total | 11 (100.0%) | 18.0 |
Fertility by Education by Marriage Status in South Jacksonville
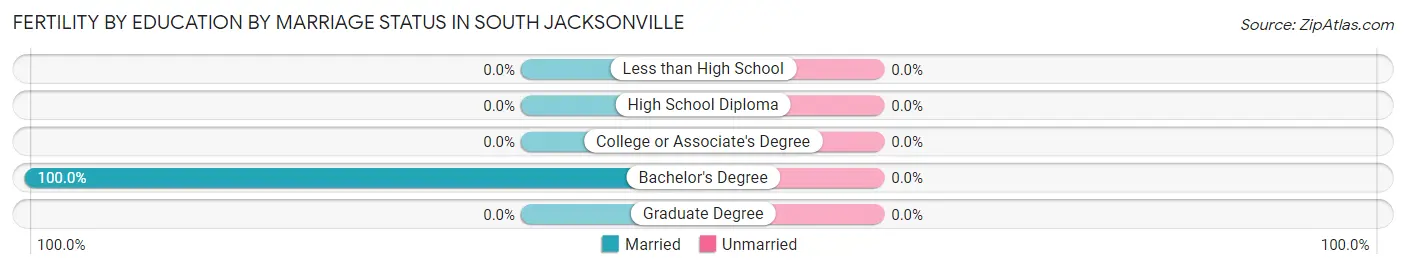
| Educational Attainment | Married | Unmarried |
| Less than High School | 0 (0.0%) | 0 (0.0%) |
| High School Diploma | 0 (0.0%) | 0 (0.0%) |
| College or Associate's Degree | 0 (0.0%) | 0 (0.0%) |
| Bachelor's Degree | 11 (100.0%) | 0 (0.0%) |
| Graduate Degree | 0 (0.0%) | 0 (0.0%) |
| Total | 11 (100.0%) | 0 (0.0%) |
Employment Characteristics in South Jacksonville
Employment by Class of Employer in South Jacksonville
Among the 1,325 employed individuals in South Jacksonville, private company employees (854 | 64.4%), local government employees (185 | 14.0%), and not-for-profit organizations (161 | 12.1%) make up the most common classes of employment.
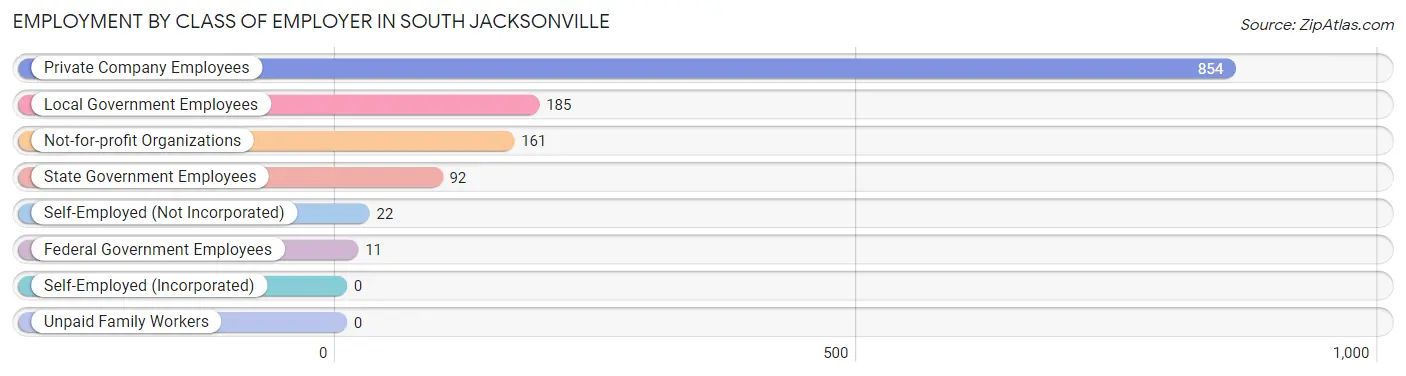
| Employer Class | # Employees | % Employees |
| Private Company Employees | 854 | 64.4% |
| Self-Employed (Incorporated) | 0 | 0.0% |
| Self-Employed (Not Incorporated) | 22 | 1.7% |
| Not-for-profit Organizations | 161 | 12.1% |
| Local Government Employees | 185 | 14.0% |
| State Government Employees | 92 | 6.9% |
| Federal Government Employees | 11 | 0.8% |
| Unpaid Family Workers | 0 | 0.0% |
| Total | 1,325 | 100.0% |
Employment Status by Age in South Jacksonville
According to the labor force statistics for South Jacksonville, out of the total population over 16 years of age (2,676), 55.2% or 1,477 individuals are in the labor force, with 10.4% or 154 of them unemployed. The age group with the highest labor force participation rate is 30 to 34 years, with 93.0% or 252 individuals in the labor force. Within the labor force, the 20 to 24 years age range has the highest percentage of unemployed individuals, with 42.2% or 65 of them being unemployed.
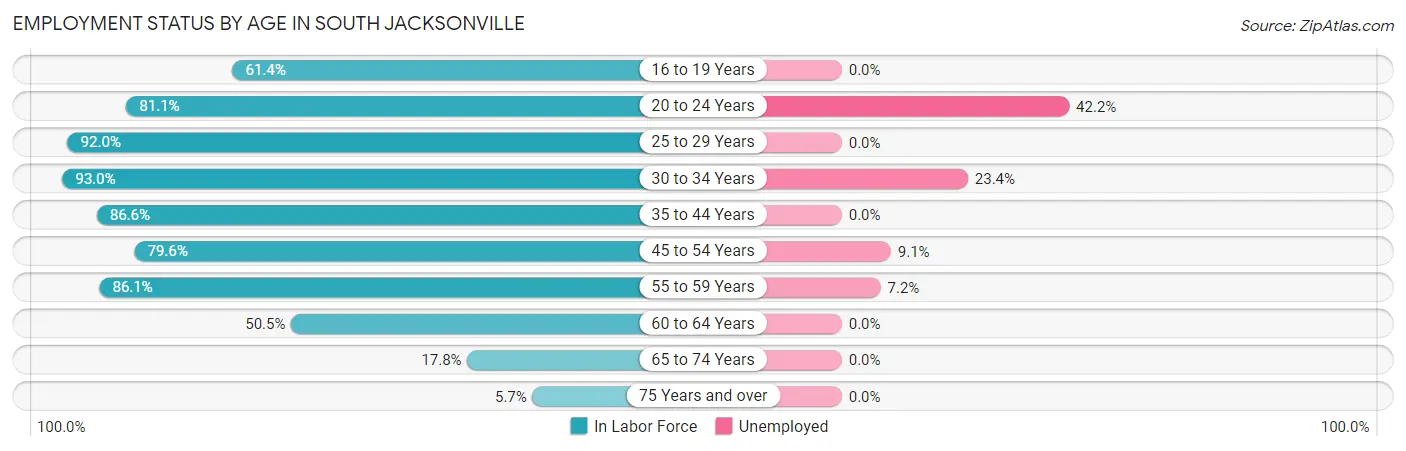
| Age Bracket | In Labor Force | Unemployed |
| 16 to 19 Years | 62 (61.4%) | 0 (0.0%) |
| 20 to 24 Years | 154 (81.1%) | 65 (42.2%) |
| 25 to 29 Years | 126 (92.0%) | 0 (0.0%) |
| 30 to 34 Years | 252 (93.0%) | 59 (23.4%) |
| 35 to 44 Years | 265 (86.6%) | 0 (0.0%) |
| 45 to 54 Years | 176 (79.6%) | 16 (9.1%) |
| 55 to 59 Years | 180 (86.1%) | 13 (7.2%) |
| 60 to 64 Years | 156 (50.5%) | 0 (0.0%) |
| 65 to 74 Years | 79 (17.8%) | 0 (0.0%) |
| 75 Years and over | 28 (5.7%) | 0 (0.0%) |
| Total | 1,477 (55.2%) | 154 (10.4%) |
Employment Status by Educational Attainment in South Jacksonville
According to labor force statistics for South Jacksonville, 79.5% of individuals (1,155) out of the total population between 25 and 64 years of age (1,453) are in the labor force, with 7.7% or 89 of them being unemployed. The group with the highest labor force participation rate are those with the educational attainment of college / associate degree, with 86.8% or 356 individuals in the labor force. Within the labor force, individuals with high school diploma education have the highest percentage of unemployment, with 14.3% or 59 of them being unemployed.
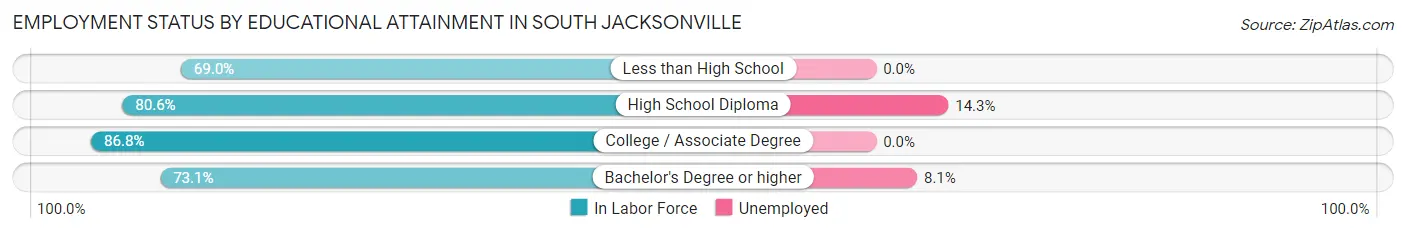
| Educational Attainment | In Labor Force | Unemployed |
| Less than High School | 29 (69.0%) | 0 (0.0%) |
| High School Diploma | 412 (80.6%) | 73 (14.3%) |
| College / Associate Degree | 356 (86.8%) | 0 (0.0%) |
| Bachelor's Degree or higher | 358 (73.1%) | 40 (8.1%) |
| Total | 1,155 (79.5%) | 112 (7.7%) |
Employment Occupations by Sex in South Jacksonville
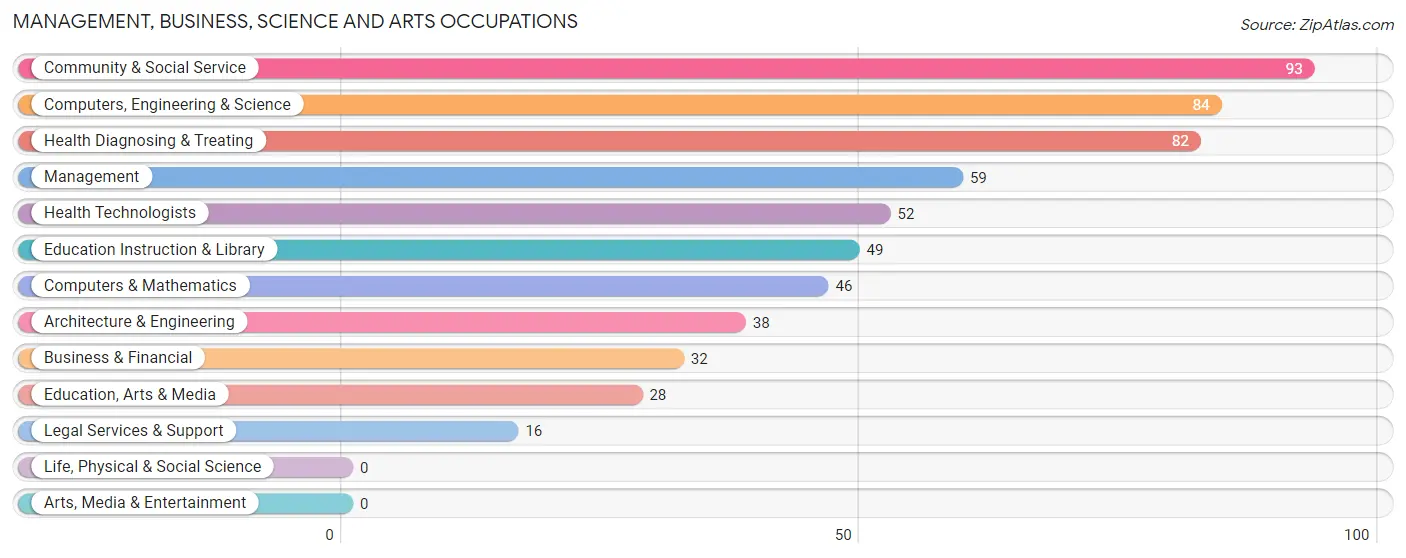
Management, Business, Science and Arts Occupations
The most common Management, Business, Science and Arts occupations in South Jacksonville are Community & Social Service (93 | 7.1%), Computers, Engineering & Science (84 | 6.4%), Health Diagnosing & Treating (82 | 6.2%), Management (59 | 4.5%), and Health Technologists (52 | 4.0%).
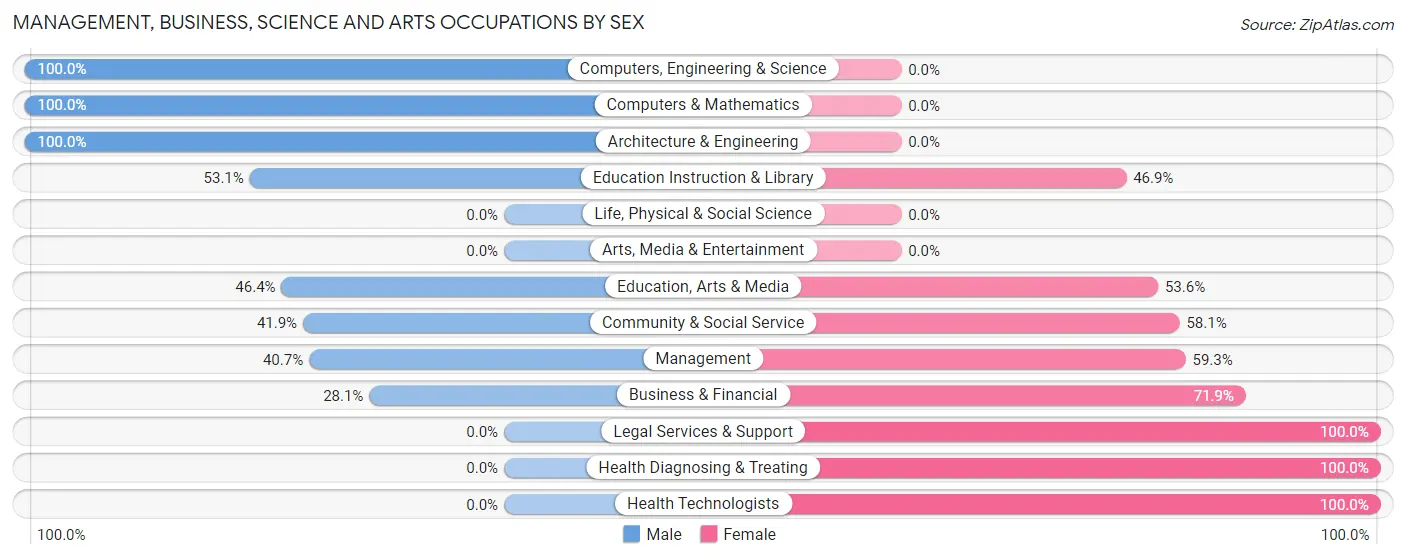
Management, Business, Science and Arts Occupations by Sex
Within the Management, Business, Science and Arts occupations in South Jacksonville, the most male-oriented occupations are Computers, Engineering & Science (100.0%), Computers & Mathematics (100.0%), and Architecture & Engineering (100.0%), while the most female-oriented occupations are Legal Services & Support (100.0%), Health Diagnosing & Treating (100.0%), and Health Technologists (100.0%).
| Occupation | Male | Female |
| Management | 24 (40.7%) | 35 (59.3%) |
| Business & Financial | 9 (28.1%) | 23 (71.9%) |
| Computers, Engineering & Science | 84 (100.0%) | 0 (0.0%) |
| Computers & Mathematics | 46 (100.0%) | 0 (0.0%) |
| Architecture & Engineering | 38 (100.0%) | 0 (0.0%) |
| Life, Physical & Social Science | 0 (0.0%) | 0 (0.0%) |
| Community & Social Service | 39 (41.9%) | 54 (58.1%) |
| Education, Arts & Media | 13 (46.4%) | 15 (53.6%) |
| Legal Services & Support | 0 (0.0%) | 16 (100.0%) |
| Education Instruction & Library | 26 (53.1%) | 23 (46.9%) |
| Arts, Media & Entertainment | 0 (0.0%) | 0 (0.0%) |
| Health Diagnosing & Treating | 0 (0.0%) | 82 (100.0%) |
| Health Technologists | 0 (0.0%) | 52 (100.0%) |
| Total (Category) | 156 (44.6%) | 194 (55.4%) |
| Total (Overall) | 643 (48.9%) | 671 (51.1%) |
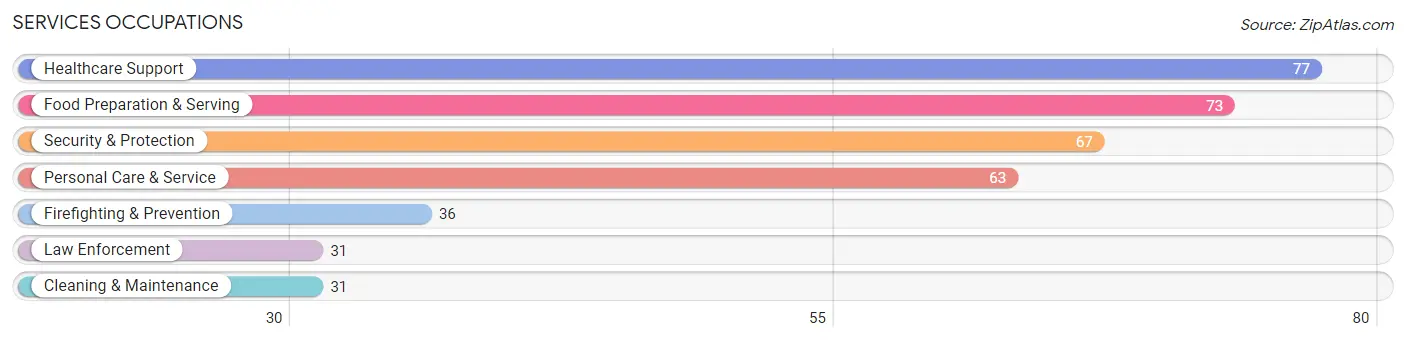
Services Occupations
The most common Services occupations in South Jacksonville are Healthcare Support (77 | 5.9%), Food Preparation & Serving (73 | 5.6%), Security & Protection (67 | 5.1%), Personal Care & Service (63 | 4.8%), and Firefighting & Prevention (36 | 2.7%).
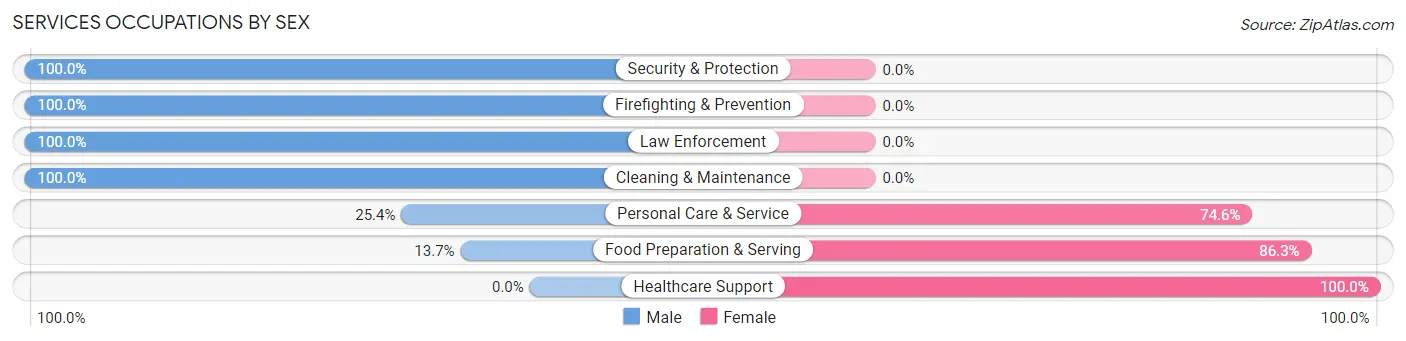
Services Occupations by Sex
Within the Services occupations in South Jacksonville, the most male-oriented occupations are Security & Protection (100.0%), Firefighting & Prevention (100.0%), and Law Enforcement (100.0%), while the most female-oriented occupations are Healthcare Support (100.0%), Food Preparation & Serving (86.3%), and Personal Care & Service (74.6%).
| Occupation | Male | Female |
| Healthcare Support | 0 (0.0%) | 77 (100.0%) |
| Security & Protection | 67 (100.0%) | 0 (0.0%) |
| Firefighting & Prevention | 36 (100.0%) | 0 (0.0%) |
| Law Enforcement | 31 (100.0%) | 0 (0.0%) |
| Food Preparation & Serving | 10 (13.7%) | 63 (86.3%) |
| Cleaning & Maintenance | 31 (100.0%) | 0 (0.0%) |
| Personal Care & Service | 16 (25.4%) | 47 (74.6%) |
| Total (Category) | 124 (39.9%) | 187 (60.1%) |
| Total (Overall) | 643 (48.9%) | 671 (51.1%) |
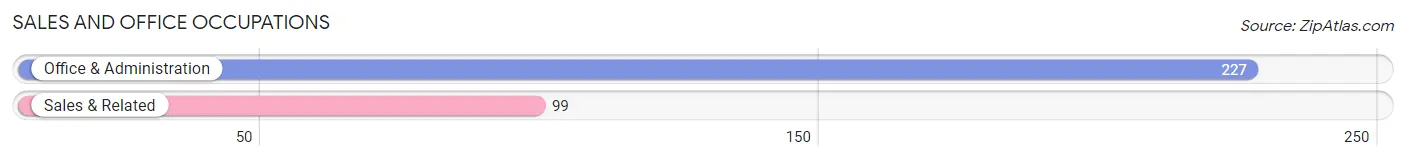
Sales and Office Occupations
The most common Sales and Office occupations in South Jacksonville are Office & Administration (227 | 17.3%), and Sales & Related (99 | 7.5%).
Sales and Office Occupations by Sex
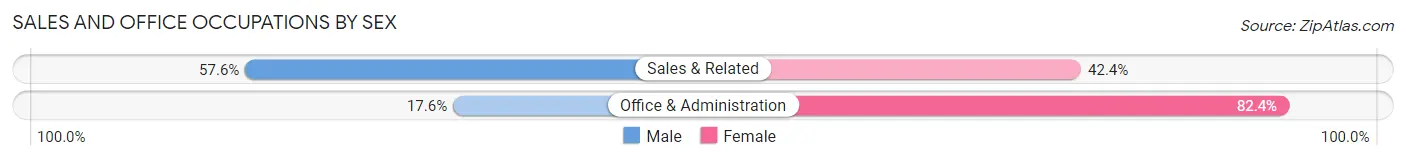
| Occupation | Male | Female |
| Sales & Related | 57 (57.6%) | 42 (42.4%) |
| Office & Administration | 40 (17.6%) | 187 (82.4%) |
| Total (Category) | 97 (29.7%) | 229 (70.3%) |
| Total (Overall) | 643 (48.9%) | 671 (51.1%) |
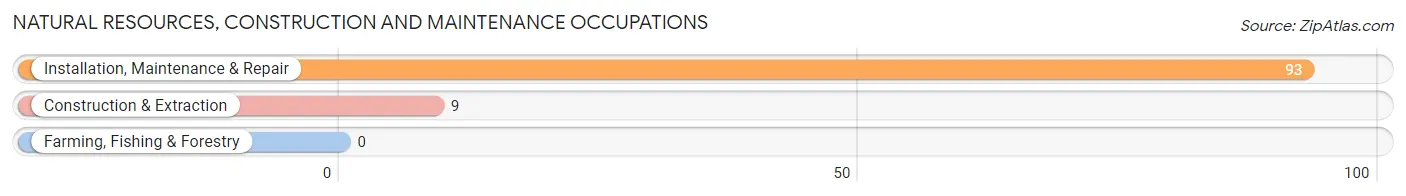
Natural Resources, Construction and Maintenance Occupations
The most common Natural Resources, Construction and Maintenance occupations in South Jacksonville are Installation, Maintenance & Repair (93 | 7.1%), and Construction & Extraction (9 | 0.7%).
Natural Resources, Construction and Maintenance Occupations by Sex
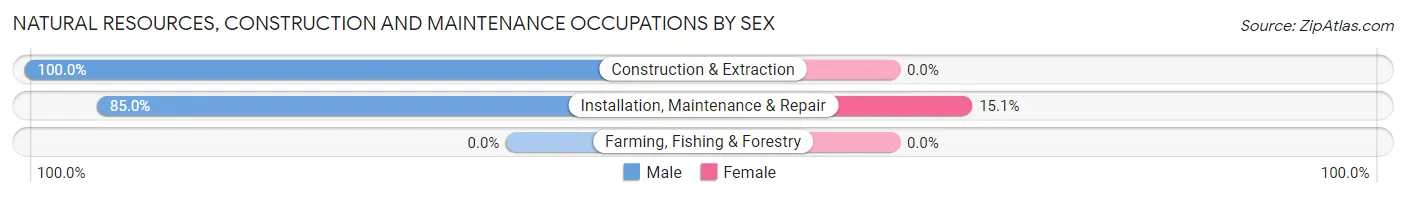
| Occupation | Male | Female |
| Farming, Fishing & Forestry | 0 (0.0%) | 0 (0.0%) |
| Construction & Extraction | 9 (100.0%) | 0 (0.0%) |
| Installation, Maintenance & Repair | 79 (85.0%) | 14 (15.0%) |
| Total (Category) | 88 (86.3%) | 14 (13.7%) |
| Total (Overall) | 643 (48.9%) | 671 (51.1%) |
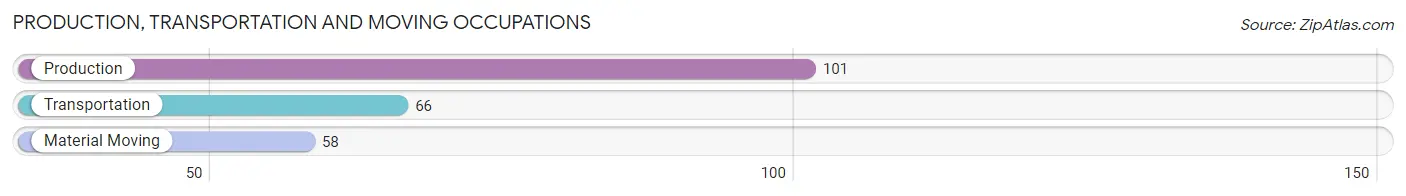
Production, Transportation and Moving Occupations
The most common Production, Transportation and Moving occupations in South Jacksonville are Production (101 | 7.7%), Transportation (66 | 5.0%), and Material Moving (58 | 4.4%).
Production, Transportation and Moving Occupations by Sex
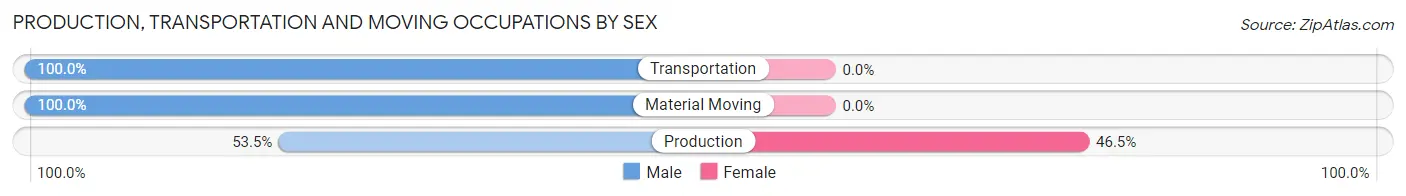
| Occupation | Male | Female |
| Production | 54 (53.5%) | 47 (46.5%) |
| Transportation | 66 (100.0%) | 0 (0.0%) |
| Material Moving | 58 (100.0%) | 0 (0.0%) |
| Total (Category) | 178 (79.1%) | 47 (20.9%) |
| Total (Overall) | 643 (48.9%) | 671 (51.1%) |
Employment Industries by Sex in South Jacksonville
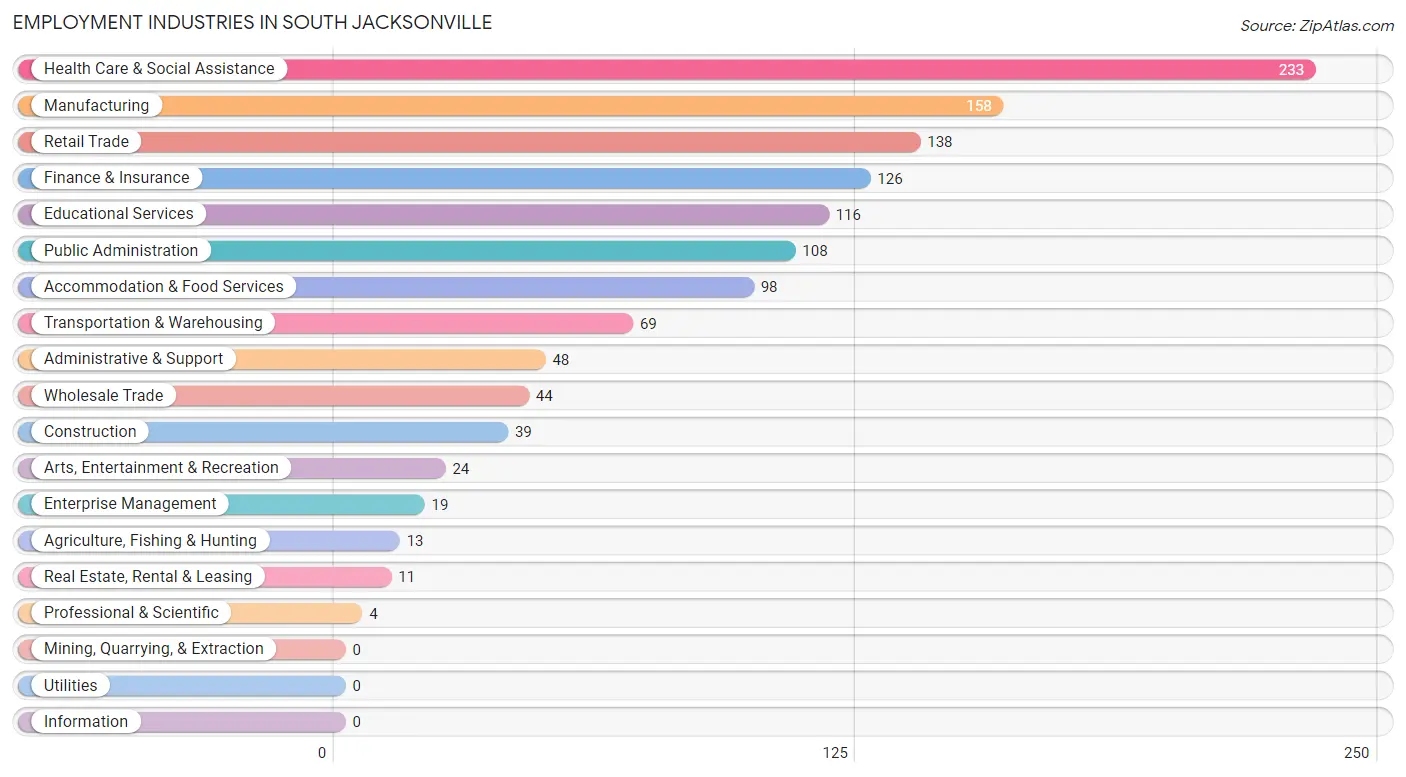
Employment Industries in South Jacksonville
The major employment industries in South Jacksonville include Health Care & Social Assistance (233 | 17.7%), Manufacturing (158 | 12.0%), Retail Trade (138 | 10.5%), Finance & Insurance (126 | 9.6%), and Educational Services (116 | 8.8%).
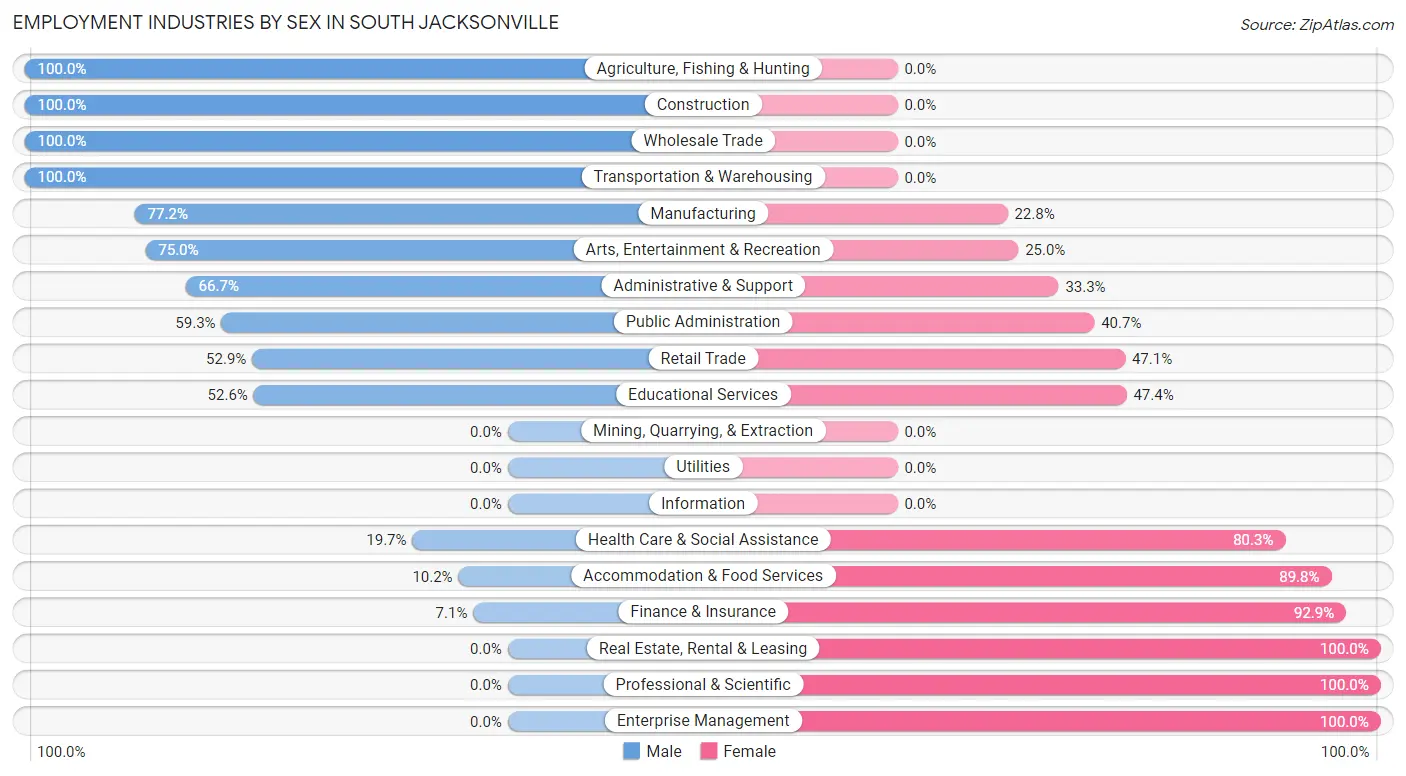
Employment Industries by Sex in South Jacksonville
The South Jacksonville industries that see more men than women are Agriculture, Fishing & Hunting (100.0%), Construction (100.0%), and Wholesale Trade (100.0%), whereas the industries that tend to have a higher number of women are Real Estate, Rental & Leasing (100.0%), Professional & Scientific (100.0%), and Enterprise Management (100.0%).
| Industry | Male | Female |
| Agriculture, Fishing & Hunting | 13 (100.0%) | 0 (0.0%) |
| Mining, Quarrying, & Extraction | 0 (0.0%) | 0 (0.0%) |
| Construction | 39 (100.0%) | 0 (0.0%) |
| Manufacturing | 122 (77.2%) | 36 (22.8%) |
| Wholesale Trade | 44 (100.0%) | 0 (0.0%) |
| Retail Trade | 73 (52.9%) | 65 (47.1%) |
| Transportation & Warehousing | 69 (100.0%) | 0 (0.0%) |
| Utilities | 0 (0.0%) | 0 (0.0%) |
| Information | 0 (0.0%) | 0 (0.0%) |
| Finance & Insurance | 9 (7.1%) | 117 (92.9%) |
| Real Estate, Rental & Leasing | 0 (0.0%) | 11 (100.0%) |
| Professional & Scientific | 0 (0.0%) | 4 (100.0%) |
| Enterprise Management | 0 (0.0%) | 19 (100.0%) |
| Administrative & Support | 32 (66.7%) | 16 (33.3%) |
| Educational Services | 61 (52.6%) | 55 (47.4%) |
| Health Care & Social Assistance | 46 (19.7%) | 187 (80.3%) |
| Arts, Entertainment & Recreation | 18 (75.0%) | 6 (25.0%) |
| Accommodation & Food Services | 10 (10.2%) | 88 (89.8%) |
| Public Administration | 64 (59.3%) | 44 (40.7%) |
| Total | 643 (48.9%) | 671 (51.1%) |
Education in South Jacksonville
School Enrollment in South Jacksonville
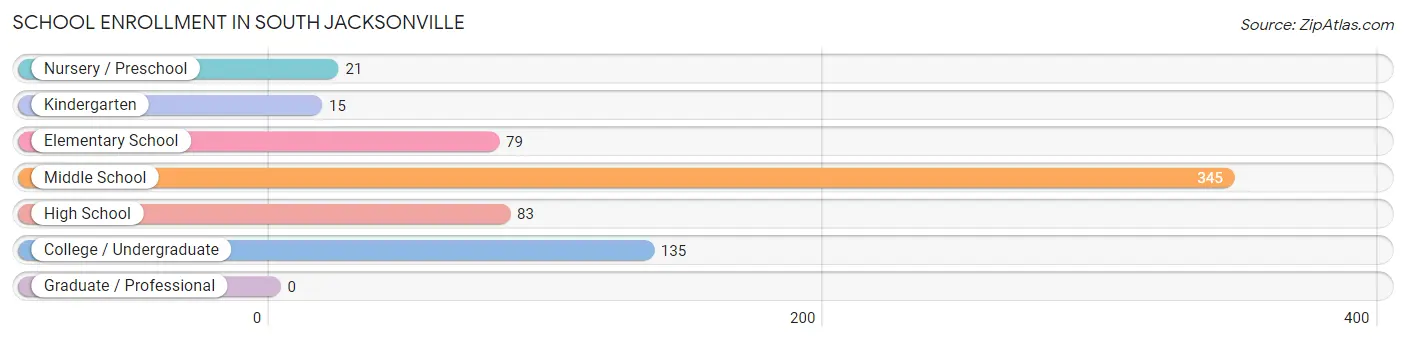
The most common levels of schooling among the 678 students in South Jacksonville are middle school (345 | 50.9%), college / undergraduate (135 | 19.9%), and high school (83 | 12.2%).
| School Level | # Students | % Students |
| Nursery / Preschool | 21 | 3.1% |
| Kindergarten | 15 | 2.2% |
| Elementary School | 79 | 11.7% |
| Middle School | 345 | 50.9% |
| High School | 83 | 12.2% |
| College / Undergraduate | 135 | 19.9% |
| Graduate / Professional | 0 | 0.0% |
| Total | 678 | 100.0% |
School Enrollment by Age by Funding Source in South Jacksonville
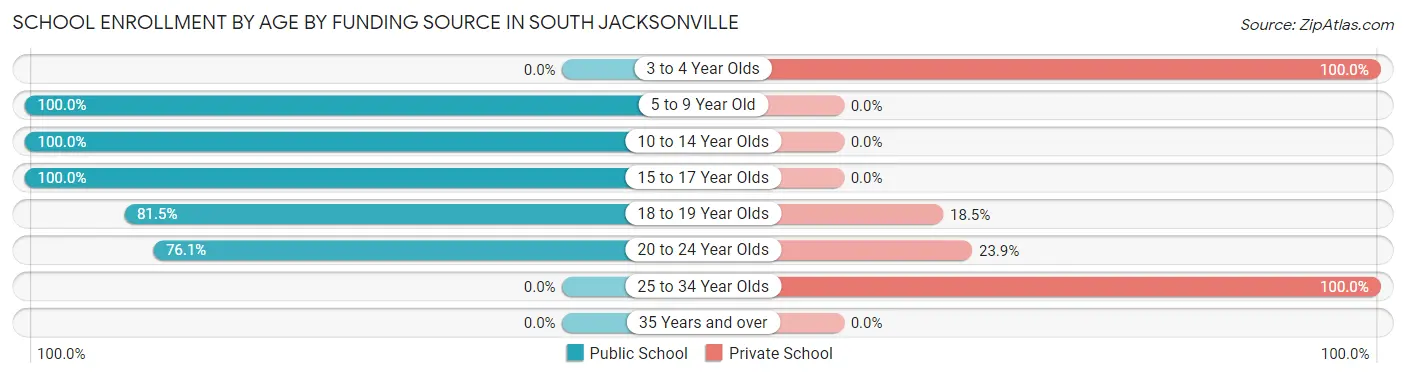
Out of a total of 678 students who are enrolled in schools in South Jacksonville, 66 (9.7%) attend a private institution, while the remaining 612 (90.3%) are enrolled in public schools. The age group of 3 to 4 year olds has the highest likelihood of being enrolled in private schools, with 21 (100.0% in the age bracket) enrolled. Conversely, the age group of 5 to 9 year old has the lowest likelihood of being enrolled in a private school, with 62 (100.0% in the age bracket) attending a public institution.
| Age Bracket | Public School | Private School |
| 3 to 4 Year Olds | 0 (0.0%) | 21 (100.0%) |
| 5 to 9 Year Old | 62 (100.0%) | 0 (0.0%) |
| 10 to 14 Year Olds | 378 (100.0%) | 0 (0.0%) |
| 15 to 17 Year Olds | 58 (100.0%) | 0 (0.0%) |
| 18 to 19 Year Olds | 44 (81.5%) | 10 (18.5%) |
| 20 to 24 Year Olds | 70 (76.1%) | 22 (23.9%) |
| 25 to 34 Year Olds | 0 (0.0%) | 13 (100.0%) |
| 35 Years and over | 0 (0.0%) | 0 (0.0%) |
| Total | 612 (90.3%) | 66 (9.7%) |
Educational Attainment by Field of Study in South Jacksonville
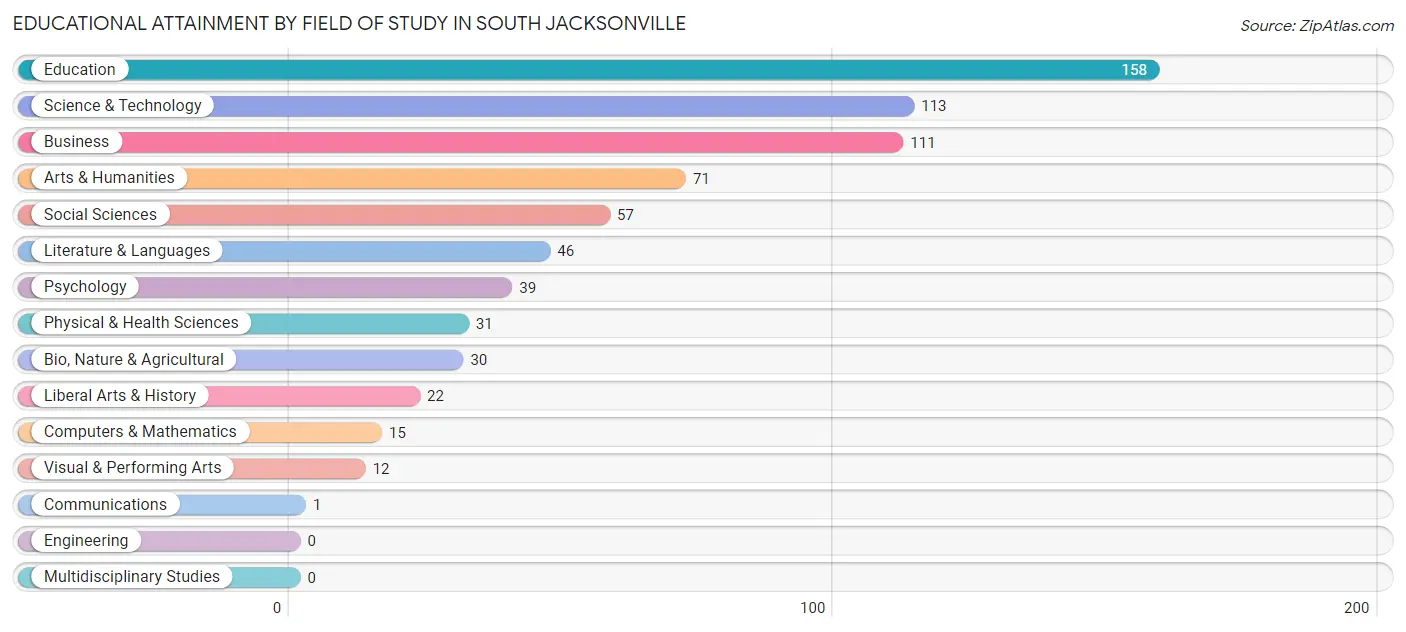
Education (158 | 22.4%), science & technology (113 | 16.0%), business (111 | 15.7%), arts & humanities (71 | 10.1%), and social sciences (57 | 8.1%) are the most common fields of study among 706 individuals in South Jacksonville who have obtained a bachelor's degree or higher.
| Field of Study | # Graduates | % Graduates |
| Computers & Mathematics | 15 | 2.1% |
| Bio, Nature & Agricultural | 30 | 4.3% |
| Physical & Health Sciences | 31 | 4.4% |
| Psychology | 39 | 5.5% |
| Social Sciences | 57 | 8.1% |
| Engineering | 0 | 0.0% |
| Multidisciplinary Studies | 0 | 0.0% |
| Science & Technology | 113 | 16.0% |
| Business | 111 | 15.7% |
| Education | 158 | 22.4% |
| Literature & Languages | 46 | 6.5% |
| Liberal Arts & History | 22 | 3.1% |
| Visual & Performing Arts | 12 | 1.7% |
| Communications | 1 | 0.1% |
| Arts & Humanities | 71 | 10.1% |
| Total | 706 | 100.0% |
Transportation & Commute in South Jacksonville
Vehicle Availability by Sex in South Jacksonville
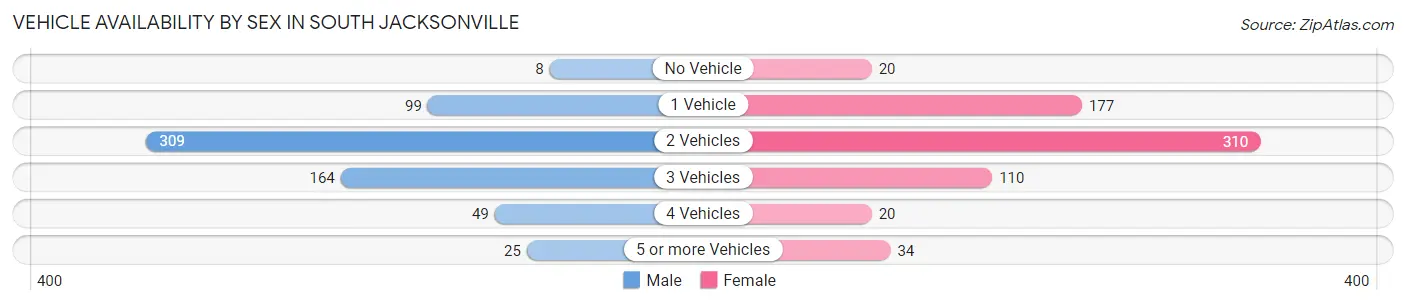
The most prevalent vehicle ownership categories in South Jacksonville are males with 2 vehicles (309, accounting for 47.2%) and females with 2 vehicles (310, making up 46.1%).
| Vehicles Available | Male | Female |
| No Vehicle | 8 (1.2%) | 20 (3.0%) |
| 1 Vehicle | 99 (15.1%) | 177 (26.4%) |
| 2 Vehicles | 309 (47.2%) | 310 (46.2%) |
| 3 Vehicles | 164 (25.1%) | 110 (16.4%) |
| 4 Vehicles | 49 (7.5%) | 20 (3.0%) |
| 5 or more Vehicles | 25 (3.8%) | 34 (5.1%) |
| Total | 654 (100.0%) | 671 (100.0%) |
Commute Time in South Jacksonville
The most frequently occuring commute durations in South Jacksonville are 5 to 9 minutes (357 commuters, 28.1%), 10 to 14 minutes (338 commuters, 26.6%), and 20 to 24 minutes (146 commuters, 11.5%).
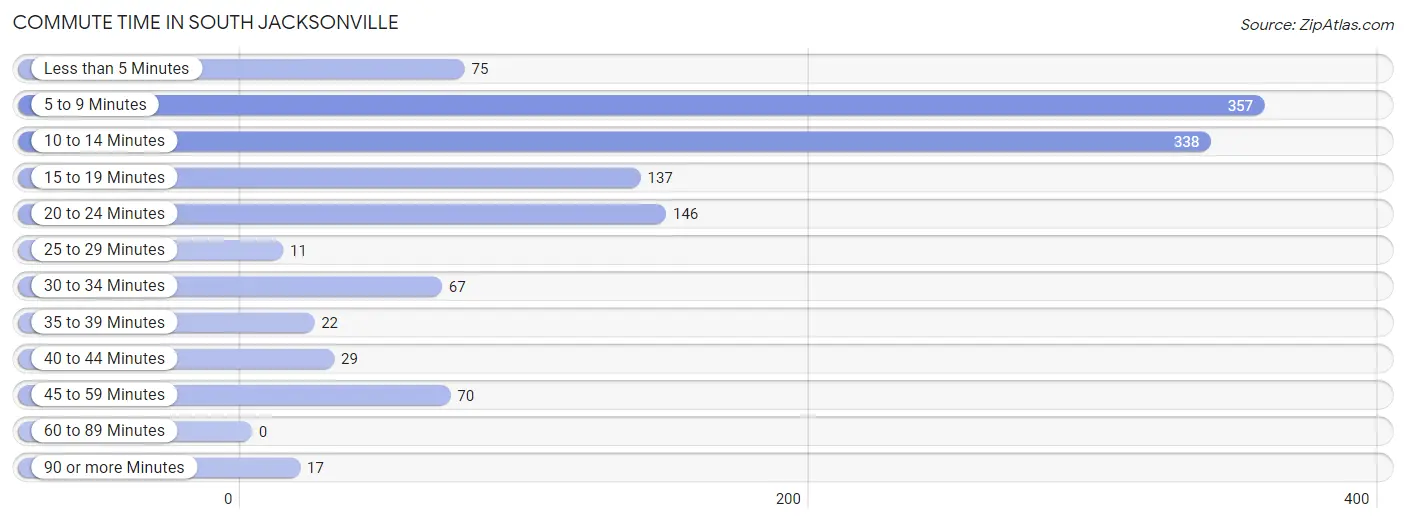
| Commute Time | # Commuters | % Commuters |
| Less than 5 Minutes | 75 | 5.9% |
| 5 to 9 Minutes | 357 | 28.1% |
| 10 to 14 Minutes | 338 | 26.6% |
| 15 to 19 Minutes | 137 | 10.8% |
| 20 to 24 Minutes | 146 | 11.5% |
| 25 to 29 Minutes | 11 | 0.9% |
| 30 to 34 Minutes | 67 | 5.3% |
| 35 to 39 Minutes | 22 | 1.7% |
| 40 to 44 Minutes | 29 | 2.3% |
| 45 to 59 Minutes | 70 | 5.5% |
| 60 to 89 Minutes | 0 | 0.0% |
| 90 or more Minutes | 17 | 1.3% |
Commute Time by Sex in South Jacksonville
The most common commute times in South Jacksonville are 10 to 14 minutes (232 commuters, 36.6%) for males and 5 to 9 minutes (233 commuters, 36.6%) for females.
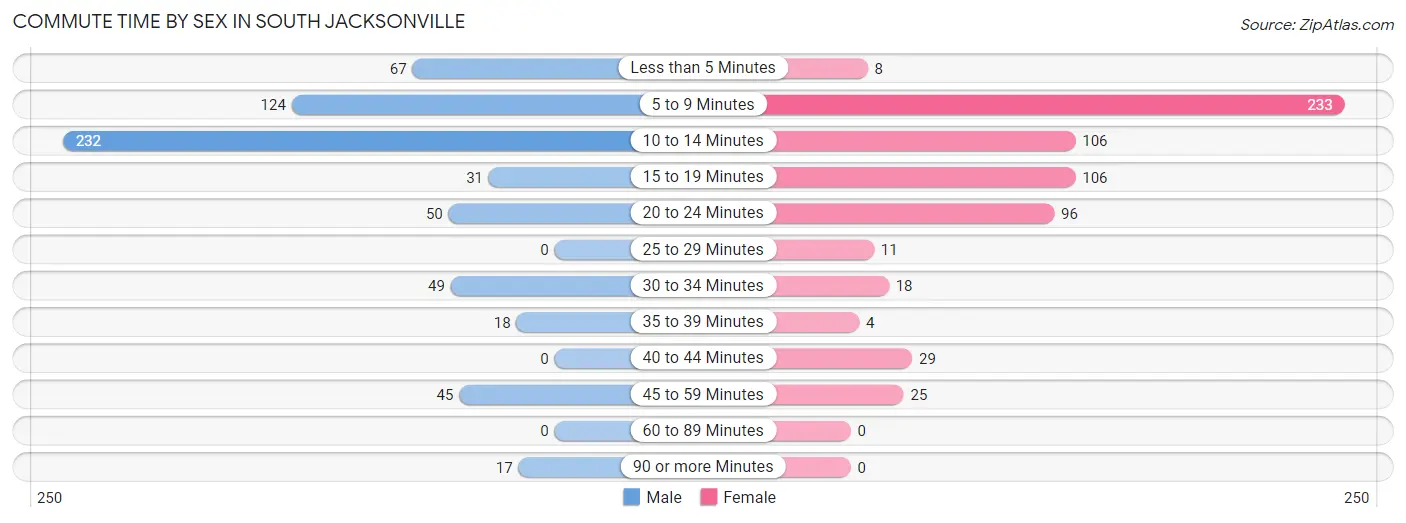
| Commute Time | Male | Female |
| Less than 5 Minutes | 67 (10.6%) | 8 (1.3%) |
| 5 to 9 Minutes | 124 (19.6%) | 233 (36.6%) |
| 10 to 14 Minutes | 232 (36.6%) | 106 (16.7%) |
| 15 to 19 Minutes | 31 (4.9%) | 106 (16.7%) |
| 20 to 24 Minutes | 50 (7.9%) | 96 (15.1%) |
| 25 to 29 Minutes | 0 (0.0%) | 11 (1.7%) |
| 30 to 34 Minutes | 49 (7.7%) | 18 (2.8%) |
| 35 to 39 Minutes | 18 (2.8%) | 4 (0.6%) |
| 40 to 44 Minutes | 0 (0.0%) | 29 (4.6%) |
| 45 to 59 Minutes | 45 (7.1%) | 25 (3.9%) |
| 60 to 89 Minutes | 0 (0.0%) | 0 (0.0%) |
| 90 or more Minutes | 17 (2.7%) | 0 (0.0%) |
Time of Departure to Work by Sex in South Jacksonville
The most frequent times of departure to work in South Jacksonville are 6:30 AM to 6:59 AM (106, 16.8%) for males and 7:30 AM to 7:59 AM (141, 22.2%) for females.
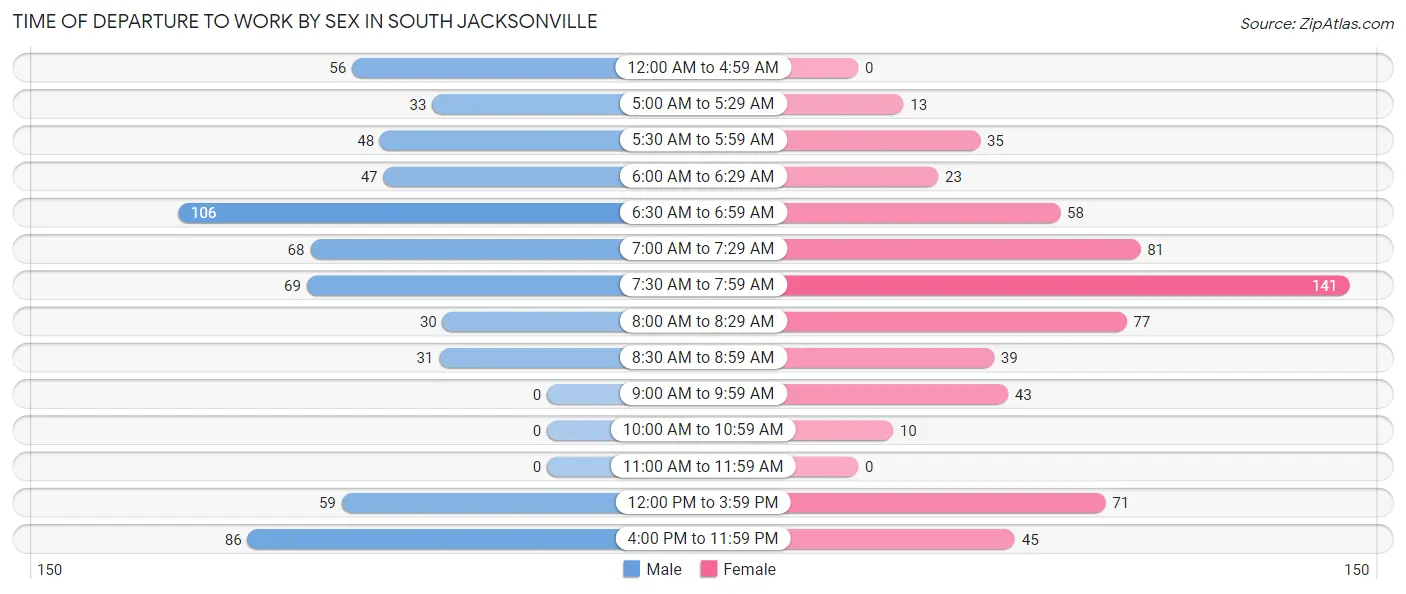
| Time of Departure | Male | Female |
| 12:00 AM to 4:59 AM | 56 (8.8%) | 0 (0.0%) |
| 5:00 AM to 5:29 AM | 33 (5.2%) | 13 (2.0%) |
| 5:30 AM to 5:59 AM | 48 (7.6%) | 35 (5.5%) |
| 6:00 AM to 6:29 AM | 47 (7.4%) | 23 (3.6%) |
| 6:30 AM to 6:59 AM | 106 (16.8%) | 58 (9.1%) |
| 7:00 AM to 7:29 AM | 68 (10.7%) | 81 (12.7%) |
| 7:30 AM to 7:59 AM | 69 (10.9%) | 141 (22.2%) |
| 8:00 AM to 8:29 AM | 30 (4.7%) | 77 (12.1%) |
| 8:30 AM to 8:59 AM | 31 (4.9%) | 39 (6.1%) |
| 9:00 AM to 9:59 AM | 0 (0.0%) | 43 (6.8%) |
| 10:00 AM to 10:59 AM | 0 (0.0%) | 10 (1.6%) |
| 11:00 AM to 11:59 AM | 0 (0.0%) | 0 (0.0%) |
| 12:00 PM to 3:59 PM | 59 (9.3%) | 71 (11.2%) |
| 4:00 PM to 11:59 PM | 86 (13.6%) | 45 (7.1%) |
| Total | 633 (100.0%) | 636 (100.0%) |
Housing Occupancy in South Jacksonville
Occupancy by Ownership in South Jacksonville
Of the total 1,645 dwellings in South Jacksonville, owner-occupied units account for 1,079 (65.6%), while renter-occupied units make up 566 (34.4%).
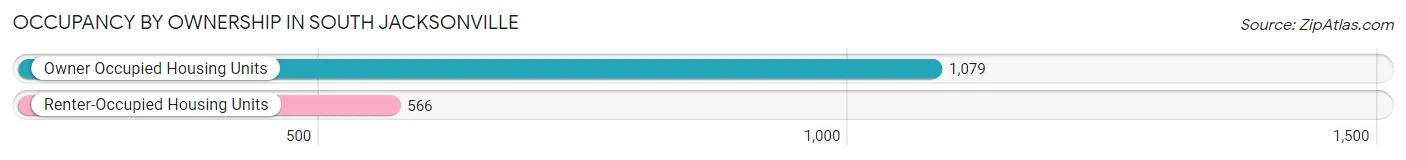
| Occupancy | # Housing Units | % Housing Units |
| Owner Occupied Housing Units | 1,079 | 65.6% |
| Renter-Occupied Housing Units | 566 | 34.4% |
| Total Occupied Housing Units | 1,645 | 100.0% |
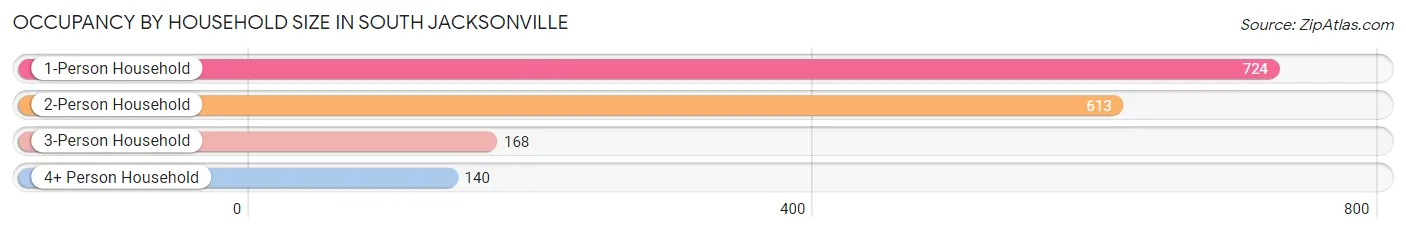
Occupancy by Household Size in South Jacksonville
| Household Size | # Housing Units | % Housing Units |
| 1-Person Household | 724 | 44.0% |
| 2-Person Household | 613 | 37.3% |
| 3-Person Household | 168 | 10.2% |
| 4+ Person Household | 140 | 8.5% |
| Total Housing Units | 1,645 | 100.0% |
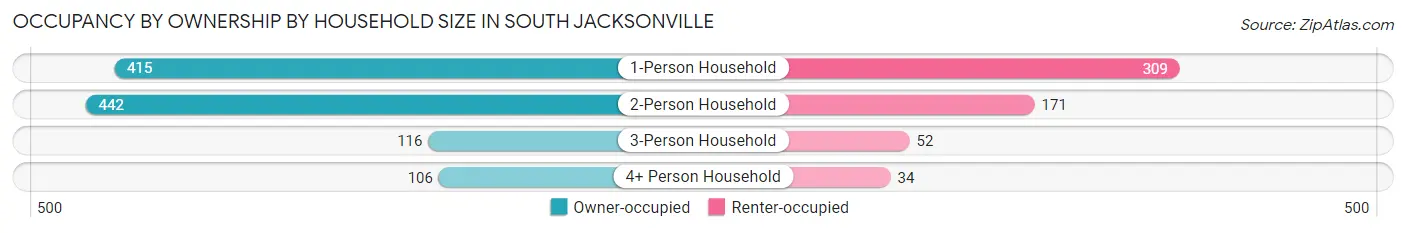
Occupancy by Ownership by Household Size in South Jacksonville
| Household Size | Owner-occupied | Renter-occupied |
| 1-Person Household | 415 (57.3%) | 309 (42.7%) |
| 2-Person Household | 442 (72.1%) | 171 (27.9%) |
| 3-Person Household | 116 (69.1%) | 52 (30.9%) |
| 4+ Person Household | 106 (75.7%) | 34 (24.3%) |
| Total Housing Units | 1,079 (65.6%) | 566 (34.4%) |
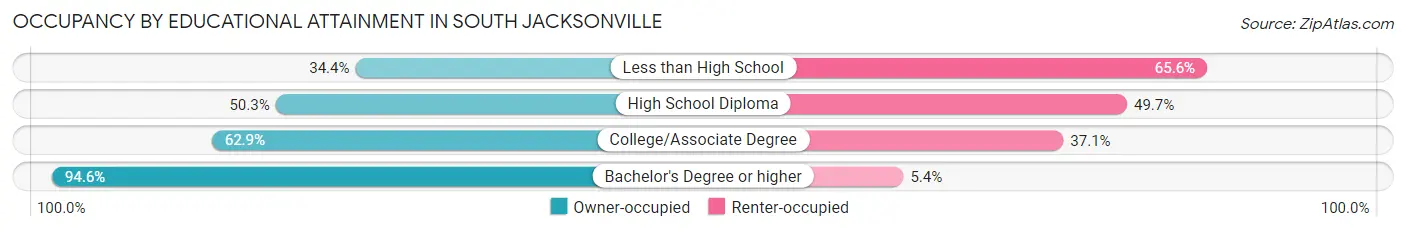
Occupancy by Educational Attainment in South Jacksonville
| Household Size | Owner-occupied | Renter-occupied |
| Less than High School | 42 (34.4%) | 80 (65.6%) |
| High School Diploma | 290 (50.3%) | 287 (49.7%) |
| College/Associate Degree | 293 (62.9%) | 173 (37.1%) |
| Bachelor's Degree or higher | 454 (94.6%) | 26 (5.4%) |
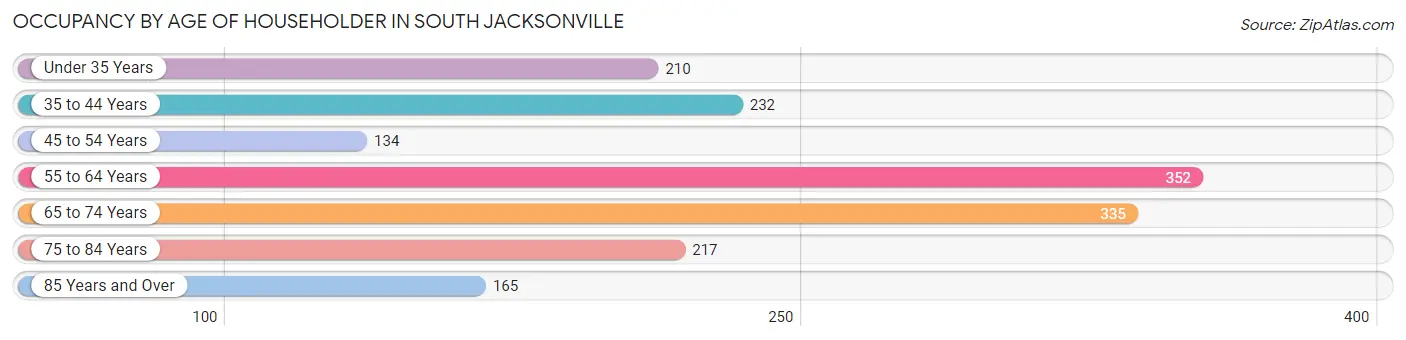
Occupancy by Age of Householder in South Jacksonville
| Age Bracket | # Households | % Households |
| Under 35 Years | 210 | 12.8% |
| 35 to 44 Years | 232 | 14.1% |
| 45 to 54 Years | 134 | 8.2% |
| 55 to 64 Years | 352 | 21.4% |
| 65 to 74 Years | 335 | 20.4% |
| 75 to 84 Years | 217 | 13.2% |
| 85 Years and Over | 165 | 10.0% |
| Total | 1,645 | 100.0% |
Housing Finances in South Jacksonville
Median Income by Occupancy in South Jacksonville
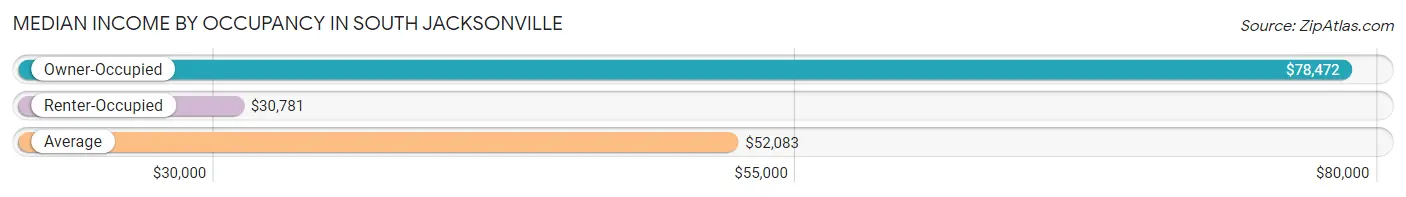
| Occupancy Type | # Households | Median Income |
| Owner-Occupied | 1,079 (65.6%) | $78,472 |
| Renter-Occupied | 566 (34.4%) | $30,781 |
| Average | 1,645 (100.0%) | $52,083 |
Occupancy by Householder Income Bracket in South Jacksonville
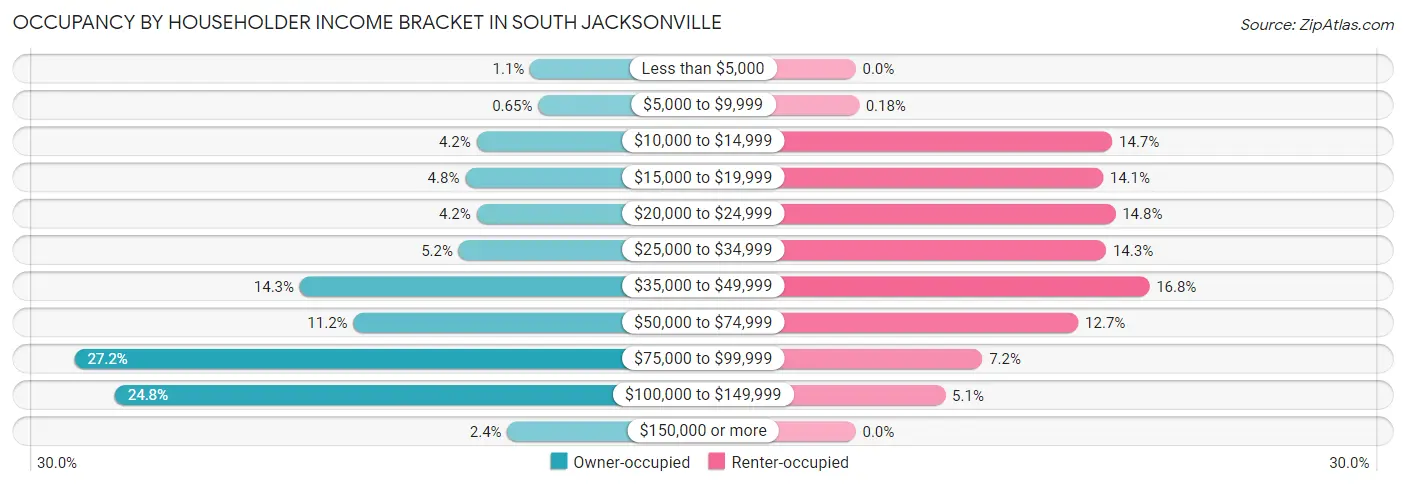
| Income Bracket | Owner-occupied | Renter-occupied |
| Less than $5,000 | 12 (1.1%) | 0 (0.0%) |
| $5,000 to $9,999 | 7 (0.6%) | 1 (0.2%) |
| $10,000 to $14,999 | 45 (4.2%) | 83 (14.7%) |
| $15,000 to $19,999 | 52 (4.8%) | 80 (14.1%) |
| $20,000 to $24,999 | 45 (4.2%) | 84 (14.8%) |
| $25,000 to $34,999 | 56 (5.2%) | 81 (14.3%) |
| $35,000 to $49,999 | 154 (14.3%) | 95 (16.8%) |
| $50,000 to $74,999 | 121 (11.2%) | 72 (12.7%) |
| $75,000 to $99,999 | 293 (27.2%) | 41 (7.2%) |
| $100,000 to $149,999 | 268 (24.8%) | 29 (5.1%) |
| $150,000 or more | 26 (2.4%) | 0 (0.0%) |
| Total | 1,079 (100.0%) | 566 (100.0%) |
Monthly Housing Cost Tiers in South Jacksonville
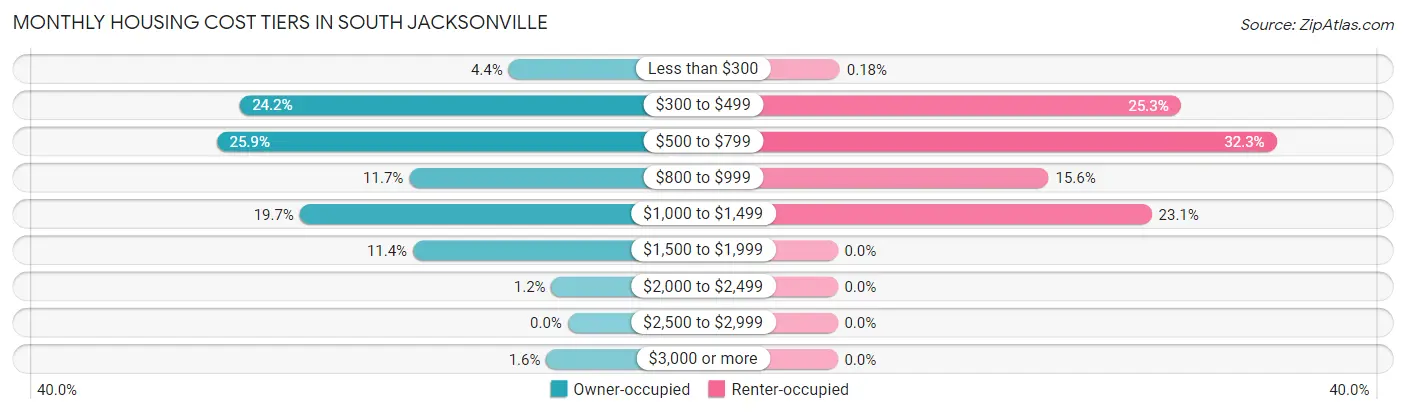
| Monthly Cost | Owner-occupied | Renter-occupied |
| Less than $300 | 47 (4.4%) | 1 (0.2%) |
| $300 to $499 | 261 (24.2%) | 143 (25.3%) |
| $500 to $799 | 279 (25.9%) | 183 (32.3%) |
| $800 to $999 | 126 (11.7%) | 88 (15.5%) |
| $1,000 to $1,499 | 213 (19.7%) | 131 (23.1%) |
| $1,500 to $1,999 | 123 (11.4%) | 0 (0.0%) |
| $2,000 to $2,499 | 13 (1.2%) | 0 (0.0%) |
| $2,500 to $2,999 | 0 (0.0%) | 0 (0.0%) |
| $3,000 or more | 17 (1.6%) | 0 (0.0%) |
| Total | 1,079 (100.0%) | 566 (100.0%) |
Physical Housing Characteristics in South Jacksonville
Housing Structures in South Jacksonville
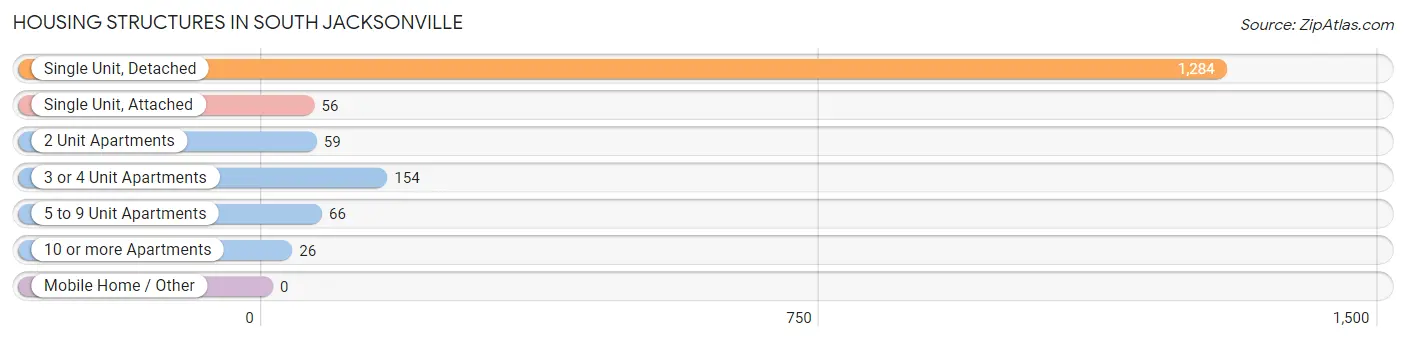
| Structure Type | # Housing Units | % Housing Units |
| Single Unit, Detached | 1,284 | 78.0% |
| Single Unit, Attached | 56 | 3.4% |
| 2 Unit Apartments | 59 | 3.6% |
| 3 or 4 Unit Apartments | 154 | 9.4% |
| 5 to 9 Unit Apartments | 66 | 4.0% |
| 10 or more Apartments | 26 | 1.6% |
| Mobile Home / Other | 0 | 0.0% |
| Total | 1,645 | 100.0% |
Housing Structures by Occupancy in South Jacksonville
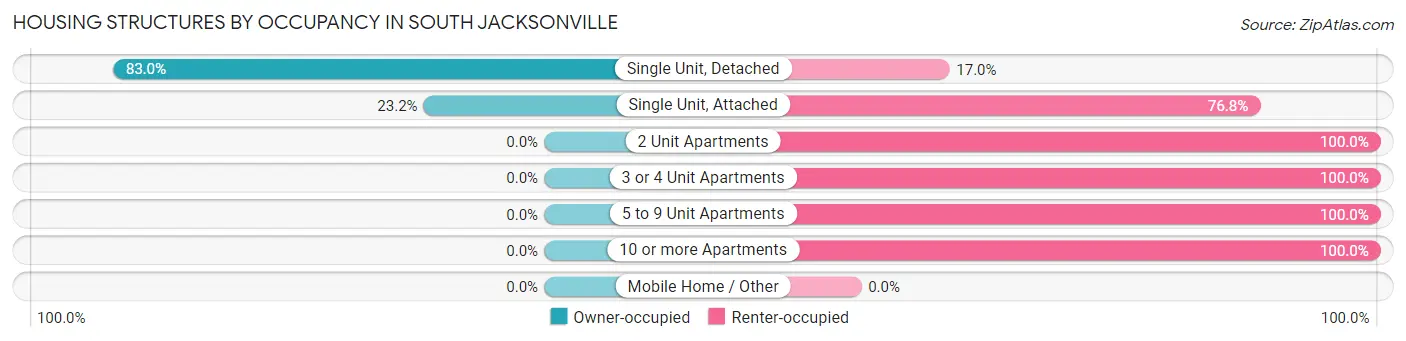
| Structure Type | Owner-occupied | Renter-occupied |
| Single Unit, Detached | 1,066 (83.0%) | 218 (17.0%) |
| Single Unit, Attached | 13 (23.2%) | 43 (76.8%) |
| 2 Unit Apartments | 0 (0.0%) | 59 (100.0%) |
| 3 or 4 Unit Apartments | 0 (0.0%) | 154 (100.0%) |
| 5 to 9 Unit Apartments | 0 (0.0%) | 66 (100.0%) |
| 10 or more Apartments | 0 (0.0%) | 26 (100.0%) |
| Mobile Home / Other | 0 (0.0%) | 0 (0.0%) |
| Total | 1,079 (65.6%) | 566 (34.4%) |
Housing Structures by Number of Rooms in South Jacksonville
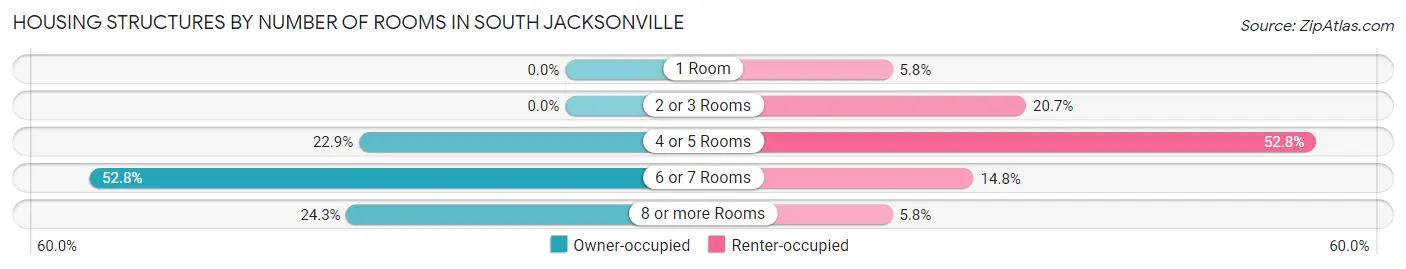
| Number of Rooms | Owner-occupied | Renter-occupied |
| 1 Room | 0 (0.0%) | 33 (5.8%) |
| 2 or 3 Rooms | 0 (0.0%) | 117 (20.7%) |
| 4 or 5 Rooms | 247 (22.9%) | 299 (52.8%) |
| 6 or 7 Rooms | 570 (52.8%) | 84 (14.8%) |
| 8 or more Rooms | 262 (24.3%) | 33 (5.8%) |
| Total | 1,079 (100.0%) | 566 (100.0%) |
Housing Structure by Heating Type in South Jacksonville
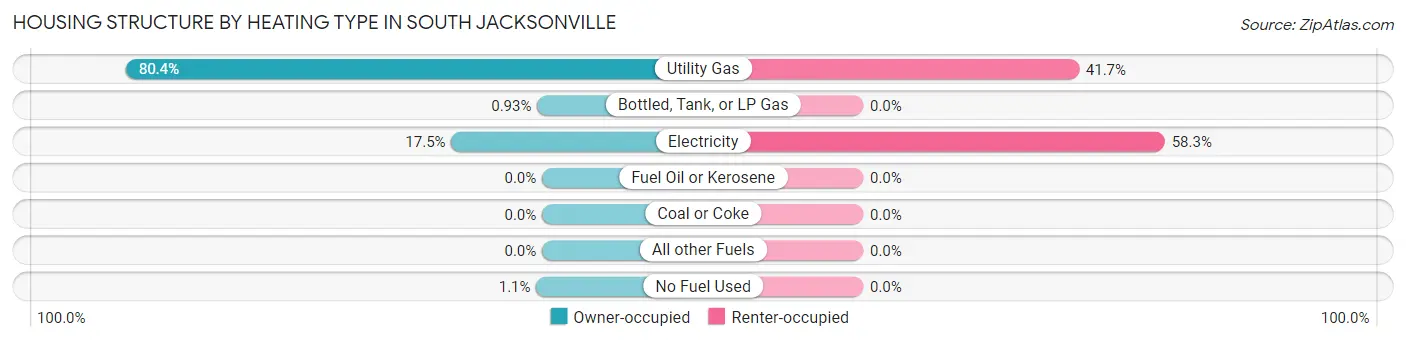
| Heating Type | Owner-occupied | Renter-occupied |
| Utility Gas | 868 (80.4%) | 236 (41.7%) |
| Bottled, Tank, or LP Gas | 10 (0.9%) | 0 (0.0%) |
| Electricity | 189 (17.5%) | 330 (58.3%) |
| Fuel Oil or Kerosene | 0 (0.0%) | 0 (0.0%) |
| Coal or Coke | 0 (0.0%) | 0 (0.0%) |
| All other Fuels | 0 (0.0%) | 0 (0.0%) |
| No Fuel Used | 12 (1.1%) | 0 (0.0%) |
| Total | 1,079 (100.0%) | 566 (100.0%) |
Household Vehicle Usage in South Jacksonville
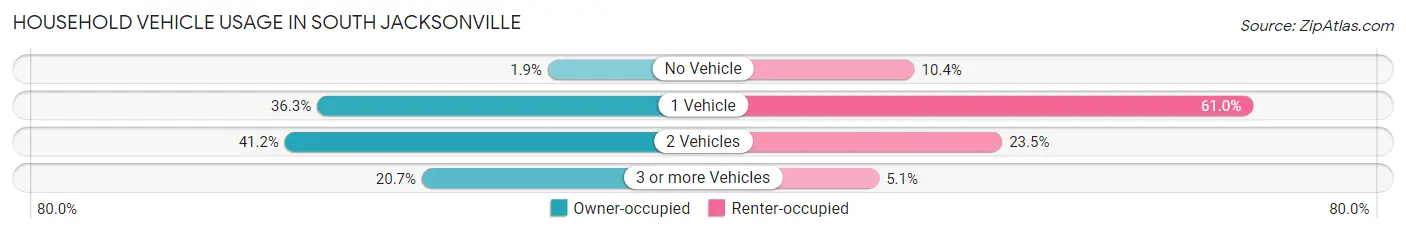
| Vehicles per Household | Owner-occupied | Renter-occupied |
| No Vehicle | 20 (1.8%) | 59 (10.4%) |
| 1 Vehicle | 392 (36.3%) | 345 (61.0%) |
| 2 Vehicles | 444 (41.1%) | 133 (23.5%) |
| 3 or more Vehicles | 223 (20.7%) | 29 (5.1%) |
| Total | 1,079 (100.0%) | 566 (100.0%) |
Real Estate & Mortgages in South Jacksonville
Real Estate and Mortgage Overview in South Jacksonville
| Characteristic | Without Mortgage | With Mortgage |
| Housing Units | 456 | 623 |
| Median Property Value | $131,300 | $142,200 |
| Median Household Income | $70,455 | $12 |
| Monthly Housing Costs | $504 | $17 |
| Real Estate Taxes | $2,493 | $9 |
Property Value by Mortgage Status in South Jacksonville
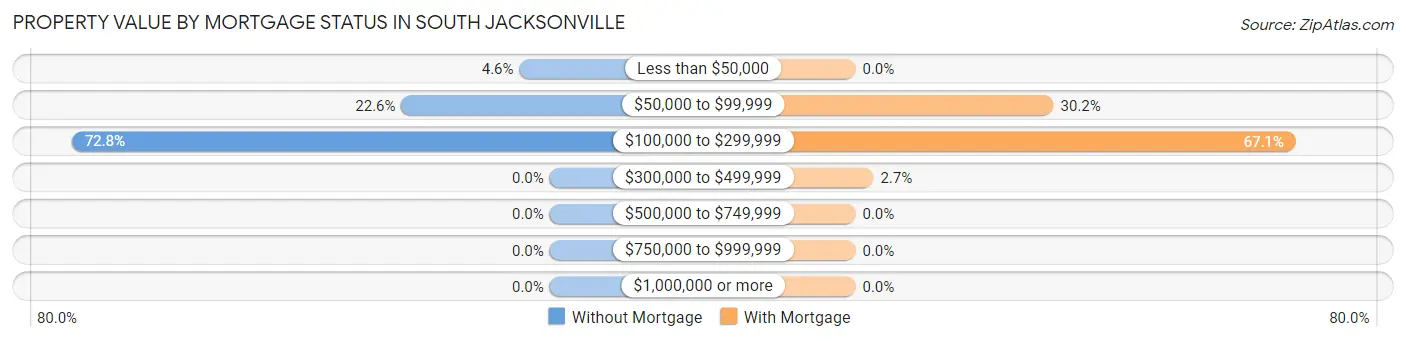
| Property Value | Without Mortgage | With Mortgage |
| Less than $50,000 | 21 (4.6%) | 0 (0.0%) |
| $50,000 to $99,999 | 103 (22.6%) | 188 (30.2%) |
| $100,000 to $299,999 | 332 (72.8%) | 418 (67.1%) |
| $300,000 to $499,999 | 0 (0.0%) | 17 (2.7%) |
| $500,000 to $749,999 | 0 (0.0%) | 0 (0.0%) |
| $750,000 to $999,999 | 0 (0.0%) | 0 (0.0%) |
| $1,000,000 or more | 0 (0.0%) | 0 (0.0%) |
| Total | 456 (100.0%) | 623 (100.0%) |
Household Income by Mortgage Status in South Jacksonville
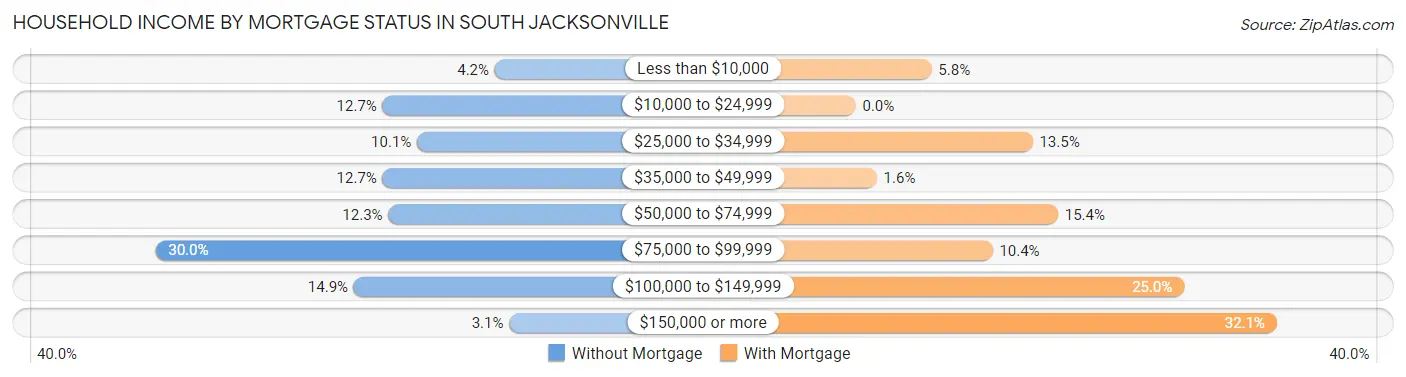
| Household Income | Without Mortgage | With Mortgage |
| Less than $10,000 | 19 (4.2%) | 36 (5.8%) |
| $10,000 to $24,999 | 58 (12.7%) | 0 (0.0%) |
| $25,000 to $34,999 | 46 (10.1%) | 84 (13.5%) |
| $35,000 to $49,999 | 58 (12.7%) | 10 (1.6%) |
| $50,000 to $74,999 | 56 (12.3%) | 96 (15.4%) |
| $75,000 to $99,999 | 137 (30.0%) | 65 (10.4%) |
| $100,000 to $149,999 | 68 (14.9%) | 156 (25.0%) |
| $150,000 or more | 14 (3.1%) | 200 (32.1%) |
| Total | 456 (100.0%) | 623 (100.0%) |
Property Value to Household Income Ratio in South Jacksonville
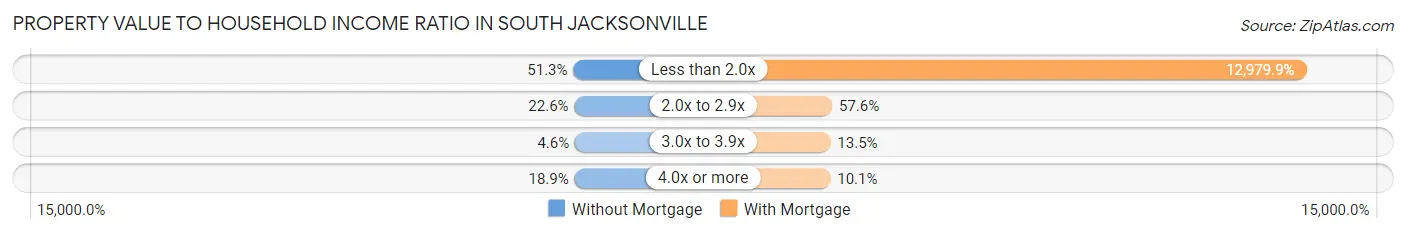
| Value-to-Income Ratio | Without Mortgage | With Mortgage |
| Less than 2.0x | 234 (51.3%) | 80,865 (12,979.9%) |
| 2.0x to 2.9x | 103 (22.6%) | 359 (57.6%) |
| 3.0x to 3.9x | 21 (4.6%) | 84 (13.5%) |
| 4.0x or more | 86 (18.9%) | 63 (10.1%) |
| Total | 456 (100.0%) | 623 (100.0%) |
Real Estate Taxes by Mortgage Status in South Jacksonville
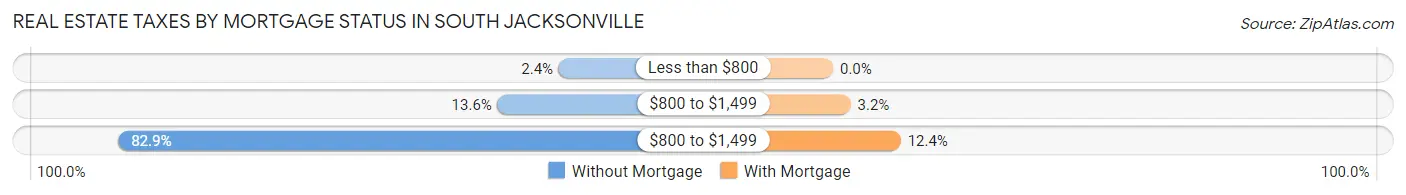
| Property Taxes | Without Mortgage | With Mortgage |
| Less than $800 | 11 (2.4%) | 0 (0.0%) |
| $800 to $1,499 | 62 (13.6%) | 20 (3.2%) |
| $800 to $1,499 | 378 (82.9%) | 77 (12.4%) |
| Total | 456 (100.0%) | 623 (100.0%) |
Health & Disability in South Jacksonville
Health Insurance Coverage by Age in South Jacksonville
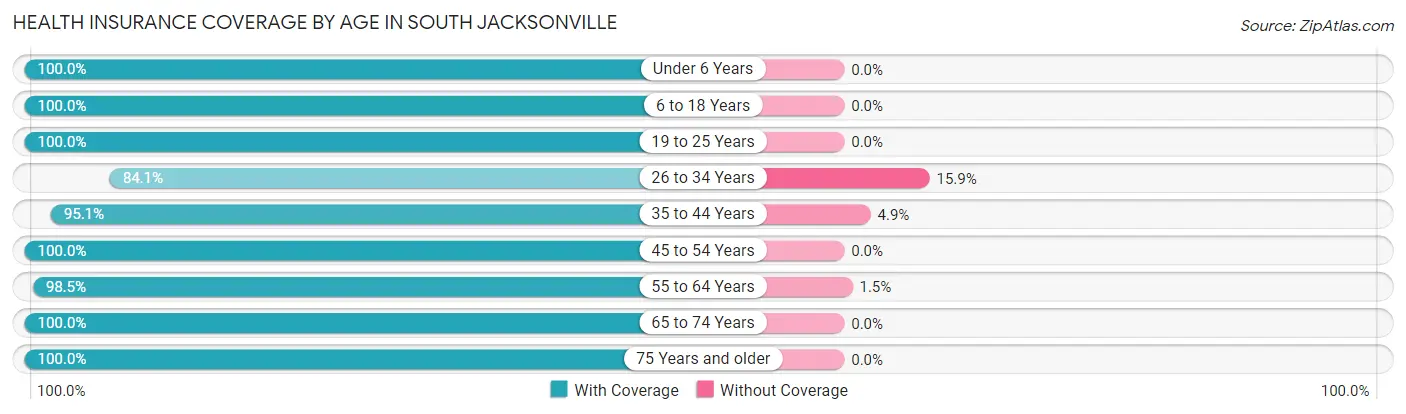
| Age Bracket | With Coverage | Without Coverage |
| Under 6 Years | 120 (100.0%) | 0 (0.0%) |
| 6 to 18 Years | 591 (100.0%) | 0 (0.0%) |
| 19 to 25 Years | 216 (100.0%) | 0 (0.0%) |
| 26 to 34 Years | 312 (84.1%) | 59 (15.9%) |
| 35 to 44 Years | 291 (95.1%) | 15 (4.9%) |
| 45 to 54 Years | 221 (100.0%) | 0 (0.0%) |
| 55 to 64 Years | 510 (98.5%) | 8 (1.5%) |
| 65 to 74 Years | 444 (100.0%) | 0 (0.0%) |
| 75 Years and older | 488 (100.0%) | 0 (0.0%) |
| Total | 3,193 (97.5%) | 82 (2.5%) |
Health Insurance Coverage by Citizenship Status in South Jacksonville
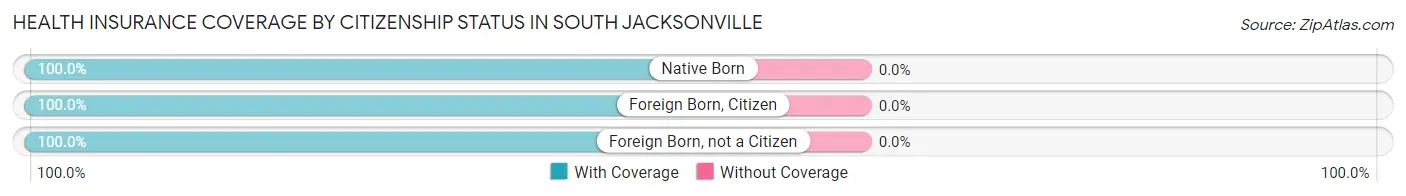
| Citizenship Status | With Coverage | Without Coverage |
| Native Born | 120 (100.0%) | 0 (0.0%) |
| Foreign Born, Citizen | 591 (100.0%) | 0 (0.0%) |
| Foreign Born, not a Citizen | 216 (100.0%) | 0 (0.0%) |
Health Insurance Coverage by Household Income in South Jacksonville
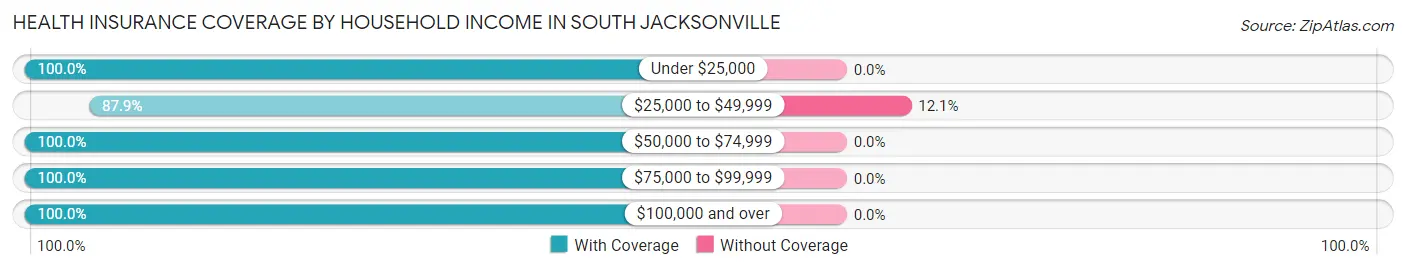
| Household Income | With Coverage | Without Coverage |
| Under $25,000 | 640 (100.0%) | 0 (0.0%) |
| $25,000 to $49,999 | 597 (87.9%) | 82 (12.1%) |
| $50,000 to $74,999 | 309 (100.0%) | 0 (0.0%) |
| $75,000 to $99,999 | 703 (100.0%) | 0 (0.0%) |
| $100,000 and over | 944 (100.0%) | 0 (0.0%) |
Public vs Private Health Insurance Coverage by Age in South Jacksonville
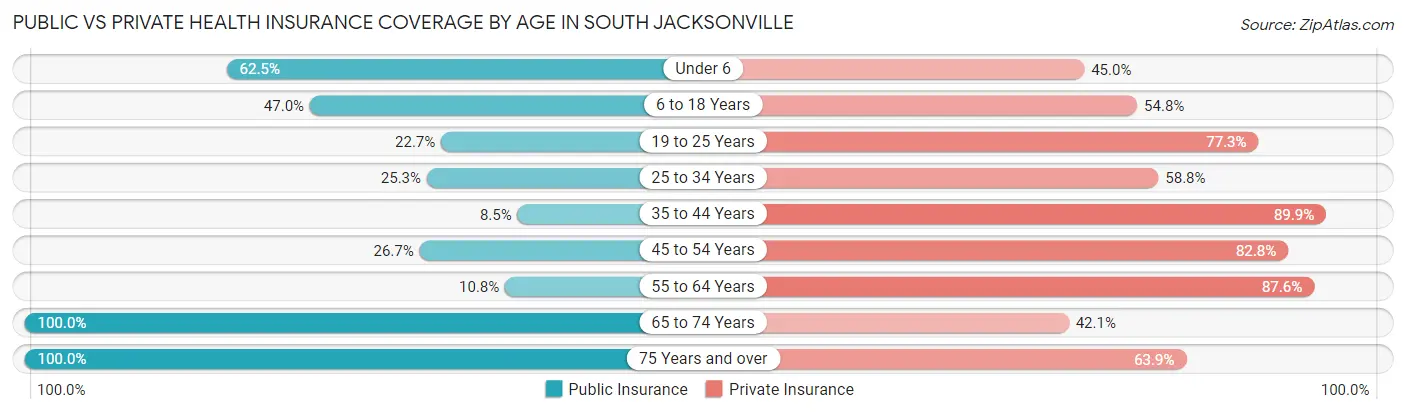
| Age Bracket | Public Insurance | Private Insurance |
| Under 6 | 75 (62.5%) | 54 (45.0%) |
| 6 to 18 Years | 278 (47.0%) | 324 (54.8%) |
| 19 to 25 Years | 49 (22.7%) | 167 (77.3%) |
| 25 to 34 Years | 94 (25.3%) | 218 (58.8%) |
| 35 to 44 Years | 26 (8.5%) | 275 (89.9%) |
| 45 to 54 Years | 59 (26.7%) | 183 (82.8%) |
| 55 to 64 Years | 56 (10.8%) | 454 (87.6%) |
| 65 to 74 Years | 444 (100.0%) | 187 (42.1%) |
| 75 Years and over | 488 (100.0%) | 312 (63.9%) |
| Total | 1,569 (47.9%) | 2,174 (66.4%) |
Disability Status by Sex by Age in South Jacksonville
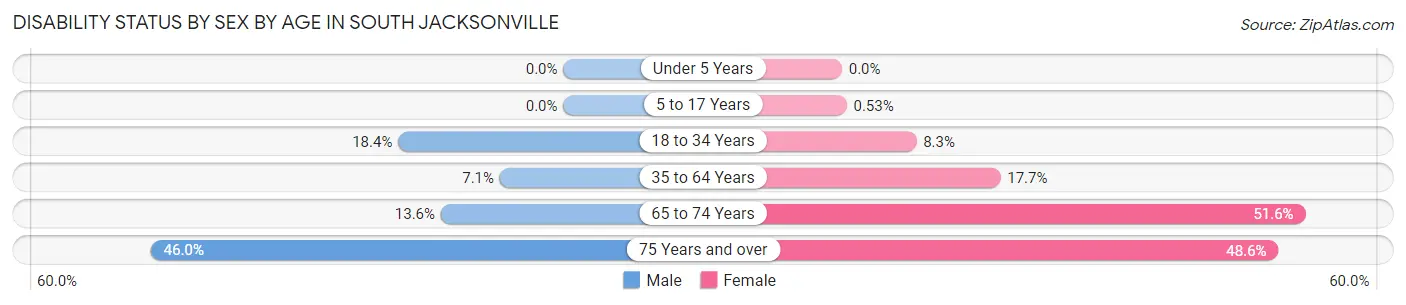
| Age Bracket | Male | Female |
| Under 5 Years | 0 (0.0%) | 0 (0.0%) |
| 5 to 17 Years | 0 (0.0%) | 1 (0.5%) |
| 18 to 34 Years | 48 (18.4%) | 33 (8.3%) |
| 35 to 64 Years | 33 (7.1%) | 102 (17.6%) |
| 65 to 74 Years | 27 (13.6%) | 127 (51.6%) |
| 75 Years and over | 91 (46.0%) | 141 (48.6%) |
Disability Class by Sex by Age in South Jacksonville
Disability Class: Hearing Difficulty
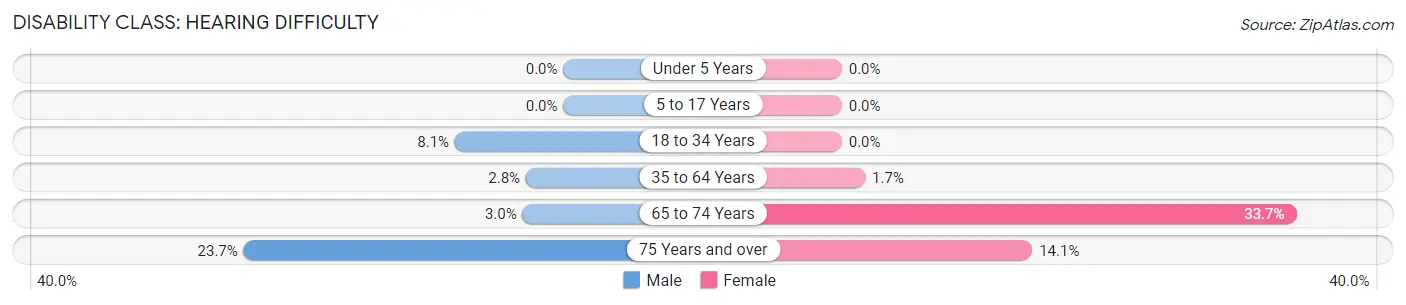
| Age Bracket | Male | Female |
| Under 5 Years | 0 (0.0%) | 0 (0.0%) |
| 5 to 17 Years | 0 (0.0%) | 0 (0.0%) |
| 18 to 34 Years | 21 (8.1%) | 0 (0.0%) |
| 35 to 64 Years | 13 (2.8%) | 10 (1.7%) |
| 65 to 74 Years | 6 (3.0%) | 83 (33.7%) |
| 75 Years and over | 47 (23.7%) | 41 (14.1%) |
Disability Class: Vision Difficulty
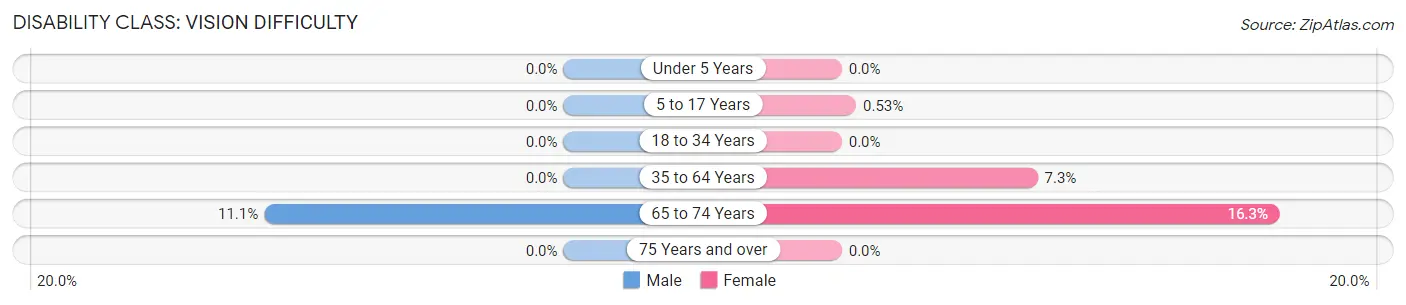
| Age Bracket | Male | Female |
| Under 5 Years | 0 (0.0%) | 0 (0.0%) |
| 5 to 17 Years | 0 (0.0%) | 1 (0.5%) |
| 18 to 34 Years | 0 (0.0%) | 0 (0.0%) |
| 35 to 64 Years | 0 (0.0%) | 42 (7.3%) |
| 65 to 74 Years | 22 (11.1%) | 40 (16.3%) |
| 75 Years and over | 0 (0.0%) | 0 (0.0%) |
Disability Class: Cognitive Difficulty
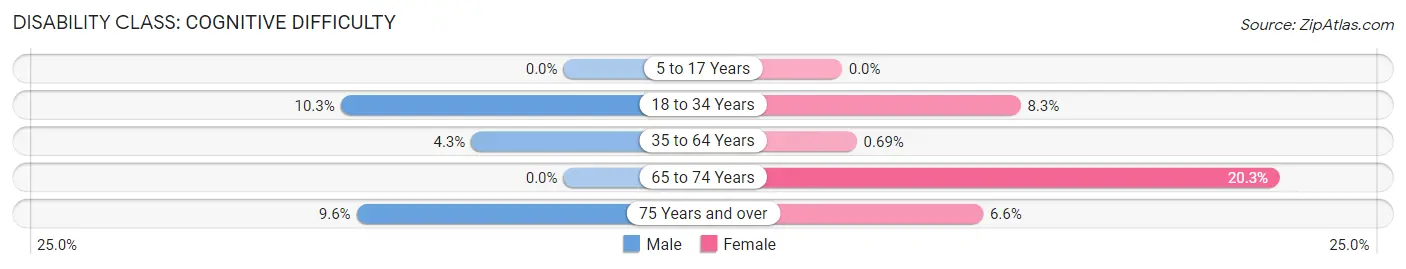
| Age Bracket | Male | Female |
| 5 to 17 Years | 0 (0.0%) | 0 (0.0%) |
| 18 to 34 Years | 27 (10.3%) | 33 (8.3%) |
| 35 to 64 Years | 20 (4.3%) | 4 (0.7%) |
| 65 to 74 Years | 0 (0.0%) | 50 (20.3%) |
| 75 Years and over | 19 (9.6%) | 19 (6.6%) |
Disability Class: Ambulatory Difficulty
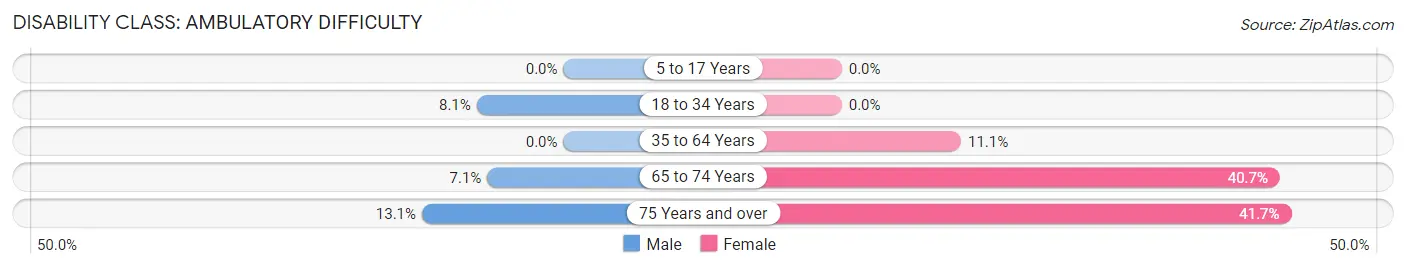
| Age Bracket | Male | Female |
| 5 to 17 Years | 0 (0.0%) | 0 (0.0%) |
| 18 to 34 Years | 21 (8.1%) | 0 (0.0%) |
| 35 to 64 Years | 0 (0.0%) | 64 (11.1%) |
| 65 to 74 Years | 14 (7.1%) | 100 (40.6%) |
| 75 Years and over | 26 (13.1%) | 121 (41.7%) |
Disability Class: Self-Care Difficulty
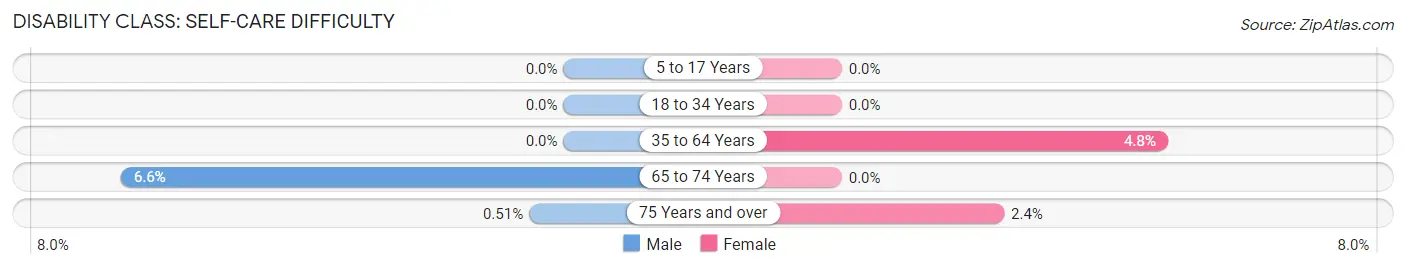
| Age Bracket | Male | Female |
| 5 to 17 Years | 0 (0.0%) | 0 (0.0%) |
| 18 to 34 Years | 0 (0.0%) | 0 (0.0%) |
| 35 to 64 Years | 0 (0.0%) | 28 (4.8%) |
| 65 to 74 Years | 13 (6.6%) | 0 (0.0%) |
| 75 Years and over | 1 (0.5%) | 7 (2.4%) |
Technology Access in South Jacksonville
Computing Device Access in South Jacksonville
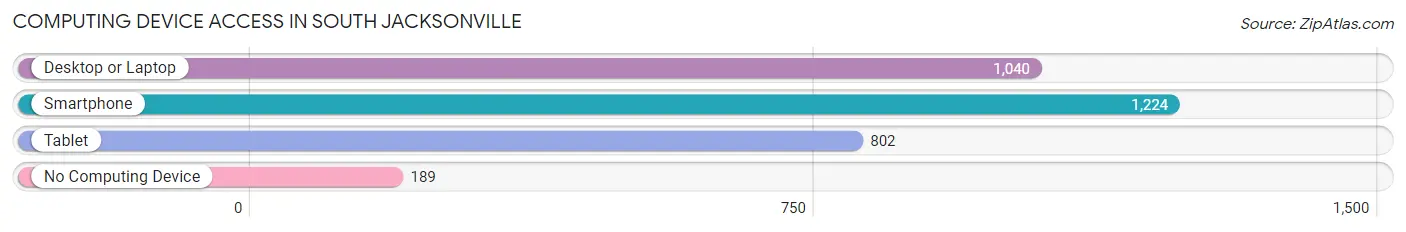
| Device Type | # Households | % Households |
| Desktop or Laptop | 1,040 | 63.2% |
| Smartphone | 1,224 | 74.4% |
| Tablet | 802 | 48.7% |
| No Computing Device | 189 | 11.5% |
| Total | 1,645 | 100.0% |
Internet Access in South Jacksonville
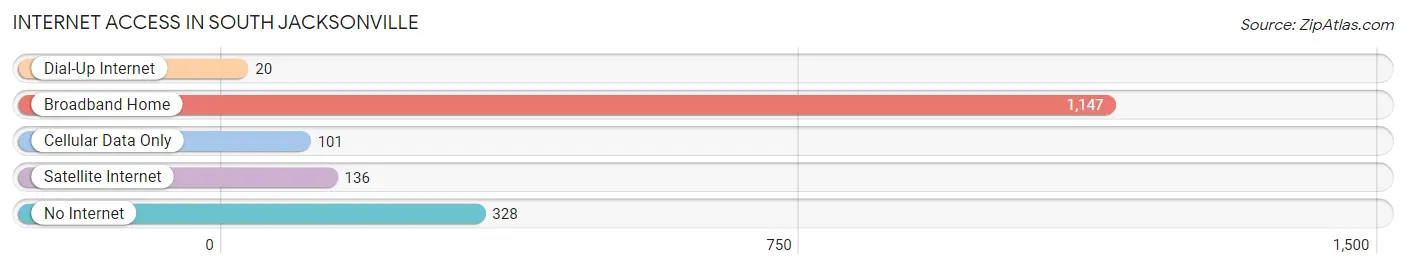
| Internet Type | # Households | % Households |
| Dial-Up Internet | 20 | 1.2% |
| Broadband Home | 1,147 | 69.7% |
| Cellular Data Only | 101 | 6.1% |
| Satellite Internet | 136 | 8.3% |
| No Internet | 328 | 19.9% |
| Total | 1,645 | 100.0% |
South Jacksonville Summary
History
South Jacksonville is a village located in Morgan County, Illinois, United States. It is part of the Jacksonville, Illinois metropolitan area. The village was founded in 1854 and incorporated in 1872. It is located on the banks of the South Fork of the Sangamon River.
The area that is now South Jacksonville was first settled in 1820 by William and Mary Ann Smith. The Smiths were among the first settlers in the area and were instrumental in the development of the village. They built a log cabin and a grist mill on the banks of the South Fork of the Sangamon River.
The village was originally known as Smithville, but the name was changed to South Jacksonville in 1872 when it was incorporated. The name was chosen to honor the city of Jacksonville, which was located just a few miles to the north.
The village grew rapidly in the late 19th century, and by the turn of the century it had become a thriving community. The village was home to several businesses, including a flour mill, a sawmill, a brickyard, a furniture factory, and a canning factory.
The village was also home to a number of churches, including the First Baptist Church, the First Methodist Church, and the First Presbyterian Church. The village also had a school, a library, and a post office.
Geography
South Jacksonville is located in Morgan County, Illinois, United States. It is part of the Jacksonville, Illinois metropolitan area. The village is situated on the banks of the South Fork of the Sangamon River.
The village is located at an elevation of 690 feet (210 m) above sea level. The village has a total area of 0.9 square miles (2.3 km2), all of which is land.
Economy
The economy of South Jacksonville is largely based on agriculture and manufacturing. The village is home to several businesses, including a flour mill, a sawmill, a brickyard, a furniture factory, and a canning factory.
The village is also home to a number of retail stores, including a grocery store, a hardware store, and a pharmacy. The village also has a number of restaurants, including a pizza parlor, a Mexican restaurant, and a Chinese restaurant.
Demographics
As of the 2010 census, the village had a population of 1,845. The racial makeup of the village was 97.2% White, 0.7% African American, 0.3% Native American, 0.3% Asian, 0.2% from other races, and 1.5% from two or more races. Hispanic or Latino of any race were 1.2% of the population.
The median income for a household in the village was $41,250, and the median income for a family was $50,000. The per capita income for the village was $20,845. About 8.2% of families and 10.2% of the population were below the poverty line, including 14.2% of those under age 18 and 5.2% of those age 65 or over.
Common Questions
What is Per Capita Income in South Jacksonville?
Per Capita income in South Jacksonville is $32,334.
What is the Median Family Income in South Jacksonville?
Median Family Income in South Jacksonville is $85,020.
What is the Median Household income in South Jacksonville?
Median Household Income in South Jacksonville is $52,083.
What is Income or Wage Gap in South Jacksonville?
Income or Wage Gap in South Jacksonville is 33.6%.
Women in South Jacksonville earn 66.4 cents for every dollar earned by a man.
What is Inequality or Gini Index in South Jacksonville?
Inequality or Gini Index in South Jacksonville is 0.37.
What is the Total Population of South Jacksonville?
Total Population of South Jacksonville is 3,286.
What is the Total Male Population of South Jacksonville?
Total Male Population of South Jacksonville is 1,518.
What is the Total Female Population of South Jacksonville?
Total Female Population of South Jacksonville is 1,768.
What is the Ratio of Males per 100 Females in South Jacksonville?
There are 85.86 Males per 100 Females in South Jacksonville.
What is the Ratio of Females per 100 Males in South Jacksonville?
There are 116.47 Females per 100 Males in South Jacksonville.
What is the Median Population Age in South Jacksonville?
Median Population Age in South Jacksonville is 48.2 Years.
What is the Average Family Size in South Jacksonville
Average Family Size in South Jacksonville is 2.7 People.
What is the Average Household Size in South Jacksonville
Average Household Size in South Jacksonville is 2.0 People.
How Large is the Labor Force in South Jacksonville?
There are 1,477 People in the Labor Forcein in South Jacksonville.
What is the Percentage of People in the Labor Force in South Jacksonville?
55.2% of People are in the Labor Force in South Jacksonville.
What is the Unemployment Rate in South Jacksonville?
Unemployment Rate in South Jacksonville is 10.4%.