Zip Codes with the Highest Percentage of Population Employed in Health Technologists in Champaign, IL
RELATED REPORTS & OPTIONS
Health Technologists
Champaign
Compare Zip Codes
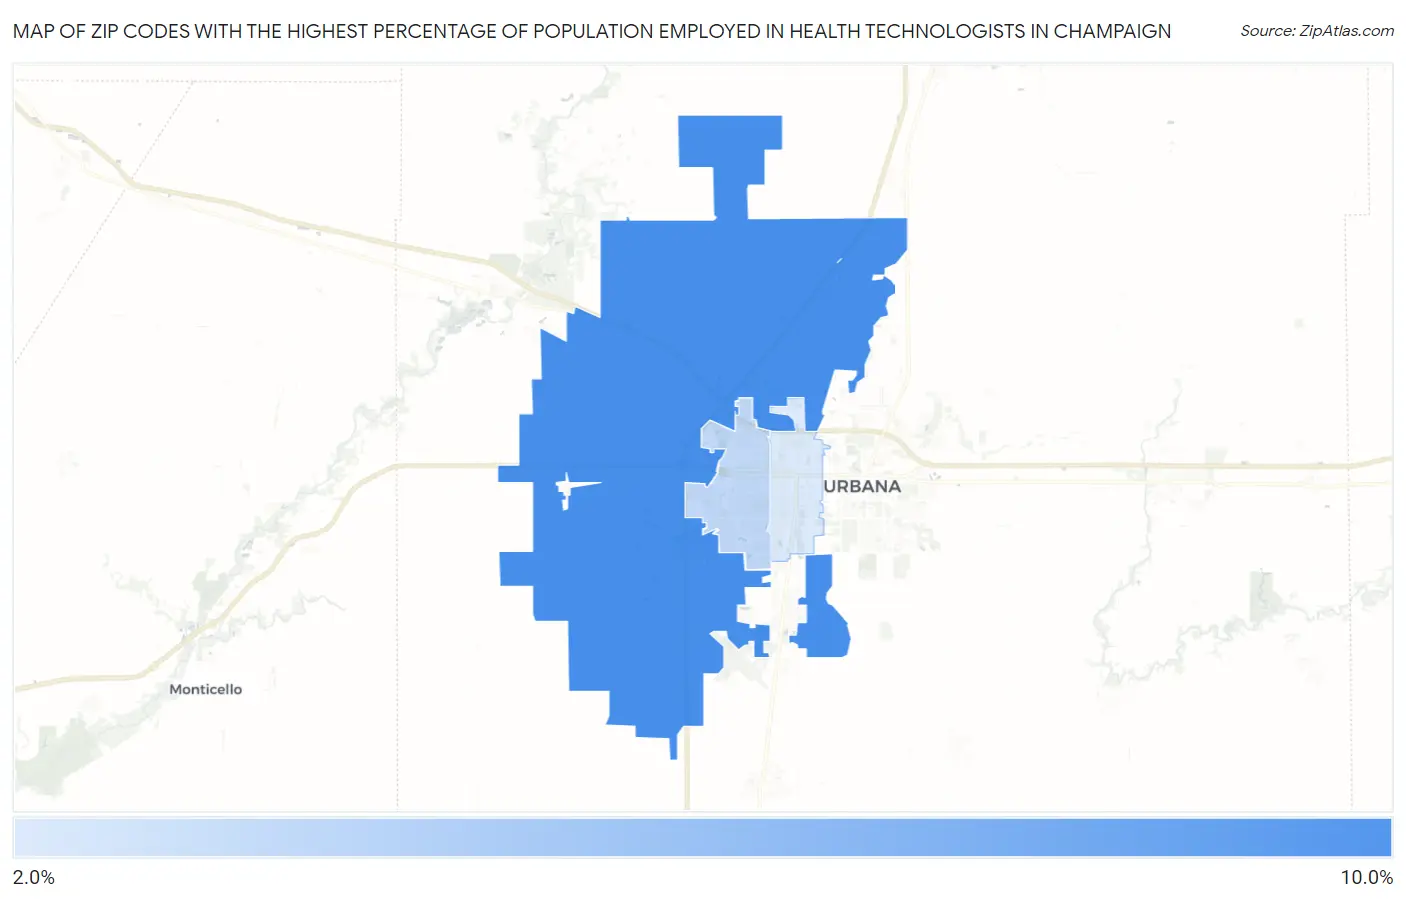
Map of Zip Codes with the Highest Percentage of Population Employed in Health Technologists in Champaign
2.7%
9.0%
Zip Codes with the Highest Percentage of Population Employed in Health Technologists in Champaign, IL
| Zip Code | % Employed | vs State | vs National | |
| 1. | 61822 | 9.0% | 4.4%(+4.62)#88 | 4.3%(+4.72)#2,024 |
| 2. | 61821 | 3.9% | 4.4%(-0.539)#622 | 4.3%(-0.434)#13,213 |
| 3. | 61820 | 2.7% | 4.4%(-1.65)#837 | 4.3%(-1.54)#18,289 |
1
Common Questions
What are the Top Zip Codes with the Highest Percentage of Population Employed in Health Technologists in Champaign, IL?
Top Zip Codes with the Highest Percentage of Population Employed in Health Technologists in Champaign, IL are:
What zip code has the Highest Percentage of Population Employed in Health Technologists in Champaign, IL?
61822 has the Highest Percentage of Population Employed in Health Technologists in Champaign, IL with 9.0%.
What is the Percentage of Population Employed in Health Technologists in Champaign, IL?
Percentage of Population Employed in Health Technologists in Champaign is 5.1%.
What is the Percentage of Population Employed in Health Technologists in Illinois?
Percentage of Population Employed in Health Technologists in Illinois is 4.4%.
What is the Percentage of Population Employed in Health Technologists in the United States?
Percentage of Population Employed in Health Technologists in the United States is 4.3%.