Zip Codes with the Highest Percentage of Population Employed in Education Instruction & Library in Quincy, IL
RELATED REPORTS & OPTIONS
Education Instruction & Library
Quincy
Compare Zip Codes
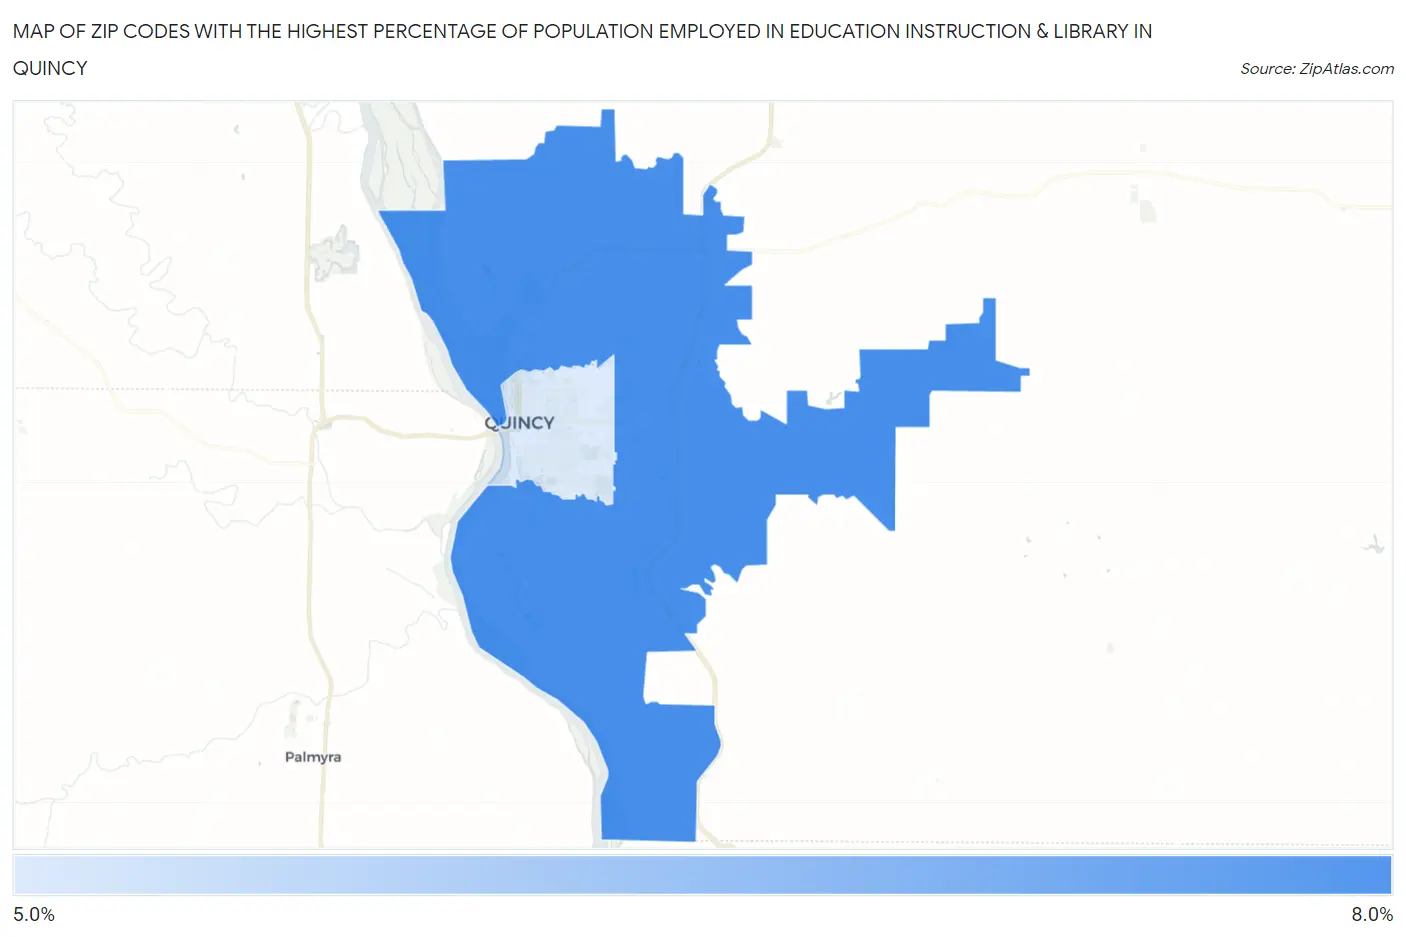
Map of Zip Codes with the Highest Percentage of Population Employed in Education Instruction & Library in Quincy
5.4%
6.1%
Zip Codes with the Highest Percentage of Population Employed in Education Instruction & Library in Quincy, IL
| Zip Code | % Employed | vs State | vs National | |
| 1. | 62305 | 6.1% | 6.3%(-0.195)#525 | 6.2%(-0.083)#13,115 |
| 2. | 62301 | 5.4% | 6.3%(-0.938)#657 | 6.2%(-0.825)#16,157 |
1
Common Questions
What are the Top Zip Codes with the Highest Percentage of Population Employed in Education Instruction & Library in Quincy, IL?
Top Zip Codes with the Highest Percentage of Population Employed in Education Instruction & Library in Quincy, IL are:
What zip code has the Highest Percentage of Population Employed in Education Instruction & Library in Quincy, IL?
62305 has the Highest Percentage of Population Employed in Education Instruction & Library in Quincy, IL with 6.1%.
What is the Percentage of Population Employed in Education Instruction & Library in Quincy, IL?
Percentage of Population Employed in Education Instruction & Library in Quincy is 5.2%.
What is the Percentage of Population Employed in Education Instruction & Library in Illinois?
Percentage of Population Employed in Education Instruction & Library in Illinois is 6.3%.
What is the Percentage of Population Employed in Education Instruction & Library in the United States?
Percentage of Population Employed in Education Instruction & Library in the United States is 6.2%.