Columbus, IL Map & Demographics
Columbus Map
Columbus Overview
$29,559
PER CAPITA INCOME
$96,250
AVG FAMILY INCOME
$71,250
AVG HOUSEHOLD INCOME
0.34
INEQUALITY / GINI INDEX
106
TOTAL POPULATION
50
MALE POPULATION
56
FEMALE POPULATION
89.29
MALES / 100 FEMALES
112.00
FEMALES / 100 MALES
36.6
MEDIAN AGE
3.4
AVG FAMILY SIZE
2.5
AVG HOUSEHOLD SIZE
54
LABOR FORCE [ PEOPLE ]
66.7%
PERCENT IN LABOR FORCE
Columbus Area Codes
Income in Columbus
Income Overview in Columbus
Per Capita Income in Columbus is $29,559, while median incomes of families and households are $96,250 and $71,250 respectively.
| Characteristic | Number | Measure |
| Per Capita Income | 106 | $29,559 |
| Median Family Income | 26 | $96,250 |
| Mean Family Income | 26 | $93,538 |
| Median Household Income | 42 | $71,250 |
| Mean Household Income | 42 | $78,017 |
| Income Deficit | 26 | $0 |
| Wage / Income Gap (%) | 106 | 0.00% |
| Wage / Income Gap ($) | 106 | 100.00¢ per $1 |
| Gini / Inequality Index | 106 | 0.34 |
Earnings by Sex in Columbus
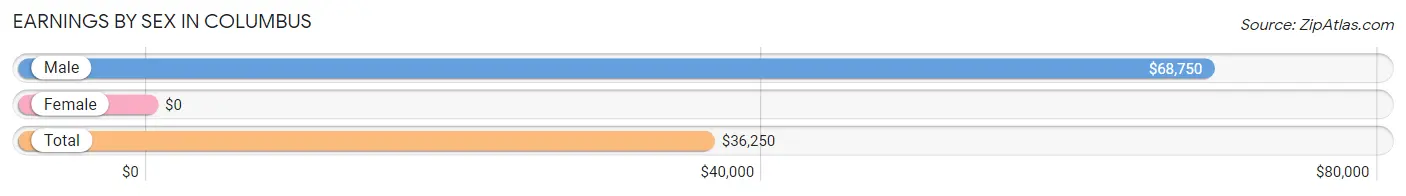
| Sex | Number | Average Earnings |
| Male | 29 (50.0%) | $68,750 |
| Female | 29 (50.0%) | $0 |
| Total | 58 (100.0%) | $36,250 |
Earnings by Sex by Income Bracket in Columbus
The most common earnings brackets in Columbus are $75,000 to $99,999 for men (11 | 37.9%) and $2,499 or less for women (5 | 17.2%).
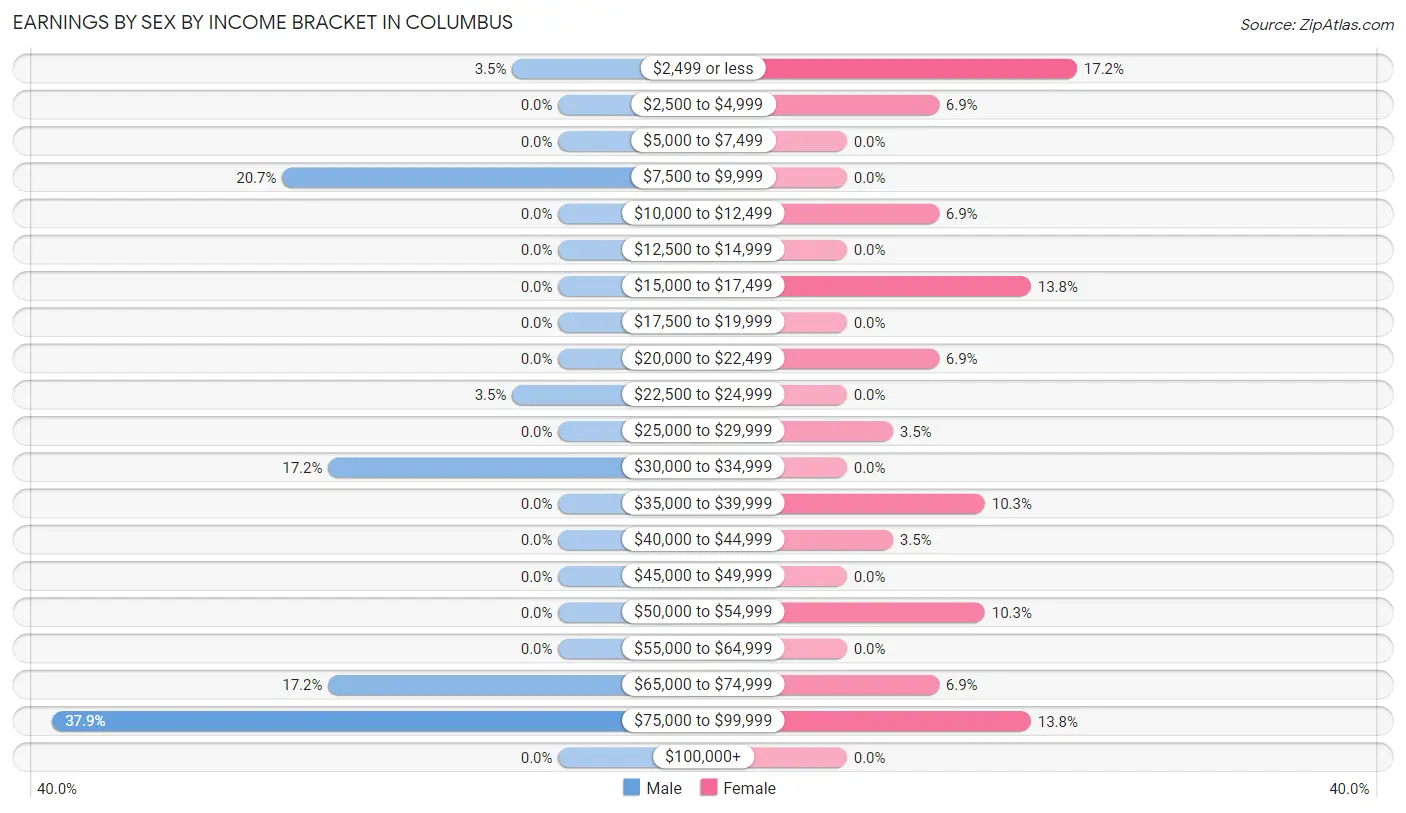
| Income | Male | Female |
| $2,499 or less | 1 (3.5%) | 5 (17.2%) |
| $2,500 to $4,999 | 0 (0.0%) | 2 (6.9%) |
| $5,000 to $7,499 | 0 (0.0%) | 0 (0.0%) |
| $7,500 to $9,999 | 6 (20.7%) | 0 (0.0%) |
| $10,000 to $12,499 | 0 (0.0%) | 2 (6.9%) |
| $12,500 to $14,999 | 0 (0.0%) | 0 (0.0%) |
| $15,000 to $17,499 | 0 (0.0%) | 4 (13.8%) |
| $17,500 to $19,999 | 0 (0.0%) | 0 (0.0%) |
| $20,000 to $22,499 | 0 (0.0%) | 2 (6.9%) |
| $22,500 to $24,999 | 1 (3.5%) | 0 (0.0%) |
| $25,000 to $29,999 | 0 (0.0%) | 1 (3.5%) |
| $30,000 to $34,999 | 5 (17.2%) | 0 (0.0%) |
| $35,000 to $39,999 | 0 (0.0%) | 3 (10.3%) |
| $40,000 to $44,999 | 0 (0.0%) | 1 (3.5%) |
| $45,000 to $49,999 | 0 (0.0%) | 0 (0.0%) |
| $50,000 to $54,999 | 0 (0.0%) | 3 (10.3%) |
| $55,000 to $64,999 | 0 (0.0%) | 0 (0.0%) |
| $65,000 to $74,999 | 5 (17.2%) | 2 (6.9%) |
| $75,000 to $99,999 | 11 (37.9%) | 4 (13.8%) |
| $100,000+ | 0 (0.0%) | 0 (0.0%) |
| Total | 29 (100.0%) | 29 (100.0%) |
Earnings by Sex by Educational Attainment in Columbus
Average earnings in Columbus are $70,625 for men and $40,000 for women, a difference of 43.4%. Men with an educational attainment of college or associate's degree enjoy the highest average annual earnings of $70,000, while those with high school diploma education earn the least with $69,375. Women with an educational attainment of bachelor's degree earn the most with the average annual earnings of $54,167, while those with high school diploma education have the smallest earnings of $38,333.
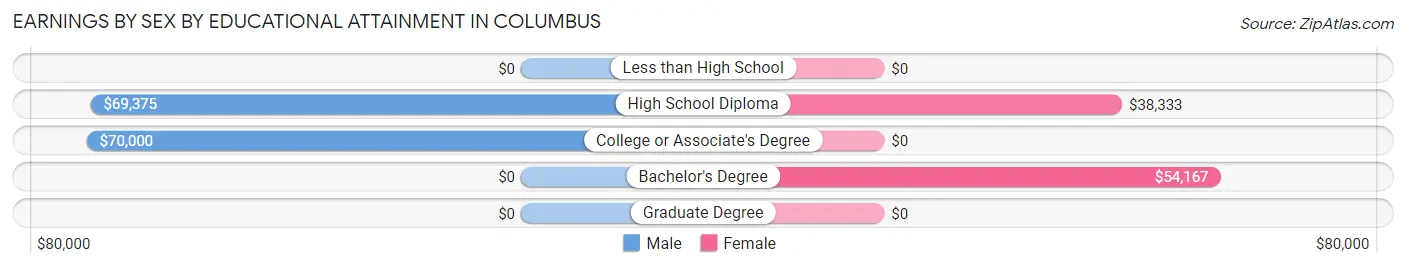
| Educational Attainment | Male Income | Female Income |
| Less than High School | - | - |
| High School Diploma | $69,375 | $38,333 |
| College or Associate's Degree | $70,000 | $0 |
| Bachelor's Degree | - | - |
| Graduate Degree | - | - |
| Total | $70,625 | $40,000 |
Family Income in Columbus
Family Income Brackets in Columbus
According to the Columbus family income data, there are 11 families falling into the $100,000 to $149,999 income range, which is the most common income bracket and makes up 42.3% of all families.
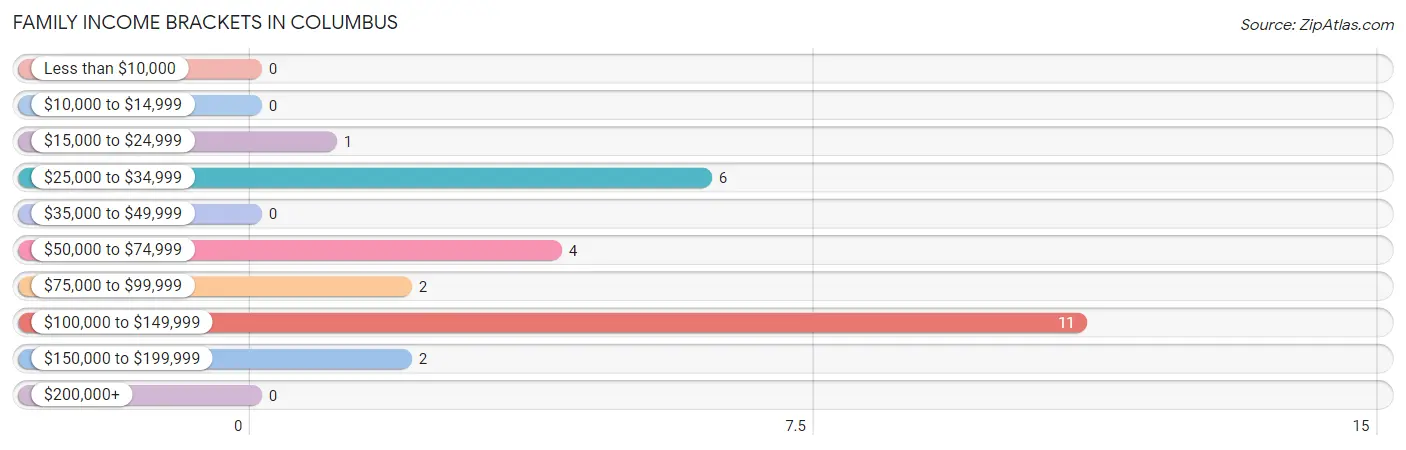
| Income Bracket | # Families | % Families |
| Less than $10,000 | 0 | 0.0% |
| $10,000 to $14,999 | 0 | 0.0% |
| $15,000 to $24,999 | 1 | 3.8% |
| $25,000 to $34,999 | 6 | 23.1% |
| $35,000 to $49,999 | 0 | 0.0% |
| $50,000 to $74,999 | 4 | 15.4% |
| $75,000 to $99,999 | 2 | 7.7% |
| $100,000 to $149,999 | 11 | 42.3% |
| $150,000 to $199,999 | 2 | 7.7% |
| $200,000+ | 0 | 0.0% |
Family Income by Famaliy Size in Columbus
2-person families (9 | 34.6%) account for the highest median family income in Columbus with $137,813 per family, while 2-person families (9 | 34.6%) have the highest median income of $68,906 per family member.
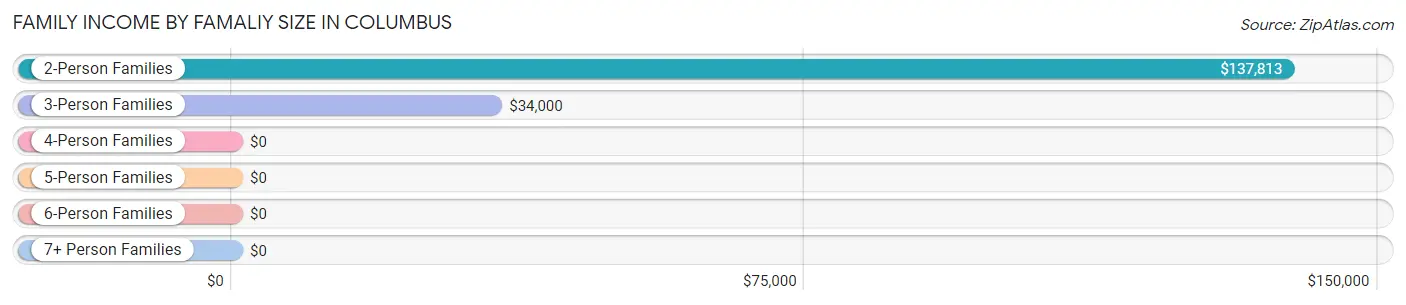
| Income Bracket | # Families | Median Income |
| 2-Person Families | 9 (34.6%) | $137,813 |
| 3-Person Families | 8 (30.8%) | $34,000 |
| 4-Person Families | 2 (7.7%) | $0 |
| 5-Person Families | 4 (15.4%) | $0 |
| 6-Person Families | 3 (11.5%) | $0 |
| 7+ Person Families | 0 (0.0%) | $0 |
| Total | 26 (100.0%) | $96,250 |
Family Income by Number of Earners in Columbus
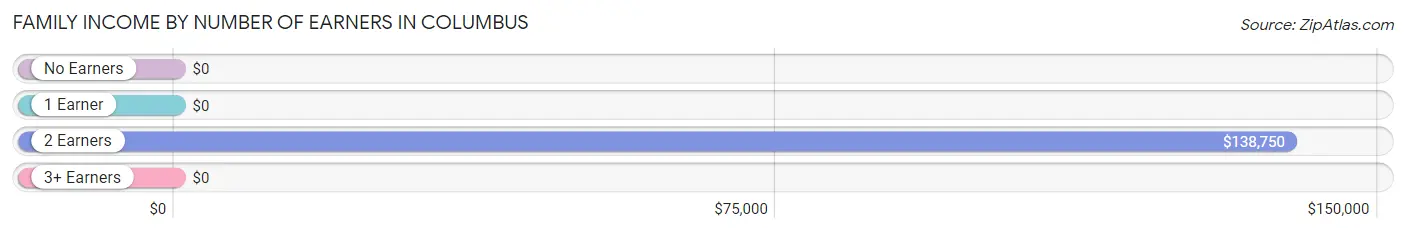
| Number of Earners | # Families | Median Income |
| No Earners | 0 (0.0%) | $0 |
| 1 Earner | 12 (46.2%) | $0 |
| 2 Earners | 8 (30.8%) | $138,750 |
| 3+ Earners | 6 (23.1%) | $0 |
| Total | 26 (100.0%) | $96,250 |
Household Income in Columbus
Household Income Brackets in Columbus
With 11 households falling in the category, the $100,000 to $149,999 income range is the most frequent in Columbus, accounting for 26.2% of all households.
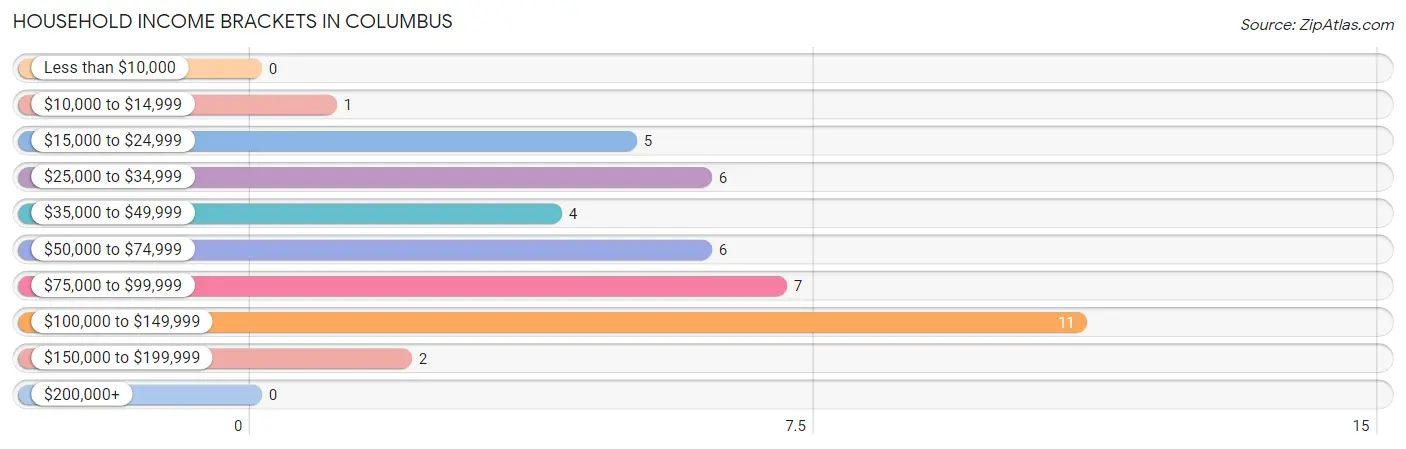
| Income Bracket | # Households | % Households |
| Less than $10,000 | 0 | 0.0% |
| $10,000 to $14,999 | 1 | 2.4% |
| $15,000 to $24,999 | 5 | 11.9% |
| $25,000 to $34,999 | 6 | 14.3% |
| $35,000 to $49,999 | 4 | 9.5% |
| $50,000 to $74,999 | 6 | 14.3% |
| $75,000 to $99,999 | 7 | 16.7% |
| $100,000 to $149,999 | 11 | 26.2% |
| $150,000 to $199,999 | 2 | 4.8% |
| $200,000+ | 0 | 0.0% |
Household Income by Householder Age in Columbus
The median household income in Columbus is $71,250, with the highest median household income of $85,938 found in the 45 to 64 years age bracket for the primary householder. A total of 13 households (30.9%) fall into this category. Meanwhile, the 15 to 24 years age bracket for the primary householder has the lowest median household income of $0, with 1 households (2.4%) in this group.
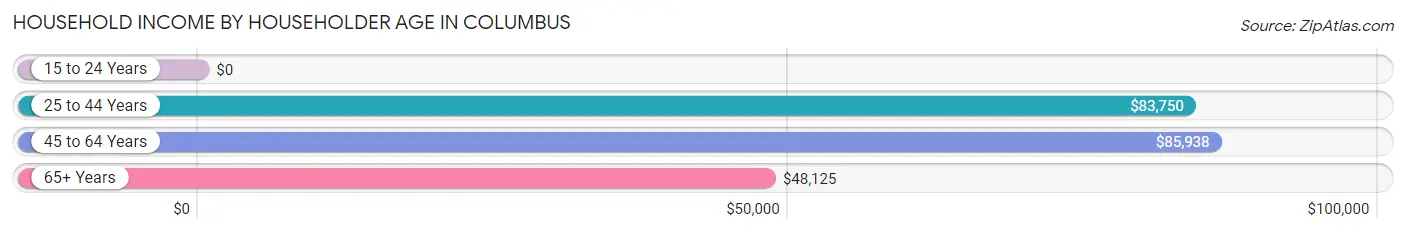
| Income Bracket | # Households | Median Income |
| 15 to 24 Years | 1 (2.4%) | $0 |
| 25 to 44 Years | 17 (40.5%) | $83,750 |
| 45 to 64 Years | 13 (30.9%) | $85,938 |
| 65+ Years | 11 (26.2%) | $48,125 |
| Total | 42 (100.0%) | $71,250 |
Poverty in Columbus
Income Below Poverty by Sex and Age in Columbus
With 4.0% poverty level for males and 10.7% for females among the residents of Columbus, 25 to 34 year old males and 65 to 74 year old females are the most vulnerable to poverty, with 2 males (40.0%) and 2 females (40.0%) in their respective age groups living below the poverty level.
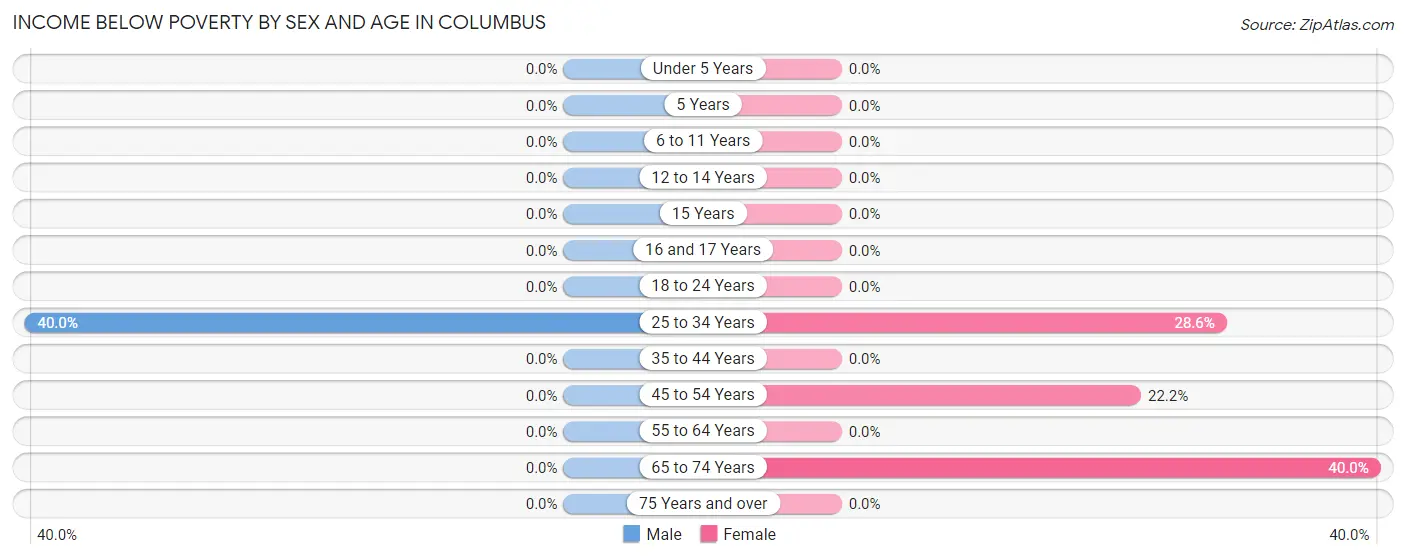
| Age Bracket | Male | Female |
| Under 5 Years | 0 (0.0%) | 0 (0.0%) |
| 5 Years | 0 (0.0%) | 0 (0.0%) |
| 6 to 11 Years | 0 (0.0%) | 0 (0.0%) |
| 12 to 14 Years | 0 (0.0%) | 0 (0.0%) |
| 15 Years | 0 (0.0%) | 0 (0.0%) |
| 16 and 17 Years | 0 (0.0%) | 0 (0.0%) |
| 18 to 24 Years | 0 (0.0%) | 0 (0.0%) |
| 25 to 34 Years | 2 (40.0%) | 2 (28.6%) |
| 35 to 44 Years | 0 (0.0%) | 0 (0.0%) |
| 45 to 54 Years | 0 (0.0%) | 2 (22.2%) |
| 55 to 64 Years | 0 (0.0%) | 0 (0.0%) |
| 65 to 74 Years | 0 (0.0%) | 2 (40.0%) |
| 75 Years and over | 0 (0.0%) | 0 (0.0%) |
| Total | 2 (4.0%) | 6 (10.7%) |
Income Above Poverty by Sex and Age in Columbus
According to the poverty statistics in Columbus, males aged under 5 years and females aged under 5 years are the age groups that are most secure financially, with 100.0% of males and 100.0% of females in these age groups living above the poverty line.
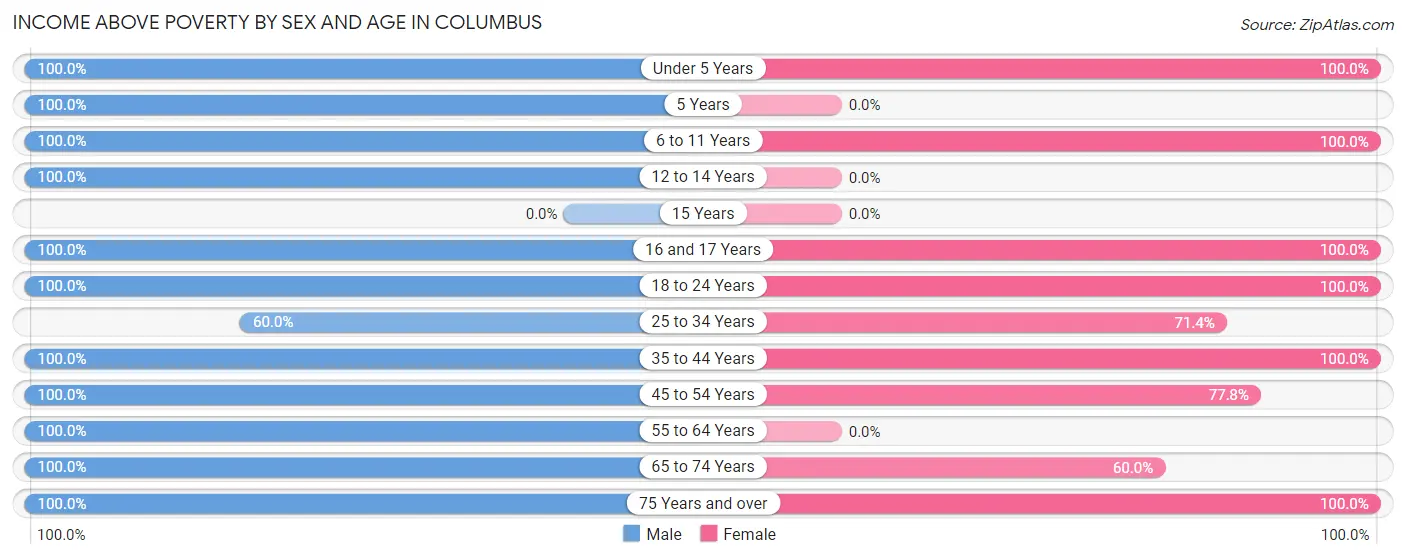
| Age Bracket | Male | Female |
| Under 5 Years | 2 (100.0%) | 6 (100.0%) |
| 5 Years | 1 (100.0%) | 0 (0.0%) |
| 6 to 11 Years | 2 (100.0%) | 3 (100.0%) |
| 12 to 14 Years | 11 (100.0%) | 0 (0.0%) |
| 15 Years | 0 (0.0%) | 0 (0.0%) |
| 16 and 17 Years | 3 (100.0%) | 4 (100.0%) |
| 18 to 24 Years | 1 (100.0%) | 5 (100.0%) |
| 25 to 34 Years | 3 (60.0%) | 5 (71.4%) |
| 35 to 44 Years | 6 (100.0%) | 13 (100.0%) |
| 45 to 54 Years | 6 (100.0%) | 7 (77.8%) |
| 55 to 64 Years | 6 (100.0%) | 0 (0.0%) |
| 65 to 74 Years | 4 (100.0%) | 3 (60.0%) |
| 75 Years and over | 3 (100.0%) | 4 (100.0%) |
| Total | 48 (96.0%) | 50 (89.3%) |
Income Below Poverty Among Married-Couple Families in Columbus
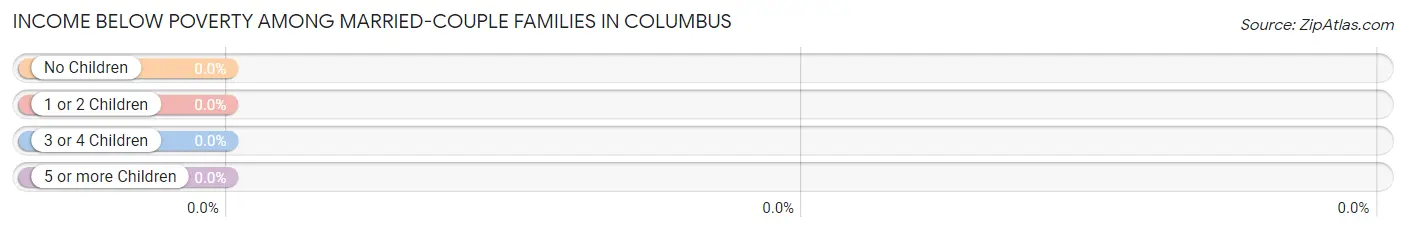
| Children | Above Poverty | Below Poverty |
| No Children | 8 (100.0%) | 0 (0.0%) |
| 1 or 2 Children | 11 (100.0%) | 0 (0.0%) |
| 3 or 4 Children | 4 (100.0%) | 0 (0.0%) |
| 5 or more Children | 0 (0.0%) | 0 (0.0%) |
| Total | 23 (100.0%) | 0 (0.0%) |
Income Below Poverty Among Single-Parent Households in Columbus
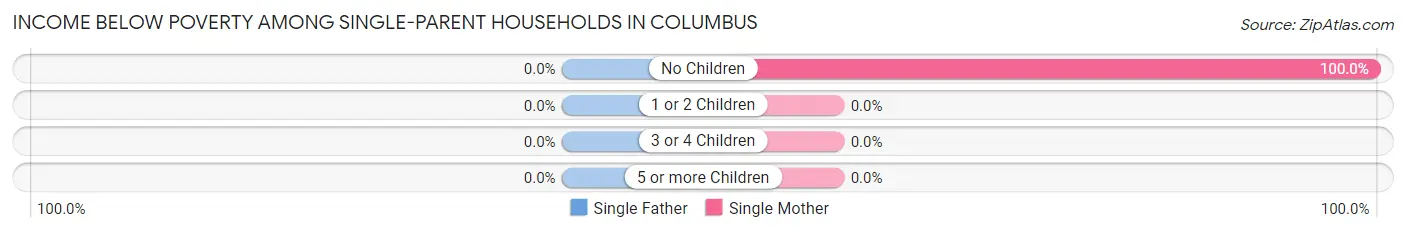
| Children | Single Father | Single Mother |
| No Children | 0 (0.0%) | 1 (100.0%) |
| 1 or 2 Children | 0 (0.0%) | 0 (0.0%) |
| 3 or 4 Children | 0 (0.0%) | 0 (0.0%) |
| 5 or more Children | 0 (0.0%) | 0 (0.0%) |
| Total | 0 (0.0%) | 1 (33.3%) |
Income Below Poverty Among Married-Couple vs Single-Parent Households in Columbus
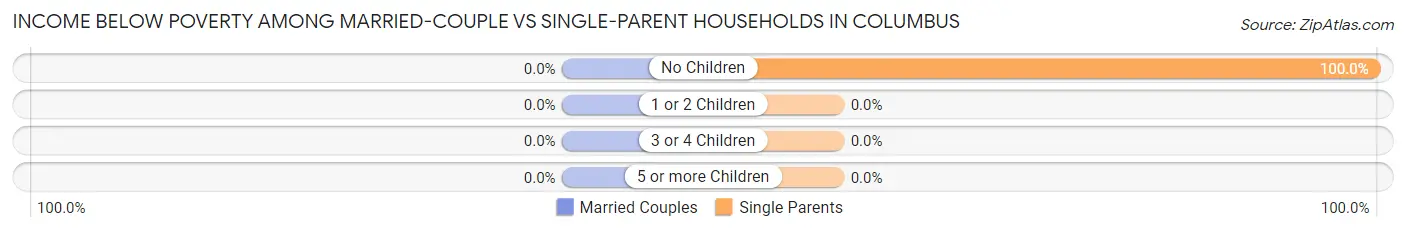
| Children | Married-Couple Families | Single-Parent Households |
| No Children | 0 (0.0%) | 1 (100.0%) |
| 1 or 2 Children | 0 (0.0%) | 0 (0.0%) |
| 3 or 4 Children | 0 (0.0%) | 0 (0.0%) |
| 5 or more Children | 0 (0.0%) | 0 (0.0%) |
| Total | 0 (0.0%) | 1 (33.3%) |
Race in Columbus
The most populous races in Columbus are White / Caucasian (105 | 99.1%), and Native / Alaskan (1 | 0.9%).
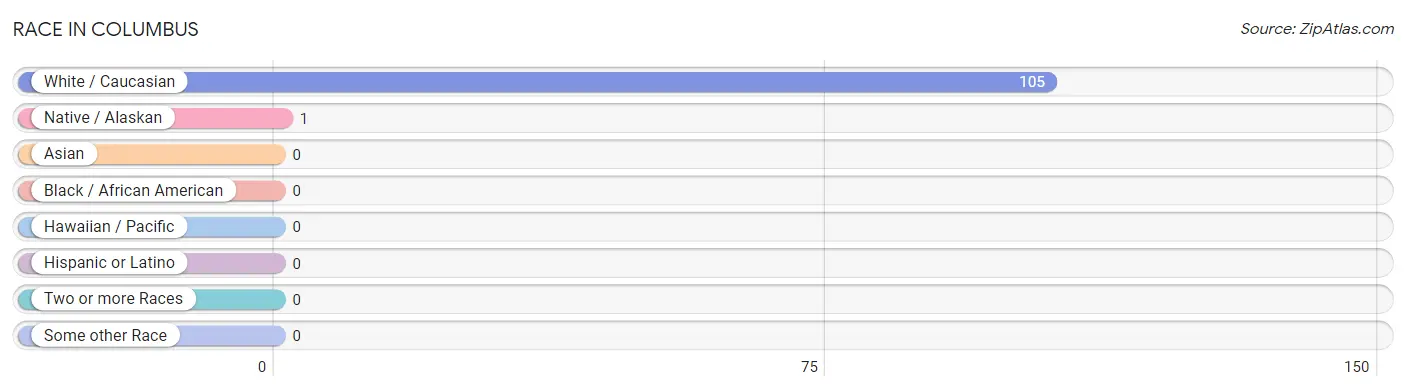
| Race | # Population | % Population |
| Asian | 0 | 0.0% |
| Black / African American | 0 | 0.0% |
| Hawaiian / Pacific | 0 | 0.0% |
| Hispanic or Latino | 0 | 0.0% |
| Native / Alaskan | 1 | 0.9% |
| White / Caucasian | 105 | 99.1% |
| Two or more Races | 0 | 0.0% |
| Some other Race | 0 | 0.0% |
| Total | 106 | 100.0% |
Ancestry in Columbus
The most populous ancestries reported in Columbus are German (32 | 30.2%), American (13 | 12.3%), English (10 | 9.4%), Irish (9 | 8.5%), and Choctaw (1 | 0.9%), together accounting for 61.3% of all Columbus residents.
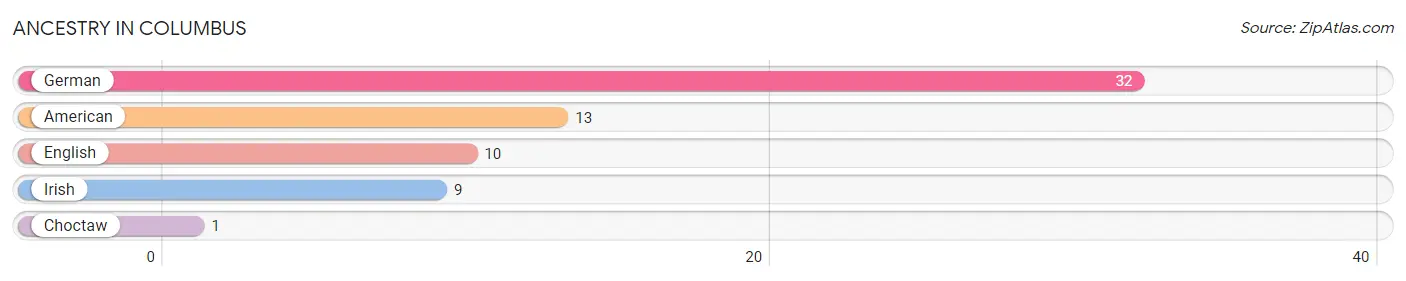
| Ancestry | # Population | % Population |
| American | 13 | 12.3% |
| Choctaw | 1 | 0.9% |
| English | 10 | 9.4% |
| German | 32 | 30.2% |
| Irish | 9 | 8.5% | View All 5 Rows |
Immigrants in Columbus

| Immigration Origin | # Population | % Population | View All 0 Rows |
Sex and Age in Columbus
Sex and Age in Columbus
The most populous age groups in Columbus are 10 to 14 Years (11 | 22.0%) for men and 15 to 19 Years (8 | 14.3%) for women.
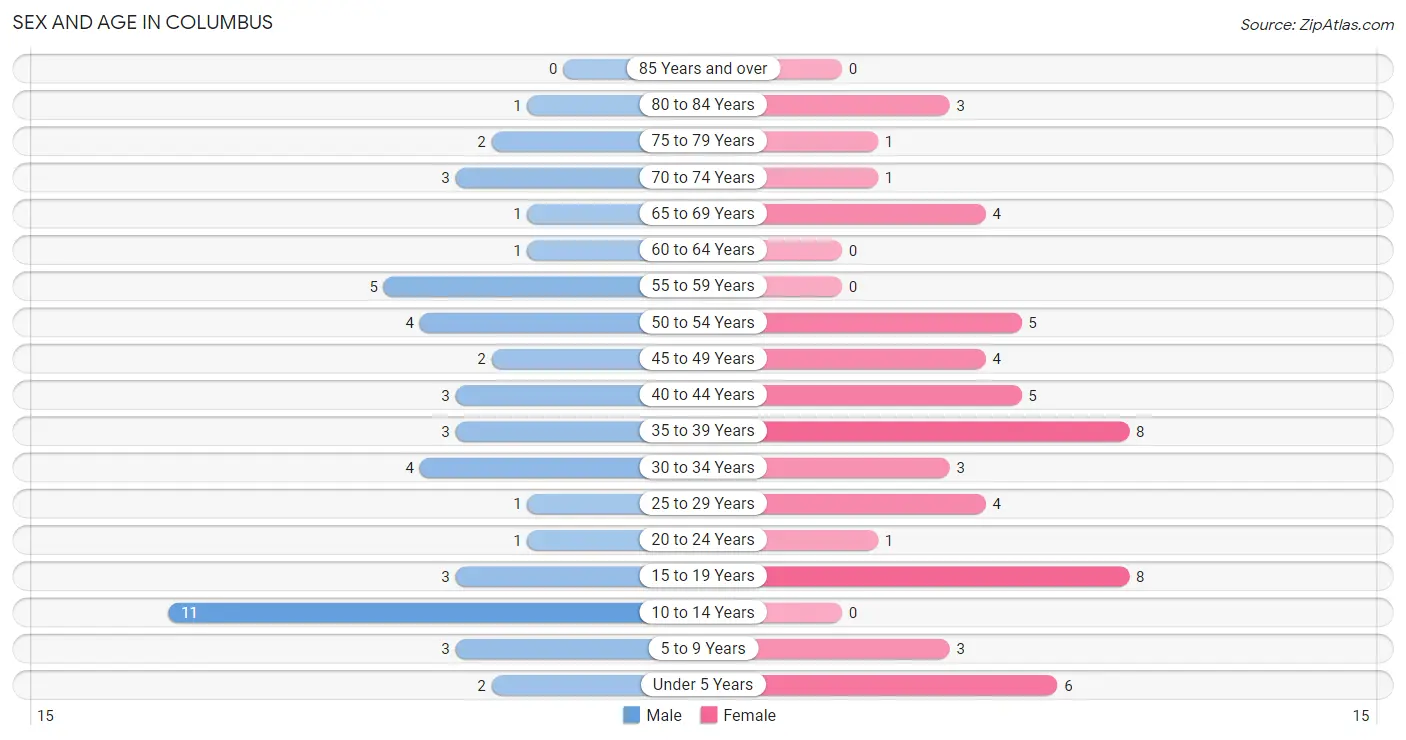
| Age Bracket | Male | Female |
| Under 5 Years | 2 (4.0%) | 6 (10.7%) |
| 5 to 9 Years | 3 (6.0%) | 3 (5.4%) |
| 10 to 14 Years | 11 (22.0%) | 0 (0.0%) |
| 15 to 19 Years | 3 (6.0%) | 8 (14.3%) |
| 20 to 24 Years | 1 (2.0%) | 1 (1.8%) |
| 25 to 29 Years | 1 (2.0%) | 4 (7.1%) |
| 30 to 34 Years | 4 (8.0%) | 3 (5.4%) |
| 35 to 39 Years | 3 (6.0%) | 8 (14.3%) |
| 40 to 44 Years | 3 (6.0%) | 5 (8.9%) |
| 45 to 49 Years | 2 (4.0%) | 4 (7.1%) |
| 50 to 54 Years | 4 (8.0%) | 5 (8.9%) |
| 55 to 59 Years | 5 (10.0%) | 0 (0.0%) |
| 60 to 64 Years | 1 (2.0%) | 0 (0.0%) |
| 65 to 69 Years | 1 (2.0%) | 4 (7.1%) |
| 70 to 74 Years | 3 (6.0%) | 1 (1.8%) |
| 75 to 79 Years | 2 (4.0%) | 1 (1.8%) |
| 80 to 84 Years | 1 (2.0%) | 3 (5.4%) |
| 85 Years and over | 0 (0.0%) | 0 (0.0%) |
| Total | 50 (100.0%) | 56 (100.0%) |
Families and Households in Columbus
Median Family Size in Columbus
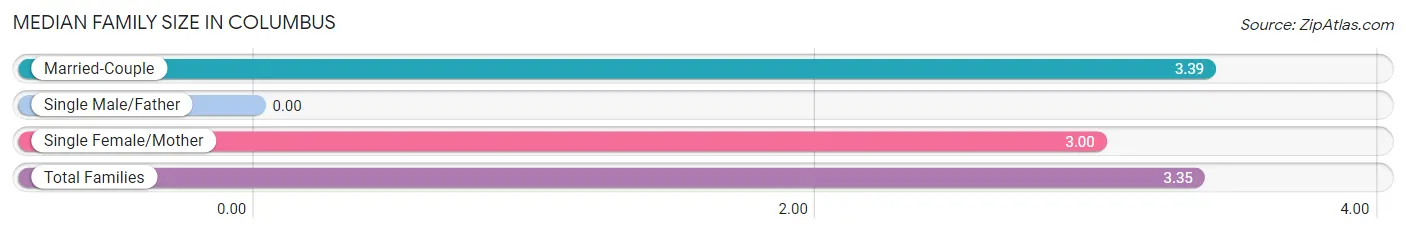
| Family Type | # Families | Family Size |
| Married-Couple | 23 (88.5%) | 3.39 |
| Single Male/Father | 0 (0.0%) | - |
| Single Female/Mother | 3 (11.5%) | 3.00 |
| Total Families | 26 (100.0%) | 3.35 |
Median Household Size in Columbus
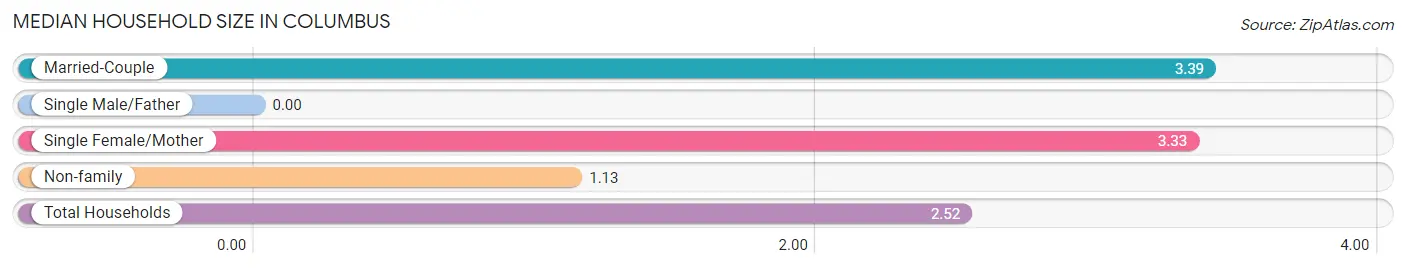
| Household Type | # Households | Household Size |
| Married-Couple | 23 (54.8%) | 3.39 |
| Single Male/Father | 0 (0.0%) | - |
| Single Female/Mother | 3 (7.1%) | 3.33 |
| Non-family | 16 (38.1%) | 1.13 |
| Total Households | 42 (100.0%) | 2.52 |
Household Size by Marriage Status in Columbus
Out of a total of 42 households in Columbus, 26 (61.9%) are family households, while 16 (38.1%) are nonfamily households. The most numerous type of family households are 3-person households, comprising 9, and the most common type of nonfamily households are 1-person households, comprising 14.
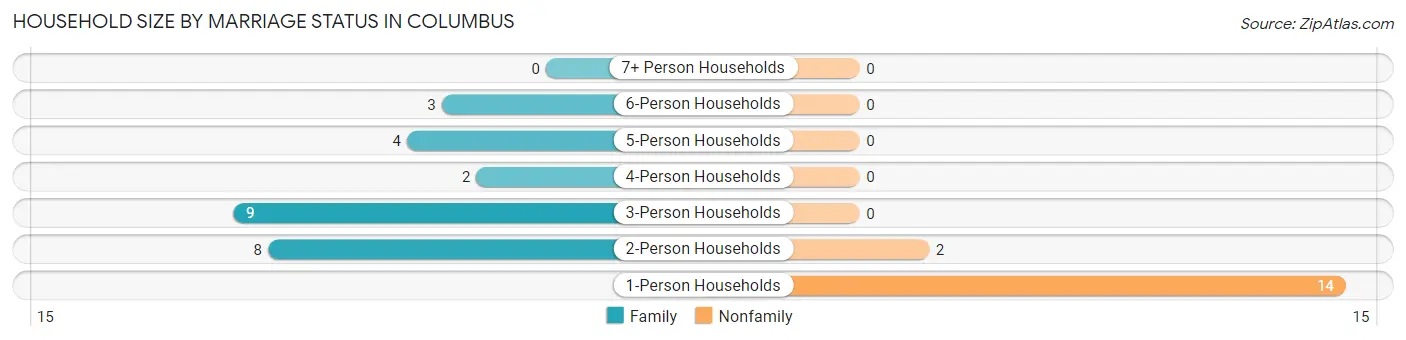
| Household Size | Family Households | Nonfamily Households |
| 1-Person Households | - | 14 (33.3%) |
| 2-Person Households | 8 (19.1%) | 2 (4.8%) |
| 3-Person Households | 9 (21.4%) | 0 (0.0%) |
| 4-Person Households | 2 (4.8%) | 0 (0.0%) |
| 5-Person Households | 4 (9.5%) | 0 (0.0%) |
| 6-Person Households | 3 (7.1%) | 0 (0.0%) |
| 7+ Person Households | 0 (0.0%) | 0 (0.0%) |
| Total | 26 (61.9%) | 16 (38.1%) |
Female Fertility in Columbus
Fertility by Age in Columbus
| Age Bracket | Women with Births | Births / 1,000 Women |
| 15 to 19 years | 0 (0.0%) | 0.0 |
| 20 to 34 years | 0 (0.0%) | 0.0 |
| 35 to 50 years | 0 (0.0%) | 0.0 |
| Total | 0 (0.0%) | 0.0 |
Fertility by Age by Marriage Status in Columbus
| Age Bracket | Married | Unmarried |
| 15 to 19 years | 0 (0.0%) | 0 (0.0%) |
| 20 to 34 years | 0 (0.0%) | 0 (0.0%) |
| 35 to 50 years | 0 (0.0%) | 0 (0.0%) |
| Total | 0 (0.0%) | 0 (0.0%) |
Fertility by Education in Columbus
| Educational Attainment | Women with Births | Births / 1,000 Women |
| Less than High School | 0 (0.0%) | 0.0 |
| High School Diploma | 0 (0.0%) | 0.0 |
| College or Associate's Degree | 0 (0.0%) | 0.0 |
| Bachelor's Degree | 0 (0.0%) | 0.0 |
| Graduate Degree | 0 (0.0%) | 0.0 |
| Total | 0 (0.0%) | 0.0 |
Fertility by Education by Marriage Status in Columbus
| Educational Attainment | Married | Unmarried |
| Less than High School | 0 (0.0%) | 0 (0.0%) |
| High School Diploma | 0 (0.0%) | 0 (0.0%) |
| College or Associate's Degree | 0 (0.0%) | 0 (0.0%) |
| Bachelor's Degree | 0 (0.0%) | 0 (0.0%) |
| Graduate Degree | 0 (0.0%) | 0 (0.0%) |
| Total | 0 (0.0%) | 0 (0.0%) |
Employment Characteristics in Columbus
Employment by Class of Employer in Columbus
Among the 54 employed individuals in Columbus, private company employees (39 | 72.2%), not-for-profit organizations (6 | 11.1%), and state government employees (6 | 11.1%) make up the most common classes of employment.
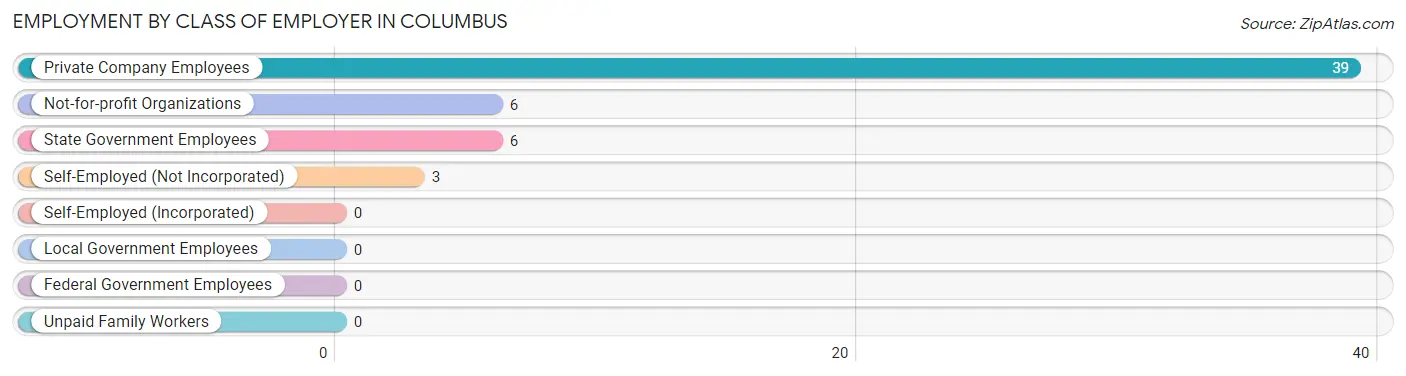
| Employer Class | # Employees | % Employees |
| Private Company Employees | 39 | 72.2% |
| Self-Employed (Incorporated) | 0 | 0.0% |
| Self-Employed (Not Incorporated) | 3 | 5.6% |
| Not-for-profit Organizations | 6 | 11.1% |
| Local Government Employees | 0 | 0.0% |
| State Government Employees | 6 | 11.1% |
| Federal Government Employees | 0 | 0.0% |
| Unpaid Family Workers | 0 | 0.0% |
| Total | 54 | 100.0% |
Employment Status by Age in Columbus
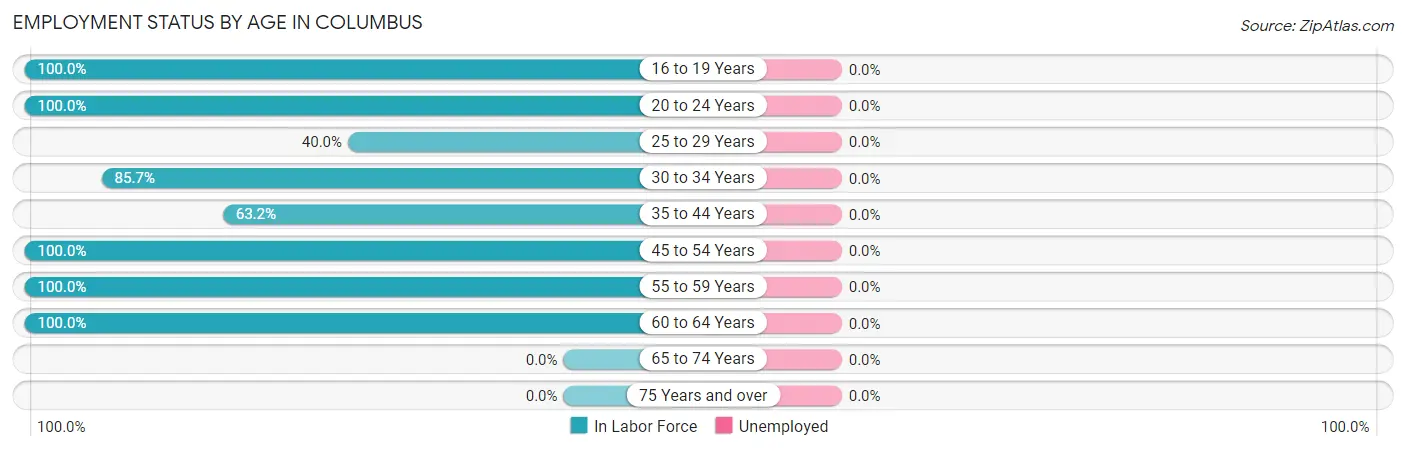
| Age Bracket | In Labor Force | Unemployed |
| 16 to 19 Years | 11 (100.0%) | 0 (0.0%) |
| 20 to 24 Years | 2 (100.0%) | 0 (0.0%) |
| 25 to 29 Years | 2 (40.0%) | 0 (0.0%) |
| 30 to 34 Years | 6 (85.7%) | 0 (0.0%) |
| 35 to 44 Years | 12 (63.2%) | 0 (0.0%) |
| 45 to 54 Years | 15 (100.0%) | 0 (0.0%) |
| 55 to 59 Years | 5 (100.0%) | 0 (0.0%) |
| 60 to 64 Years | 1 (100.0%) | 0 (0.0%) |
| 65 to 74 Years | 0 (0.0%) | 0 (0.0%) |
| 75 Years and over | 0 (0.0%) | 0 (0.0%) |
| Total | 54 (66.7%) | 0 (0.0%) |
Employment Status by Educational Attainment in Columbus
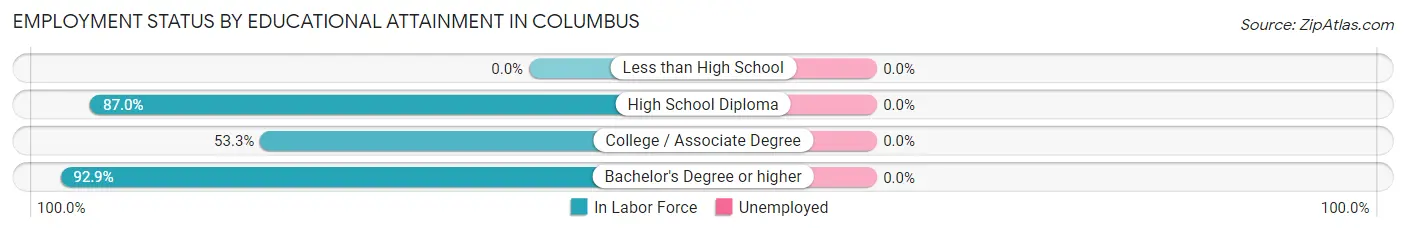
| Educational Attainment | In Labor Force | Unemployed |
| Less than High School | 0 (0.0%) | 0 (0.0%) |
| High School Diploma | 20 (87.0%) | 0 (0.0%) |
| College / Associate Degree | 8 (53.3%) | 0 (0.0%) |
| Bachelor's Degree or higher | 13 (92.9%) | 0 (0.0%) |
| Total | 41 (78.8%) | 0 (0.0%) |
Employment Occupations by Sex in Columbus
Management, Business, Science and Arts Occupations
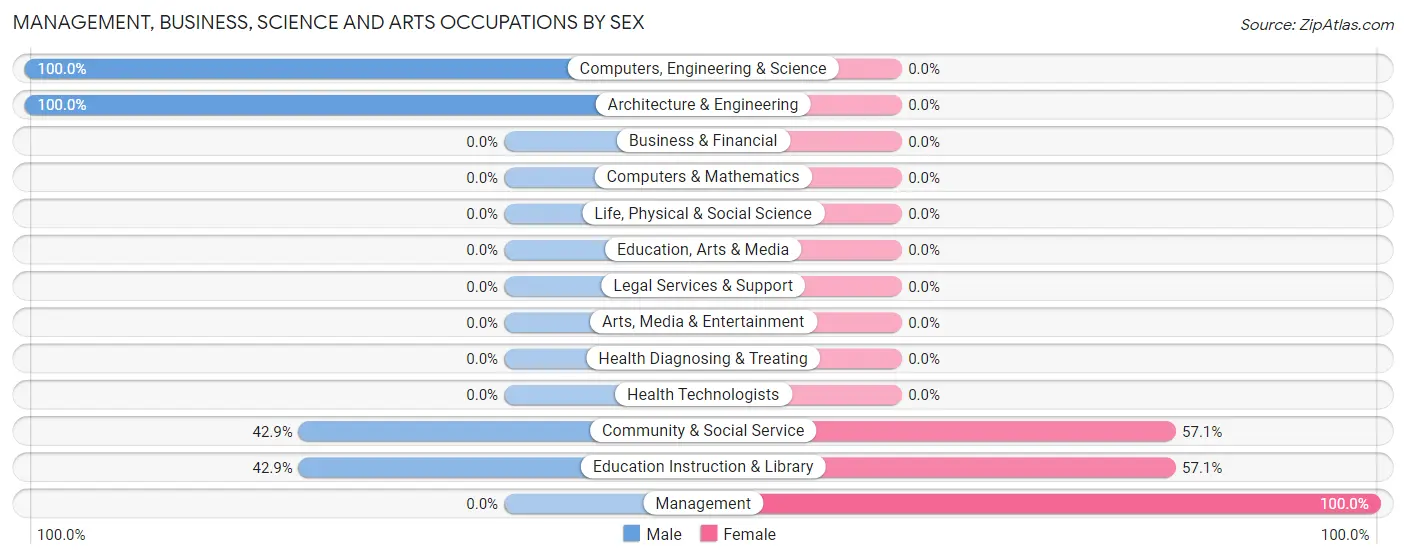
The most common Management, Business, Science and Arts occupations in Columbus are Community & Social Service (7 | 13.0%), Education Instruction & Library (7 | 13.0%), Management (6 | 11.1%), Computers, Engineering & Science (1 | 1.8%), and Architecture & Engineering (1 | 1.8%).
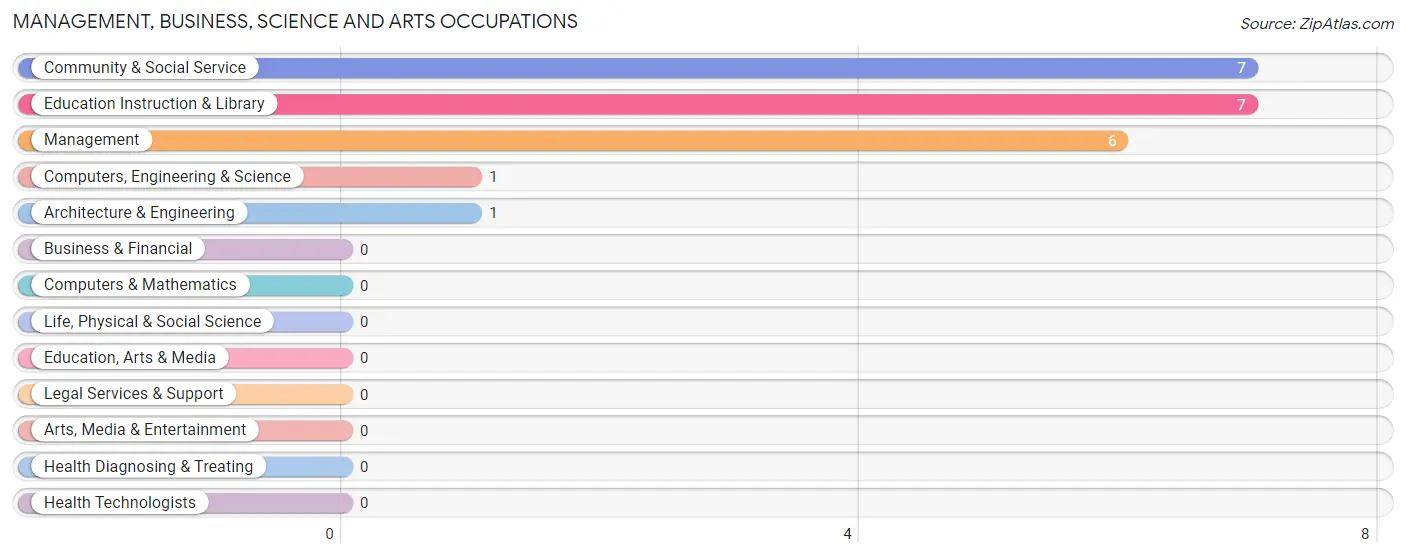
Management, Business, Science and Arts Occupations by Sex
Within the Management, Business, Science and Arts occupations in Columbus, the most male-oriented occupations are Computers, Engineering & Science (100.0%), Architecture & Engineering (100.0%), and Community & Social Service (42.9%), while the most female-oriented occupations are Management (100.0%), Community & Social Service (57.1%), and Education Instruction & Library (57.1%).
| Occupation | Male | Female |
| Management | 0 (0.0%) | 6 (100.0%) |
| Business & Financial | 0 (0.0%) | 0 (0.0%) |
| Computers, Engineering & Science | 1 (100.0%) | 0 (0.0%) |
| Computers & Mathematics | 0 (0.0%) | 0 (0.0%) |
| Architecture & Engineering | 1 (100.0%) | 0 (0.0%) |
| Life, Physical & Social Science | 0 (0.0%) | 0 (0.0%) |
| Community & Social Service | 3 (42.9%) | 4 (57.1%) |
| Education, Arts & Media | 0 (0.0%) | 0 (0.0%) |
| Legal Services & Support | 0 (0.0%) | 0 (0.0%) |
| Education Instruction & Library | 3 (42.9%) | 4 (57.1%) |
| Arts, Media & Entertainment | 0 (0.0%) | 0 (0.0%) |
| Health Diagnosing & Treating | 0 (0.0%) | 0 (0.0%) |
| Health Technologists | 0 (0.0%) | 0 (0.0%) |
| Total (Category) | 4 (28.6%) | 10 (71.4%) |
| Total (Overall) | 26 (48.1%) | 28 (51.8%) |
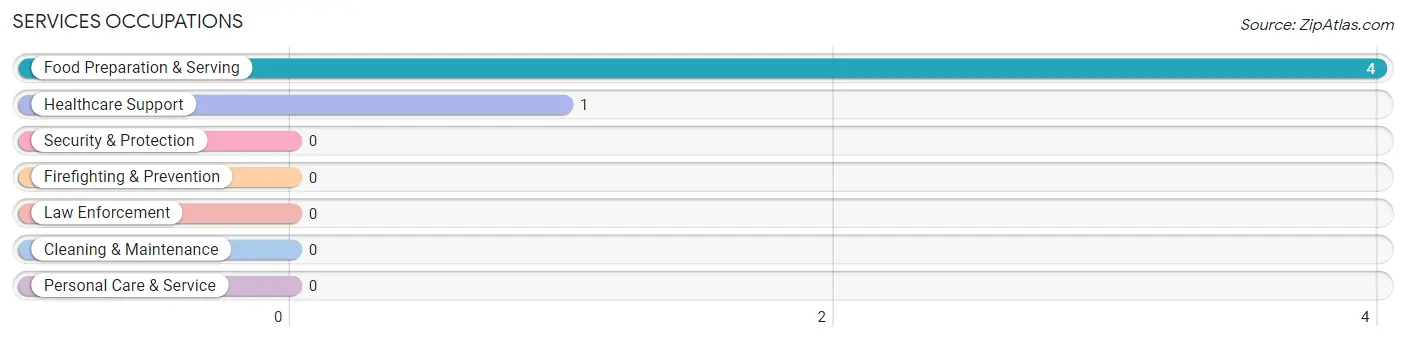
Services Occupations
The most common Services occupations in Columbus are Food Preparation & Serving (4 | 7.4%), and Healthcare Support (1 | 1.8%).
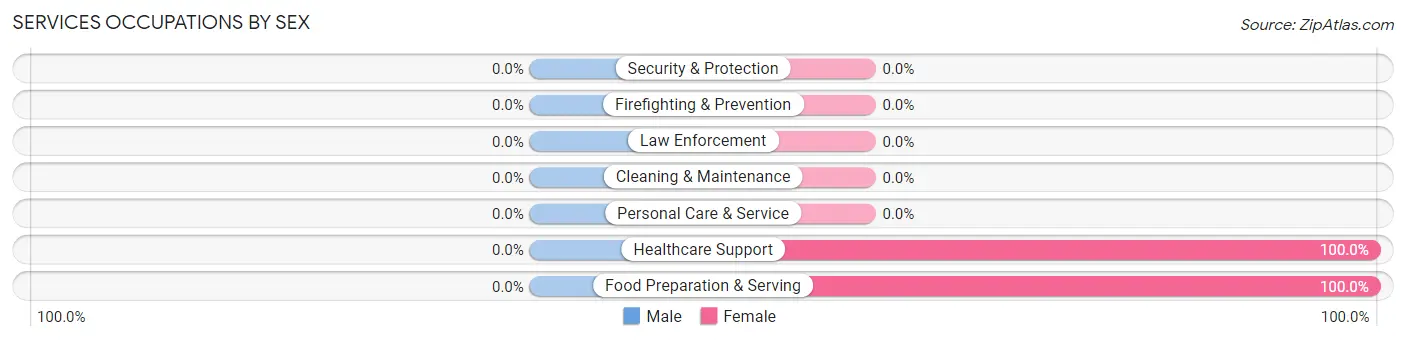
Services Occupations by Sex
| Occupation | Male | Female |
| Healthcare Support | 0 (0.0%) | 1 (100.0%) |
| Security & Protection | 0 (0.0%) | 0 (0.0%) |
| Firefighting & Prevention | 0 (0.0%) | 0 (0.0%) |
| Law Enforcement | 0 (0.0%) | 0 (0.0%) |
| Food Preparation & Serving | 0 (0.0%) | 4 (100.0%) |
| Cleaning & Maintenance | 0 (0.0%) | 0 (0.0%) |
| Personal Care & Service | 0 (0.0%) | 0 (0.0%) |
| Total (Category) | 0 (0.0%) | 5 (100.0%) |
| Total (Overall) | 26 (48.1%) | 28 (51.8%) |
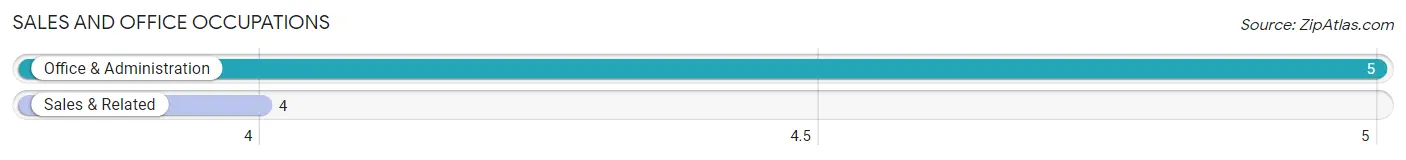
Sales and Office Occupations
The most common Sales and Office occupations in Columbus are Office & Administration (5 | 9.3%), and Sales & Related (4 | 7.4%).
Sales and Office Occupations by Sex

| Occupation | Male | Female |
| Sales & Related | 3 (75.0%) | 1 (25.0%) |
| Office & Administration | 0 (0.0%) | 5 (100.0%) |
| Total (Category) | 3 (33.3%) | 6 (66.7%) |
| Total (Overall) | 26 (48.1%) | 28 (51.8%) |
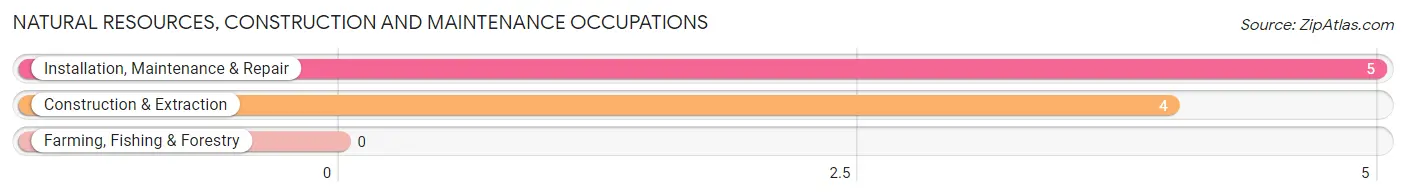
Natural Resources, Construction and Maintenance Occupations
The most common Natural Resources, Construction and Maintenance occupations in Columbus are Installation, Maintenance & Repair (5 | 9.3%), and Construction & Extraction (4 | 7.4%).
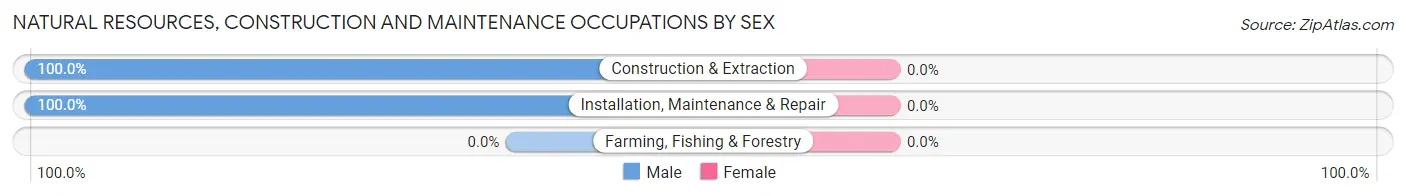
Natural Resources, Construction and Maintenance Occupations by Sex
| Occupation | Male | Female |
| Farming, Fishing & Forestry | 0 (0.0%) | 0 (0.0%) |
| Construction & Extraction | 4 (100.0%) | 0 (0.0%) |
| Installation, Maintenance & Repair | 5 (100.0%) | 0 (0.0%) |
| Total (Category) | 9 (100.0%) | 0 (0.0%) |
| Total (Overall) | 26 (48.1%) | 28 (51.8%) |
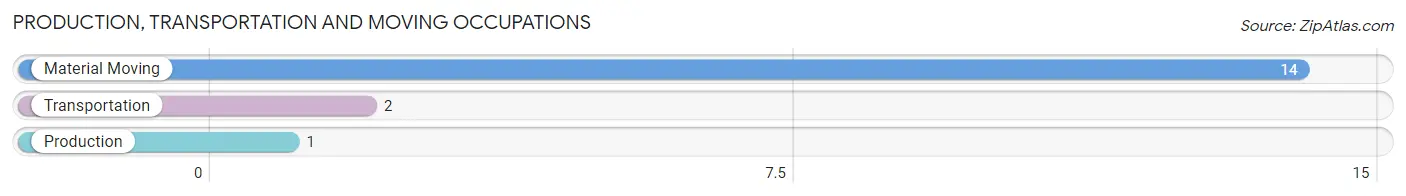
Production, Transportation and Moving Occupations
The most common Production, Transportation and Moving occupations in Columbus are Material Moving (14 | 25.9%), Transportation (2 | 3.7%), and Production (1 | 1.8%).
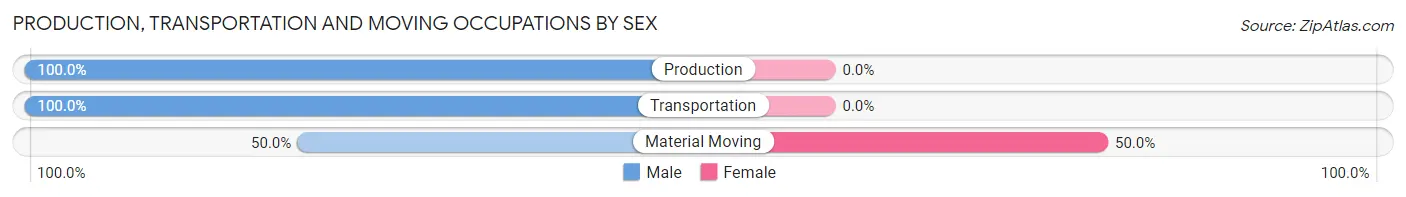
Production, Transportation and Moving Occupations by Sex
| Occupation | Male | Female |
| Production | 1 (100.0%) | 0 (0.0%) |
| Transportation | 2 (100.0%) | 0 (0.0%) |
| Material Moving | 7 (50.0%) | 7 (50.0%) |
| Total (Category) | 10 (58.8%) | 7 (41.2%) |
| Total (Overall) | 26 (48.1%) | 28 (51.8%) |
Employment Industries by Sex in Columbus
Employment Industries in Columbus
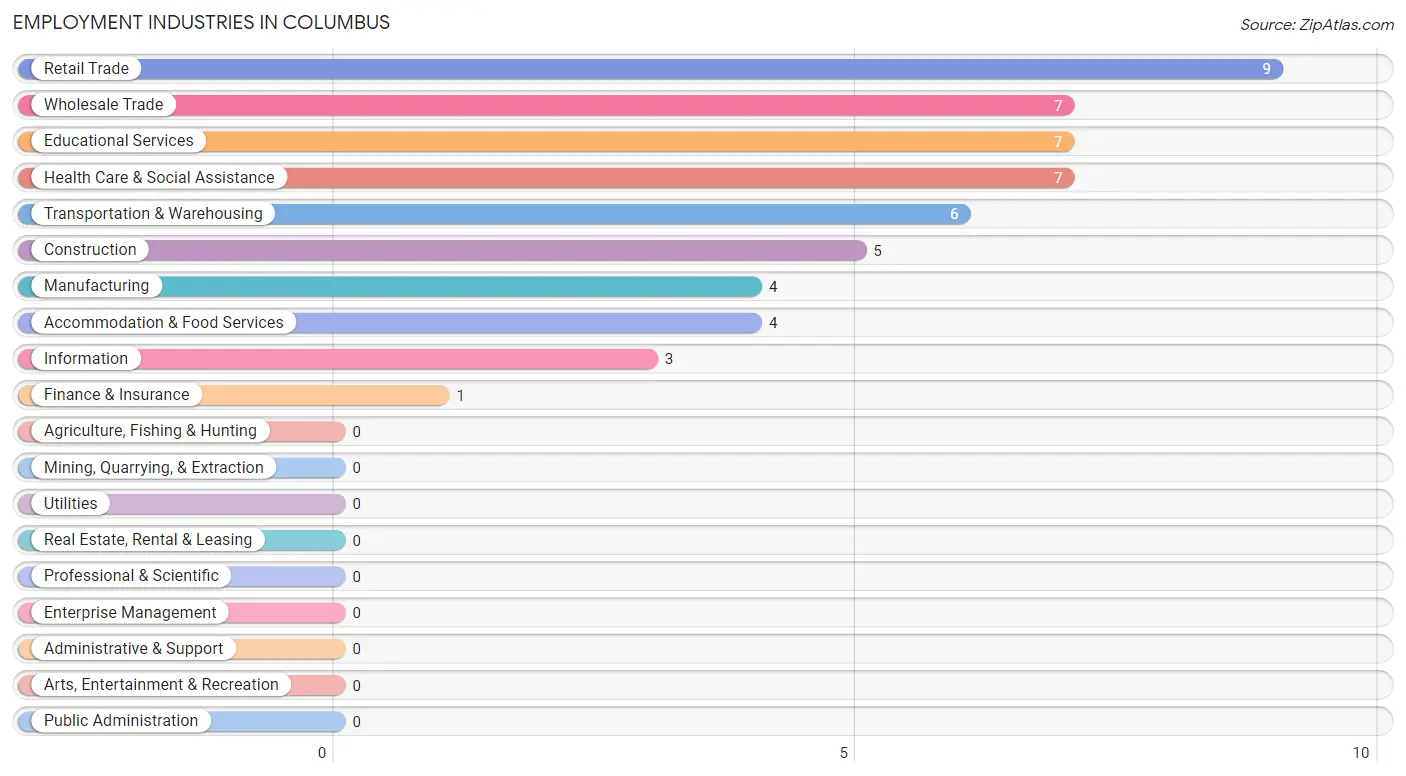
The major employment industries in Columbus include Retail Trade (9 | 16.7%), Wholesale Trade (7 | 13.0%), Educational Services (7 | 13.0%), Health Care & Social Assistance (7 | 13.0%), and Transportation & Warehousing (6 | 11.1%).
Employment Industries by Sex in Columbus
The Columbus industries that see more men than women are Construction (100.0%), Transportation & Warehousing (100.0%), and Information (100.0%), whereas the industries that tend to have a higher number of women are Finance & Insurance (100.0%), Health Care & Social Assistance (100.0%), and Accommodation & Food Services (100.0%).
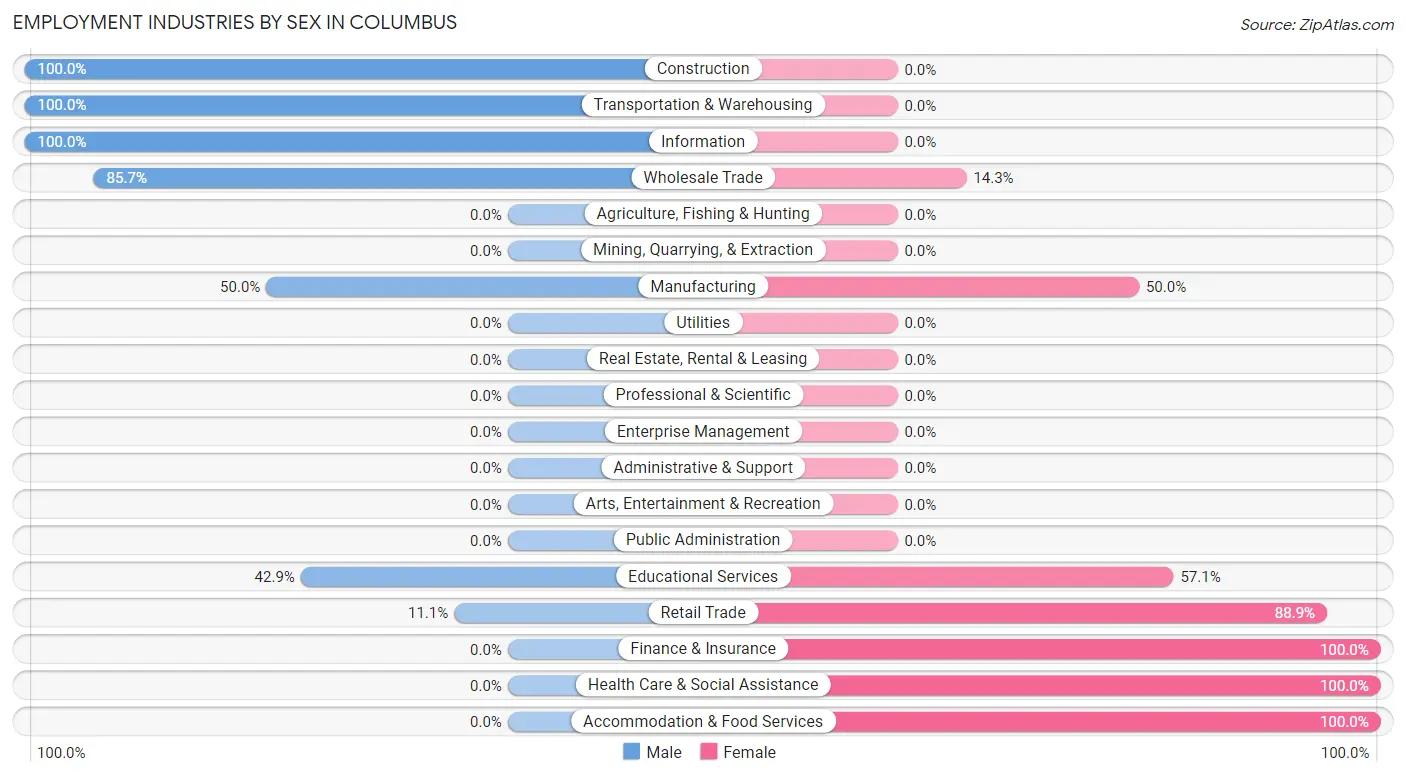
| Industry | Male | Female |
| Agriculture, Fishing & Hunting | 0 (0.0%) | 0 (0.0%) |
| Mining, Quarrying, & Extraction | 0 (0.0%) | 0 (0.0%) |
| Construction | 5 (100.0%) | 0 (0.0%) |
| Manufacturing | 2 (50.0%) | 2 (50.0%) |
| Wholesale Trade | 6 (85.7%) | 1 (14.3%) |
| Retail Trade | 1 (11.1%) | 8 (88.9%) |
| Transportation & Warehousing | 6 (100.0%) | 0 (0.0%) |
| Utilities | 0 (0.0%) | 0 (0.0%) |
| Information | 3 (100.0%) | 0 (0.0%) |
| Finance & Insurance | 0 (0.0%) | 1 (100.0%) |
| Real Estate, Rental & Leasing | 0 (0.0%) | 0 (0.0%) |
| Professional & Scientific | 0 (0.0%) | 0 (0.0%) |
| Enterprise Management | 0 (0.0%) | 0 (0.0%) |
| Administrative & Support | 0 (0.0%) | 0 (0.0%) |
| Educational Services | 3 (42.9%) | 4 (57.1%) |
| Health Care & Social Assistance | 0 (0.0%) | 7 (100.0%) |
| Arts, Entertainment & Recreation | 0 (0.0%) | 0 (0.0%) |
| Accommodation & Food Services | 0 (0.0%) | 4 (100.0%) |
| Public Administration | 0 (0.0%) | 0 (0.0%) |
| Total | 26 (48.1%) | 28 (51.8%) |
Education in Columbus
School Enrollment in Columbus
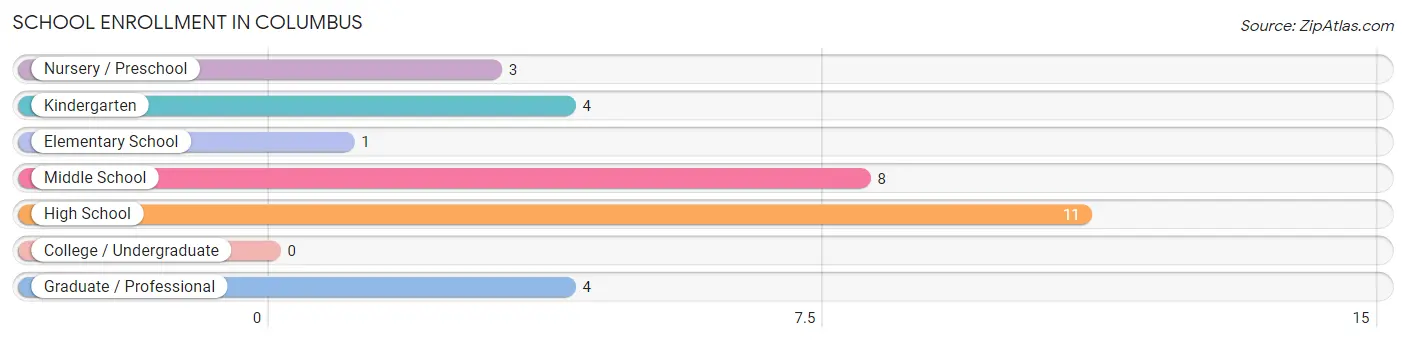
The most common levels of schooling among the 31 students in Columbus are high school (11 | 35.5%), middle school (8 | 25.8%), and kindergarten (4 | 12.9%).
| School Level | # Students | % Students |
| Nursery / Preschool | 3 | 9.7% |
| Kindergarten | 4 | 12.9% |
| Elementary School | 1 | 3.2% |
| Middle School | 8 | 25.8% |
| High School | 11 | 35.5% |
| College / Undergraduate | 0 | 0.0% |
| Graduate / Professional | 4 | 12.9% |
| Total | 31 | 100.0% |
School Enrollment by Age by Funding Source in Columbus
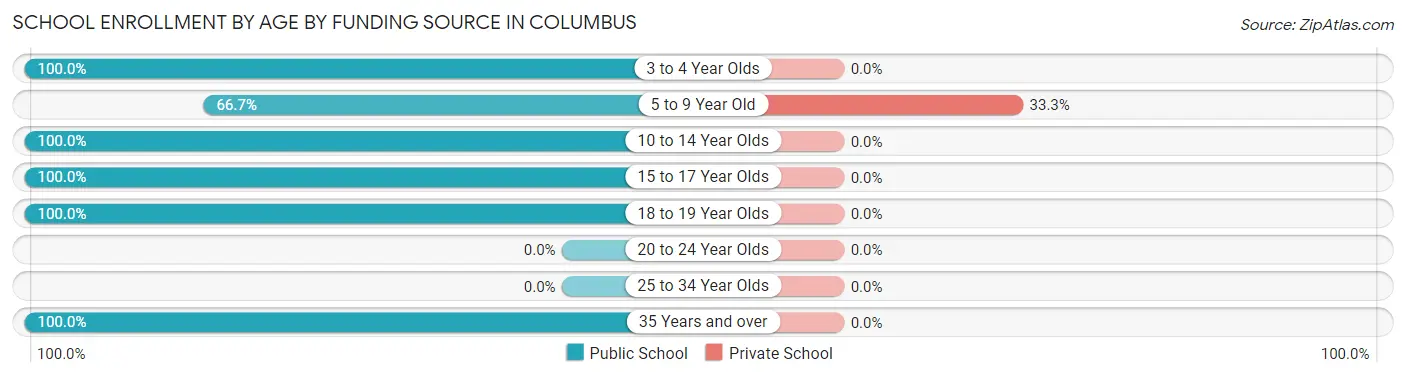
Out of a total of 31 students who are enrolled in schools in Columbus, 2 (6.5%) attend a private institution, while the remaining 29 (93.5%) are enrolled in public schools. The age group of 5 to 9 year old has the highest likelihood of being enrolled in private schools, with 2 (33.3% in the age bracket) enrolled. Conversely, the age group of 3 to 4 year olds has the lowest likelihood of being enrolled in a private school, with 2 (100.0% in the age bracket) attending a public institution.
| Age Bracket | Public School | Private School |
| 3 to 4 Year Olds | 2 (100.0%) | 0 (0.0%) |
| 5 to 9 Year Old | 4 (66.7%) | 2 (33.3%) |
| 10 to 14 Year Olds | 11 (100.0%) | 0 (0.0%) |
| 15 to 17 Year Olds | 4 (100.0%) | 0 (0.0%) |
| 18 to 19 Year Olds | 4 (100.0%) | 0 (0.0%) |
| 20 to 24 Year Olds | 0 (0.0%) | 0 (0.0%) |
| 25 to 34 Year Olds | 0 (0.0%) | 0 (0.0%) |
| 35 Years and over | 4 (100.0%) | 0 (0.0%) |
| Total | 29 (93.5%) | 2 (6.5%) |
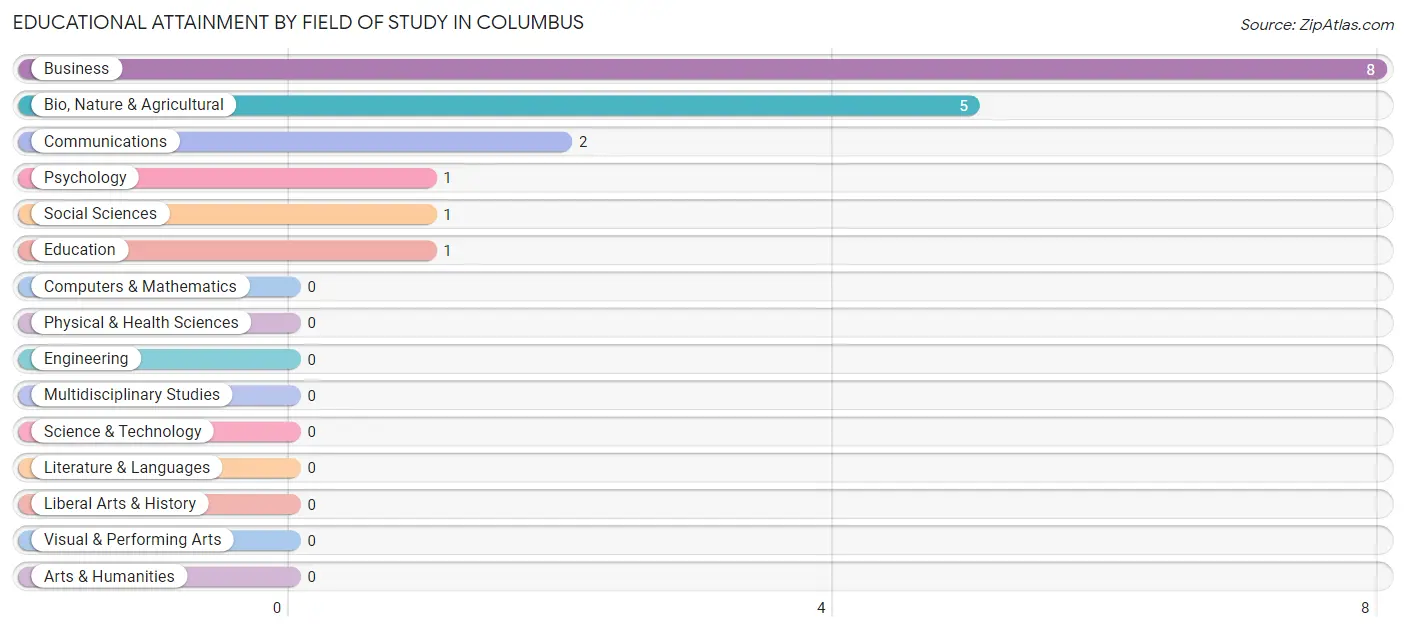
Educational Attainment by Field of Study in Columbus
Business (8 | 44.4%), bio, nature & agricultural (5 | 27.8%), communications (2 | 11.1%), psychology (1 | 5.6%), and social sciences (1 | 5.6%) are the most common fields of study among 18 individuals in Columbus who have obtained a bachelor's degree or higher.
| Field of Study | # Graduates | % Graduates |
| Computers & Mathematics | 0 | 0.0% |
| Bio, Nature & Agricultural | 5 | 27.8% |
| Physical & Health Sciences | 0 | 0.0% |
| Psychology | 1 | 5.6% |
| Social Sciences | 1 | 5.6% |
| Engineering | 0 | 0.0% |
| Multidisciplinary Studies | 0 | 0.0% |
| Science & Technology | 0 | 0.0% |
| Business | 8 | 44.4% |
| Education | 1 | 5.6% |
| Literature & Languages | 0 | 0.0% |
| Liberal Arts & History | 0 | 0.0% |
| Visual & Performing Arts | 0 | 0.0% |
| Communications | 2 | 11.1% |
| Arts & Humanities | 0 | 0.0% |
| Total | 18 | 100.0% |
Transportation & Commute in Columbus
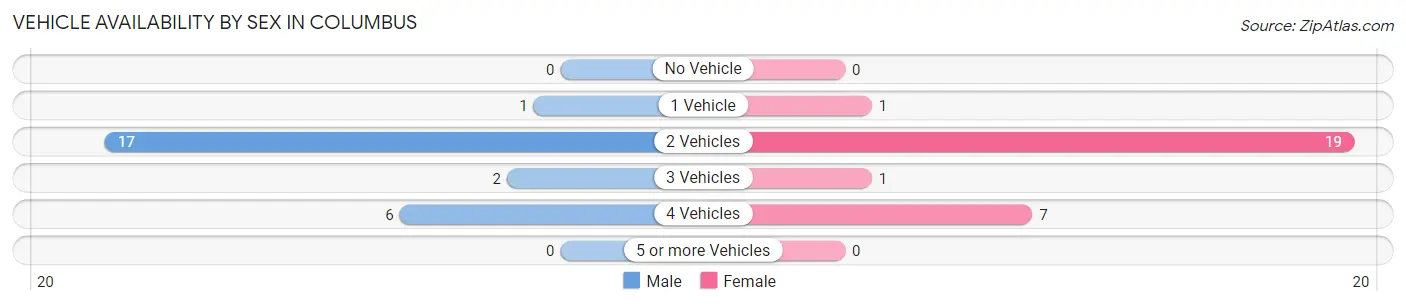
Vehicle Availability by Sex in Columbus
The most prevalent vehicle ownership categories in Columbus are males with 2 vehicles (17, accounting for 65.4%) and females with 2 vehicles (19, making up 60.7%).
| Vehicles Available | Male | Female |
| No Vehicle | 0 (0.0%) | 0 (0.0%) |
| 1 Vehicle | 1 (3.8%) | 1 (3.6%) |
| 2 Vehicles | 17 (65.4%) | 19 (67.9%) |
| 3 Vehicles | 2 (7.7%) | 1 (3.6%) |
| 4 Vehicles | 6 (23.1%) | 7 (25.0%) |
| 5 or more Vehicles | 0 (0.0%) | 0 (0.0%) |
| Total | 26 (100.0%) | 28 (100.0%) |
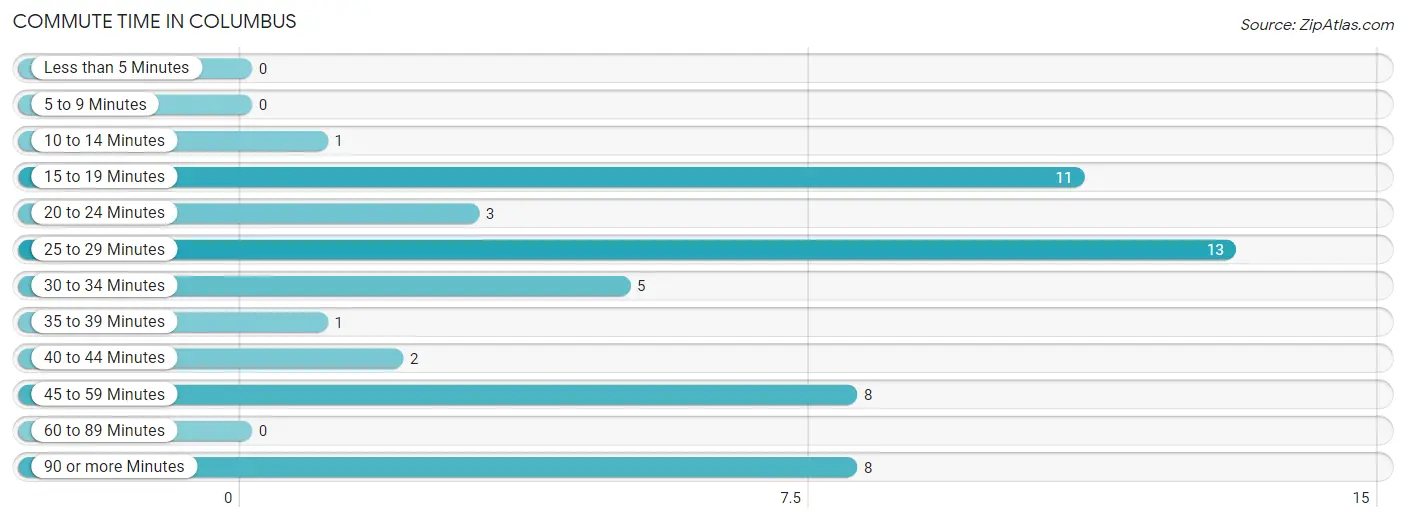
Commute Time in Columbus
The most frequently occuring commute durations in Columbus are 25 to 29 minutes (13 commuters, 25.0%), 15 to 19 minutes (11 commuters, 21.1%), and 45 to 59 minutes (8 commuters, 15.4%).
| Commute Time | # Commuters | % Commuters |
| Less than 5 Minutes | 0 | 0.0% |
| 5 to 9 Minutes | 0 | 0.0% |
| 10 to 14 Minutes | 1 | 1.9% |
| 15 to 19 Minutes | 11 | 21.1% |
| 20 to 24 Minutes | 3 | 5.8% |
| 25 to 29 Minutes | 13 | 25.0% |
| 30 to 34 Minutes | 5 | 9.6% |
| 35 to 39 Minutes | 1 | 1.9% |
| 40 to 44 Minutes | 2 | 3.8% |
| 45 to 59 Minutes | 8 | 15.4% |
| 60 to 89 Minutes | 0 | 0.0% |
| 90 or more Minutes | 8 | 15.4% |
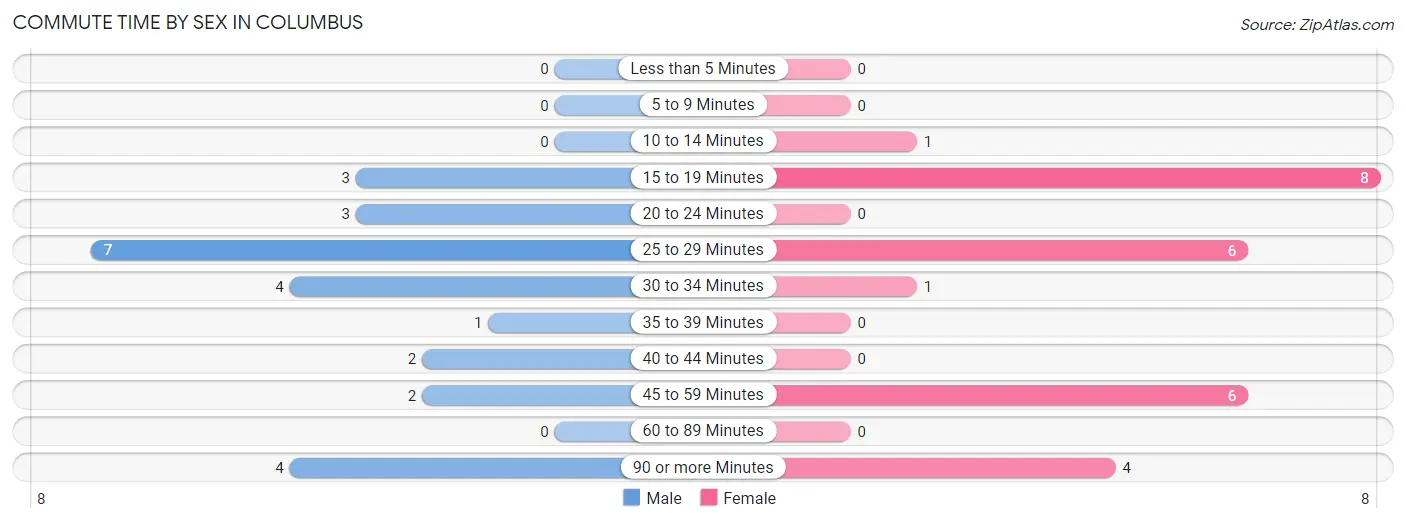
Commute Time by Sex in Columbus
The most common commute times in Columbus are 25 to 29 minutes (7 commuters, 26.9%) for males and 15 to 19 minutes (8 commuters, 30.8%) for females.
| Commute Time | Male | Female |
| Less than 5 Minutes | 0 (0.0%) | 0 (0.0%) |
| 5 to 9 Minutes | 0 (0.0%) | 0 (0.0%) |
| 10 to 14 Minutes | 0 (0.0%) | 1 (3.8%) |
| 15 to 19 Minutes | 3 (11.5%) | 8 (30.8%) |
| 20 to 24 Minutes | 3 (11.5%) | 0 (0.0%) |
| 25 to 29 Minutes | 7 (26.9%) | 6 (23.1%) |
| 30 to 34 Minutes | 4 (15.4%) | 1 (3.8%) |
| 35 to 39 Minutes | 1 (3.8%) | 0 (0.0%) |
| 40 to 44 Minutes | 2 (7.7%) | 0 (0.0%) |
| 45 to 59 Minutes | 2 (7.7%) | 6 (23.1%) |
| 60 to 89 Minutes | 0 (0.0%) | 0 (0.0%) |
| 90 or more Minutes | 4 (15.4%) | 4 (15.4%) |
Time of Departure to Work by Sex in Columbus
The most frequent times of departure to work in Columbus are 6:30 AM to 6:59 AM (7, 26.9%) for males and 7:00 AM to 7:29 AM (6, 23.1%) for females.
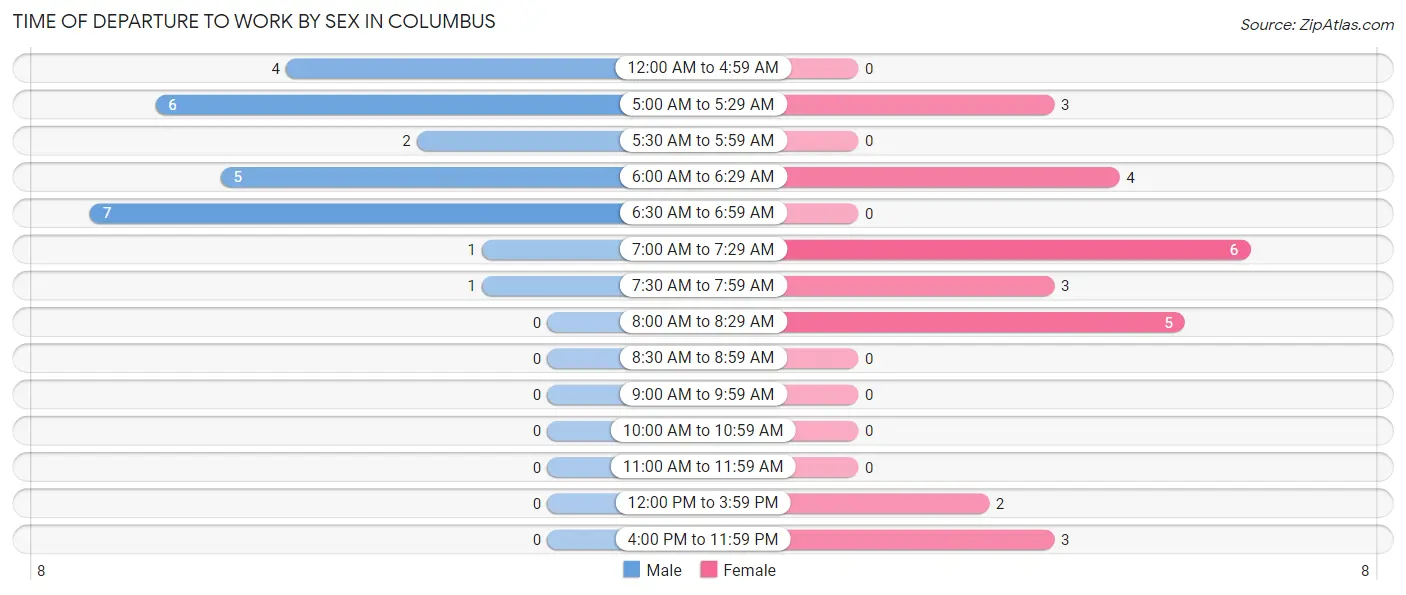
| Time of Departure | Male | Female |
| 12:00 AM to 4:59 AM | 4 (15.4%) | 0 (0.0%) |
| 5:00 AM to 5:29 AM | 6 (23.1%) | 3 (11.5%) |
| 5:30 AM to 5:59 AM | 2 (7.7%) | 0 (0.0%) |
| 6:00 AM to 6:29 AM | 5 (19.2%) | 4 (15.4%) |
| 6:30 AM to 6:59 AM | 7 (26.9%) | 0 (0.0%) |
| 7:00 AM to 7:29 AM | 1 (3.8%) | 6 (23.1%) |
| 7:30 AM to 7:59 AM | 1 (3.8%) | 3 (11.5%) |
| 8:00 AM to 8:29 AM | 0 (0.0%) | 5 (19.2%) |
| 8:30 AM to 8:59 AM | 0 (0.0%) | 0 (0.0%) |
| 9:00 AM to 9:59 AM | 0 (0.0%) | 0 (0.0%) |
| 10:00 AM to 10:59 AM | 0 (0.0%) | 0 (0.0%) |
| 11:00 AM to 11:59 AM | 0 (0.0%) | 0 (0.0%) |
| 12:00 PM to 3:59 PM | 0 (0.0%) | 2 (7.7%) |
| 4:00 PM to 11:59 PM | 0 (0.0%) | 3 (11.5%) |
| Total | 26 (100.0%) | 26 (100.0%) |
Housing Occupancy in Columbus
Occupancy by Ownership in Columbus
Of the total 42 dwellings in Columbus, owner-occupied units account for 34 (80.9%), while renter-occupied units make up 8 (19.1%).
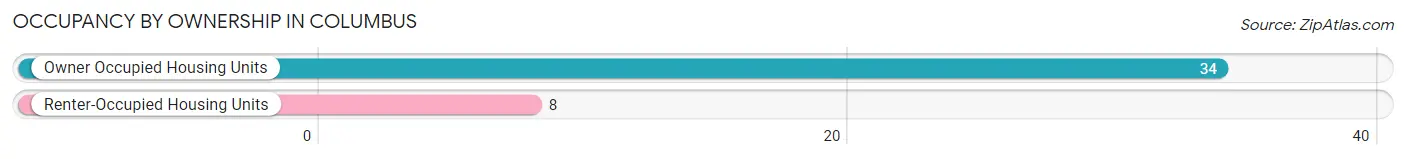
| Occupancy | # Housing Units | % Housing Units |
| Owner Occupied Housing Units | 34 | 80.9% |
| Renter-Occupied Housing Units | 8 | 19.1% |
| Total Occupied Housing Units | 42 | 100.0% |
Occupancy by Household Size in Columbus
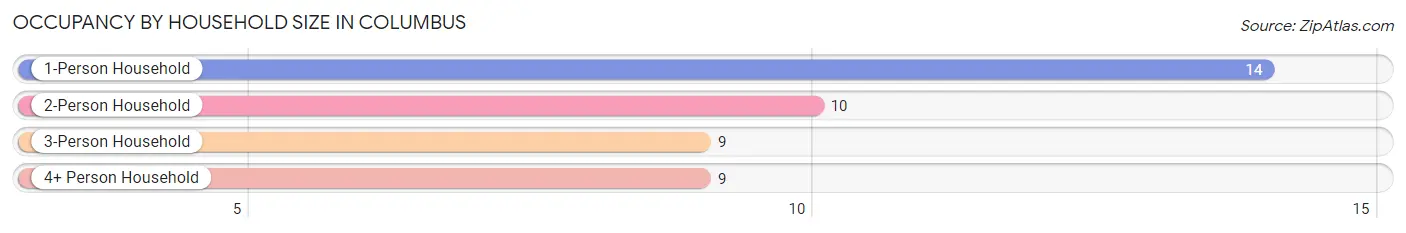
| Household Size | # Housing Units | % Housing Units |
| 1-Person Household | 14 | 33.3% |
| 2-Person Household | 10 | 23.8% |
| 3-Person Household | 9 | 21.4% |
| 4+ Person Household | 9 | 21.4% |
| Total Housing Units | 42 | 100.0% |
Occupancy by Ownership by Household Size in Columbus
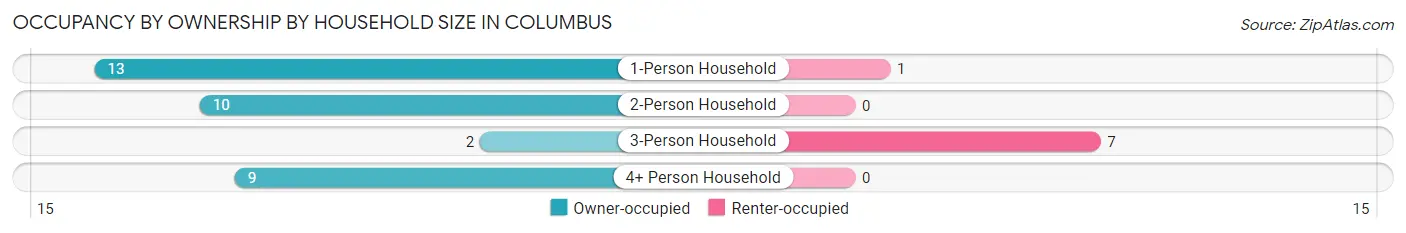
| Household Size | Owner-occupied | Renter-occupied |
| 1-Person Household | 13 (92.9%) | 1 (7.1%) |
| 2-Person Household | 10 (100.0%) | 0 (0.0%) |
| 3-Person Household | 2 (22.2%) | 7 (77.8%) |
| 4+ Person Household | 9 (100.0%) | 0 (0.0%) |
| Total Housing Units | 34 (80.9%) | 8 (19.1%) |
Occupancy by Educational Attainment in Columbus
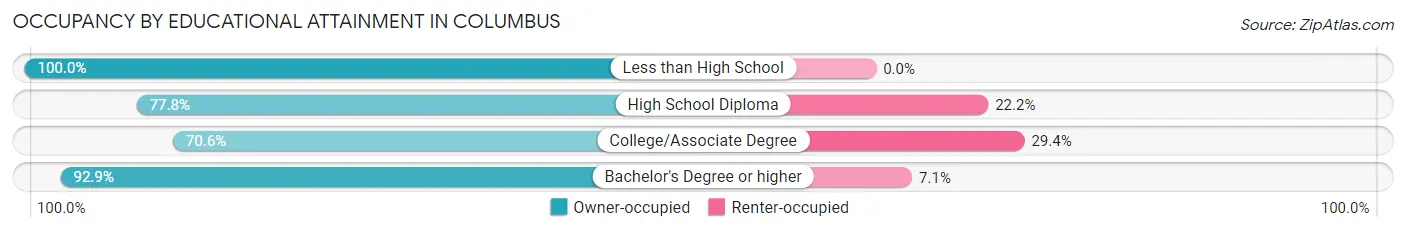
| Household Size | Owner-occupied | Renter-occupied |
| Less than High School | 2 (100.0%) | 0 (0.0%) |
| High School Diploma | 7 (77.8%) | 2 (22.2%) |
| College/Associate Degree | 12 (70.6%) | 5 (29.4%) |
| Bachelor's Degree or higher | 13 (92.9%) | 1 (7.1%) |
Occupancy by Age of Householder in Columbus
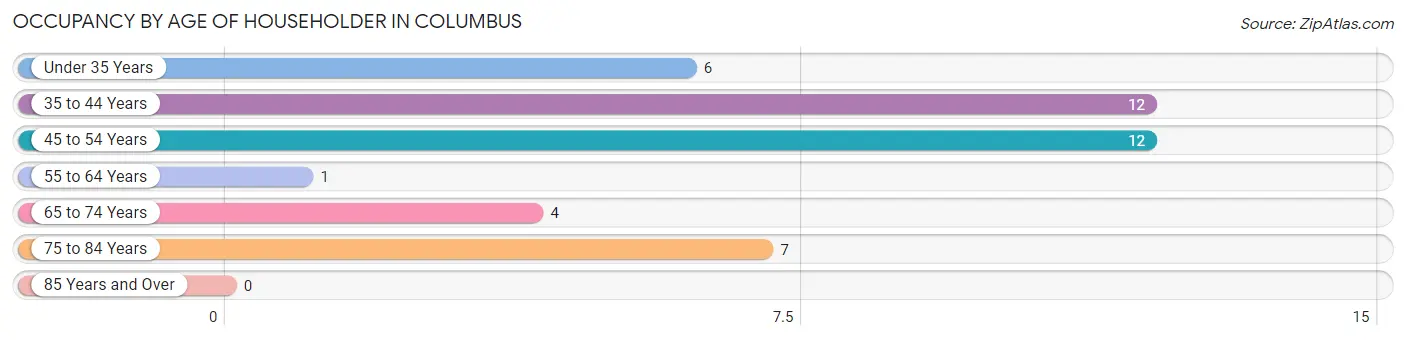
| Age Bracket | # Households | % Households |
| Under 35 Years | 6 | 14.3% |
| 35 to 44 Years | 12 | 28.6% |
| 45 to 54 Years | 12 | 28.6% |
| 55 to 64 Years | 1 | 2.4% |
| 65 to 74 Years | 4 | 9.5% |
| 75 to 84 Years | 7 | 16.7% |
| 85 Years and Over | 0 | 0.0% |
| Total | 42 | 100.0% |
Housing Finances in Columbus
Median Income by Occupancy in Columbus
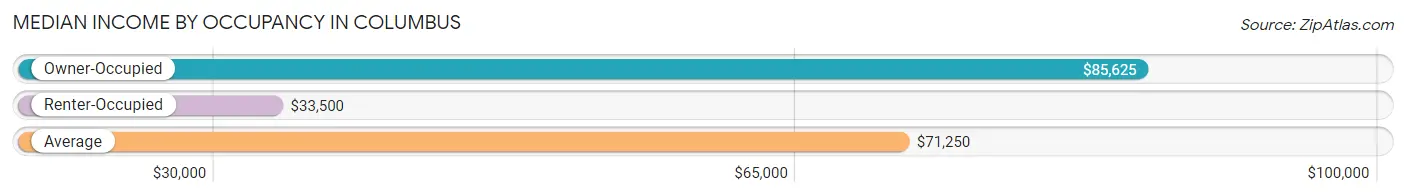
| Occupancy Type | # Households | Median Income |
| Owner-Occupied | 34 (80.9%) | $85,625 |
| Renter-Occupied | 8 (19.1%) | $33,500 |
| Average | 42 (100.0%) | $71,250 |
Occupancy by Householder Income Bracket in Columbus
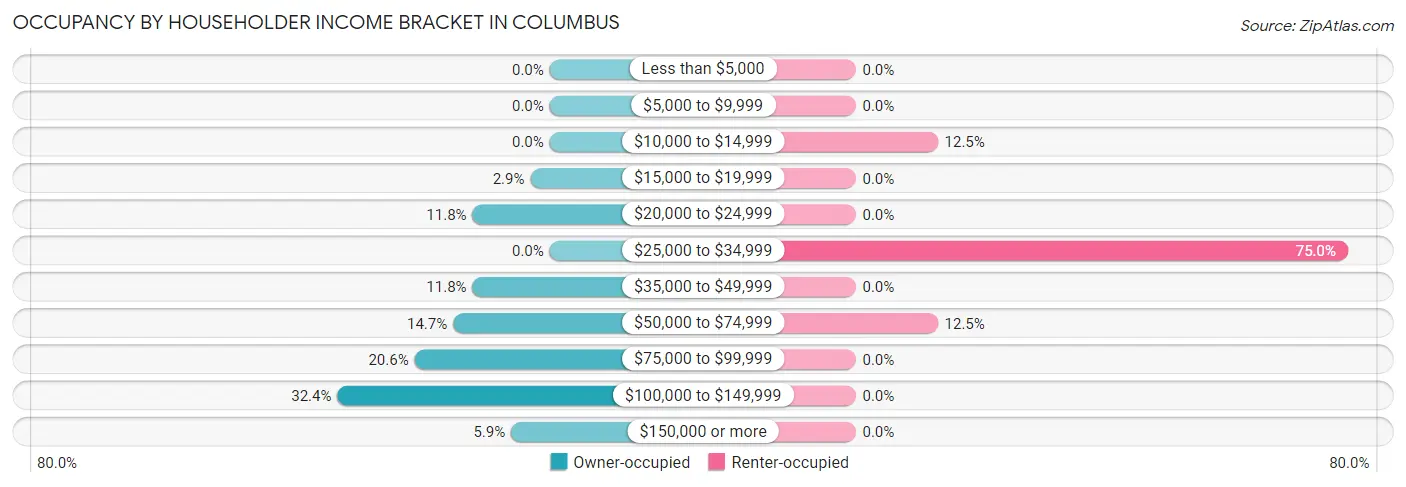
| Income Bracket | Owner-occupied | Renter-occupied |
| Less than $5,000 | 0 (0.0%) | 0 (0.0%) |
| $5,000 to $9,999 | 0 (0.0%) | 0 (0.0%) |
| $10,000 to $14,999 | 0 (0.0%) | 1 (12.5%) |
| $15,000 to $19,999 | 1 (2.9%) | 0 (0.0%) |
| $20,000 to $24,999 | 4 (11.8%) | 0 (0.0%) |
| $25,000 to $34,999 | 0 (0.0%) | 6 (75.0%) |
| $35,000 to $49,999 | 4 (11.8%) | 0 (0.0%) |
| $50,000 to $74,999 | 5 (14.7%) | 1 (12.5%) |
| $75,000 to $99,999 | 7 (20.6%) | 0 (0.0%) |
| $100,000 to $149,999 | 11 (32.4%) | 0 (0.0%) |
| $150,000 or more | 2 (5.9%) | 0 (0.0%) |
| Total | 34 (100.0%) | 8 (100.0%) |
Monthly Housing Cost Tiers in Columbus
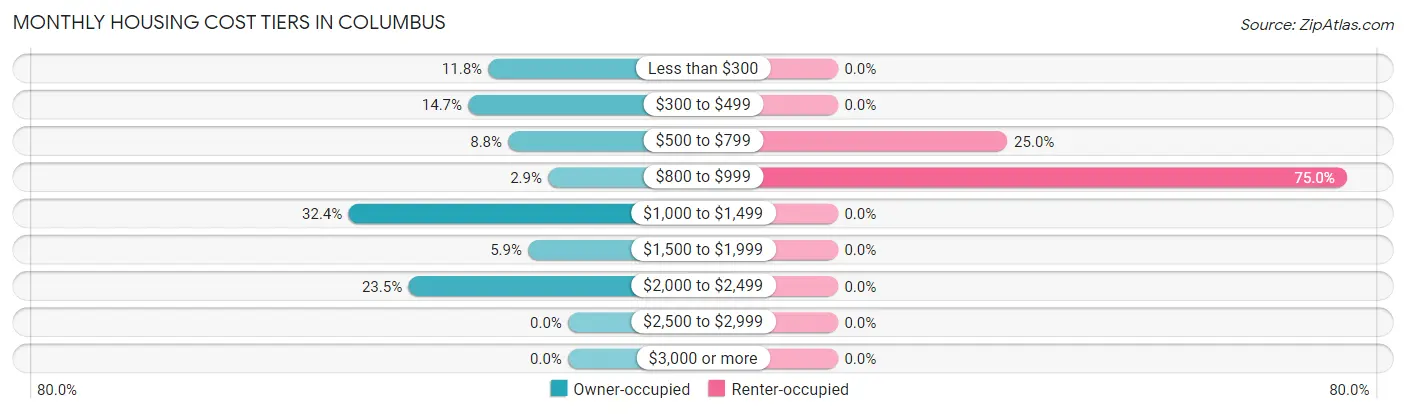
| Monthly Cost | Owner-occupied | Renter-occupied |
| Less than $300 | 4 (11.8%) | 0 (0.0%) |
| $300 to $499 | 5 (14.7%) | 0 (0.0%) |
| $500 to $799 | 3 (8.8%) | 2 (25.0%) |
| $800 to $999 | 1 (2.9%) | 6 (75.0%) |
| $1,000 to $1,499 | 11 (32.4%) | 0 (0.0%) |
| $1,500 to $1,999 | 2 (5.9%) | 0 (0.0%) |
| $2,000 to $2,499 | 8 (23.5%) | 0 (0.0%) |
| $2,500 to $2,999 | 0 (0.0%) | 0 (0.0%) |
| $3,000 or more | 0 (0.0%) | 0 (0.0%) |
| Total | 34 (100.0%) | 8 (100.0%) |
Physical Housing Characteristics in Columbus
Housing Structures in Columbus
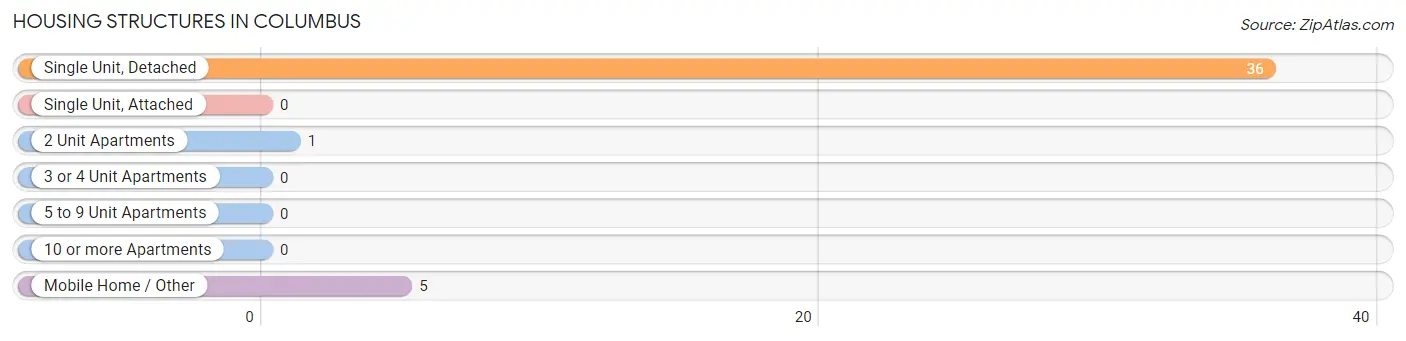
| Structure Type | # Housing Units | % Housing Units |
| Single Unit, Detached | 36 | 85.7% |
| Single Unit, Attached | 0 | 0.0% |
| 2 Unit Apartments | 1 | 2.4% |
| 3 or 4 Unit Apartments | 0 | 0.0% |
| 5 to 9 Unit Apartments | 0 | 0.0% |
| 10 or more Apartments | 0 | 0.0% |
| Mobile Home / Other | 5 | 11.9% |
| Total | 42 | 100.0% |
Housing Structures by Occupancy in Columbus
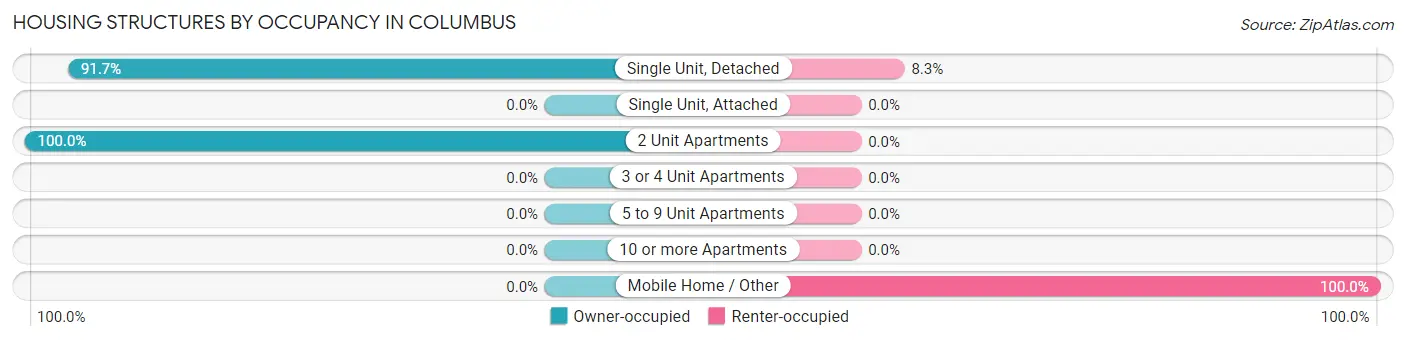
| Structure Type | Owner-occupied | Renter-occupied |
| Single Unit, Detached | 33 (91.7%) | 3 (8.3%) |
| Single Unit, Attached | 0 (0.0%) | 0 (0.0%) |
| 2 Unit Apartments | 1 (100.0%) | 0 (0.0%) |
| 3 or 4 Unit Apartments | 0 (0.0%) | 0 (0.0%) |
| 5 to 9 Unit Apartments | 0 (0.0%) | 0 (0.0%) |
| 10 or more Apartments | 0 (0.0%) | 0 (0.0%) |
| Mobile Home / Other | 0 (0.0%) | 5 (100.0%) |
| Total | 34 (80.9%) | 8 (19.1%) |
Housing Structures by Number of Rooms in Columbus
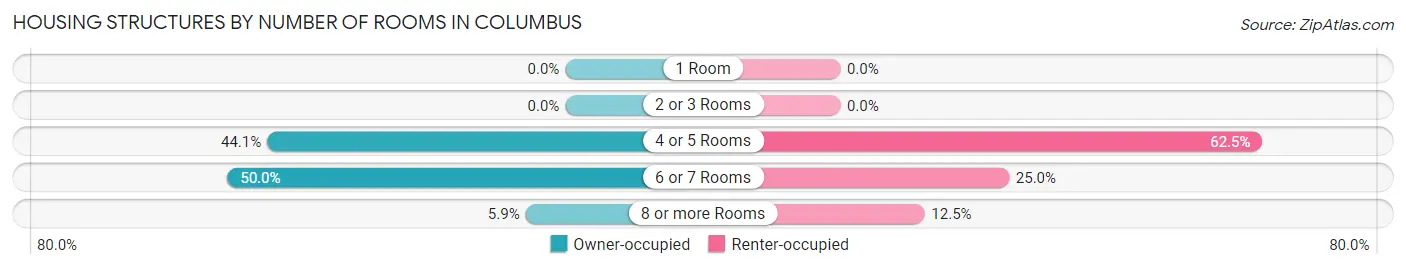
| Number of Rooms | Owner-occupied | Renter-occupied |
| 1 Room | 0 (0.0%) | 0 (0.0%) |
| 2 or 3 Rooms | 0 (0.0%) | 0 (0.0%) |
| 4 or 5 Rooms | 15 (44.1%) | 5 (62.5%) |
| 6 or 7 Rooms | 17 (50.0%) | 2 (25.0%) |
| 8 or more Rooms | 2 (5.9%) | 1 (12.5%) |
| Total | 34 (100.0%) | 8 (100.0%) |
Housing Structure by Heating Type in Columbus
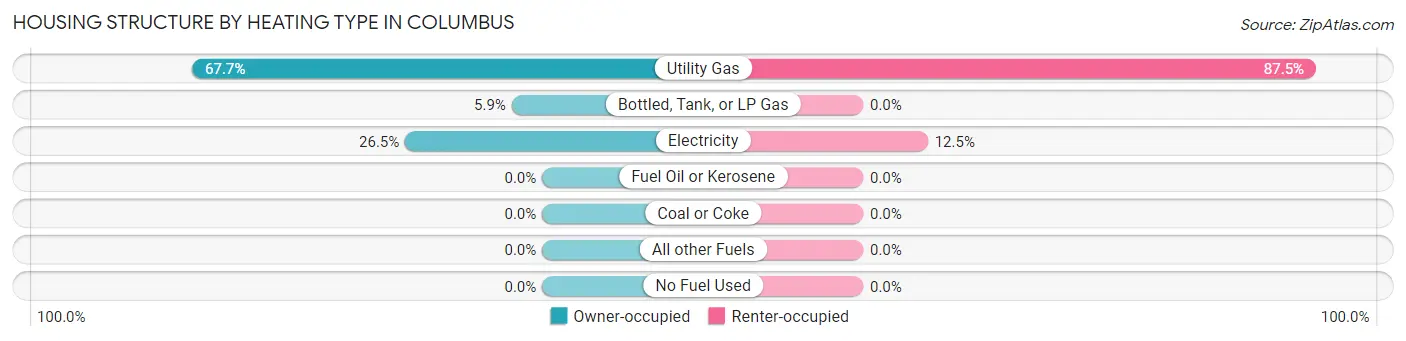
| Heating Type | Owner-occupied | Renter-occupied |
| Utility Gas | 23 (67.6%) | 7 (87.5%) |
| Bottled, Tank, or LP Gas | 2 (5.9%) | 0 (0.0%) |
| Electricity | 9 (26.5%) | 1 (12.5%) |
| Fuel Oil or Kerosene | 0 (0.0%) | 0 (0.0%) |
| Coal or Coke | 0 (0.0%) | 0 (0.0%) |
| All other Fuels | 0 (0.0%) | 0 (0.0%) |
| No Fuel Used | 0 (0.0%) | 0 (0.0%) |
| Total | 34 (100.0%) | 8 (100.0%) |
Household Vehicle Usage in Columbus
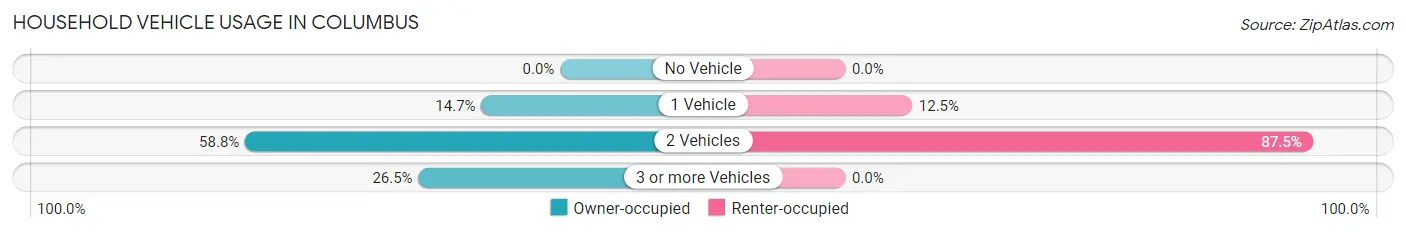
| Vehicles per Household | Owner-occupied | Renter-occupied |
| No Vehicle | 0 (0.0%) | 0 (0.0%) |
| 1 Vehicle | 5 (14.7%) | 1 (12.5%) |
| 2 Vehicles | 20 (58.8%) | 7 (87.5%) |
| 3 or more Vehicles | 9 (26.5%) | 0 (0.0%) |
| Total | 34 (100.0%) | 8 (100.0%) |
Real Estate & Mortgages in Columbus
Real Estate and Mortgage Overview in Columbus
| Characteristic | Without Mortgage | With Mortgage |
| Housing Units | 10 | 24 |
| Median Property Value | $95,000 | $0 |
| Median Household Income | $42,500 | $2 |
| Monthly Housing Costs | $317 | $0 |
| Real Estate Taxes | $1,250 | $0 |
Property Value by Mortgage Status in Columbus
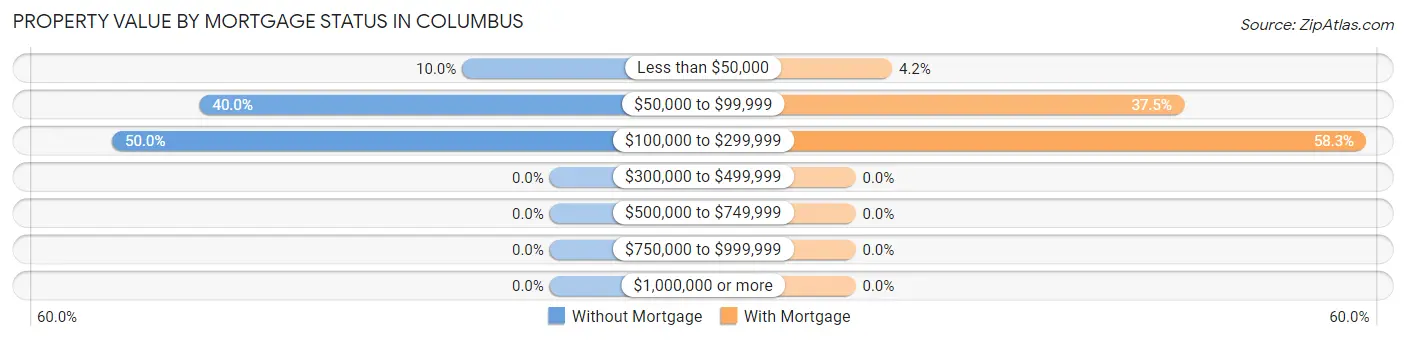
| Property Value | Without Mortgage | With Mortgage |
| Less than $50,000 | 1 (10.0%) | 1 (4.2%) |
| $50,000 to $99,999 | 4 (40.0%) | 9 (37.5%) |
| $100,000 to $299,999 | 5 (50.0%) | 14 (58.3%) |
| $300,000 to $499,999 | 0 (0.0%) | 0 (0.0%) |
| $500,000 to $749,999 | 0 (0.0%) | 0 (0.0%) |
| $750,000 to $999,999 | 0 (0.0%) | 0 (0.0%) |
| $1,000,000 or more | 0 (0.0%) | 0 (0.0%) |
| Total | 10 (100.0%) | 24 (100.0%) |
Household Income by Mortgage Status in Columbus
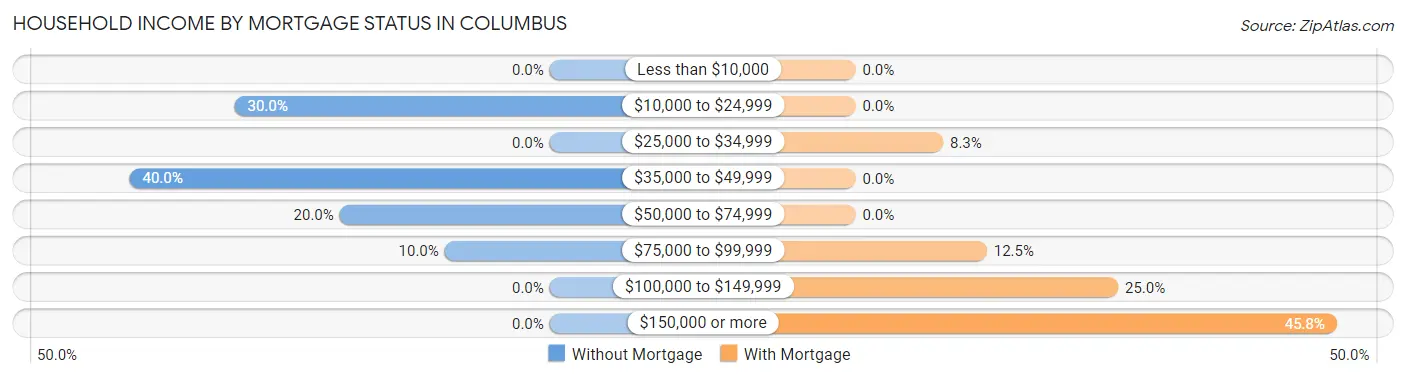
| Household Income | Without Mortgage | With Mortgage |
| Less than $10,000 | 0 (0.0%) | 0 (0.0%) |
| $10,000 to $24,999 | 3 (30.0%) | 0 (0.0%) |
| $25,000 to $34,999 | 0 (0.0%) | 2 (8.3%) |
| $35,000 to $49,999 | 4 (40.0%) | 0 (0.0%) |
| $50,000 to $74,999 | 2 (20.0%) | 0 (0.0%) |
| $75,000 to $99,999 | 1 (10.0%) | 3 (12.5%) |
| $100,000 to $149,999 | 0 (0.0%) | 6 (25.0%) |
| $150,000 or more | 0 (0.0%) | 11 (45.8%) |
| Total | 10 (100.0%) | 24 (100.0%) |
Property Value to Household Income Ratio in Columbus
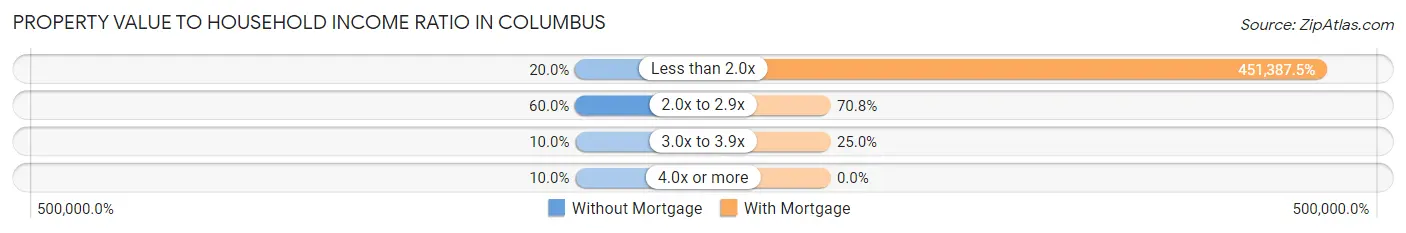
| Value-to-Income Ratio | Without Mortgage | With Mortgage |
| Less than 2.0x | 2 (20.0%) | 108,333 (451,387.5%) |
| 2.0x to 2.9x | 6 (60.0%) | 17 (70.8%) |
| 3.0x to 3.9x | 1 (10.0%) | 6 (25.0%) |
| 4.0x or more | 1 (10.0%) | 0 (0.0%) |
| Total | 10 (100.0%) | 24 (100.0%) |
Real Estate Taxes by Mortgage Status in Columbus
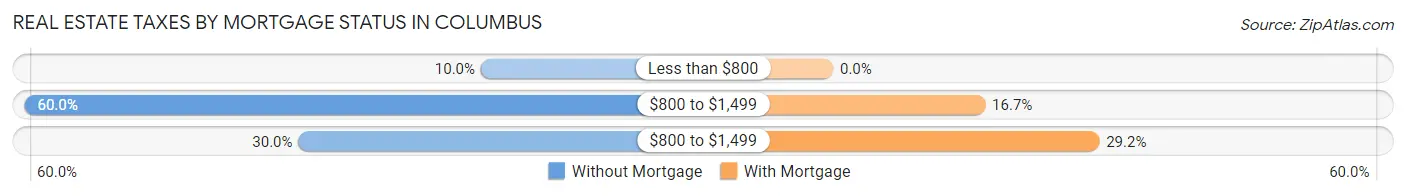
| Property Taxes | Without Mortgage | With Mortgage |
| Less than $800 | 1 (10.0%) | 0 (0.0%) |
| $800 to $1,499 | 6 (60.0%) | 4 (16.7%) |
| $800 to $1,499 | 3 (30.0%) | 7 (29.2%) |
| Total | 10 (100.0%) | 24 (100.0%) |
Health & Disability in Columbus
Health Insurance Coverage by Age in Columbus
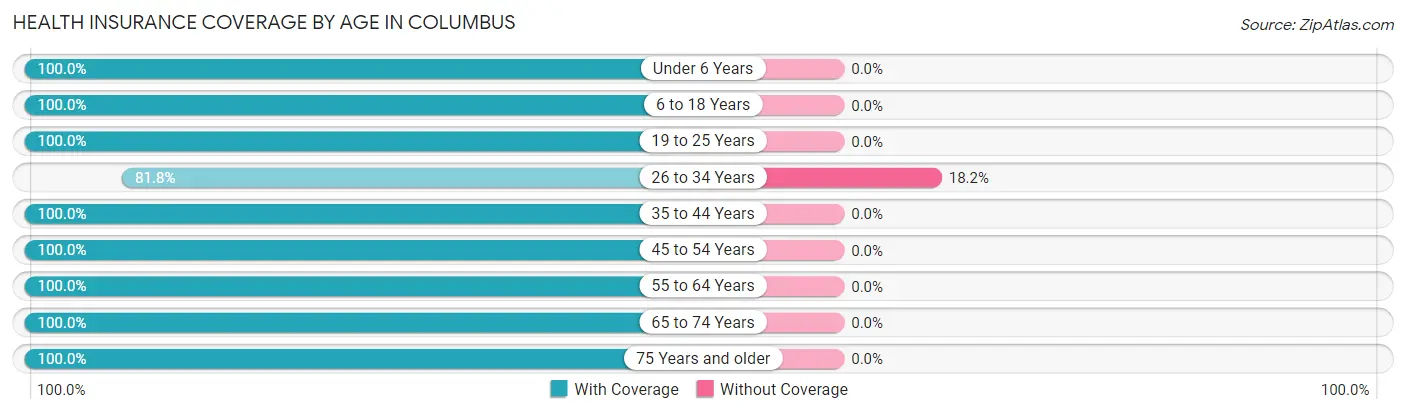
| Age Bracket | With Coverage | Without Coverage |
| Under 6 Years | 9 (100.0%) | 0 (0.0%) |
| 6 to 18 Years | 23 (100.0%) | 0 (0.0%) |
| 19 to 25 Years | 7 (100.0%) | 0 (0.0%) |
| 26 to 34 Years | 9 (81.8%) | 2 (18.2%) |
| 35 to 44 Years | 19 (100.0%) | 0 (0.0%) |
| 45 to 54 Years | 15 (100.0%) | 0 (0.0%) |
| 55 to 64 Years | 6 (100.0%) | 0 (0.0%) |
| 65 to 74 Years | 9 (100.0%) | 0 (0.0%) |
| 75 Years and older | 7 (100.0%) | 0 (0.0%) |
| Total | 104 (98.1%) | 2 (1.9%) |
Health Insurance Coverage by Citizenship Status in Columbus
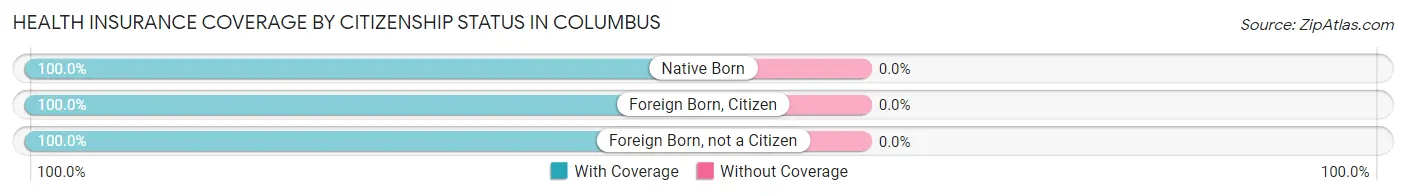
| Citizenship Status | With Coverage | Without Coverage |
| Native Born | 9 (100.0%) | 0 (0.0%) |
| Foreign Born, Citizen | 23 (100.0%) | 0 (0.0%) |
| Foreign Born, not a Citizen | 7 (100.0%) | 0 (0.0%) |
Health Insurance Coverage by Household Income in Columbus
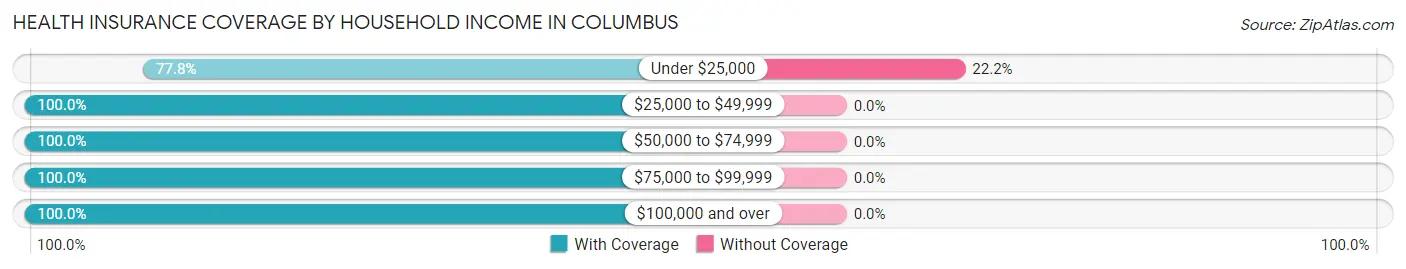
| Household Income | With Coverage | Without Coverage |
| Under $25,000 | 7 (77.8%) | 2 (22.2%) |
| $25,000 to $49,999 | 24 (100.0%) | 0 (0.0%) |
| $50,000 to $74,999 | 13 (100.0%) | 0 (0.0%) |
| $75,000 to $99,999 | 14 (100.0%) | 0 (0.0%) |
| $100,000 and over | 46 (100.0%) | 0 (0.0%) |
Public vs Private Health Insurance Coverage by Age in Columbus
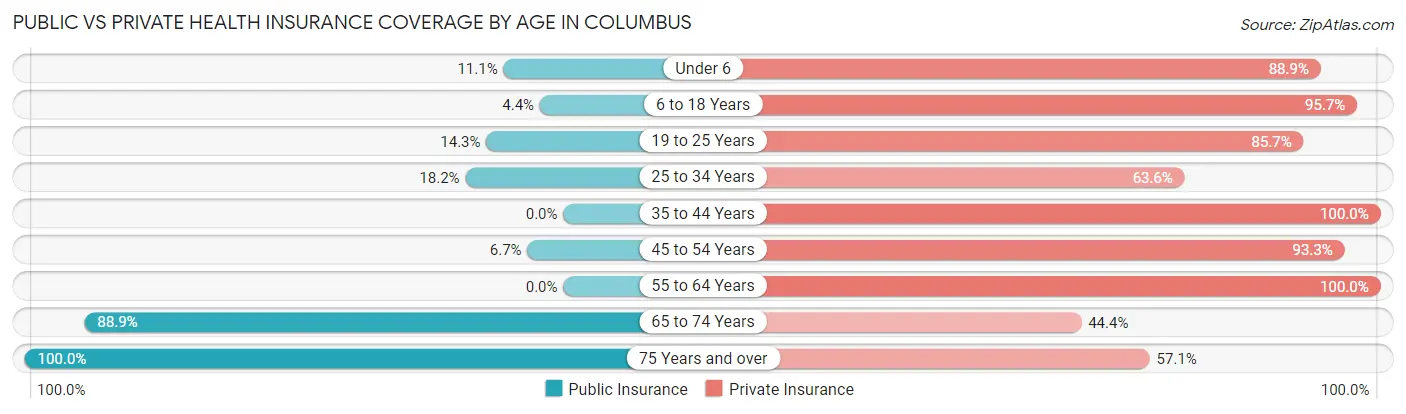
| Age Bracket | Public Insurance | Private Insurance |
| Under 6 | 1 (11.1%) | 8 (88.9%) |
| 6 to 18 Years | 1 (4.3%) | 22 (95.7%) |
| 19 to 25 Years | 1 (14.3%) | 6 (85.7%) |
| 25 to 34 Years | 2 (18.2%) | 7 (63.6%) |
| 35 to 44 Years | 0 (0.0%) | 19 (100.0%) |
| 45 to 54 Years | 1 (6.7%) | 14 (93.3%) |
| 55 to 64 Years | 0 (0.0%) | 6 (100.0%) |
| 65 to 74 Years | 8 (88.9%) | 4 (44.4%) |
| 75 Years and over | 7 (100.0%) | 4 (57.1%) |
| Total | 21 (19.8%) | 90 (84.9%) |
Disability Status by Sex by Age in Columbus
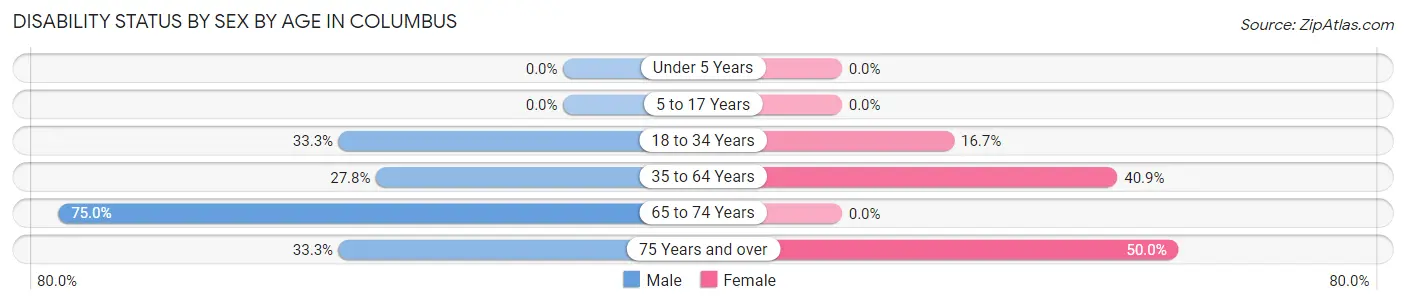
| Age Bracket | Male | Female |
| Under 5 Years | 0 (0.0%) | 0 (0.0%) |
| 5 to 17 Years | 0 (0.0%) | 0 (0.0%) |
| 18 to 34 Years | 2 (33.3%) | 2 (16.7%) |
| 35 to 64 Years | 5 (27.8%) | 9 (40.9%) |
| 65 to 74 Years | 3 (75.0%) | 0 (0.0%) |
| 75 Years and over | 1 (33.3%) | 2 (50.0%) |
Disability Class by Sex by Age in Columbus
Disability Class: Hearing Difficulty
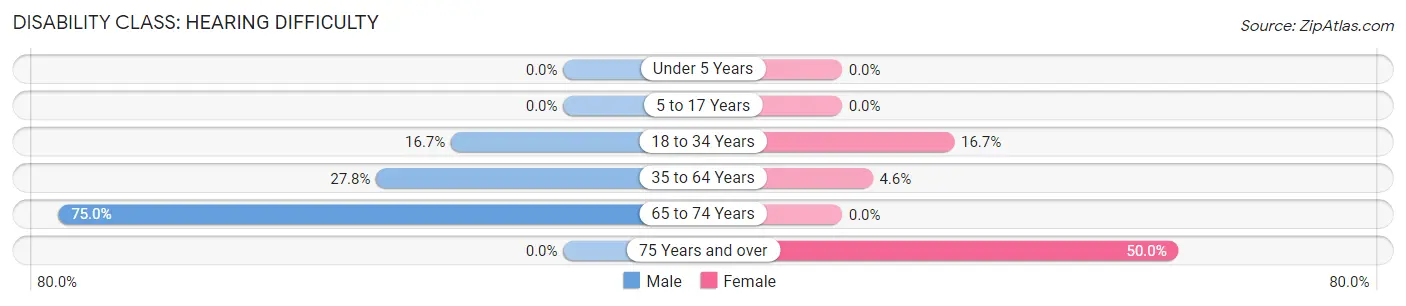
| Age Bracket | Male | Female |
| Under 5 Years | 0 (0.0%) | 0 (0.0%) |
| 5 to 17 Years | 0 (0.0%) | 0 (0.0%) |
| 18 to 34 Years | 1 (16.7%) | 2 (16.7%) |
| 35 to 64 Years | 5 (27.8%) | 1 (4.5%) |
| 65 to 74 Years | 3 (75.0%) | 0 (0.0%) |
| 75 Years and over | 0 (0.0%) | 2 (50.0%) |
Disability Class: Vision Difficulty
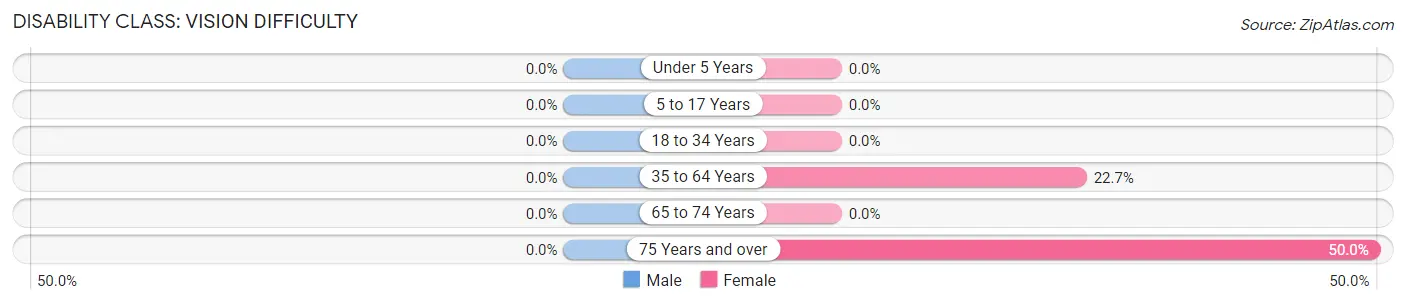
| Age Bracket | Male | Female |
| Under 5 Years | 0 (0.0%) | 0 (0.0%) |
| 5 to 17 Years | 0 (0.0%) | 0 (0.0%) |
| 18 to 34 Years | 0 (0.0%) | 0 (0.0%) |
| 35 to 64 Years | 0 (0.0%) | 5 (22.7%) |
| 65 to 74 Years | 0 (0.0%) | 0 (0.0%) |
| 75 Years and over | 0 (0.0%) | 2 (50.0%) |
Disability Class: Cognitive Difficulty
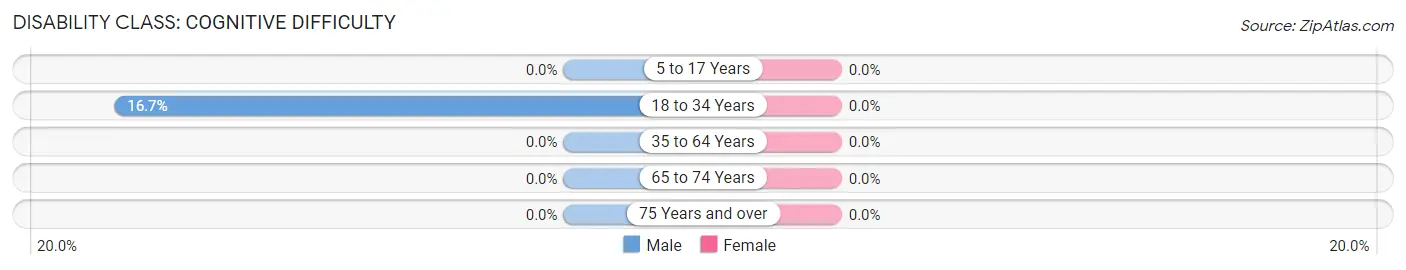
| Age Bracket | Male | Female |
| 5 to 17 Years | 0 (0.0%) | 0 (0.0%) |
| 18 to 34 Years | 1 (16.7%) | 0 (0.0%) |
| 35 to 64 Years | 0 (0.0%) | 0 (0.0%) |
| 65 to 74 Years | 0 (0.0%) | 0 (0.0%) |
| 75 Years and over | 0 (0.0%) | 0 (0.0%) |
Disability Class: Ambulatory Difficulty
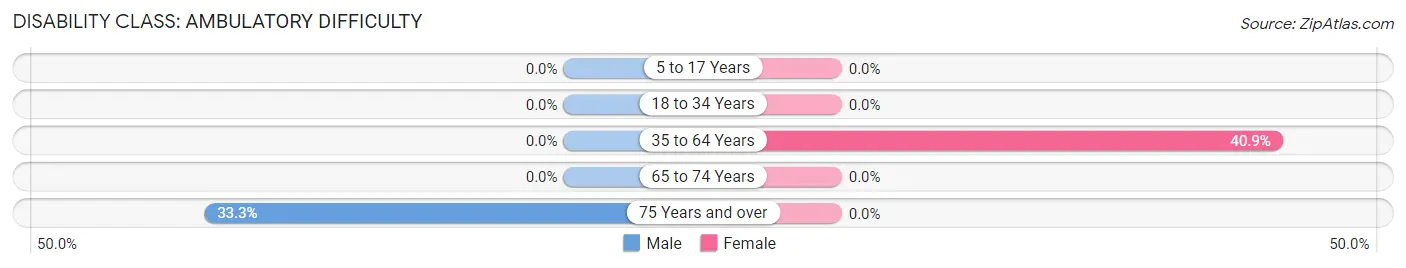
| Age Bracket | Male | Female |
| 5 to 17 Years | 0 (0.0%) | 0 (0.0%) |
| 18 to 34 Years | 0 (0.0%) | 0 (0.0%) |
| 35 to 64 Years | 0 (0.0%) | 9 (40.9%) |
| 65 to 74 Years | 0 (0.0%) | 0 (0.0%) |
| 75 Years and over | 1 (33.3%) | 0 (0.0%) |
Disability Class: Self-Care Difficulty
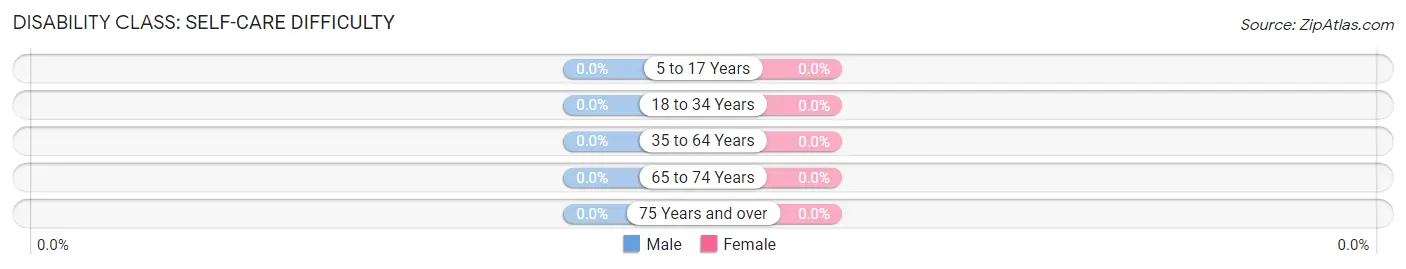
| Age Bracket | Male | Female |
| 5 to 17 Years | 0 (0.0%) | 0 (0.0%) |
| 18 to 34 Years | 0 (0.0%) | 0 (0.0%) |
| 35 to 64 Years | 0 (0.0%) | 0 (0.0%) |
| 65 to 74 Years | 0 (0.0%) | 0 (0.0%) |
| 75 Years and over | 0 (0.0%) | 0 (0.0%) |
Technology Access in Columbus
Computing Device Access in Columbus
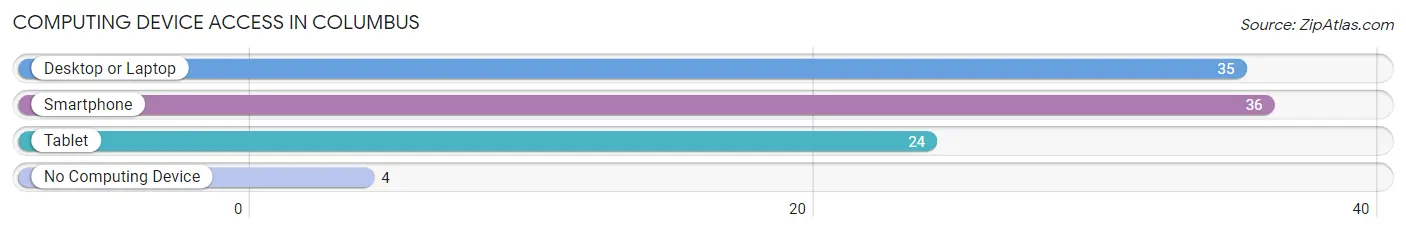
| Device Type | # Households | % Households |
| Desktop or Laptop | 35 | 83.3% |
| Smartphone | 36 | 85.7% |
| Tablet | 24 | 57.1% |
| No Computing Device | 4 | 9.5% |
| Total | 42 | 100.0% |
Internet Access in Columbus
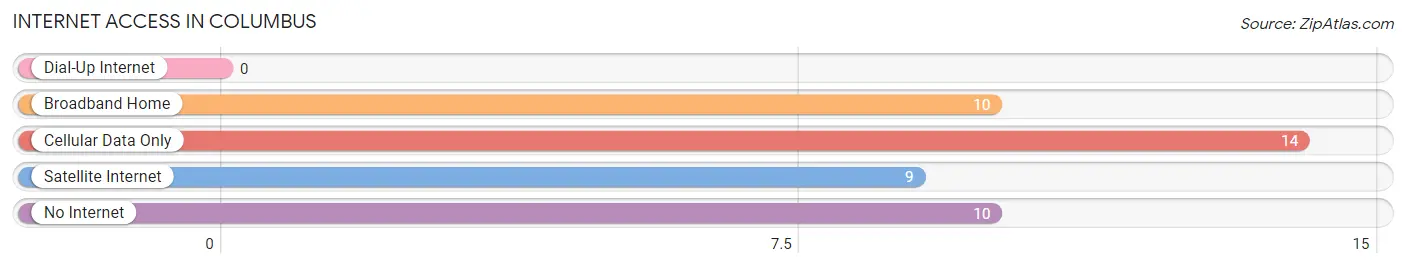
| Internet Type | # Households | % Households |
| Dial-Up Internet | 0 | 0.0% |
| Broadband Home | 10 | 23.8% |
| Cellular Data Only | 14 | 33.3% |
| Satellite Internet | 9 | 21.4% |
| No Internet | 10 | 23.8% |
| Total | 42 | 100.0% |
Columbus Summary
Columbus, Illinois is a small city located in the state of Illinois, in the United States. It is situated in the southeastern part of the state, in the county of Union. The city is located on the banks of the Mississippi River, and is part of the Metro East region of the state. The city has a population of approximately 4,500 people, and is the county seat of Union County.
History
The area that is now Columbus was first settled in 1819 by a group of settlers from Kentucky. The settlement was originally known as Unionville, and was later renamed Columbus in 1821. The city was named after Christopher Columbus, the famous explorer. The city was officially incorporated in 1837, and was the first city in Union County.
In the early years of the city, it was a major port on the Mississippi River, and was a major hub for the steamboat industry. The city was also a major center for the production of coal and timber. The city was also a major center for the production of iron and steel.
In the late 19th century, the city was a major center for the production of agricultural products, such as corn, wheat, and oats. The city was also a major center for the production of livestock, such as cattle, hogs, and sheep.
Geography
Columbus is located in the southeastern part of the state of Illinois, in the county of Union. The city is situated on the banks of the Mississippi River, and is part of the Metro East region of the state. The city has a total area of 2.2 square miles, all of which is land.
The city is located in a humid continental climate zone, with hot, humid summers and cold, snowy winters. The average annual temperature is around 50 degrees Fahrenheit, and the average annual precipitation is around 40 inches.
Economy
The economy of Columbus is largely based on agriculture and manufacturing. The city is home to several large agricultural companies, such as Cargill, ADM, and Monsanto. The city is also home to several large manufacturing companies, such as Caterpillar, John Deere, and International Harvester.
The city is also home to several small businesses, such as restaurants, retail stores, and service providers. The city is also home to several educational institutions, such as the University of Illinois at Urbana-Champaign, and the University of Illinois at Chicago.
Demographics
As of the 2010 census, the population of Columbus was 4,541. The racial makeup of the city was 87.3% White, 8.2% African American, 0.3% Native American, 0.7% Asian, 0.1% Pacific Islander, 1.2% from other races, and 2.4% from two or more races. Hispanic or Latino of any race were 3.3% of the population.
The median income for a household in the city was $37,917, and the median income for a family was $45,938. The per capita income for the city was $19,945. About 11.2% of families and 14.2% of the population were below the poverty line, including 19.2% of those under age 18 and 8.2% of those age 65 or over.
Common Questions
What is Per Capita Income in Columbus?
Per Capita income in Columbus is $29,559.
What is the Median Family Income in Columbus?
Median Family Income in Columbus is $96,250.
What is the Median Household income in Columbus?
Median Household Income in Columbus is $71,250.
What is Inequality or Gini Index in Columbus?
Inequality or Gini Index in Columbus is 0.34.
What is the Total Population of Columbus?
Total Population of Columbus is 106.
What is the Total Male Population of Columbus?
Total Male Population of Columbus is 50.
What is the Total Female Population of Columbus?
Total Female Population of Columbus is 56.
What is the Ratio of Males per 100 Females in Columbus?
There are 89.29 Males per 100 Females in Columbus.
What is the Ratio of Females per 100 Males in Columbus?
There are 112.00 Females per 100 Males in Columbus.
What is the Median Population Age in Columbus?
Median Population Age in Columbus is 36.6 Years.
What is the Average Family Size in Columbus
Average Family Size in Columbus is 3.4 People.
What is the Average Household Size in Columbus
Average Household Size in Columbus is 2.5 People.
How Large is the Labor Force in Columbus?
There are 54 People in the Labor Forcein in Columbus.
What is the Percentage of People in the Labor Force in Columbus?
66.7% of People are in the Labor Force in Columbus.