Zip Codes with the Highest Poverty Level Among Children Under the Age of 5 in Illinois
RELATED REPORTS & OPTIONS
Highest Poverty | Child 0-5
Illinois
Compare Zip Codes
Map of Zip Codes with the Highest Poverty Level Among Children Under the Age of 5 in Illinois
40.0%
100.0%
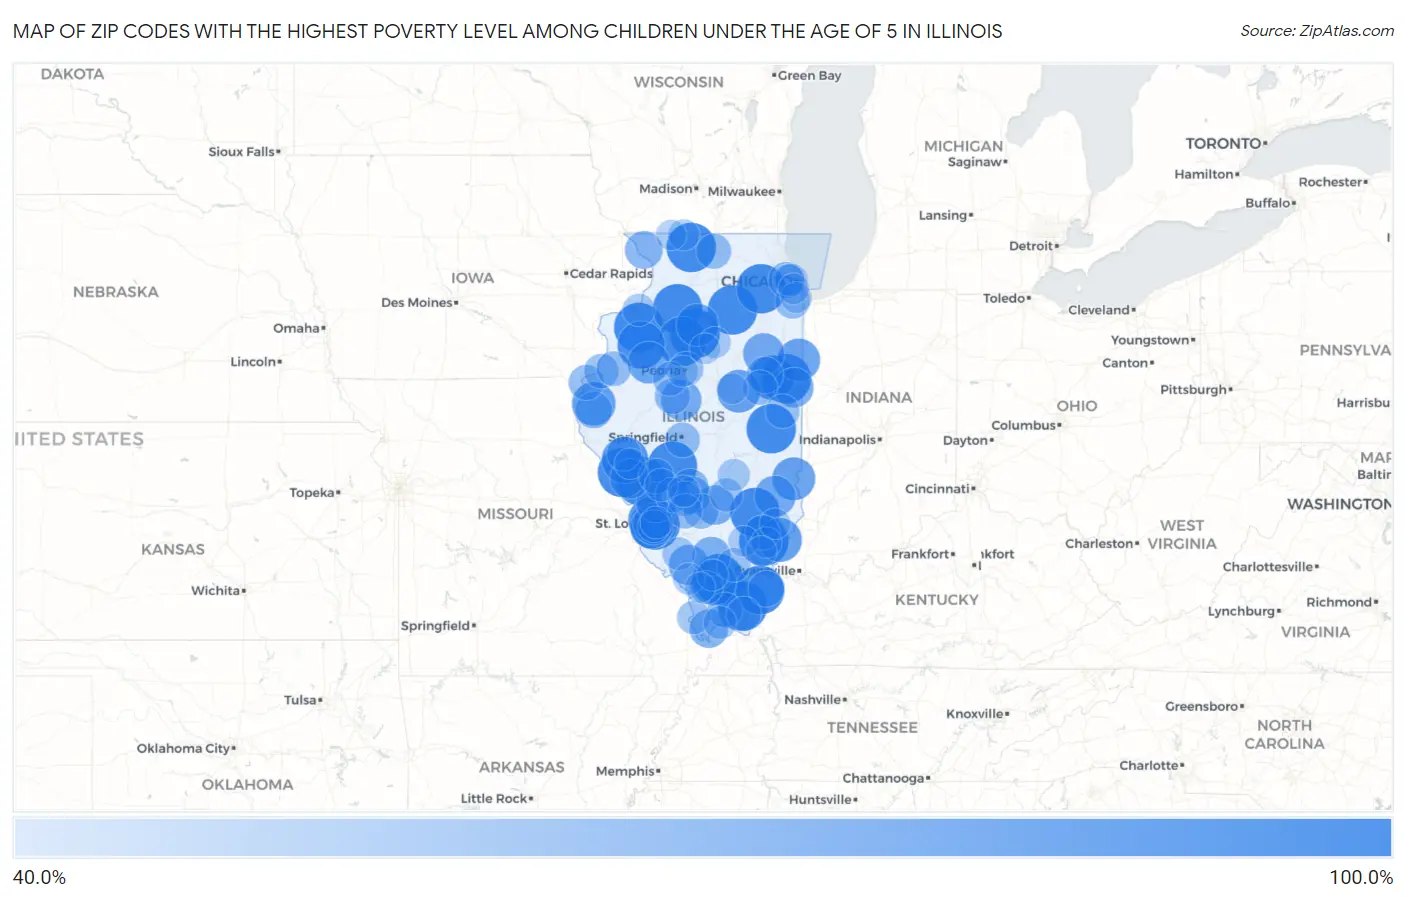
Zip Codes with the Highest Poverty Level Among Children Under the Age of 5 in Illinois
| Zip Code | Child Poverty | vs State | vs National | |
| 1. | 62205 | 100.0% | 16.9%(+83.1)#1 | 18.1%(+81.9)#4 |
| 2. | 60549 | 100.0% | 16.9%(+83.1)#2 | 18.1%(+81.9)#161 |
| 3. | 61067 | 100.0% | 16.9%(+83.1)#3 | 18.1%(+81.9)#190 |
| 4. | 61560 | 100.0% | 16.9%(+83.1)#4 | 18.1%(+81.9)#200 |
| 5. | 62054 | 100.0% | 16.9%(+83.1)#5 | 18.1%(+81.9)#294 |
| 6. | 62053 | 100.0% | 16.9%(+83.1)#6 | 18.1%(+81.9)#318 |
| 7. | 61468 | 100.0% | 16.9%(+83.1)#7 | 18.1%(+81.9)#423 |
| 8. | 62672 | 100.0% | 16.9%(+83.1)#8 | 18.1%(+81.9)#463 |
| 9. | 62841 | 100.0% | 16.9%(+83.1)#9 | 18.1%(+81.9)#473 |
| 10. | 61852 | 100.0% | 16.9%(+83.1)#10 | 18.1%(+81.9)#477 |
| 11. | 62843 | 100.0% | 16.9%(+83.1)#11 | 18.1%(+81.9)#517 |
| 12. | 60926 | 100.0% | 16.9%(+83.1)#12 | 18.1%(+81.9)#525 |
| 13. | 62928 | 100.0% | 16.9%(+83.1)#13 | 18.1%(+81.9)#529 |
| 14. | 60519 | 100.0% | 16.9%(+83.1)#14 | 18.1%(+81.9)#530 |
| 15. | 61346 | 100.0% | 16.9%(+83.1)#15 | 18.1%(+81.9)#546 |
| 16. | 62879 | 100.0% | 16.9%(+83.1)#16 | 18.1%(+81.9)#547 |
| 17. | 61424 | 100.0% | 16.9%(+83.1)#17 | 18.1%(+81.9)#555 |
| 18. | 62954 | 98.6% | 16.9%(+81.6)#18 | 18.1%(+80.5)#561 |
| 19. | 61439 | 94.7% | 16.9%(+77.8)#19 | 18.1%(+76.7)#585 |
| 20. | 62361 | 92.2% | 16.9%(+75.3)#20 | 18.1%(+74.2)#614 |
| 21. | 62090 | 90.5% | 16.9%(+73.6)#21 | 18.1%(+72.4)#634 |
| 22. | 62921 | 88.1% | 16.9%(+71.2)#22 | 18.1%(+70.0)#654 |
| 23. | 60918 | 87.0% | 16.9%(+70.0)#23 | 18.1%(+68.9)#674 |
| 24. | 62811 | 84.6% | 16.9%(+67.7)#24 | 18.1%(+66.6)#717 |
| 25. | 62380 | 84.1% | 16.9%(+67.2)#25 | 18.1%(+66.0)#730 |
| 26. | 62477 | 82.5% | 16.9%(+65.5)#26 | 18.1%(+64.4)#758 |
| 27. | 61722 | 82.4% | 16.9%(+65.4)#27 | 18.1%(+64.3)#761 |
| 28. | 60945 | 81.8% | 16.9%(+64.9)#28 | 18.1%(+63.8)#775 |
| 29. | 61315 | 80.8% | 16.9%(+63.8)#29 | 18.1%(+62.7)#794 |
| 30. | 62203 | 80.0% | 16.9%(+63.1)#30 | 18.1%(+61.9)#806 |
| 31. | 61458 | 80.0% | 16.9%(+63.1)#31 | 18.1%(+61.9)#815 |
| 32. | 62206 | 79.8% | 16.9%(+62.8)#32 | 18.1%(+61.7)#830 |
| 33. | 62201 | 78.7% | 16.9%(+61.7)#33 | 18.1%(+60.6)#851 |
| 34. | 60946 | 77.8% | 16.9%(+60.9)#34 | 18.1%(+59.7)#879 |
| 35. | 62480 | 77.3% | 16.9%(+60.4)#35 | 18.1%(+59.2)#891 |
| 36. | 62682 | 75.8% | 16.9%(+58.8)#36 | 18.1%(+57.7)#938 |
| 37. | 62238 | 75.0% | 16.9%(+58.1)#37 | 18.1%(+56.9)#964 |
| 38. | 62018 | 74.4% | 16.9%(+57.5)#38 | 18.1%(+56.3)#993 |
| 39. | 62027 | 73.7% | 16.9%(+56.8)#39 | 18.1%(+55.6)#1,022 |
| 40. | 60942 | 73.5% | 16.9%(+56.6)#40 | 18.1%(+55.4)#1,029 |
| 41. | 62885 | 73.1% | 16.9%(+56.2)#41 | 18.1%(+55.0)#1,049 |
| 42. | 62883 | 71.4% | 16.9%(+54.5)#42 | 18.1%(+53.4)#1,100 |
| 43. | 62996 | 70.1% | 16.9%(+53.2)#43 | 18.1%(+52.1)#1,141 |
| 44. | 61041 | 68.2% | 16.9%(+51.3)#44 | 18.1%(+50.2)#1,220 |
| 45. | 62089 | 67.6% | 16.9%(+50.6)#45 | 18.1%(+49.5)#1,251 |
| 46. | 62019 | 66.7% | 16.9%(+49.7)#46 | 18.1%(+48.6)#1,303 |
| 47. | 62349 | 65.5% | 16.9%(+48.6)#47 | 18.1%(+47.5)#1,364 |
| 48. | 60962 | 65.3% | 16.9%(+48.4)#48 | 18.1%(+47.2)#1,369 |
| 49. | 62984 | 63.9% | 16.9%(+47.0)#49 | 18.1%(+45.9)#1,454 |
| 50. | 60301 | 63.4% | 16.9%(+46.5)#50 | 18.1%(+45.4)#1,477 |
| 51. | 61532 | 62.5% | 16.9%(+45.6)#51 | 18.1%(+44.4)#1,531 |
| 52. | 62354 | 61.8% | 16.9%(+44.8)#52 | 18.1%(+43.7)#1,575 |
| 53. | 62630 | 61.5% | 16.9%(+44.6)#53 | 18.1%(+43.5)#1,592 |
| 54. | 62995 | 61.4% | 16.9%(+44.5)#54 | 18.1%(+43.4)#1,603 |
| 55. | 62253 | 61.1% | 16.9%(+44.2)#55 | 18.1%(+43.0)#1,618 |
| 56. | 61104 | 61.0% | 16.9%(+44.1)#56 | 18.1%(+43.0)#1,624 |
| 57. | 62703 | 60.8% | 16.9%(+43.8)#57 | 18.1%(+42.7)#1,637 |
| 58. | 62446 | 60.7% | 16.9%(+43.8)#58 | 18.1%(+42.7)#1,640 |
| 59. | 60428 | 60.7% | 16.9%(+43.8)#59 | 18.1%(+42.6)#1,643 |
| 60. | 62088 | 60.5% | 16.9%(+43.6)#60 | 18.1%(+42.4)#1,650 |
| 61. | 62086 | 60.0% | 16.9%(+43.1)#61 | 18.1%(+41.9)#1,682 |
| 62. | 61454 | 60.0% | 16.9%(+43.1)#62 | 18.1%(+41.9)#1,692 |
| 63. | 60933 | 60.0% | 16.9%(+43.1)#63 | 18.1%(+41.9)#1,696 |
| 64. | 62273 | 60.0% | 16.9%(+43.1)#64 | 18.1%(+41.9)#1,699 |
| 65. | 61460 | 60.0% | 16.9%(+43.1)#65 | 18.1%(+41.9)#1,703 |
| 66. | 62938 | 59.7% | 16.9%(+42.8)#66 | 18.1%(+41.6)#1,717 |
| 67. | 61603 | 59.2% | 16.9%(+42.2)#67 | 18.1%(+41.1)#1,755 |
| 68. | 61533 | 59.1% | 16.9%(+42.2)#68 | 18.1%(+41.1)#1,758 |
| 69. | 62352 | 59.1% | 16.9%(+42.2)#69 | 18.1%(+41.0)#1,763 |
| 70. | 61844 | 58.3% | 16.9%(+41.4)#70 | 18.1%(+40.3)#1,806 |
| 71. | 62860 | 57.4% | 16.9%(+40.5)#71 | 18.1%(+39.4)#1,867 |
| 72. | 62957 | 57.1% | 16.9%(+40.2)#72 | 18.1%(+39.1)#1,891 |
| 73. | 62901 | 56.9% | 16.9%(+40.0)#73 | 18.1%(+38.8)#1,917 |
| 74. | 62458 | 56.6% | 16.9%(+39.7)#74 | 18.1%(+38.6)#1,935 |
| 75. | 62685 | 55.9% | 16.9%(+39.0)#75 | 18.1%(+37.8)#1,997 |
| 76. | 62941 | 55.6% | 16.9%(+38.6)#76 | 18.1%(+37.5)#2,039 |
| 77. | 62292 | 55.0% | 16.9%(+38.1)#77 | 18.1%(+36.9)#2,070 |
| 78. | 60624 | 54.7% | 16.9%(+37.8)#78 | 18.1%(+36.6)#2,091 |
| 79. | 61239 | 54.3% | 16.9%(+37.4)#79 | 18.1%(+36.2)#2,121 |
| 80. | 62207 | 53.9% | 16.9%(+37.0)#80 | 18.1%(+35.8)#2,152 |
| 81. | 62204 | 53.8% | 16.9%(+36.8)#81 | 18.1%(+35.7)#2,166 |
| 82. | 62444 | 53.3% | 16.9%(+36.4)#82 | 18.1%(+35.3)#2,223 |
| 83. | 62091 | 52.8% | 16.9%(+35.9)#83 | 18.1%(+34.7)#2,272 |
| 84. | 60644 | 52.4% | 16.9%(+35.5)#84 | 18.1%(+34.4)#2,306 |
| 85. | 62907 | 51.9% | 16.9%(+35.0)#85 | 18.1%(+33.8)#2,350 |
| 86. | 61605 | 51.9% | 16.9%(+35.0)#86 | 18.1%(+33.8)#2,351 |
| 87. | 62983 | 51.6% | 16.9%(+34.7)#87 | 18.1%(+33.6)#2,370 |
| 88. | 61377 | 51.6% | 16.9%(+34.7)#88 | 18.1%(+33.5)#2,375 |
| 89. | 61060 | 50.8% | 16.9%(+33.8)#89 | 18.1%(+32.7)#2,445 |
| 90. | 60827 | 50.6% | 16.9%(+33.7)#90 | 18.1%(+32.5)#2,473 |
| 91. | 60636 | 50.2% | 16.9%(+33.3)#91 | 18.1%(+32.1)#2,508 |
| 92. | 61737 | 50.0% | 16.9%(+33.1)#92 | 18.1%(+31.9)#2,569 |
| 93. | 62886 | 50.0% | 16.9%(+33.1)#93 | 18.1%(+31.9)#2,574 |
| 94. | 62833 | 50.0% | 16.9%(+33.1)#94 | 18.1%(+31.9)#2,579 |
| 95. | 62050 | 50.0% | 16.9%(+33.1)#95 | 18.1%(+31.9)#2,583 |
| 96. | 62419 | 50.0% | 16.9%(+33.1)#96 | 18.1%(+31.9)#2,588 |
| 97. | 62820 | 50.0% | 16.9%(+33.1)#97 | 18.1%(+31.9)#2,609 |
| 98. | 61541 | 50.0% | 16.9%(+33.1)#98 | 18.1%(+31.9)#2,615 |
| 99. | 62966 | 49.2% | 16.9%(+32.3)#99 | 18.1%(+31.2)#2,663 |
| 100. | 61089 | 49.0% | 16.9%(+32.1)#100 | 18.1%(+30.9)#2,694 |
Common Questions
What are the Top 10 Zip Codes with the Highest Poverty Level Among Children Under the Age of 5 in Illinois?
Top 10 Zip Codes with the Highest Poverty Level Among Children Under the Age of 5 in Illinois are:
What zip code has the Highest Poverty Level Among Children Under the Age of 5 in Illinois?
62205 has the Highest Poverty Level Among Children Under the Age of 5 in Illinois with 100.0%.
What is the Poverty Level Among Children Under the Age of 5 in the State of Illinois?
Poverty Level Among Children Under the Age of 5 in Illinois is 16.9%.
What is the Poverty Level Among Children Under the Age of 5 in the United States?
Poverty Level Among Children Under the Age of 5 in the United States is 18.1%.