Industry borough, PA Map & Demographics
Industry borough Overview
$33,668
PER CAPITA INCOME
$84,722
AVG FAMILY INCOME
$69,773
AVG HOUSEHOLD INCOME
35.6%
WAGE / INCOME GAP [ % ]
64.4¢/ $1
WAGE / INCOME GAP [ $ ]
$10,391
FAMILY INCOME DEFICIT
0.37
INEQUALITY / GINI INDEX
1,678
TOTAL POPULATION
754
MALE POPULATION
924
FEMALE POPULATION
81.60
MALES / 100 FEMALES
122.55
FEMALES / 100 MALES
40.9
MEDIAN AGE
2.7
AVG FAMILY SIZE
2.3
AVG HOUSEHOLD SIZE
948
LABOR FORCE [ PEOPLE ]
66.4%
PERCENT IN LABOR FORCE
6.8%
UNEMPLOYMENT RATE
Income in Industry borough
Income Overview in Industry borough
Per Capita Income in Industry borough is $33,668, while median incomes of families and households are $84,722 and $69,773 respectively.
| Characteristic | Number | Measure |
| Per Capita Income | 1,678 | $33,668 |
| Median Family Income | 478 | $84,722 |
| Mean Family Income | 478 | $92,788 |
| Median Household Income | 718 | $69,773 |
| Mean Household Income | 718 | $78,398 |
| Income Deficit | 478 | $10,391 |
| Wage / Income Gap (%) | 1,678 | 35.59% |
| Wage / Income Gap ($) | 1,678 | 64.41¢ per $1 |
| Gini / Inequality Index | 1,678 | 0.37 |
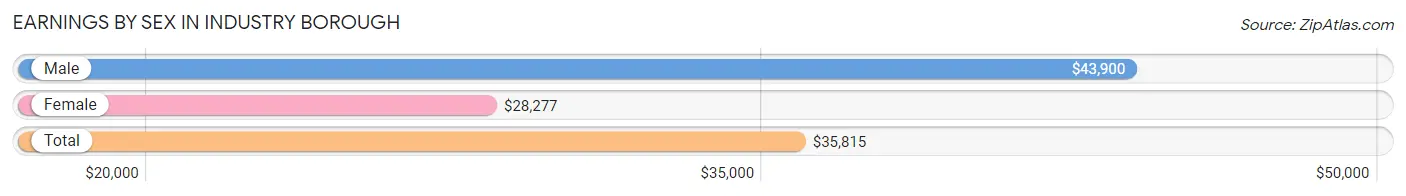
Earnings by Sex in Industry borough
Average Earnings in Industry borough are $35,815, $43,900 for men and $28,277 for women, a difference of 35.6%.
| Sex | Number | Average Earnings |
| Male | 516 (52.2%) | $43,900 |
| Female | 473 (47.8%) | $28,277 |
| Total | 989 (100.0%) | $35,815 |
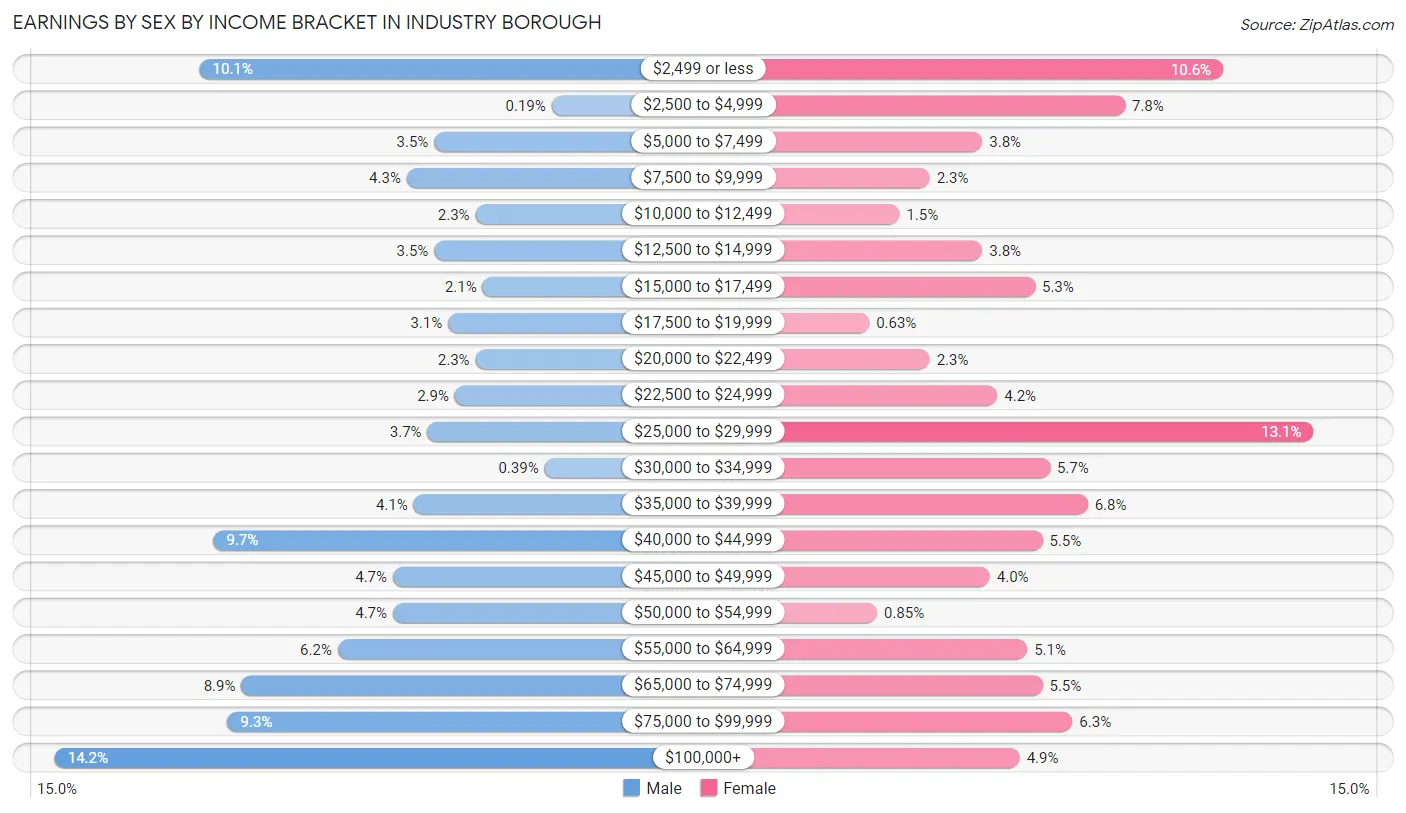
Earnings by Sex by Income Bracket in Industry borough
The most common earnings brackets in Industry borough are $100,000+ for men (73 | 14.1%) and $25,000 to $29,999 for women (62 | 13.1%).
| Income | Male | Female |
| $2,499 or less | 52 (10.1%) | 50 (10.6%) |
| $2,500 to $4,999 | 1 (0.2%) | 37 (7.8%) |
| $5,000 to $7,499 | 18 (3.5%) | 18 (3.8%) |
| $7,500 to $9,999 | 22 (4.3%) | 11 (2.3%) |
| $10,000 to $12,499 | 12 (2.3%) | 7 (1.5%) |
| $12,500 to $14,999 | 18 (3.5%) | 18 (3.8%) |
| $15,000 to $17,499 | 11 (2.1%) | 25 (5.3%) |
| $17,500 to $19,999 | 16 (3.1%) | 3 (0.6%) |
| $20,000 to $22,499 | 12 (2.3%) | 11 (2.3%) |
| $22,500 to $24,999 | 15 (2.9%) | 20 (4.2%) |
| $25,000 to $29,999 | 19 (3.7%) | 62 (13.1%) |
| $30,000 to $34,999 | 2 (0.4%) | 27 (5.7%) |
| $35,000 to $39,999 | 21 (4.1%) | 32 (6.8%) |
| $40,000 to $44,999 | 50 (9.7%) | 26 (5.5%) |
| $45,000 to $49,999 | 24 (4.6%) | 19 (4.0%) |
| $50,000 to $54,999 | 24 (4.6%) | 4 (0.9%) |
| $55,000 to $64,999 | 32 (6.2%) | 24 (5.1%) |
| $65,000 to $74,999 | 46 (8.9%) | 26 (5.5%) |
| $75,000 to $99,999 | 48 (9.3%) | 30 (6.3%) |
| $100,000+ | 73 (14.1%) | 23 (4.9%) |
| Total | 516 (100.0%) | 473 (100.0%) |
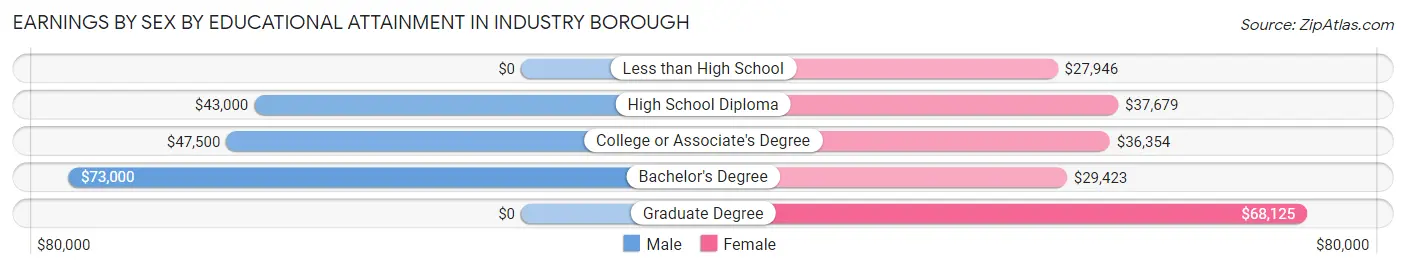
Earnings by Sex by Educational Attainment in Industry borough
Average earnings in Industry borough are $45,583 for men and $32,422 for women, a difference of 28.9%. Men with an educational attainment of bachelor's degree enjoy the highest average annual earnings of $73,000, while those with high school diploma education earn the least with $43,000. Women with an educational attainment of graduate degree earn the most with the average annual earnings of $68,125, while those with less than high school education have the smallest earnings of $27,946.
| Educational Attainment | Male Income | Female Income |
| Less than High School | - | - |
| High School Diploma | $43,000 | $37,679 |
| College or Associate's Degree | $47,500 | $36,354 |
| Bachelor's Degree | $73,000 | $29,423 |
| Graduate Degree | - | - |
| Total | $45,583 | $32,422 |
Family Income in Industry borough
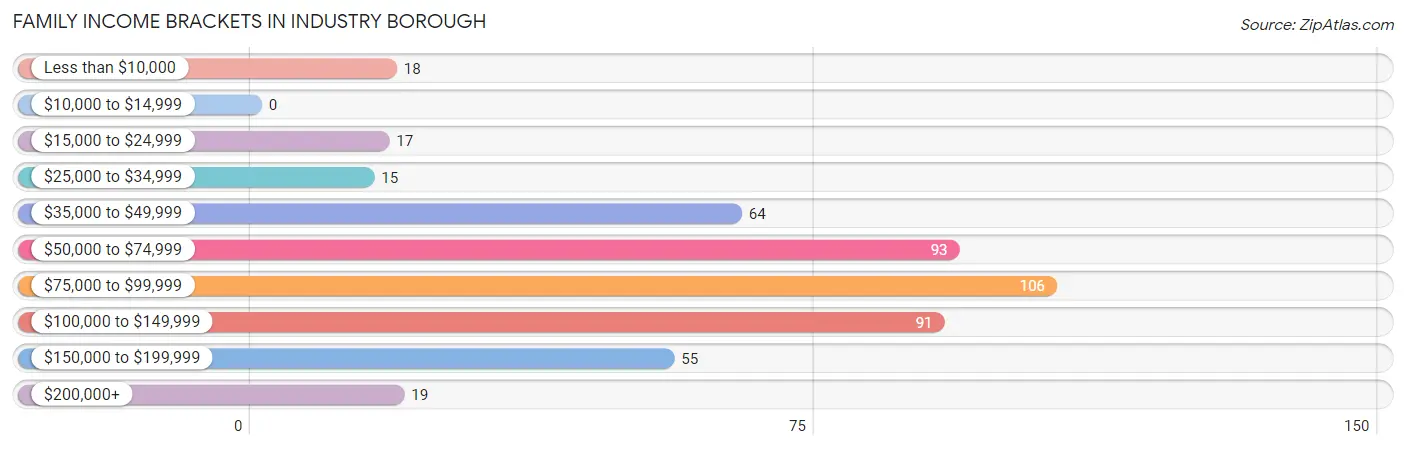
Family Income Brackets in Industry borough
According to the Industry borough family income data, there are 106 families falling into the $75,000 to $99,999 income range, which is the most common income bracket and makes up 22.2% of all families.
| Income Bracket | # Families | % Families |
| Less than $10,000 | 18 | 3.8% |
| $10,000 to $14,999 | 0 | 0.0% |
| $15,000 to $24,999 | 17 | 3.6% |
| $25,000 to $34,999 | 15 | 3.1% |
| $35,000 to $49,999 | 64 | 13.4% |
| $50,000 to $74,999 | 93 | 19.5% |
| $75,000 to $99,999 | 106 | 22.2% |
| $100,000 to $149,999 | 91 | 19.0% |
| $150,000 to $199,999 | 55 | 11.5% |
| $200,000+ | 19 | 4.0% |
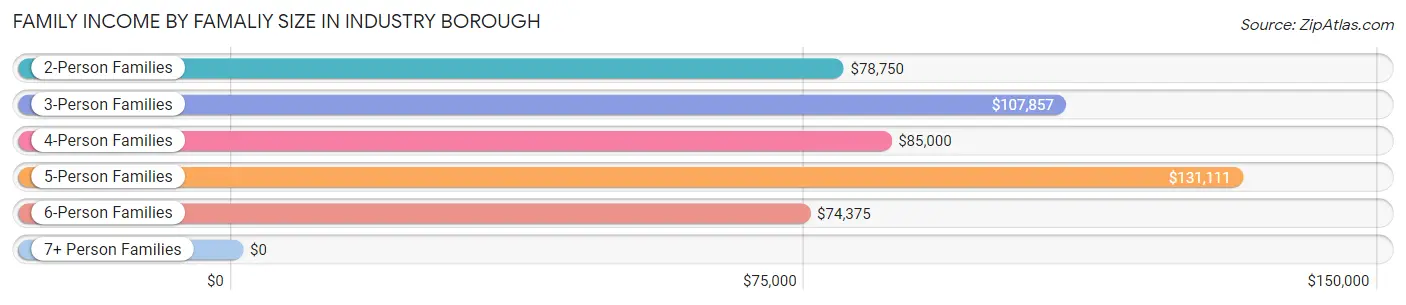
Family Income by Famaliy Size in Industry borough
5-person families (26 | 5.4%) account for the highest median family income in Industry borough with $131,111 per family, while 2-person families (286 | 59.8%) have the highest median income of $39,375 per family member.
| Income Bracket | # Families | Median Income |
| 2-Person Families | 286 (59.8%) | $78,750 |
| 3-Person Families | 82 (17.2%) | $107,857 |
| 4-Person Families | 76 (15.9%) | $85,000 |
| 5-Person Families | 26 (5.4%) | $131,111 |
| 6-Person Families | 5 (1.1%) | $74,375 |
| 7+ Person Families | 3 (0.6%) | $0 |
| Total | 478 (100.0%) | $84,722 |
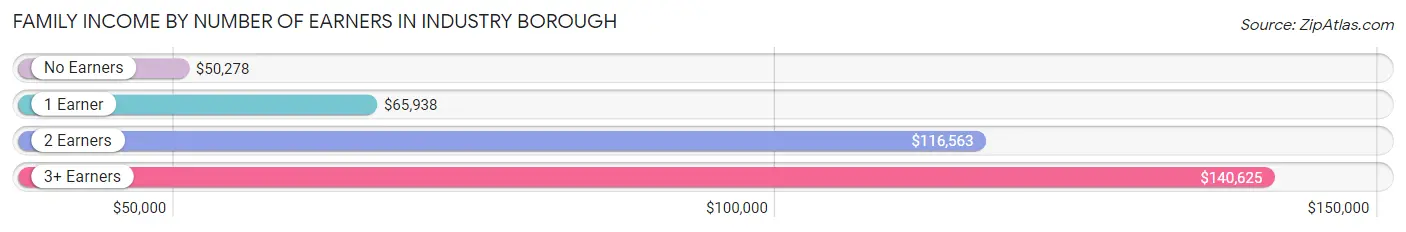
Family Income by Number of Earners in Industry borough
The median family income in Industry borough is $84,722, with families comprising 3+ earners (44) having the highest median family income of $140,625, while families with no earners (64) have the lowest median family income of $50,278, accounting for 9.2% and 13.4% of families, respectively.
| Number of Earners | # Families | Median Income |
| No Earners | 64 (13.4%) | $50,278 |
| 1 Earner | 169 (35.4%) | $65,938 |
| 2 Earners | 201 (42.0%) | $116,563 |
| 3+ Earners | 44 (9.2%) | $140,625 |
| Total | 478 (100.0%) | $84,722 |
Household Income in Industry borough
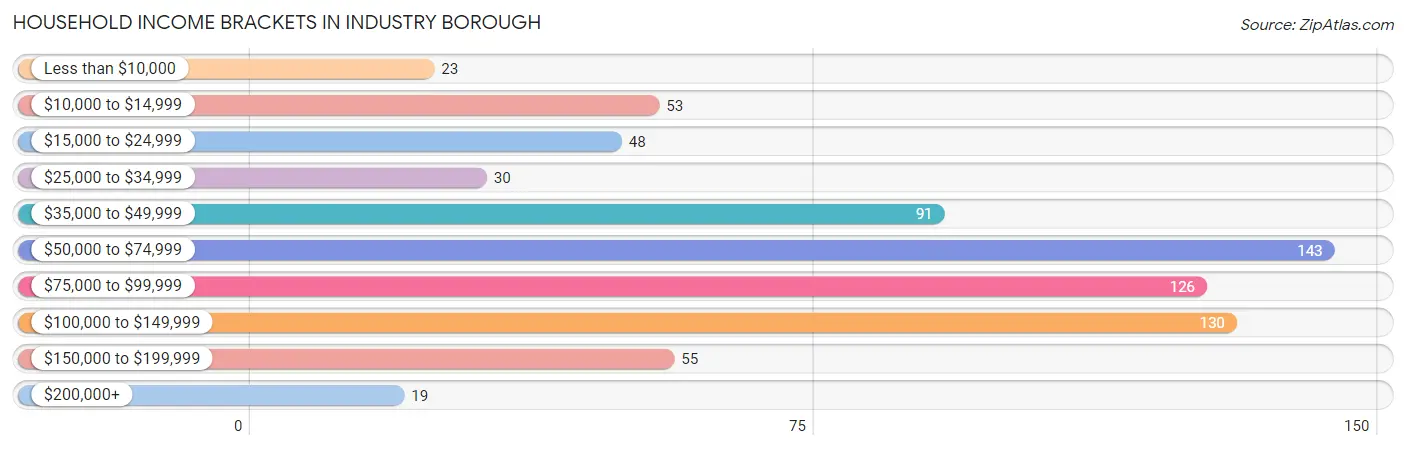
Household Income Brackets in Industry borough
With 143 households falling in the category, the $50,000 to $74,999 income range is the most frequent in Industry borough, accounting for 19.9% of all households. In contrast, only 19 households (2.6%) fall into the $200,000+ income bracket, making it the least populous group.
| Income Bracket | # Households | % Households |
| Less than $10,000 | 23 | 3.2% |
| $10,000 to $14,999 | 53 | 7.4% |
| $15,000 to $24,999 | 48 | 6.7% |
| $25,000 to $34,999 | 30 | 4.2% |
| $35,000 to $49,999 | 91 | 12.7% |
| $50,000 to $74,999 | 143 | 19.9% |
| $75,000 to $99,999 | 126 | 17.5% |
| $100,000 to $149,999 | 130 | 18.1% |
| $150,000 to $199,999 | 55 | 7.7% |
| $200,000+ | 19 | 2.6% |
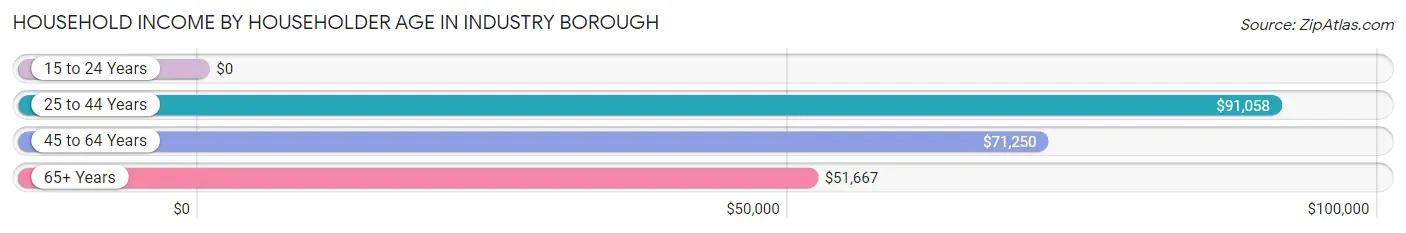
Household Income by Householder Age in Industry borough
The median household income in Industry borough is $69,773, with the highest median household income of $91,058 found in the 25 to 44 years age bracket for the primary householder. A total of 229 households (31.9%) fall into this category. Meanwhile, the 15 to 24 years age bracket for the primary householder has the lowest median household income of $0, with 21 households (2.9%) in this group.
| Income Bracket | # Households | Median Income |
| 15 to 24 Years | 21 (2.9%) | $0 |
| 25 to 44 Years | 229 (31.9%) | $91,058 |
| 45 to 64 Years | 240 (33.4%) | $71,250 |
| 65+ Years | 228 (31.8%) | $51,667 |
| Total | 718 (100.0%) | $69,773 |
Poverty in Industry borough
Income Below Poverty by Sex and Age in Industry borough
With 10.4% poverty level for males and 12.8% for females among the residents of Industry borough, under 5 year old males and 12 to 14 year old females are the most vulnerable to poverty, with 9 males (28.1%) and 10 females (40.0%) in their respective age groups living below the poverty level.
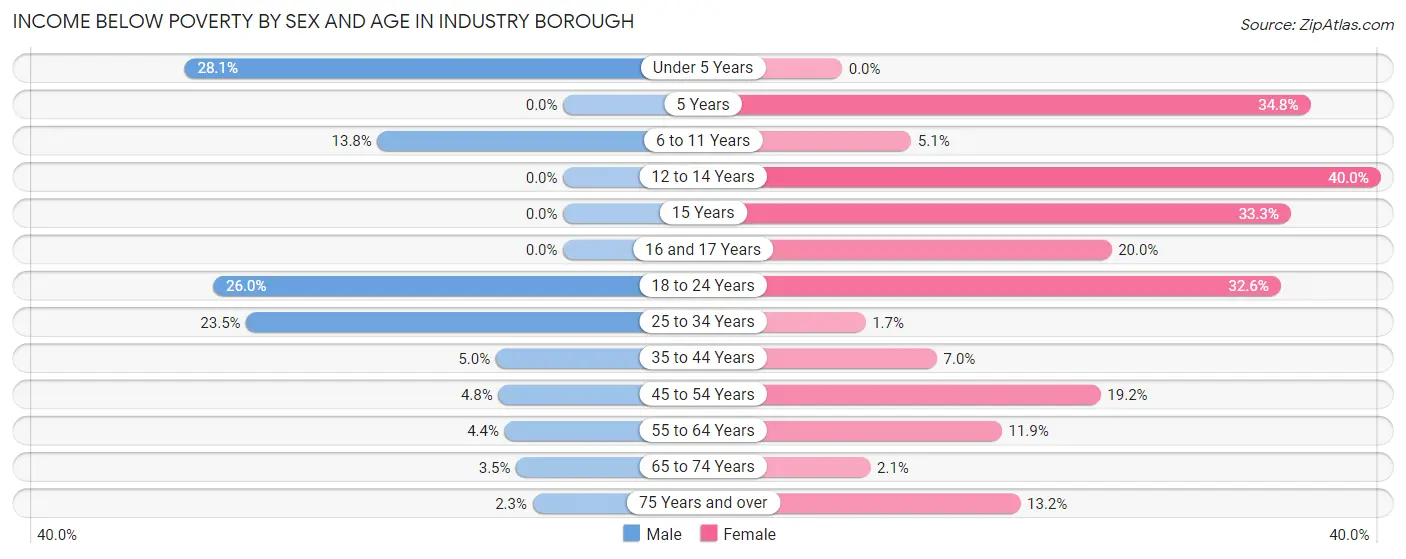
| Age Bracket | Male | Female |
| Under 5 Years | 9 (28.1%) | 0 (0.0%) |
| 5 Years | 0 (0.0%) | 8 (34.8%) |
| 6 to 11 Years | 4 (13.8%) | 2 (5.1%) |
| 12 to 14 Years | 0 (0.0%) | 10 (40.0%) |
| 15 Years | 0 (0.0%) | 3 (33.3%) |
| 16 and 17 Years | 0 (0.0%) | 9 (20.0%) |
| 18 to 24 Years | 13 (26.0%) | 29 (32.6%) |
| 25 to 34 Years | 32 (23.5%) | 2 (1.7%) |
| 35 to 44 Years | 6 (5.0%) | 5 (7.0%) |
| 45 to 54 Years | 5 (4.8%) | 24 (19.2%) |
| 55 to 64 Years | 4 (4.3%) | 14 (11.9%) |
| 65 to 74 Years | 3 (3.5%) | 3 (2.1%) |
| 75 Years and over | 1 (2.3%) | 9 (13.2%) |
| Total | 77 (10.4%) | 118 (12.8%) |
Income Above Poverty by Sex and Age in Industry borough
According to the poverty statistics in Industry borough, males aged 5 years and females aged under 5 years are the age groups that are most secure financially, with 100.0% of males and 100.0% of females in these age groups living above the poverty line.
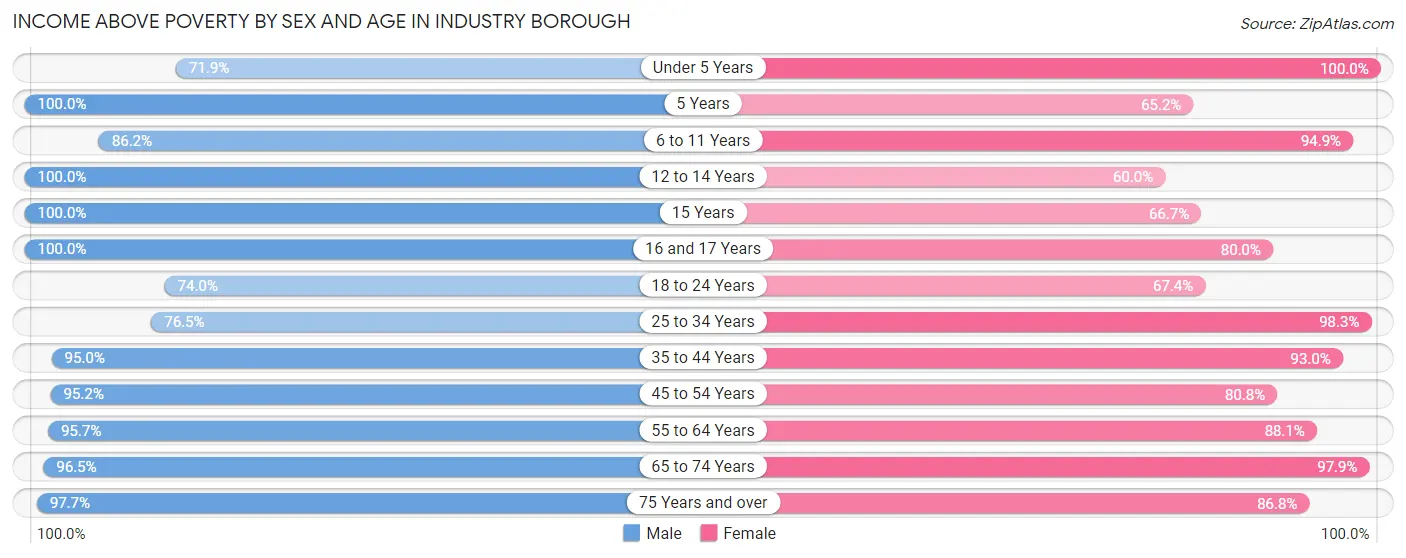
| Age Bracket | Male | Female |
| Under 5 Years | 23 (71.9%) | 51 (100.0%) |
| 5 Years | 8 (100.0%) | 15 (65.2%) |
| 6 to 11 Years | 25 (86.2%) | 37 (94.9%) |
| 12 to 14 Years | 15 (100.0%) | 15 (60.0%) |
| 15 Years | 5 (100.0%) | 6 (66.7%) |
| 16 and 17 Years | 22 (100.0%) | 36 (80.0%) |
| 18 to 24 Years | 37 (74.0%) | 60 (67.4%) |
| 25 to 34 Years | 104 (76.5%) | 113 (98.3%) |
| 35 to 44 Years | 114 (95.0%) | 66 (93.0%) |
| 45 to 54 Years | 99 (95.2%) | 101 (80.8%) |
| 55 to 64 Years | 88 (95.7%) | 104 (88.1%) |
| 65 to 74 Years | 83 (96.5%) | 140 (97.9%) |
| 75 Years and over | 43 (97.7%) | 59 (86.8%) |
| Total | 666 (89.6%) | 803 (87.2%) |
Income Below Poverty Among Married-Couple Families in Industry borough
The poverty statistics for married-couple families in Industry borough show that 2.1% or 7 of the total 339 families live below the poverty line. Families with 1 or 2 children have the highest poverty rate of 3.5%, comprising of 3 families. On the other hand, families with 3 or 4 children have the lowest poverty rate of 0.0%, which includes 0 families.
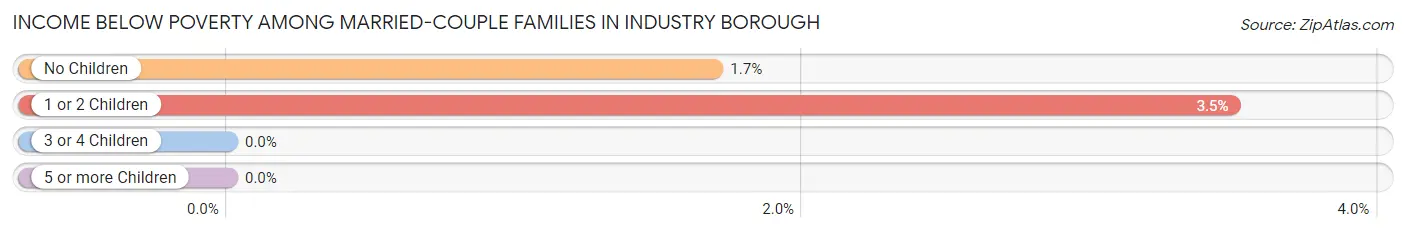
| Children | Above Poverty | Below Poverty |
| No Children | 232 (98.3%) | 4 (1.7%) |
| 1 or 2 Children | 83 (96.5%) | 3 (3.5%) |
| 3 or 4 Children | 14 (100.0%) | 0 (0.0%) |
| 5 or more Children | 3 (100.0%) | 0 (0.0%) |
| Total | 332 (97.9%) | 7 (2.1%) |
Income Below Poverty Among Single-Parent Households in Industry borough
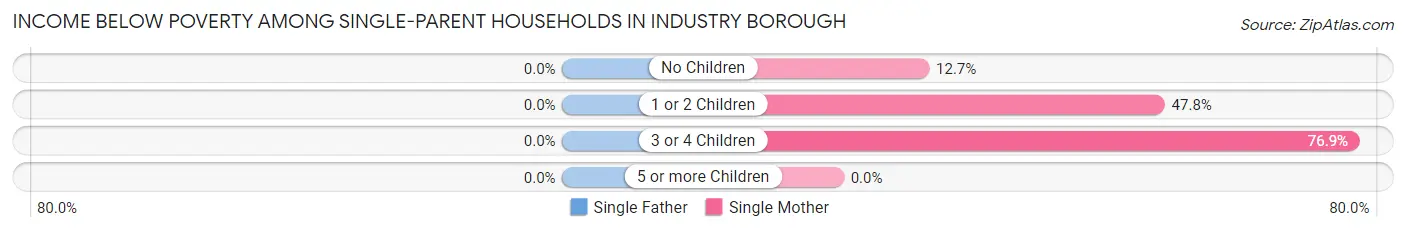
| Children | Single Father | Single Mother |
| No Children | 0 (0.0%) | 7 (12.7%) |
| 1 or 2 Children | 0 (0.0%) | 11 (47.8%) |
| 3 or 4 Children | 0 (0.0%) | 10 (76.9%) |
| 5 or more Children | 0 (0.0%) | 0 (0.0%) |
| Total | 0 (0.0%) | 28 (30.8%) |
Income Below Poverty Among Married-Couple vs Single-Parent Households in Industry borough
The poverty data for Industry borough shows that 7 of the married-couple family households (2.1%) and 28 of the single-parent households (20.1%) are living below the poverty level. Within the married-couple family households, those with 1 or 2 children have the highest poverty rate, with 3 households (3.5%) falling below the poverty line. Among the single-parent households, those with 3 or 4 children have the highest poverty rate, with 10 household (76.9%) living below poverty.
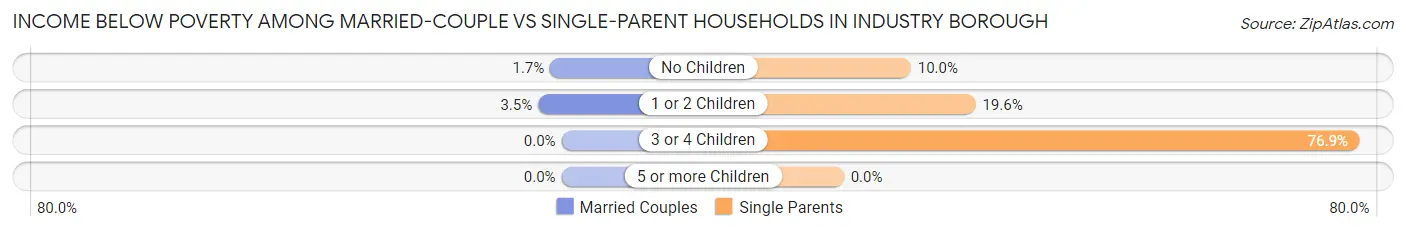
| Children | Married-Couple Families | Single-Parent Households |
| No Children | 4 (1.7%) | 7 (10.0%) |
| 1 or 2 Children | 3 (3.5%) | 11 (19.6%) |
| 3 or 4 Children | 0 (0.0%) | 10 (76.9%) |
| 5 or more Children | 0 (0.0%) | 0 (0.0%) |
| Total | 7 (2.1%) | 28 (20.1%) |
Race in Industry borough
The most populous races in Industry borough are White / Caucasian (1,549 | 92.3%), Two or more Races (49 | 2.9%), and Black / African American (39 | 2.3%).
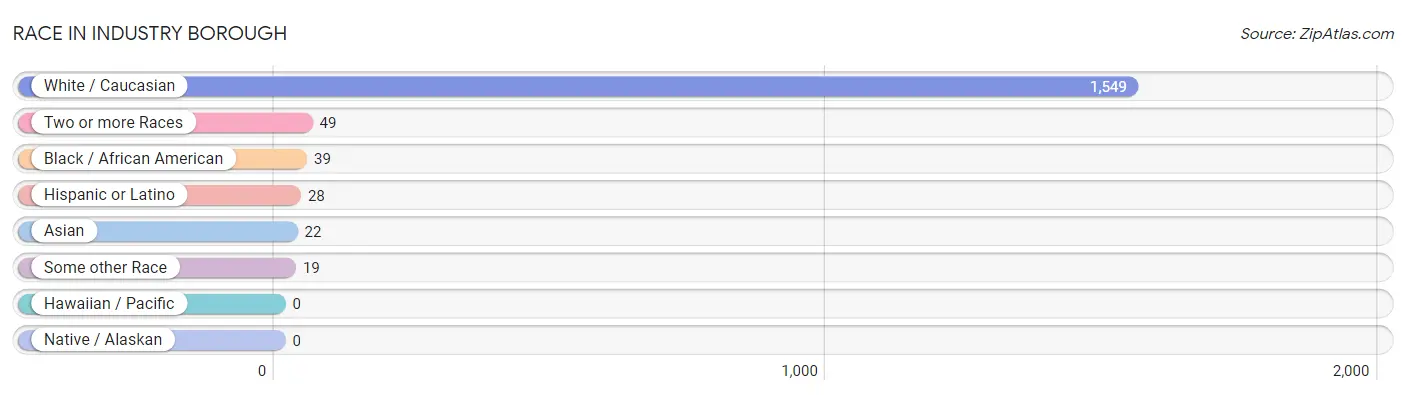
| Race | # Population | % Population |
| Asian | 22 | 1.3% |
| Black / African American | 39 | 2.3% |
| Hawaiian / Pacific | 0 | 0.0% |
| Hispanic or Latino | 28 | 1.7% |
| Native / Alaskan | 0 | 0.0% |
| White / Caucasian | 1,549 | 92.3% |
| Two or more Races | 49 | 2.9% |
| Some other Race | 19 | 1.1% |
| Total | 1,678 | 100.0% |
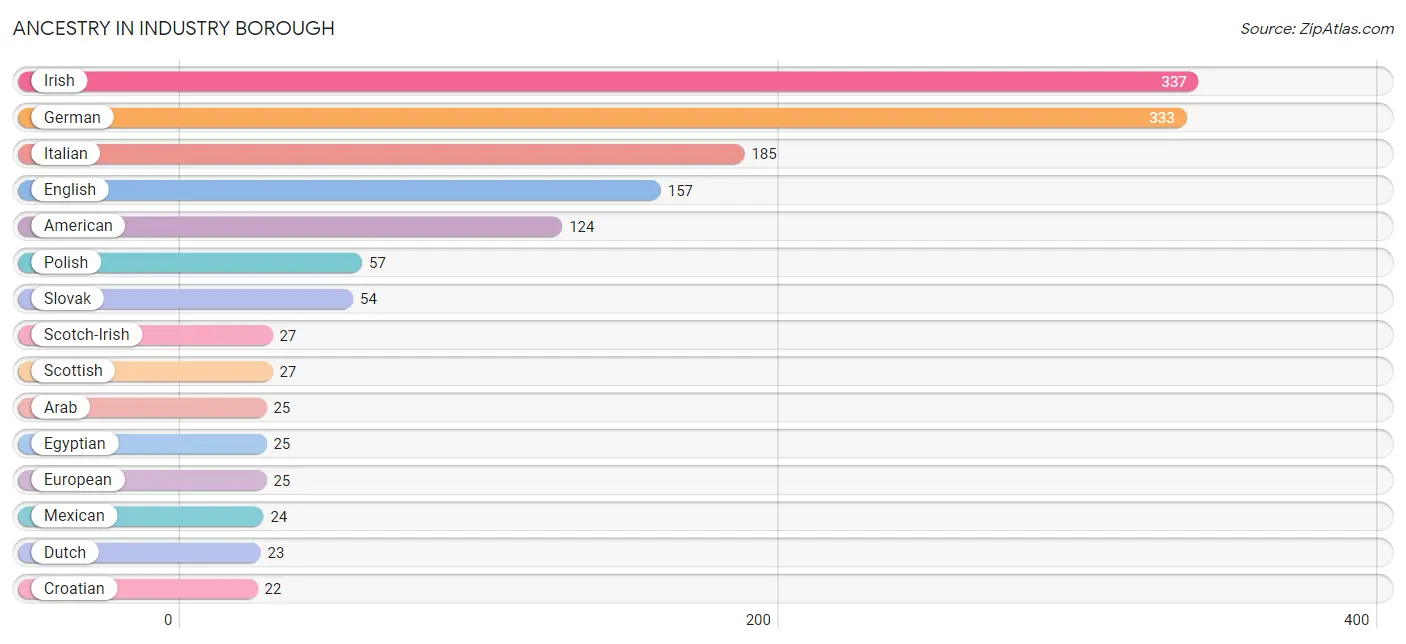
Ancestry in Industry borough
The most populous ancestries reported in Industry borough are Irish (337 | 20.1%), German (333 | 19.9%), Italian (185 | 11.0%), English (157 | 9.4%), and American (124 | 7.4%), together accounting for 67.7% of all Industry borough residents.
| Ancestry | # Population | % Population |
| American | 124 | 7.4% |
| Arab | 25 | 1.5% |
| Austrian | 12 | 0.7% |
| Bhutanese | 4 | 0.2% |
| Blackfeet | 2 | 0.1% |
| Brazilian | 8 | 0.5% |
| Croatian | 22 | 1.3% |
| Czech | 11 | 0.7% |
| Dutch | 23 | 1.4% |
| Egyptian | 25 | 1.5% |
| English | 157 | 9.4% |
| European | 25 | 1.5% |
| Finnish | 5 | 0.3% |
| French | 19 | 1.1% |
| French Canadian | 14 | 0.8% |
| German | 333 | 19.9% |
| Greek | 4 | 0.2% |
| Hungarian | 13 | 0.8% |
| Irish | 337 | 20.1% |
| Italian | 185 | 11.0% |
| Mexican | 24 | 1.4% |
| Nigerian | 1 | 0.1% |
| Northern European | 3 | 0.2% |
| Norwegian | 3 | 0.2% |
| Pennsylvania German | 4 | 0.2% |
| Polish | 57 | 3.4% |
| Puerto Rican | 4 | 0.2% |
| Romanian | 3 | 0.2% |
| Russian | 13 | 0.8% |
| Scotch-Irish | 27 | 1.6% |
| Scottish | 27 | 1.6% |
| Serbian | 22 | 1.3% |
| Slavic | 2 | 0.1% |
| Slovak | 54 | 3.2% |
| Subsaharan African | 1 | 0.1% |
| Ukrainian | 7 | 0.4% |
| Welsh | 10 | 0.6% |
| Yugoslavian | 1 | 0.1% | View All 38 Rows |
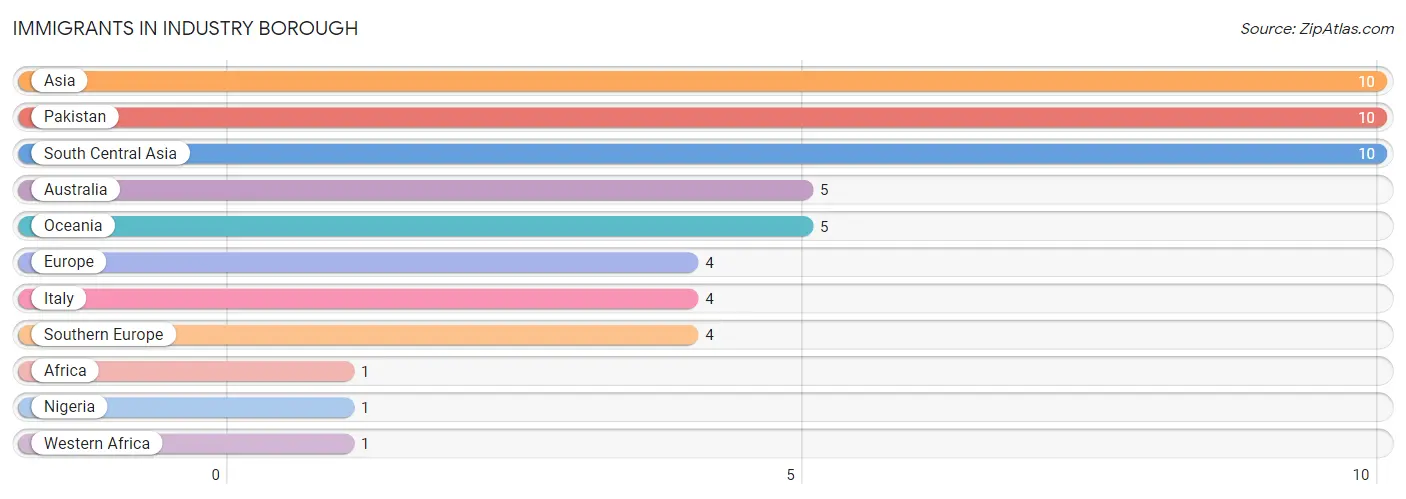
Immigrants in Industry borough
The most numerous immigrant groups reported in Industry borough came from Asia (10 | 0.6%), Pakistan (10 | 0.6%), South Central Asia (10 | 0.6%), Australia (5 | 0.3%), and Oceania (5 | 0.3%), together accounting for 2.4% of all Industry borough residents.
| Immigration Origin | # Population | % Population |
| Africa | 1 | 0.1% |
| Asia | 10 | 0.6% |
| Australia | 5 | 0.3% |
| Europe | 4 | 0.2% |
| Italy | 4 | 0.2% |
| Nigeria | 1 | 0.1% |
| Oceania | 5 | 0.3% |
| Pakistan | 10 | 0.6% |
| South Central Asia | 10 | 0.6% |
| Southern Europe | 4 | 0.2% |
| Western Africa | 1 | 0.1% | View All 11 Rows |
Sex and Age in Industry borough
Sex and Age in Industry borough
The most populous age groups in Industry borough are 30 to 34 Years (89 | 11.8%) for men and 15 to 19 Years (89 | 9.6%) for women.
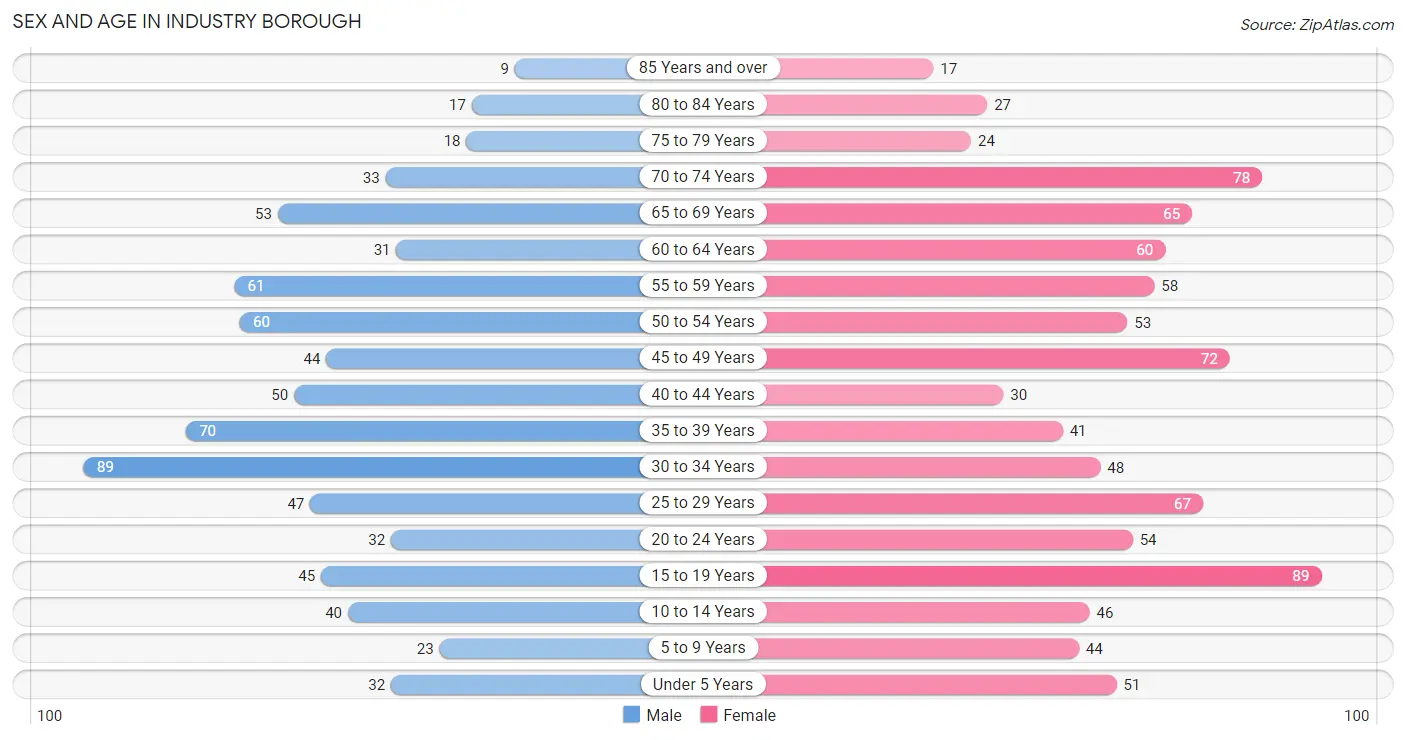
| Age Bracket | Male | Female |
| Under 5 Years | 32 (4.2%) | 51 (5.5%) |
| 5 to 9 Years | 23 (3.0%) | 44 (4.8%) |
| 10 to 14 Years | 40 (5.3%) | 46 (5.0%) |
| 15 to 19 Years | 45 (6.0%) | 89 (9.6%) |
| 20 to 24 Years | 32 (4.2%) | 54 (5.8%) |
| 25 to 29 Years | 47 (6.2%) | 67 (7.2%) |
| 30 to 34 Years | 89 (11.8%) | 48 (5.2%) |
| 35 to 39 Years | 70 (9.3%) | 41 (4.4%) |
| 40 to 44 Years | 50 (6.6%) | 30 (3.3%) |
| 45 to 49 Years | 44 (5.8%) | 72 (7.8%) |
| 50 to 54 Years | 60 (8.0%) | 53 (5.7%) |
| 55 to 59 Years | 61 (8.1%) | 58 (6.3%) |
| 60 to 64 Years | 31 (4.1%) | 60 (6.5%) |
| 65 to 69 Years | 53 (7.0%) | 65 (7.0%) |
| 70 to 74 Years | 33 (4.4%) | 78 (8.4%) |
| 75 to 79 Years | 18 (2.4%) | 24 (2.6%) |
| 80 to 84 Years | 17 (2.2%) | 27 (2.9%) |
| 85 Years and over | 9 (1.2%) | 17 (1.8%) |
| Total | 754 (100.0%) | 924 (100.0%) |
Families and Households in Industry borough
Median Family Size in Industry borough
The median family size in Industry borough is 2.74 persons per family, with married-couple families (339 | 70.9%) accounting for the largest median family size of 2.78 persons per family. On the other hand, single male/father families (48 | 10.0%) represent the smallest median family size with 2.52 persons per family.
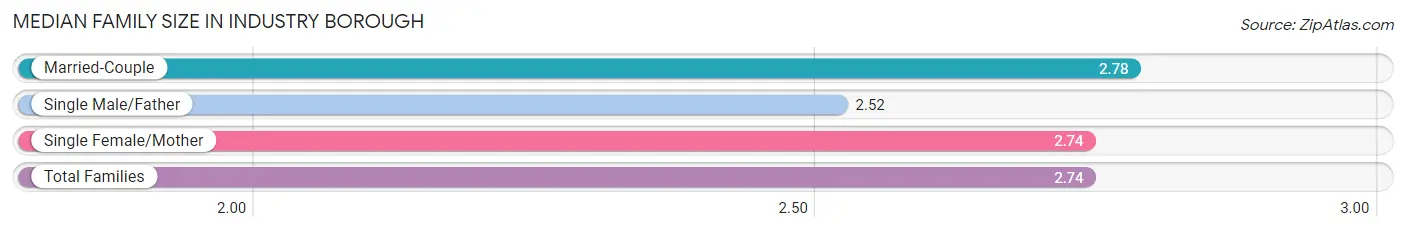
| Family Type | # Families | Family Size |
| Married-Couple | 339 (70.9%) | 2.78 |
| Single Male/Father | 48 (10.0%) | 2.52 |
| Single Female/Mother | 91 (19.0%) | 2.74 |
| Total Families | 478 (100.0%) | 2.74 |
Median Household Size in Industry borough
The median household size in Industry borough is 2.31 persons per household, with single male/father households (48 | 6.7%) accounting for the largest median household size of 2.92 persons per household. non-family households (240 | 33.4%) represent the smallest median household size with 1.35 persons per household.
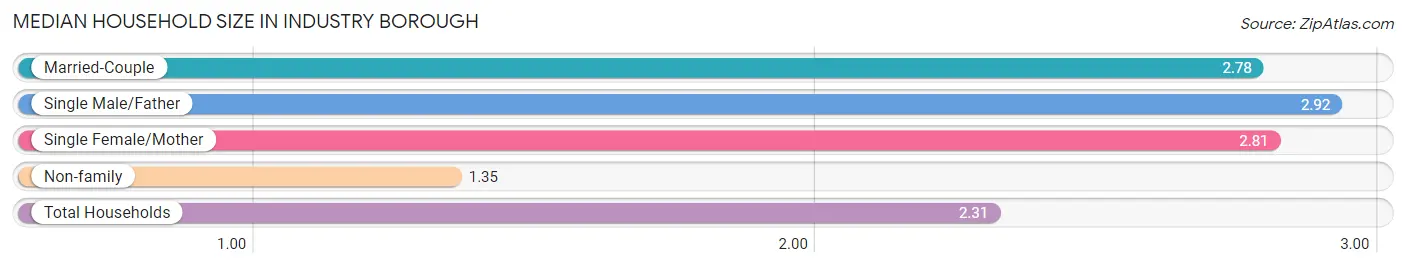
| Household Type | # Households | Household Size |
| Married-Couple | 339 (47.2%) | 2.78 |
| Single Male/Father | 48 (6.7%) | 2.92 |
| Single Female/Mother | 91 (12.7%) | 2.81 |
| Non-family | 240 (33.4%) | 1.35 |
| Total Households | 718 (100.0%) | 2.31 |
Household Size by Marriage Status in Industry borough
Out of a total of 718 households in Industry borough, 478 (66.6%) are family households, while 240 (33.4%) are nonfamily households. The most numerous type of family households are 2-person households, comprising 281, and the most common type of nonfamily households are 1-person households, comprising 190.
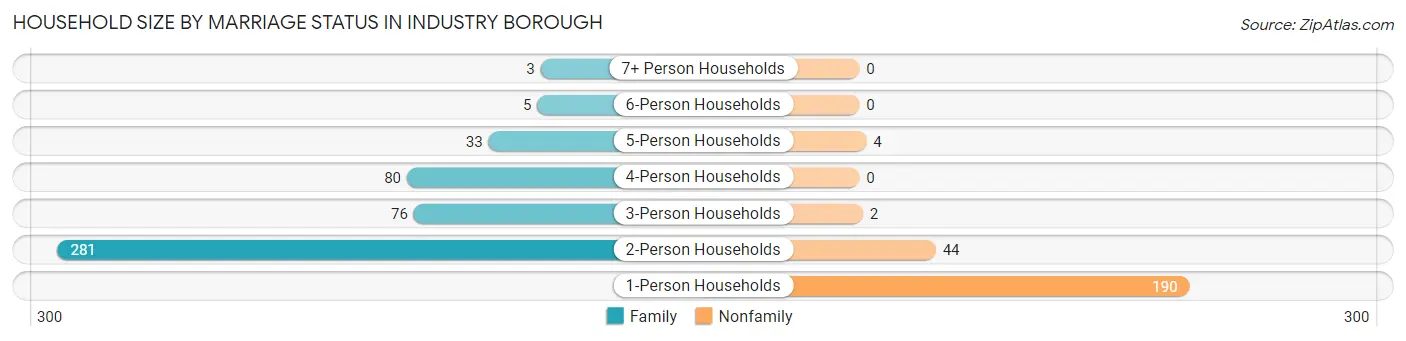
| Household Size | Family Households | Nonfamily Households |
| 1-Person Households | - | 190 (26.5%) |
| 2-Person Households | 281 (39.1%) | 44 (6.1%) |
| 3-Person Households | 76 (10.6%) | 2 (0.3%) |
| 4-Person Households | 80 (11.1%) | 0 (0.0%) |
| 5-Person Households | 33 (4.6%) | 4 (0.6%) |
| 6-Person Households | 5 (0.7%) | 0 (0.0%) |
| 7+ Person Households | 3 (0.4%) | 0 (0.0%) |
| Total | 478 (66.6%) | 240 (33.4%) |
Female Fertility in Industry borough
Fertility by Age in Industry borough
Average fertility rate in Industry borough is 44.0 births per 1,000 women. Women in the age bracket of 20 to 34 years have the highest fertility rate with 83.0 births per 1,000 women. Women in the age bracket of 20 to 34 years acount for 77.8% of all women with births.
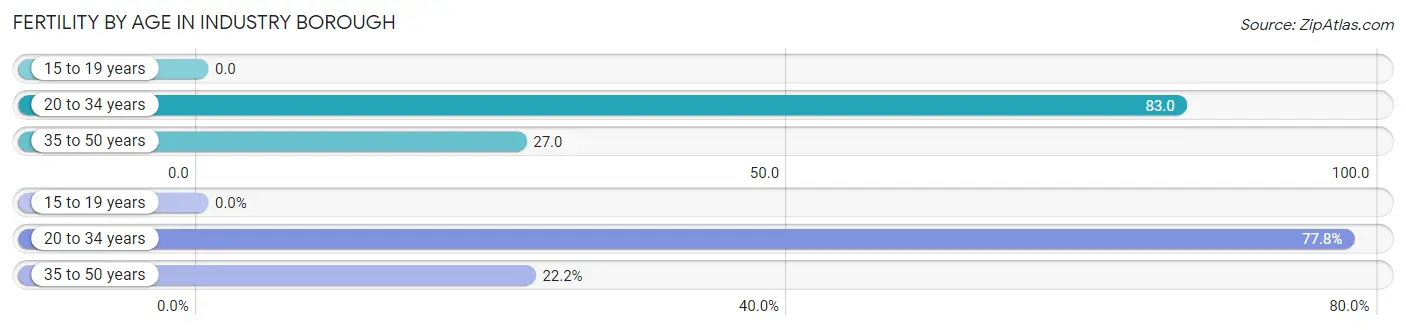
| Age Bracket | Women with Births | Births / 1,000 Women |
| 15 to 19 years | 0 (0.0%) | 0.0 |
| 20 to 34 years | 14 (77.8%) | 83.0 |
| 35 to 50 years | 4 (22.2%) | 27.0 |
| Total | 18 (100.0%) | 44.0 |
Fertility by Age by Marriage Status in Industry borough
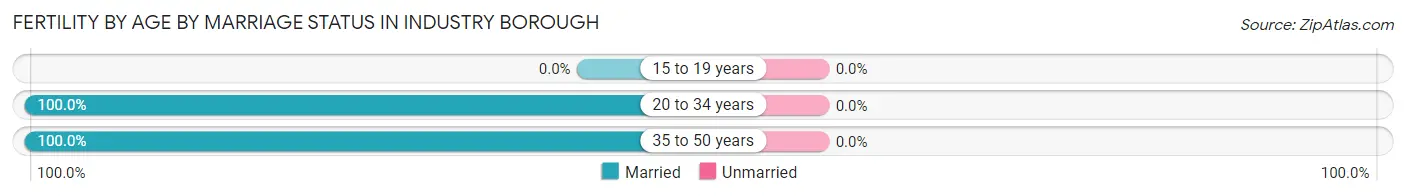
| Age Bracket | Married | Unmarried |
| 15 to 19 years | 0 (0.0%) | 0 (0.0%) |
| 20 to 34 years | 14 (100.0%) | 0 (0.0%) |
| 35 to 50 years | 4 (100.0%) | 0 (0.0%) |
| Total | 18 (100.0%) | 0 (0.0%) |
Fertility by Education in Industry borough
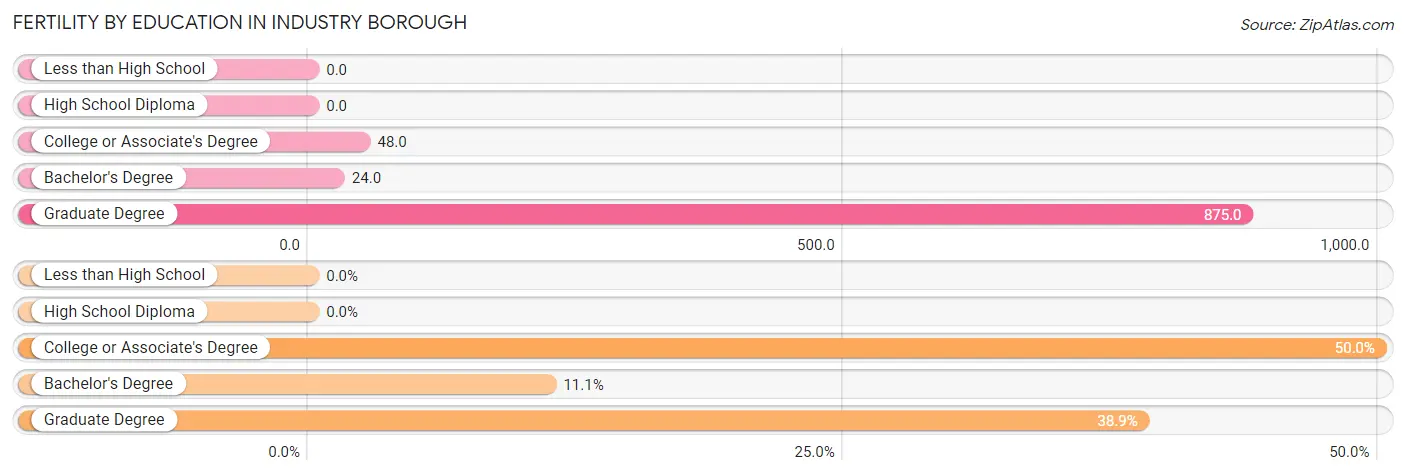
| Educational Attainment | Women with Births | Births / 1,000 Women |
| Less than High School | 0 (0.0%) | 0.0 |
| High School Diploma | 0 (0.0%) | 0.0 |
| College or Associate's Degree | 9 (50.0%) | 48.0 |
| Bachelor's Degree | 2 (11.1%) | 24.0 |
| Graduate Degree | 7 (38.9%) | 875.0 |
| Total | 18 (100.0%) | 44.0 |
Fertility by Education by Marriage Status in Industry borough
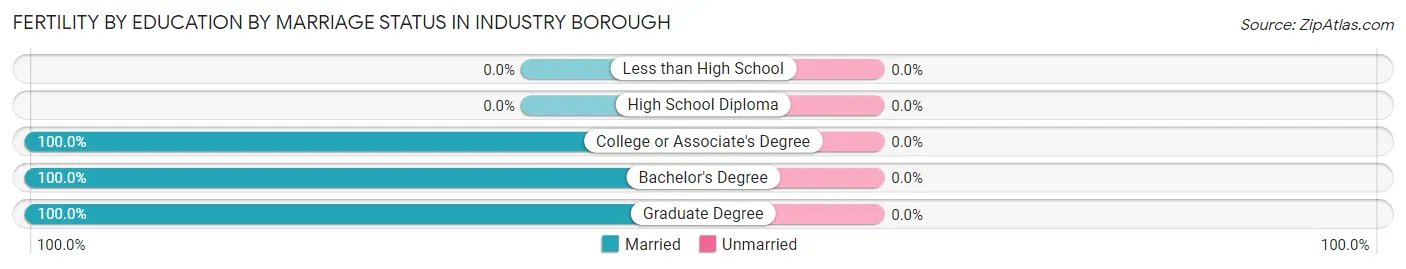
| Educational Attainment | Married | Unmarried |
| Less than High School | 0 (0.0%) | 0 (0.0%) |
| High School Diploma | 0 (0.0%) | 0 (0.0%) |
| College or Associate's Degree | 9 (100.0%) | 0 (0.0%) |
| Bachelor's Degree | 2 (100.0%) | 0 (0.0%) |
| Graduate Degree | 7 (100.0%) | 0 (0.0%) |
| Total | 18 (100.0%) | 0 (0.0%) |
Employment Characteristics in Industry borough
Employment by Class of Employer in Industry borough
Among the 860 employed individuals in Industry borough, private company employees (623 | 72.4%), not-for-profit organizations (103 | 12.0%), and self-employed (not incorporated) (38 | 4.4%) make up the most common classes of employment.
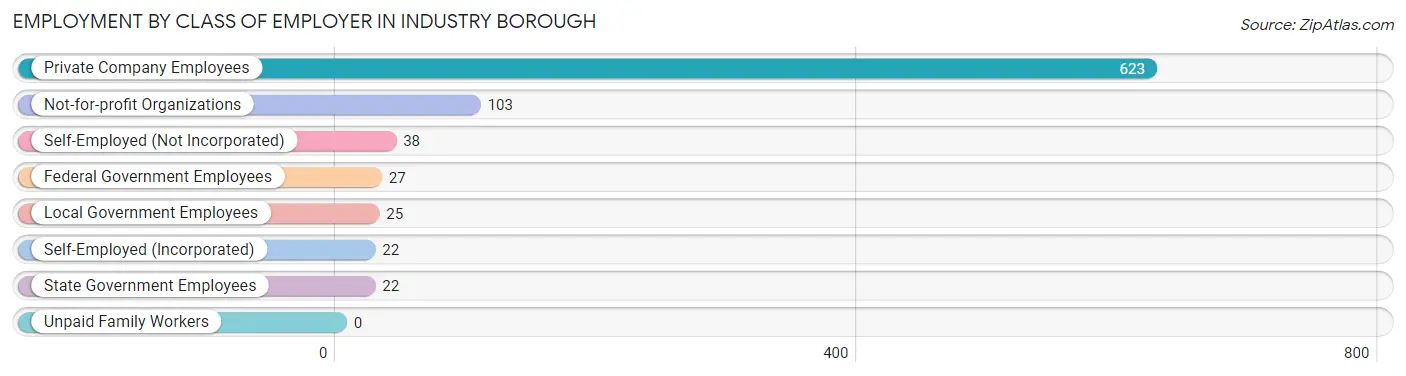
| Employer Class | # Employees | % Employees |
| Private Company Employees | 623 | 72.4% |
| Self-Employed (Incorporated) | 22 | 2.6% |
| Self-Employed (Not Incorporated) | 38 | 4.4% |
| Not-for-profit Organizations | 103 | 12.0% |
| Local Government Employees | 25 | 2.9% |
| State Government Employees | 22 | 2.6% |
| Federal Government Employees | 27 | 3.1% |
| Unpaid Family Workers | 0 | 0.0% |
| Total | 860 | 100.0% |
Employment Status by Age in Industry borough
According to the labor force statistics for Industry borough, out of the total population over 16 years of age (1,428), 66.4% or 948 individuals are in the labor force, with 6.8% or 64 of them unemployed. The age group with the highest labor force participation rate is 25 to 29 years, with 97.4% or 111 individuals in the labor force. Within the labor force, the 30 to 34 years age range has the highest percentage of unemployed individuals, with 27.0% or 34 of them being unemployed.
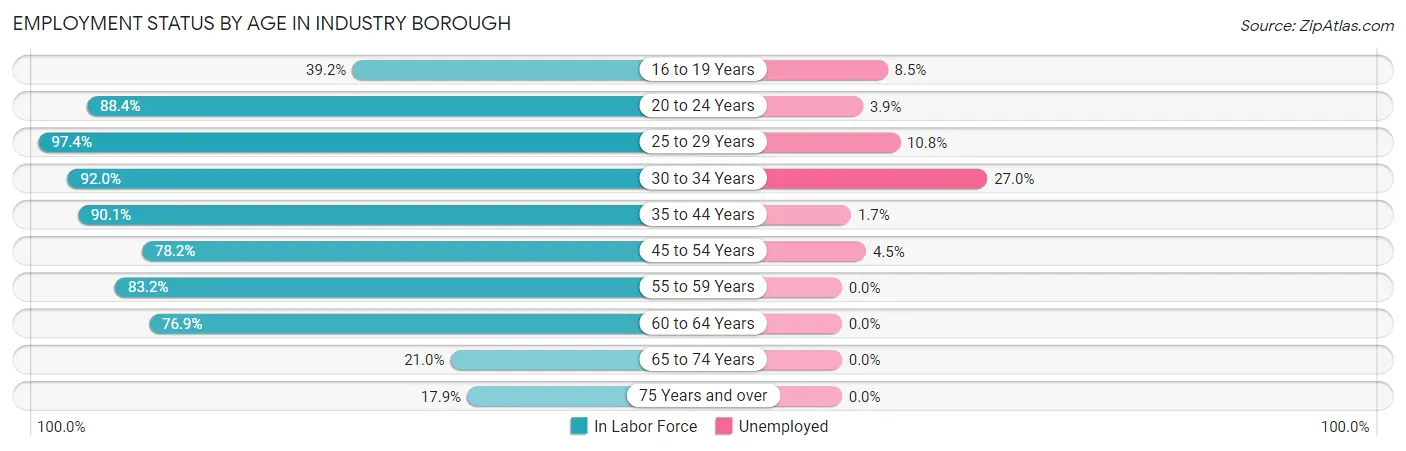
| Age Bracket | In Labor Force | Unemployed |
| 16 to 19 Years | 47 (39.2%) | 4 (8.5%) |
| 20 to 24 Years | 76 (88.4%) | 3 (3.9%) |
| 25 to 29 Years | 111 (97.4%) | 12 (10.8%) |
| 30 to 34 Years | 126 (92.0%) | 34 (27.0%) |
| 35 to 44 Years | 172 (90.1%) | 3 (1.7%) |
| 45 to 54 Years | 179 (78.2%) | 8 (4.5%) |
| 55 to 59 Years | 99 (83.2%) | 0 (0.0%) |
| 60 to 64 Years | 70 (76.9%) | 0 (0.0%) |
| 65 to 74 Years | 48 (21.0%) | 0 (0.0%) |
| 75 Years and over | 20 (17.9%) | 0 (0.0%) |
| Total | 948 (66.4%) | 64 (6.8%) |
Employment Status by Educational Attainment in Industry borough
According to labor force statistics for Industry borough, 85.9% of individuals (757) out of the total population between 25 and 64 years of age (881) are in the labor force, with 7.5% or 57 of them being unemployed. The group with the highest labor force participation rate are those with the educational attainment of bachelor's degree or higher, with 92.7% or 177 individuals in the labor force. Within the labor force, individuals with high school diploma education have the highest percentage of unemployment, with 19.9% or 51 of them being unemployed.
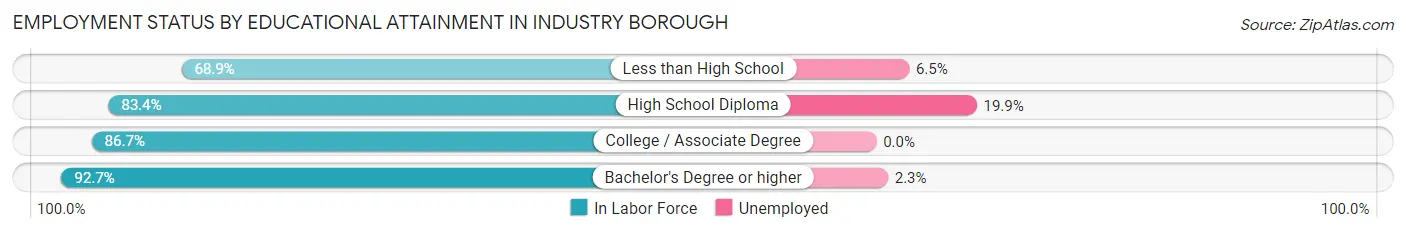
| Educational Attainment | In Labor Force | Unemployed |
| Less than High School | 31 (68.9%) | 3 (6.5%) |
| High School Diploma | 256 (83.4%) | 61 (19.9%) |
| College / Associate Degree | 293 (86.7%) | 0 (0.0%) |
| Bachelor's Degree or higher | 177 (92.7%) | 4 (2.3%) |
| Total | 757 (85.9%) | 66 (7.5%) |
Employment Occupations by Sex in Industry borough
Management, Business, Science and Arts Occupations
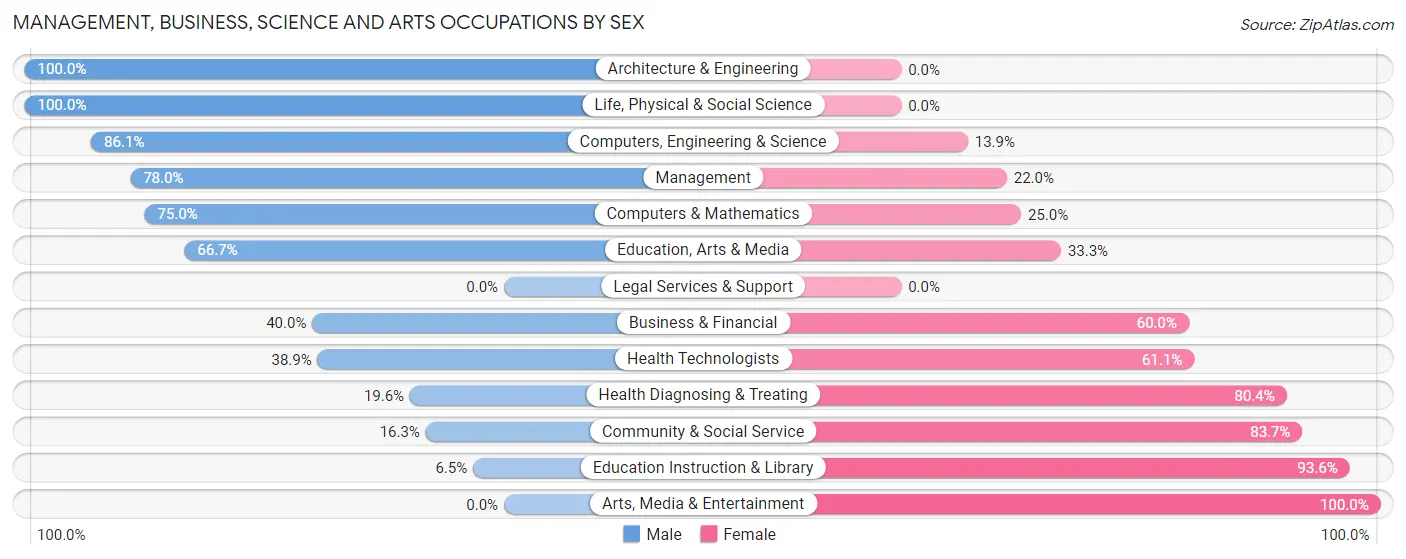
The most common Management, Business, Science and Arts occupations in Industry borough are Management (59 | 6.7%), Health Diagnosing & Treating (51 | 5.8%), Community & Social Service (49 | 5.5%), Business & Financial (40 | 4.5%), and Computers, Engineering & Science (36 | 4.1%).
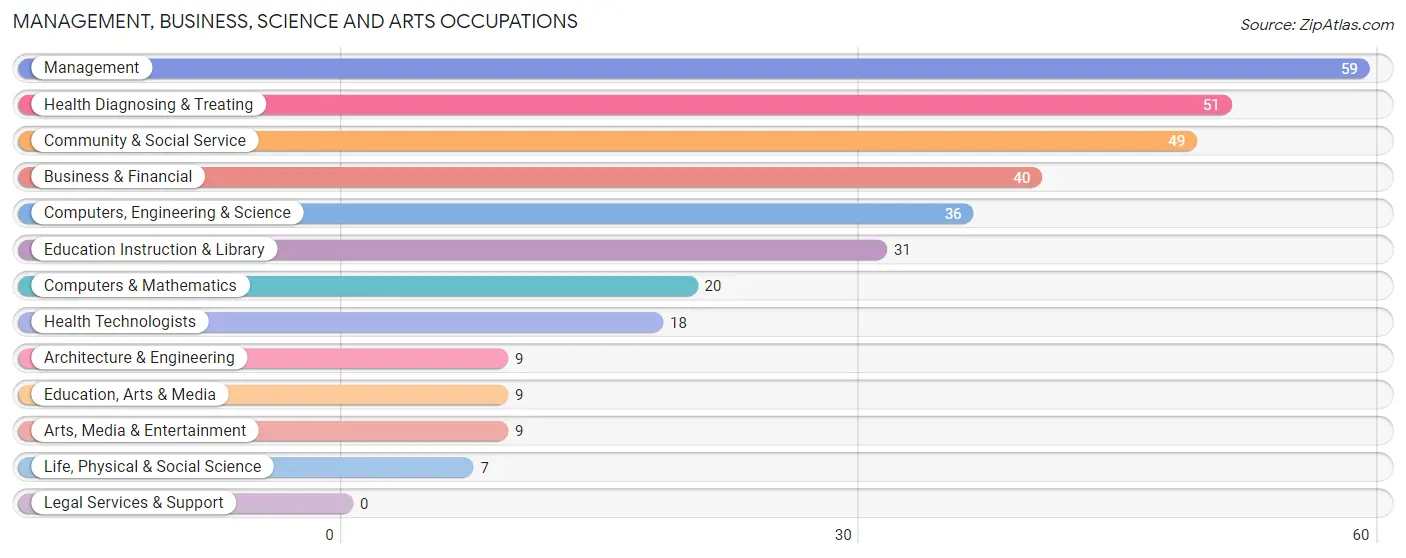
Management, Business, Science and Arts Occupations by Sex
Within the Management, Business, Science and Arts occupations in Industry borough, the most male-oriented occupations are Architecture & Engineering (100.0%), Life, Physical & Social Science (100.0%), and Computers, Engineering & Science (86.1%), while the most female-oriented occupations are Arts, Media & Entertainment (100.0%), Education Instruction & Library (93.5%), and Community & Social Service (83.7%).
| Occupation | Male | Female |
| Management | 46 (78.0%) | 13 (22.0%) |
| Business & Financial | 16 (40.0%) | 24 (60.0%) |
| Computers, Engineering & Science | 31 (86.1%) | 5 (13.9%) |
| Computers & Mathematics | 15 (75.0%) | 5 (25.0%) |
| Architecture & Engineering | 9 (100.0%) | 0 (0.0%) |
| Life, Physical & Social Science | 7 (100.0%) | 0 (0.0%) |
| Community & Social Service | 8 (16.3%) | 41 (83.7%) |
| Education, Arts & Media | 6 (66.7%) | 3 (33.3%) |
| Legal Services & Support | 0 (0.0%) | 0 (0.0%) |
| Education Instruction & Library | 2 (6.5%) | 29 (93.5%) |
| Arts, Media & Entertainment | 0 (0.0%) | 9 (100.0%) |
| Health Diagnosing & Treating | 10 (19.6%) | 41 (80.4%) |
| Health Technologists | 7 (38.9%) | 11 (61.1%) |
| Total (Category) | 111 (47.2%) | 124 (52.8%) |
| Total (Overall) | 433 (49.0%) | 451 (51.0%) |
Services Occupations
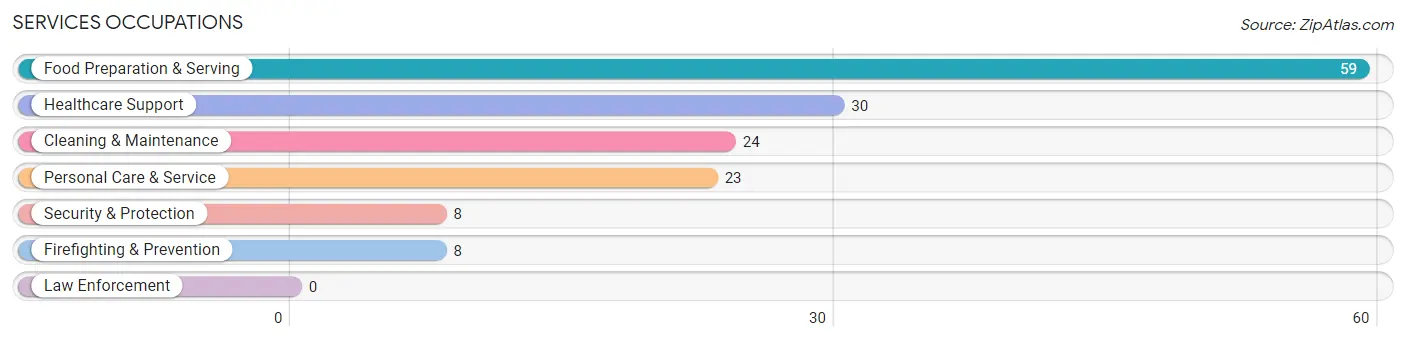
The most common Services occupations in Industry borough are Food Preparation & Serving (59 | 6.7%), Healthcare Support (30 | 3.4%), Cleaning & Maintenance (24 | 2.7%), Personal Care & Service (23 | 2.6%), and Security & Protection (8 | 0.9%).
Services Occupations by Sex
Within the Services occupations in Industry borough, the most male-oriented occupations are Security & Protection (100.0%), Firefighting & Prevention (100.0%), and Cleaning & Maintenance (70.8%), while the most female-oriented occupations are Healthcare Support (90.0%), Personal Care & Service (87.0%), and Food Preparation & Serving (69.5%).
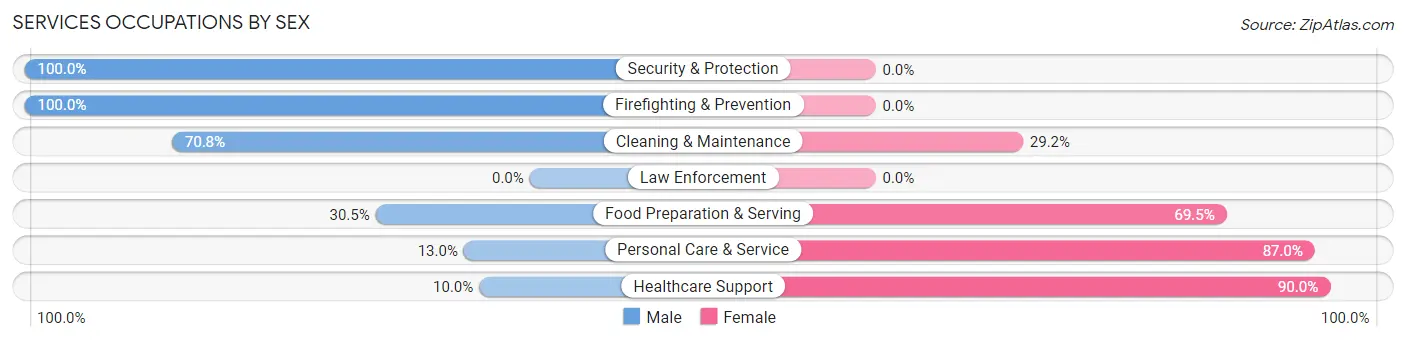
| Occupation | Male | Female |
| Healthcare Support | 3 (10.0%) | 27 (90.0%) |
| Security & Protection | 8 (100.0%) | 0 (0.0%) |
| Firefighting & Prevention | 8 (100.0%) | 0 (0.0%) |
| Law Enforcement | 0 (0.0%) | 0 (0.0%) |
| Food Preparation & Serving | 18 (30.5%) | 41 (69.5%) |
| Cleaning & Maintenance | 17 (70.8%) | 7 (29.2%) |
| Personal Care & Service | 3 (13.0%) | 20 (87.0%) |
| Total (Category) | 49 (34.0%) | 95 (66.0%) |
| Total (Overall) | 433 (49.0%) | 451 (51.0%) |
Sales and Office Occupations
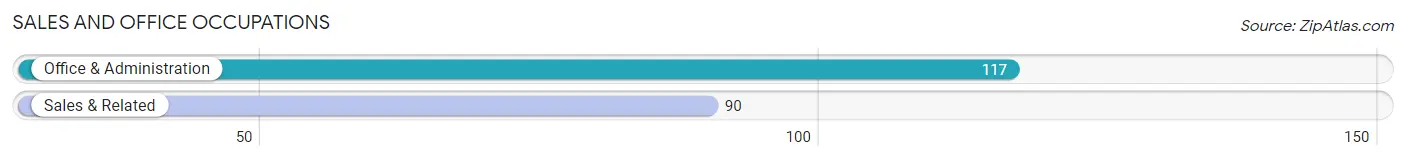
The most common Sales and Office occupations in Industry borough are Office & Administration (117 | 13.2%), and Sales & Related (90 | 10.2%).
Sales and Office Occupations by Sex
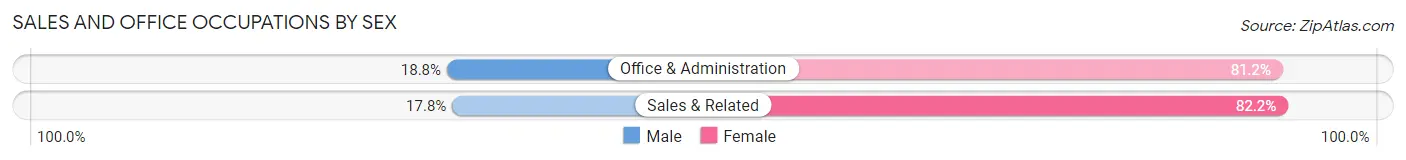
| Occupation | Male | Female |
| Sales & Related | 16 (17.8%) | 74 (82.2%) |
| Office & Administration | 22 (18.8%) | 95 (81.2%) |
| Total (Category) | 38 (18.4%) | 169 (81.6%) |
| Total (Overall) | 433 (49.0%) | 451 (51.0%) |
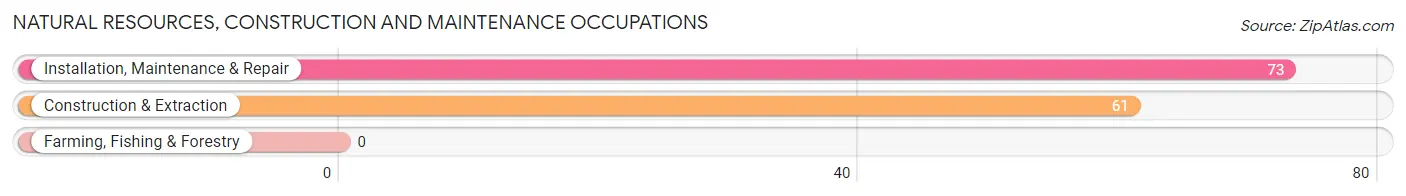
Natural Resources, Construction and Maintenance Occupations
The most common Natural Resources, Construction and Maintenance occupations in Industry borough are Installation, Maintenance & Repair (73 | 8.3%), and Construction & Extraction (61 | 6.9%).
Natural Resources, Construction and Maintenance Occupations by Sex
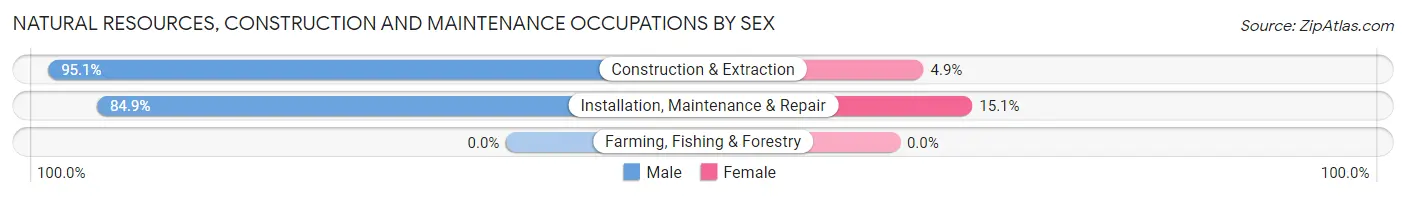
| Occupation | Male | Female |
| Farming, Fishing & Forestry | 0 (0.0%) | 0 (0.0%) |
| Construction & Extraction | 58 (95.1%) | 3 (4.9%) |
| Installation, Maintenance & Repair | 62 (84.9%) | 11 (15.1%) |
| Total (Category) | 120 (89.5%) | 14 (10.4%) |
| Total (Overall) | 433 (49.0%) | 451 (51.0%) |
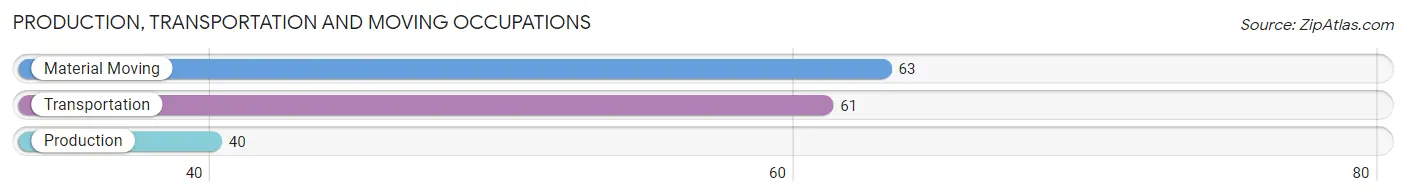
Production, Transportation and Moving Occupations
The most common Production, Transportation and Moving occupations in Industry borough are Material Moving (63 | 7.1%), Transportation (61 | 6.9%), and Production (40 | 4.5%).
Production, Transportation and Moving Occupations by Sex
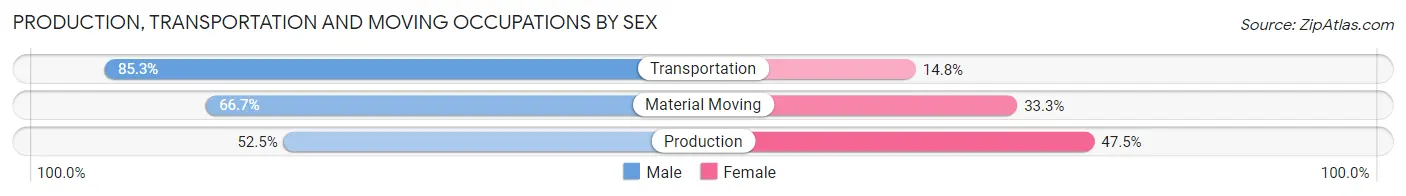
| Occupation | Male | Female |
| Production | 21 (52.5%) | 19 (47.5%) |
| Transportation | 52 (85.3%) | 9 (14.7%) |
| Material Moving | 42 (66.7%) | 21 (33.3%) |
| Total (Category) | 115 (70.1%) | 49 (29.9%) |
| Total (Overall) | 433 (49.0%) | 451 (51.0%) |
Employment Industries by Sex in Industry borough
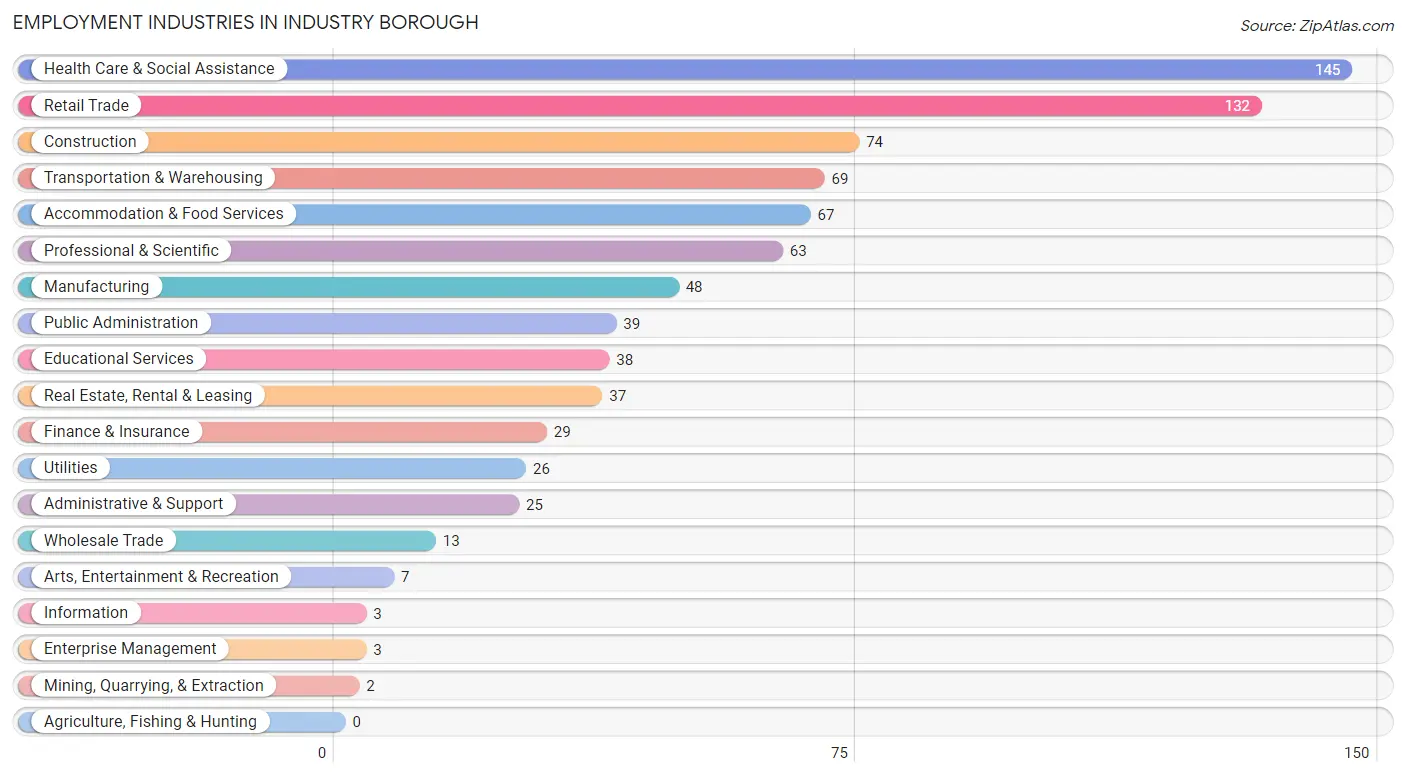
Employment Industries in Industry borough
The major employment industries in Industry borough include Health Care & Social Assistance (145 | 16.4%), Retail Trade (132 | 14.9%), Construction (74 | 8.4%), Transportation & Warehousing (69 | 7.8%), and Accommodation & Food Services (67 | 7.6%).
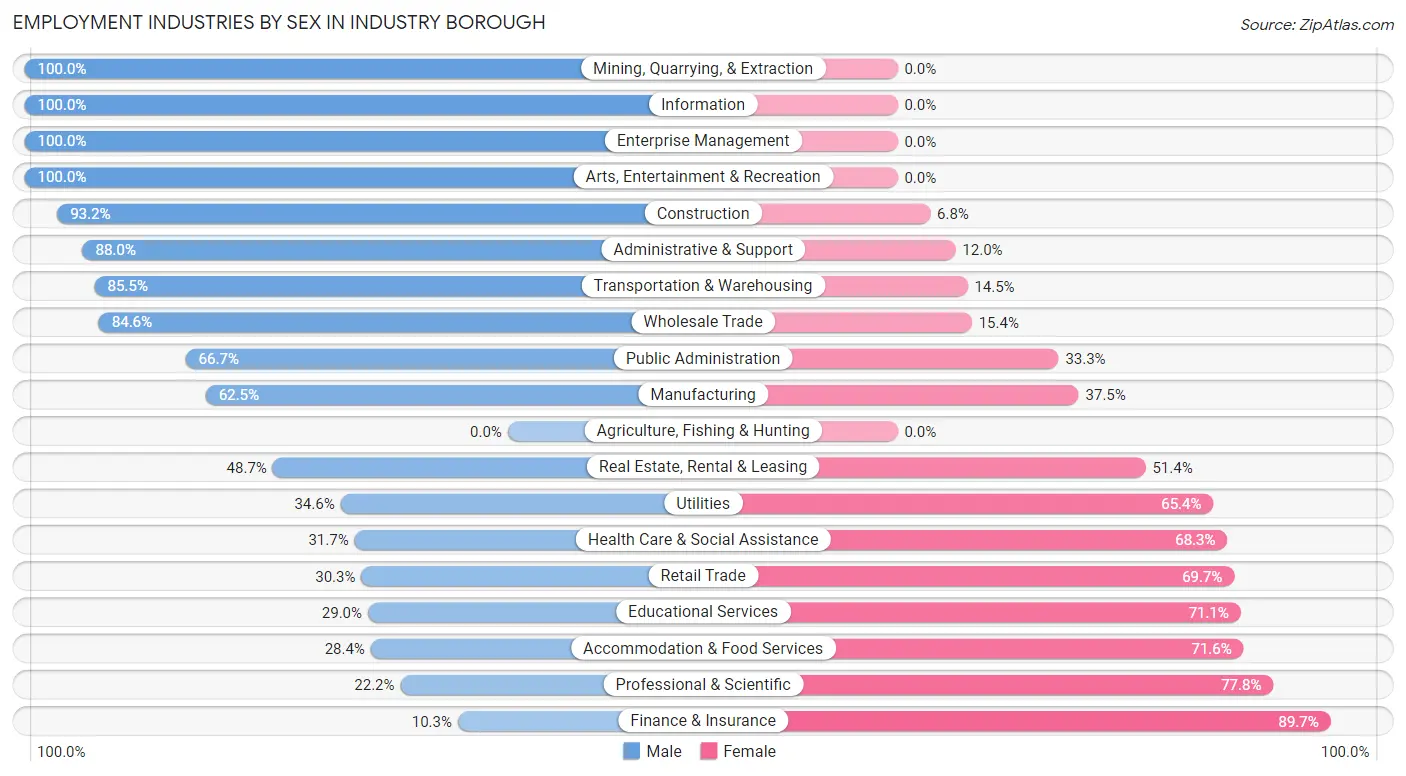
Employment Industries by Sex in Industry borough
The Industry borough industries that see more men than women are Mining, Quarrying, & Extraction (100.0%), Information (100.0%), and Enterprise Management (100.0%), whereas the industries that tend to have a higher number of women are Finance & Insurance (89.7%), Professional & Scientific (77.8%), and Accommodation & Food Services (71.6%).
| Industry | Male | Female |
| Agriculture, Fishing & Hunting | 0 (0.0%) | 0 (0.0%) |
| Mining, Quarrying, & Extraction | 2 (100.0%) | 0 (0.0%) |
| Construction | 69 (93.2%) | 5 (6.8%) |
| Manufacturing | 30 (62.5%) | 18 (37.5%) |
| Wholesale Trade | 11 (84.6%) | 2 (15.4%) |
| Retail Trade | 40 (30.3%) | 92 (69.7%) |
| Transportation & Warehousing | 59 (85.5%) | 10 (14.5%) |
| Utilities | 9 (34.6%) | 17 (65.4%) |
| Information | 3 (100.0%) | 0 (0.0%) |
| Finance & Insurance | 3 (10.3%) | 26 (89.7%) |
| Real Estate, Rental & Leasing | 18 (48.6%) | 19 (51.3%) |
| Professional & Scientific | 14 (22.2%) | 49 (77.8%) |
| Enterprise Management | 3 (100.0%) | 0 (0.0%) |
| Administrative & Support | 22 (88.0%) | 3 (12.0%) |
| Educational Services | 11 (28.9%) | 27 (71.1%) |
| Health Care & Social Assistance | 46 (31.7%) | 99 (68.3%) |
| Arts, Entertainment & Recreation | 7 (100.0%) | 0 (0.0%) |
| Accommodation & Food Services | 19 (28.4%) | 48 (71.6%) |
| Public Administration | 26 (66.7%) | 13 (33.3%) |
| Total | 433 (49.0%) | 451 (51.0%) |
Education in Industry borough
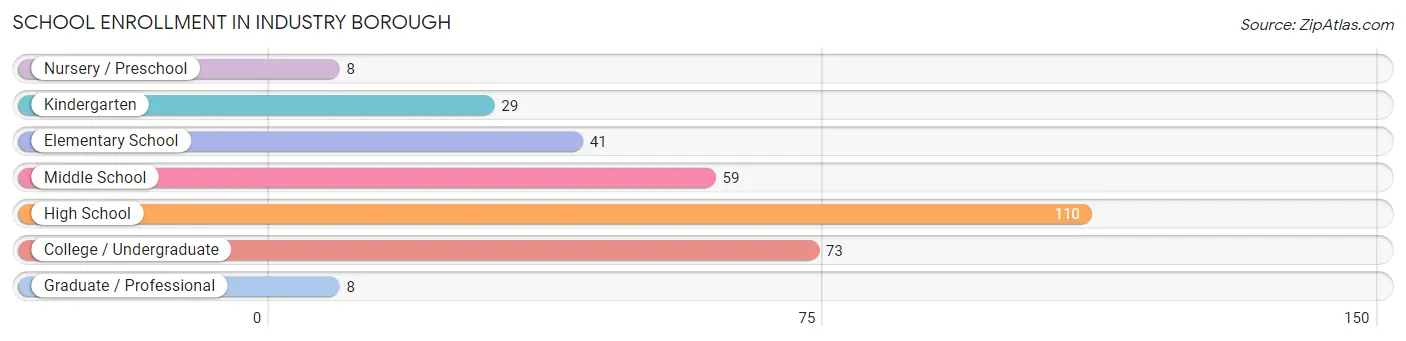
School Enrollment in Industry borough
The most common levels of schooling among the 328 students in Industry borough are high school (110 | 33.5%), college / undergraduate (73 | 22.3%), and middle school (59 | 18.0%).
| School Level | # Students | % Students |
| Nursery / Preschool | 8 | 2.4% |
| Kindergarten | 29 | 8.8% |
| Elementary School | 41 | 12.5% |
| Middle School | 59 | 18.0% |
| High School | 110 | 33.5% |
| College / Undergraduate | 73 | 22.3% |
| Graduate / Professional | 8 | 2.4% |
| Total | 328 | 100.0% |
School Enrollment by Age by Funding Source in Industry borough
Out of a total of 328 students who are enrolled in schools in Industry borough, 47 (14.3%) attend a private institution, while the remaining 281 (85.7%) are enrolled in public schools. The age group of 35 years and over has the highest likelihood of being enrolled in private schools, with 13 (81.2% in the age bracket) enrolled. Conversely, the age group of 15 to 17 year olds has the lowest likelihood of being enrolled in a private school, with 81 (100.0% in the age bracket) attending a public institution.
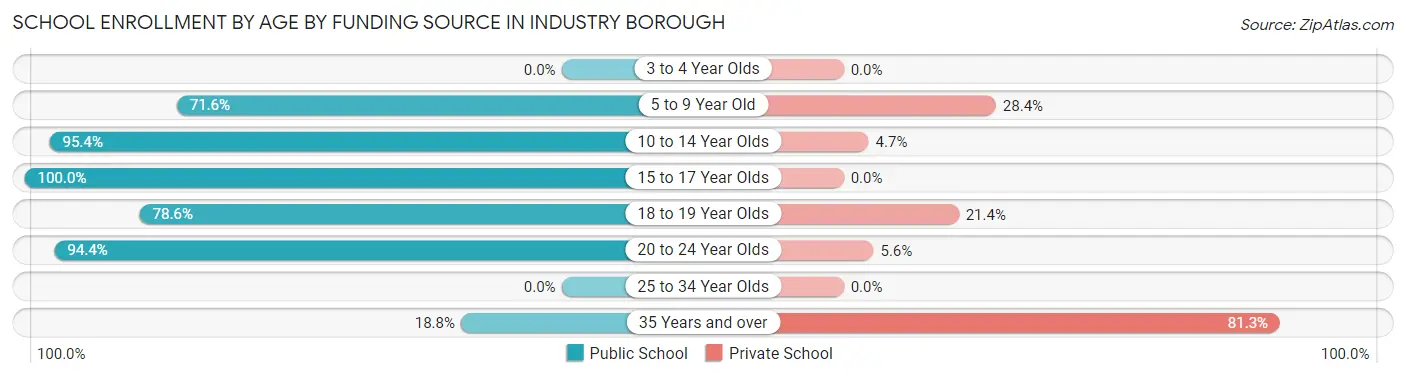
| Age Bracket | Public School | Private School |
| 3 to 4 Year Olds | 0 (0.0%) | 0 (0.0%) |
| 5 to 9 Year Old | 48 (71.6%) | 19 (28.4%) |
| 10 to 14 Year Olds | 82 (95.4%) | 4 (4.6%) |
| 15 to 17 Year Olds | 81 (100.0%) | 0 (0.0%) |
| 18 to 19 Year Olds | 33 (78.6%) | 9 (21.4%) |
| 20 to 24 Year Olds | 34 (94.4%) | 2 (5.6%) |
| 25 to 34 Year Olds | 0 (0.0%) | 0 (0.0%) |
| 35 Years and over | 3 (18.8%) | 13 (81.2%) |
| Total | 281 (85.7%) | 47 (14.3%) |
Educational Attainment by Field of Study in Industry borough
Business (65 | 23.0%), education (62 | 21.9%), science & technology (36 | 12.7%), computers & mathematics (20 | 7.1%), and literature & languages (20 | 7.1%) are the most common fields of study among 283 individuals in Industry borough who have obtained a bachelor's degree or higher.
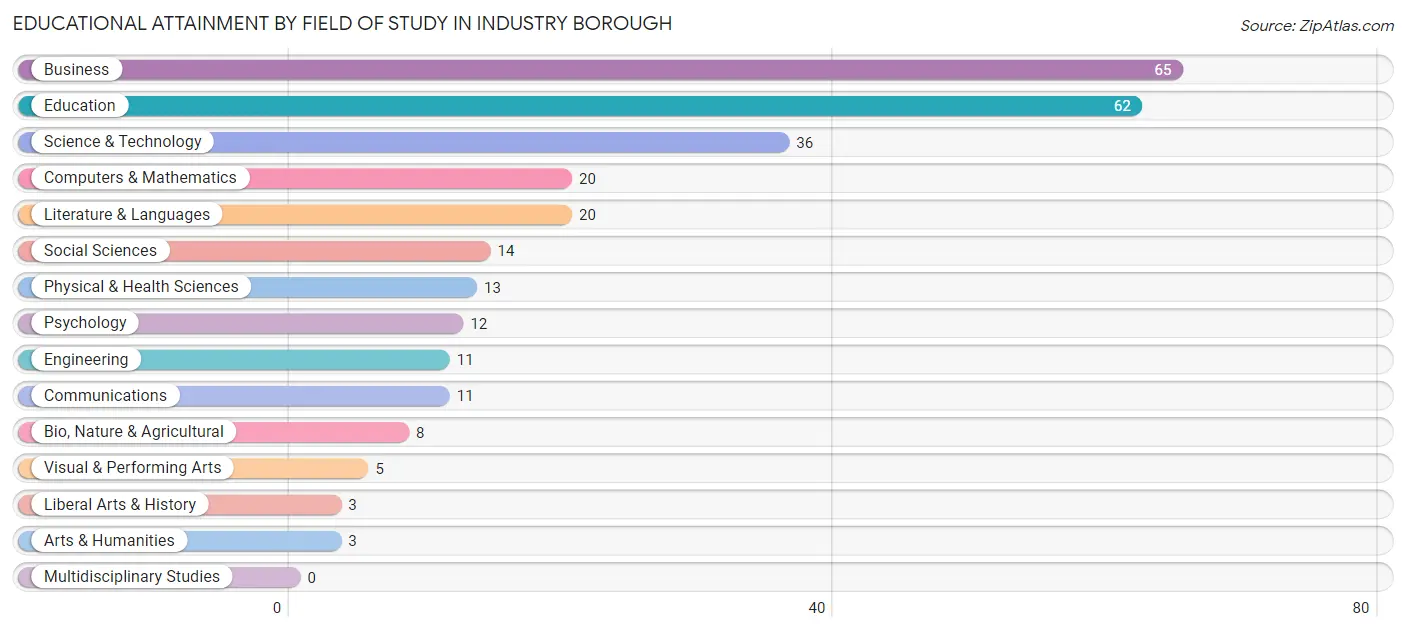
| Field of Study | # Graduates | % Graduates |
| Computers & Mathematics | 20 | 7.1% |
| Bio, Nature & Agricultural | 8 | 2.8% |
| Physical & Health Sciences | 13 | 4.6% |
| Psychology | 12 | 4.2% |
| Social Sciences | 14 | 5.0% |
| Engineering | 11 | 3.9% |
| Multidisciplinary Studies | 0 | 0.0% |
| Science & Technology | 36 | 12.7% |
| Business | 65 | 23.0% |
| Education | 62 | 21.9% |
| Literature & Languages | 20 | 7.1% |
| Liberal Arts & History | 3 | 1.1% |
| Visual & Performing Arts | 5 | 1.8% |
| Communications | 11 | 3.9% |
| Arts & Humanities | 3 | 1.1% |
| Total | 283 | 100.0% |
Transportation & Commute in Industry borough
Vehicle Availability by Sex in Industry borough
The most prevalent vehicle ownership categories in Industry borough are males with 2 vehicles (221, accounting for 52.2%) and females with 2 vehicles (211, making up 51.4%).
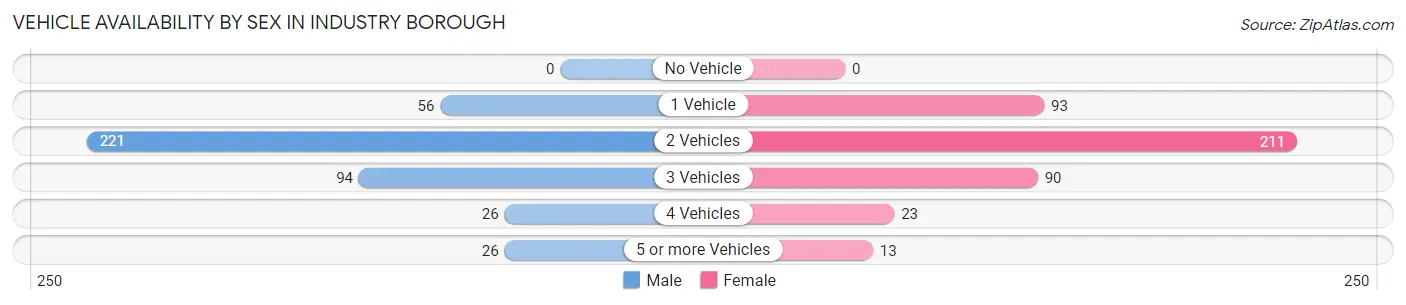
| Vehicles Available | Male | Female |
| No Vehicle | 0 (0.0%) | 0 (0.0%) |
| 1 Vehicle | 56 (13.2%) | 93 (21.6%) |
| 2 Vehicles | 221 (52.2%) | 211 (49.1%) |
| 3 Vehicles | 94 (22.2%) | 90 (20.9%) |
| 4 Vehicles | 26 (6.1%) | 23 (5.3%) |
| 5 or more Vehicles | 26 (6.1%) | 13 (3.0%) |
| Total | 423 (100.0%) | 430 (100.0%) |
Commute Time in Industry borough
The most frequently occuring commute durations in Industry borough are 20 to 24 minutes (157 commuters, 20.2%), 30 to 34 minutes (120 commuters, 15.4%), and 15 to 19 minutes (107 commuters, 13.8%).
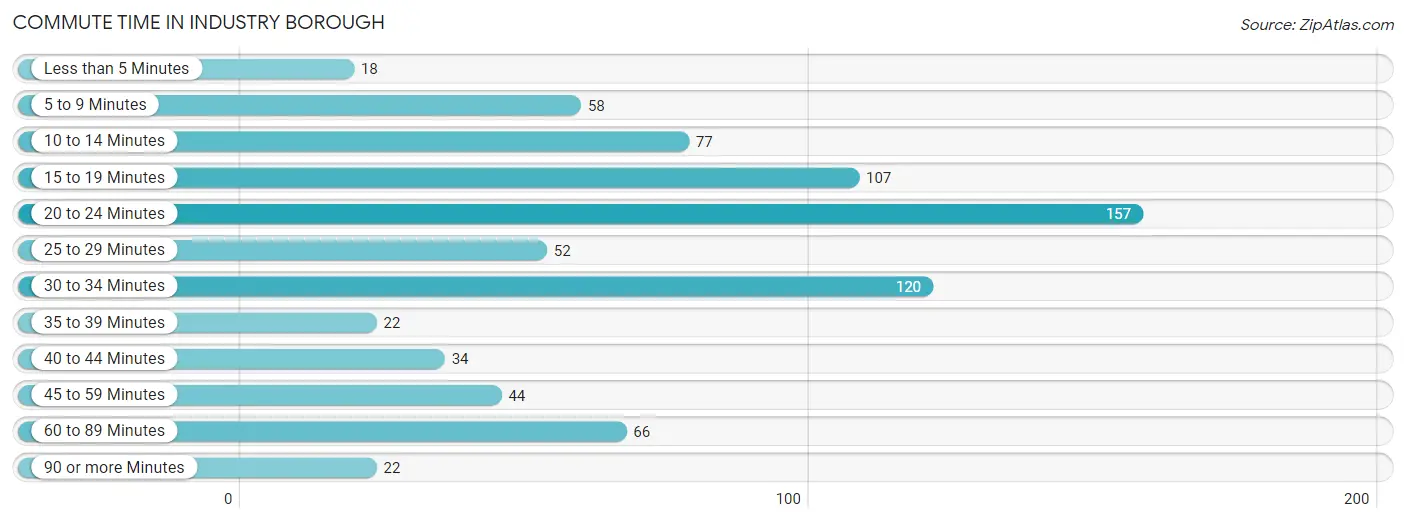
| Commute Time | # Commuters | % Commuters |
| Less than 5 Minutes | 18 | 2.3% |
| 5 to 9 Minutes | 58 | 7.5% |
| 10 to 14 Minutes | 77 | 9.9% |
| 15 to 19 Minutes | 107 | 13.8% |
| 20 to 24 Minutes | 157 | 20.2% |
| 25 to 29 Minutes | 52 | 6.7% |
| 30 to 34 Minutes | 120 | 15.4% |
| 35 to 39 Minutes | 22 | 2.8% |
| 40 to 44 Minutes | 34 | 4.4% |
| 45 to 59 Minutes | 44 | 5.7% |
| 60 to 89 Minutes | 66 | 8.5% |
| 90 or more Minutes | 22 | 2.8% |
Commute Time by Sex in Industry borough
The most common commute times in Industry borough are 20 to 24 minutes (80 commuters, 20.6%) for males and 20 to 24 minutes (77 commuters, 19.8%) for females.
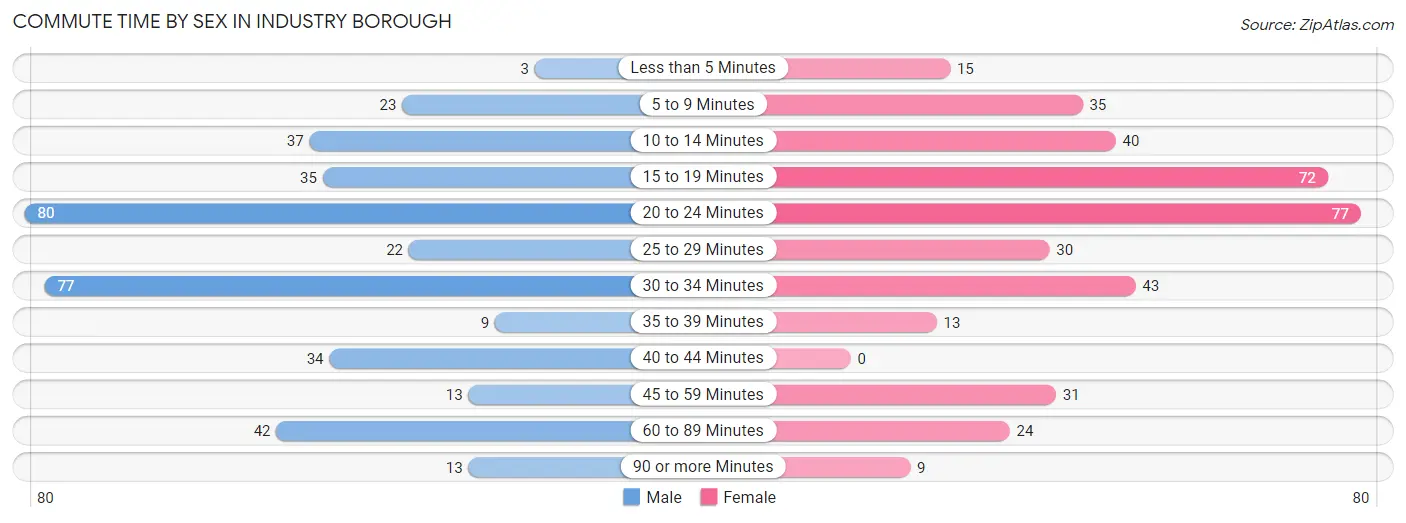
| Commute Time | Male | Female |
| Less than 5 Minutes | 3 (0.8%) | 15 (3.9%) |
| 5 to 9 Minutes | 23 (5.9%) | 35 (9.0%) |
| 10 to 14 Minutes | 37 (9.5%) | 40 (10.3%) |
| 15 to 19 Minutes | 35 (9.0%) | 72 (18.5%) |
| 20 to 24 Minutes | 80 (20.6%) | 77 (19.8%) |
| 25 to 29 Minutes | 22 (5.7%) | 30 (7.7%) |
| 30 to 34 Minutes | 77 (19.9%) | 43 (11.1%) |
| 35 to 39 Minutes | 9 (2.3%) | 13 (3.3%) |
| 40 to 44 Minutes | 34 (8.8%) | 0 (0.0%) |
| 45 to 59 Minutes | 13 (3.4%) | 31 (8.0%) |
| 60 to 89 Minutes | 42 (10.8%) | 24 (6.2%) |
| 90 or more Minutes | 13 (3.4%) | 9 (2.3%) |
Time of Departure to Work by Sex in Industry borough
The most frequent times of departure to work in Industry borough are 6:30 AM to 6:59 AM (74, 19.1%) for males and 7:30 AM to 7:59 AM (57, 14.6%) for females.
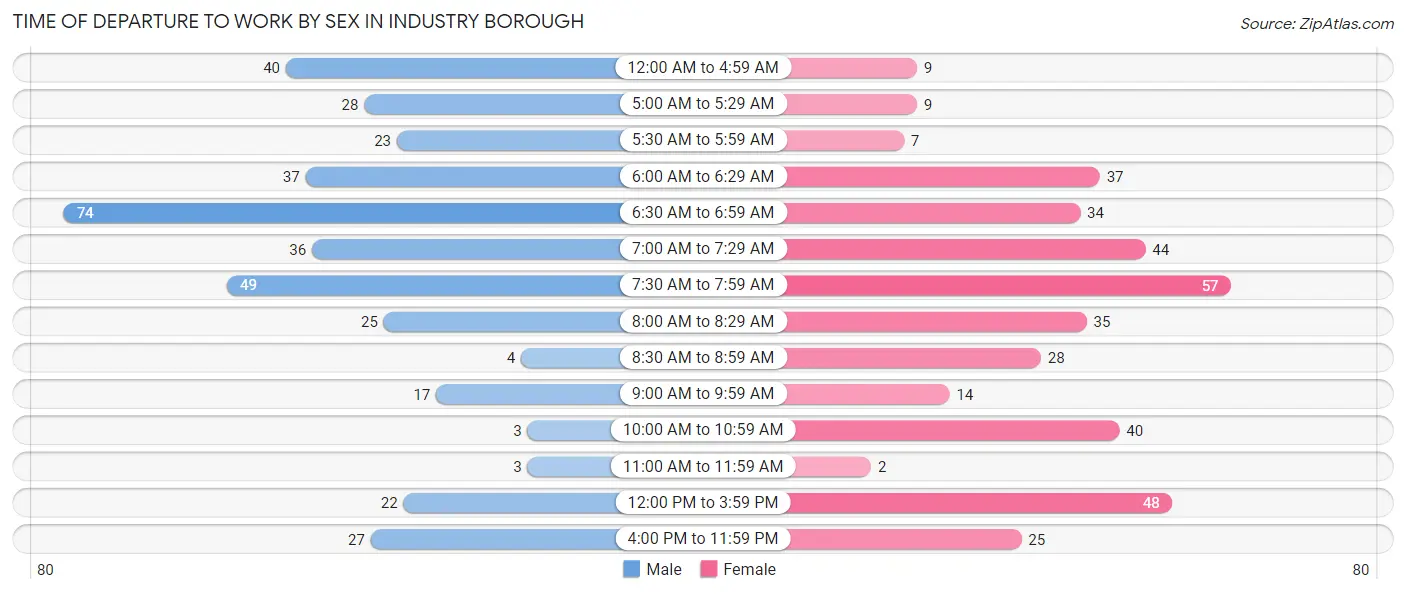
| Time of Departure | Male | Female |
| 12:00 AM to 4:59 AM | 40 (10.3%) | 9 (2.3%) |
| 5:00 AM to 5:29 AM | 28 (7.2%) | 9 (2.3%) |
| 5:30 AM to 5:59 AM | 23 (5.9%) | 7 (1.8%) |
| 6:00 AM to 6:29 AM | 37 (9.5%) | 37 (9.5%) |
| 6:30 AM to 6:59 AM | 74 (19.1%) | 34 (8.7%) |
| 7:00 AM to 7:29 AM | 36 (9.3%) | 44 (11.3%) |
| 7:30 AM to 7:59 AM | 49 (12.6%) | 57 (14.6%) |
| 8:00 AM to 8:29 AM | 25 (6.4%) | 35 (9.0%) |
| 8:30 AM to 8:59 AM | 4 (1.0%) | 28 (7.2%) |
| 9:00 AM to 9:59 AM | 17 (4.4%) | 14 (3.6%) |
| 10:00 AM to 10:59 AM | 3 (0.8%) | 40 (10.3%) |
| 11:00 AM to 11:59 AM | 3 (0.8%) | 2 (0.5%) |
| 12:00 PM to 3:59 PM | 22 (5.7%) | 48 (12.3%) |
| 4:00 PM to 11:59 PM | 27 (7.0%) | 25 (6.4%) |
| Total | 388 (100.0%) | 389 (100.0%) |
Housing Occupancy in Industry borough
Occupancy by Ownership in Industry borough
Of the total 718 dwellings in Industry borough, owner-occupied units account for 574 (79.9%), while renter-occupied units make up 144 (20.1%).
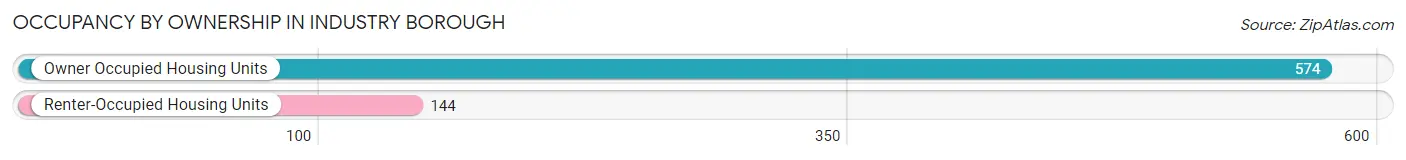
| Occupancy | # Housing Units | % Housing Units |
| Owner Occupied Housing Units | 574 | 79.9% |
| Renter-Occupied Housing Units | 144 | 20.1% |
| Total Occupied Housing Units | 718 | 100.0% |
Occupancy by Household Size in Industry borough
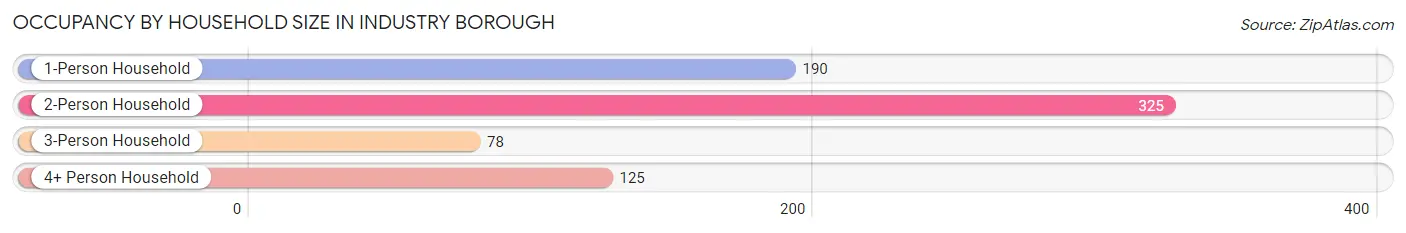
| Household Size | # Housing Units | % Housing Units |
| 1-Person Household | 190 | 26.5% |
| 2-Person Household | 325 | 45.3% |
| 3-Person Household | 78 | 10.9% |
| 4+ Person Household | 125 | 17.4% |
| Total Housing Units | 718 | 100.0% |
Occupancy by Ownership by Household Size in Industry borough
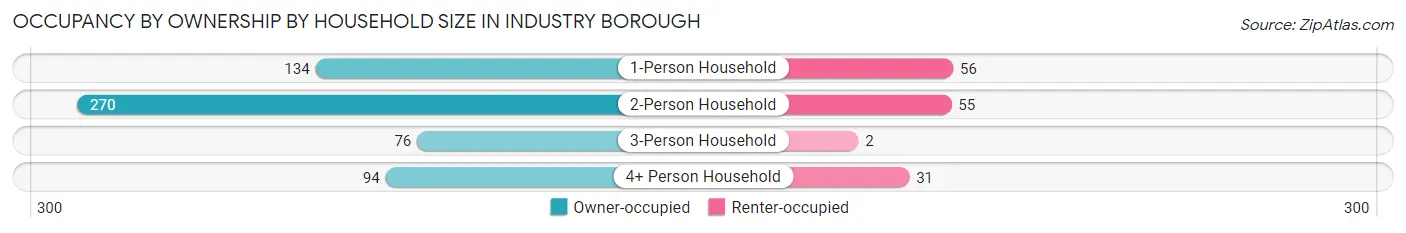
| Household Size | Owner-occupied | Renter-occupied |
| 1-Person Household | 134 (70.5%) | 56 (29.5%) |
| 2-Person Household | 270 (83.1%) | 55 (16.9%) |
| 3-Person Household | 76 (97.4%) | 2 (2.6%) |
| 4+ Person Household | 94 (75.2%) | 31 (24.8%) |
| Total Housing Units | 574 (79.9%) | 144 (20.1%) |
Occupancy by Educational Attainment in Industry borough
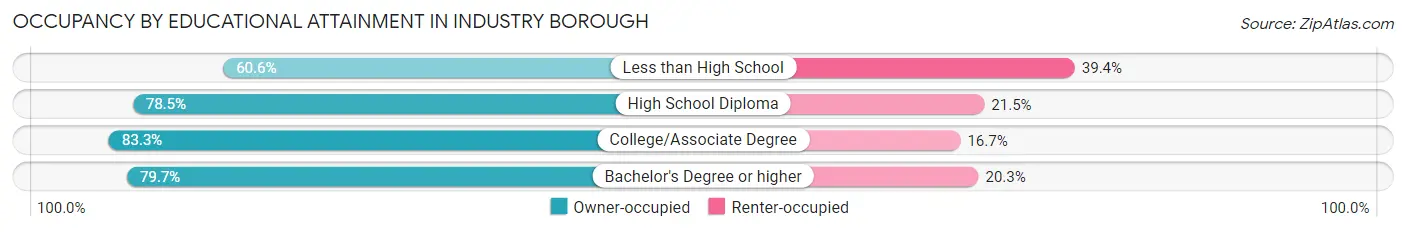
| Household Size | Owner-occupied | Renter-occupied |
| Less than High School | 20 (60.6%) | 13 (39.4%) |
| High School Diploma | 194 (78.5%) | 53 (21.5%) |
| College/Associate Degree | 254 (83.3%) | 51 (16.7%) |
| Bachelor's Degree or higher | 106 (79.7%) | 27 (20.3%) |
Occupancy by Age of Householder in Industry borough
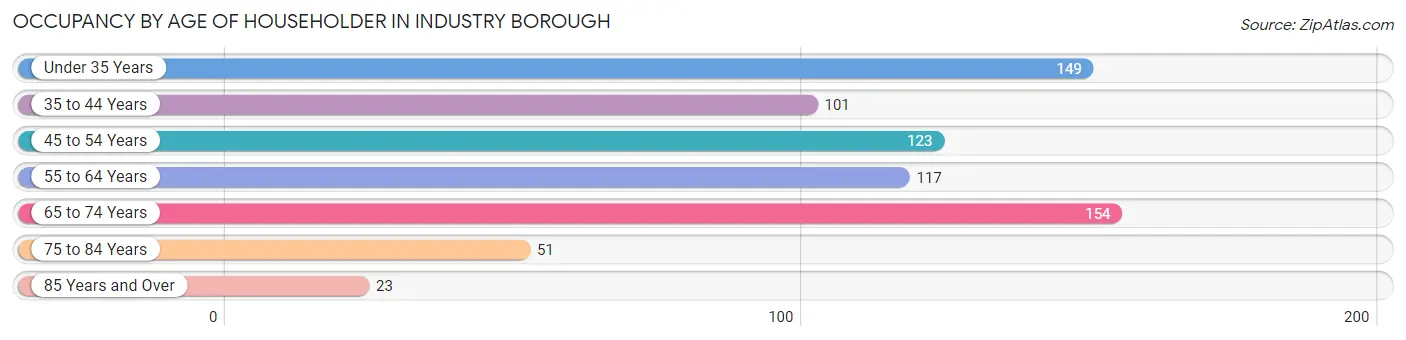
| Age Bracket | # Households | % Households |
| Under 35 Years | 149 | 20.7% |
| 35 to 44 Years | 101 | 14.1% |
| 45 to 54 Years | 123 | 17.1% |
| 55 to 64 Years | 117 | 16.3% |
| 65 to 74 Years | 154 | 21.4% |
| 75 to 84 Years | 51 | 7.1% |
| 85 Years and Over | 23 | 3.2% |
| Total | 718 | 100.0% |
Housing Finances in Industry borough
Median Income by Occupancy in Industry borough
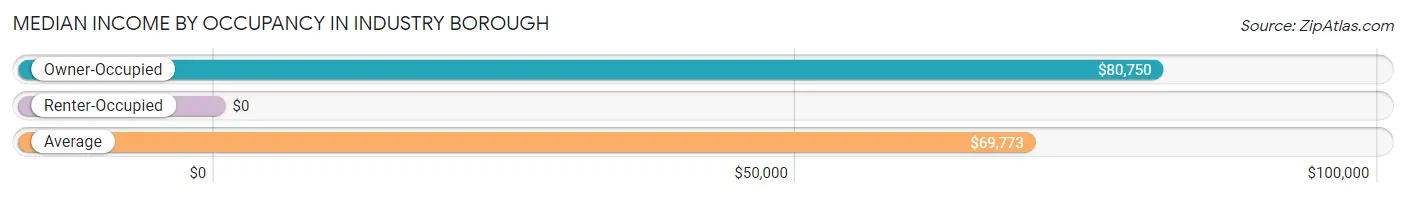
| Occupancy Type | # Households | Median Income |
| Owner-Occupied | 574 (79.9%) | $80,750 |
| Renter-Occupied | 144 (20.1%) | $0 |
| Average | 718 (100.0%) | $69,773 |
Occupancy by Householder Income Bracket in Industry borough
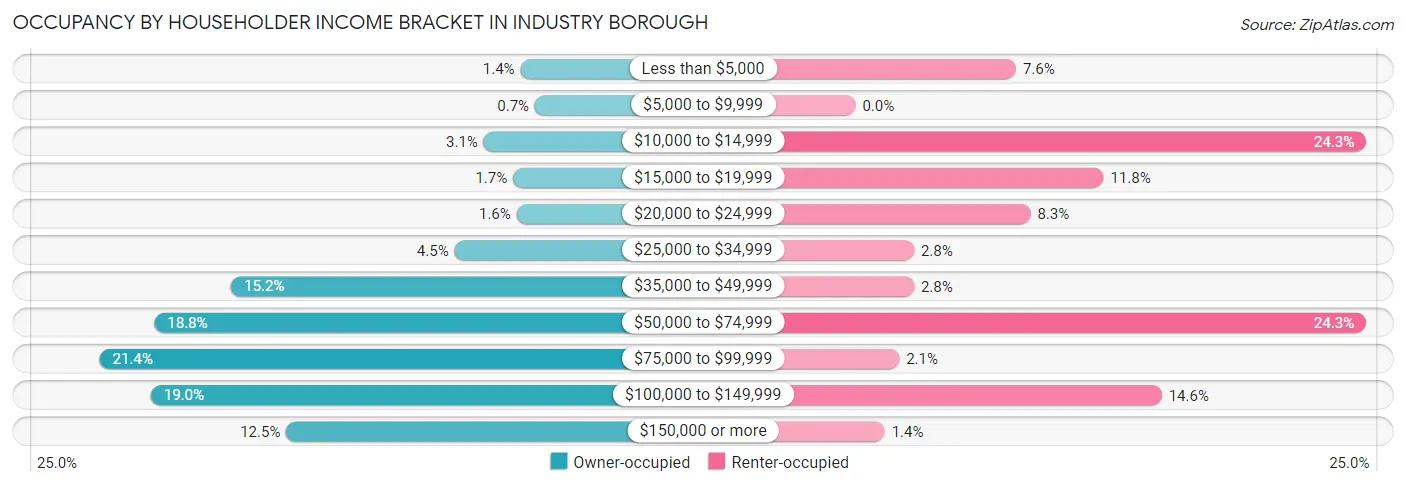
| Income Bracket | Owner-occupied | Renter-occupied |
| Less than $5,000 | 8 (1.4%) | 11 (7.6%) |
| $5,000 to $9,999 | 4 (0.7%) | 0 (0.0%) |
| $10,000 to $14,999 | 18 (3.1%) | 35 (24.3%) |
| $15,000 to $19,999 | 10 (1.7%) | 17 (11.8%) |
| $20,000 to $24,999 | 9 (1.6%) | 12 (8.3%) |
| $25,000 to $34,999 | 26 (4.5%) | 4 (2.8%) |
| $35,000 to $49,999 | 87 (15.2%) | 4 (2.8%) |
| $50,000 to $74,999 | 108 (18.8%) | 35 (24.3%) |
| $75,000 to $99,999 | 123 (21.4%) | 3 (2.1%) |
| $100,000 to $149,999 | 109 (19.0%) | 21 (14.6%) |
| $150,000 or more | 72 (12.5%) | 2 (1.4%) |
| Total | 574 (100.0%) | 144 (100.0%) |
Monthly Housing Cost Tiers in Industry borough
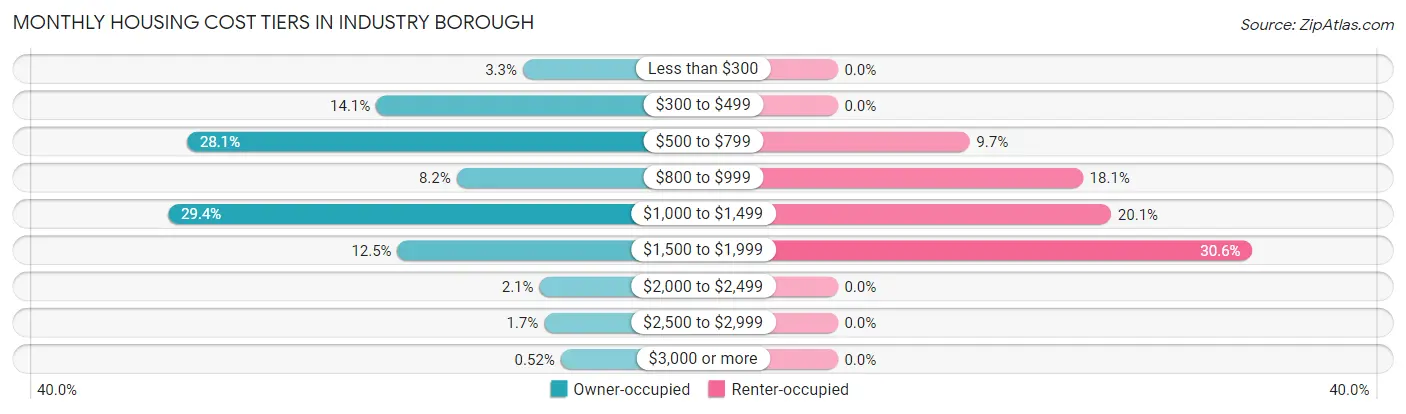
| Monthly Cost | Owner-occupied | Renter-occupied |
| Less than $300 | 19 (3.3%) | 0 (0.0%) |
| $300 to $499 | 81 (14.1%) | 0 (0.0%) |
| $500 to $799 | 161 (28.1%) | 14 (9.7%) |
| $800 to $999 | 47 (8.2%) | 26 (18.1%) |
| $1,000 to $1,499 | 169 (29.4%) | 29 (20.1%) |
| $1,500 to $1,999 | 72 (12.5%) | 44 (30.6%) |
| $2,000 to $2,499 | 12 (2.1%) | 0 (0.0%) |
| $2,500 to $2,999 | 10 (1.7%) | 0 (0.0%) |
| $3,000 or more | 3 (0.5%) | 0 (0.0%) |
| Total | 574 (100.0%) | 144 (100.0%) |
Physical Housing Characteristics in Industry borough
Housing Structures in Industry borough
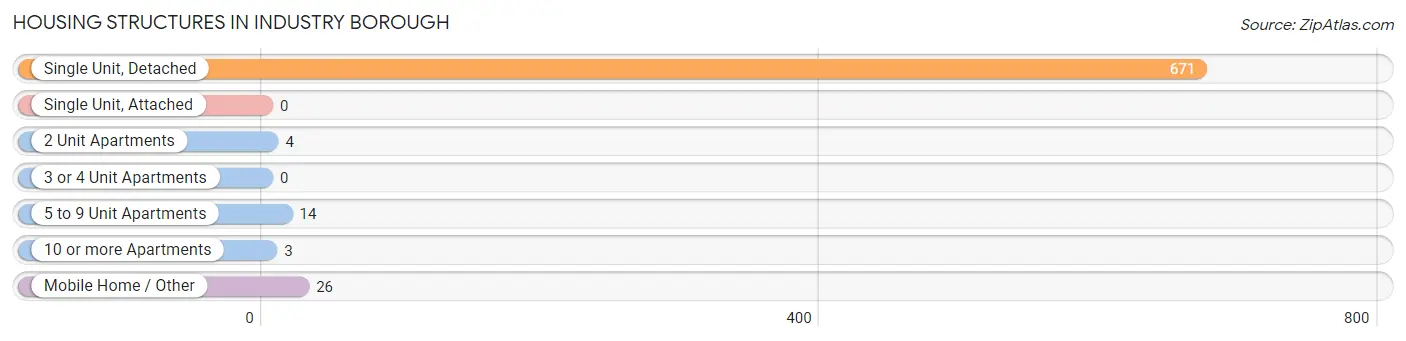
| Structure Type | # Housing Units | % Housing Units |
| Single Unit, Detached | 671 | 93.4% |
| Single Unit, Attached | 0 | 0.0% |
| 2 Unit Apartments | 4 | 0.6% |
| 3 or 4 Unit Apartments | 0 | 0.0% |
| 5 to 9 Unit Apartments | 14 | 1.9% |
| 10 or more Apartments | 3 | 0.4% |
| Mobile Home / Other | 26 | 3.6% |
| Total | 718 | 100.0% |
Housing Structures by Occupancy in Industry borough
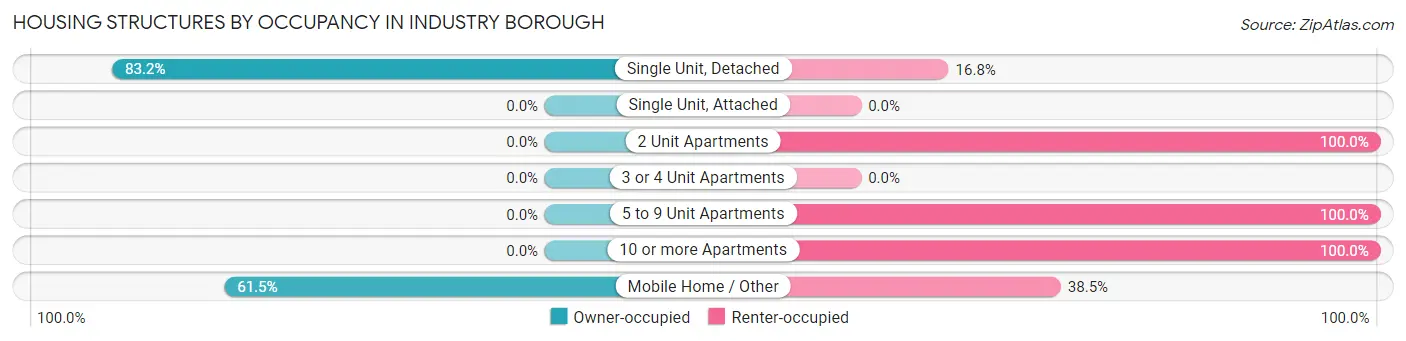
| Structure Type | Owner-occupied | Renter-occupied |
| Single Unit, Detached | 558 (83.2%) | 113 (16.8%) |
| Single Unit, Attached | 0 (0.0%) | 0 (0.0%) |
| 2 Unit Apartments | 0 (0.0%) | 4 (100.0%) |
| 3 or 4 Unit Apartments | 0 (0.0%) | 0 (0.0%) |
| 5 to 9 Unit Apartments | 0 (0.0%) | 14 (100.0%) |
| 10 or more Apartments | 0 (0.0%) | 3 (100.0%) |
| Mobile Home / Other | 16 (61.5%) | 10 (38.5%) |
| Total | 574 (79.9%) | 144 (20.1%) |
Housing Structures by Number of Rooms in Industry borough
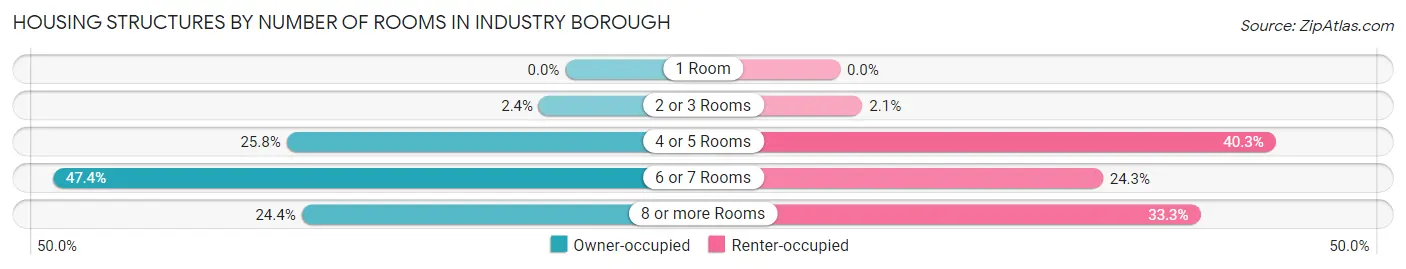
| Number of Rooms | Owner-occupied | Renter-occupied |
| 1 Room | 0 (0.0%) | 0 (0.0%) |
| 2 or 3 Rooms | 14 (2.4%) | 3 (2.1%) |
| 4 or 5 Rooms | 148 (25.8%) | 58 (40.3%) |
| 6 or 7 Rooms | 272 (47.4%) | 35 (24.3%) |
| 8 or more Rooms | 140 (24.4%) | 48 (33.3%) |
| Total | 574 (100.0%) | 144 (100.0%) |
Housing Structure by Heating Type in Industry borough
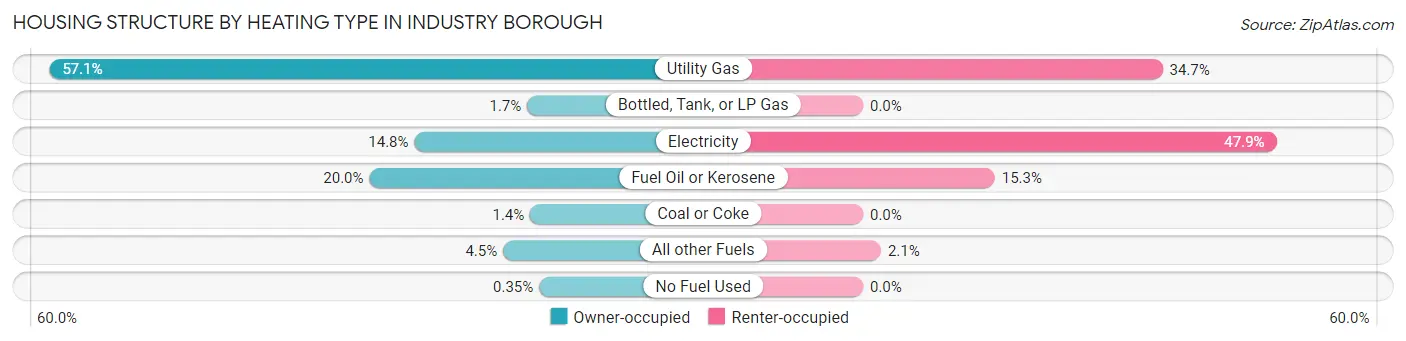
| Heating Type | Owner-occupied | Renter-occupied |
| Utility Gas | 328 (57.1%) | 50 (34.7%) |
| Bottled, Tank, or LP Gas | 10 (1.7%) | 0 (0.0%) |
| Electricity | 85 (14.8%) | 69 (47.9%) |
| Fuel Oil or Kerosene | 115 (20.0%) | 22 (15.3%) |
| Coal or Coke | 8 (1.4%) | 0 (0.0%) |
| All other Fuels | 26 (4.5%) | 3 (2.1%) |
| No Fuel Used | 2 (0.4%) | 0 (0.0%) |
| Total | 574 (100.0%) | 144 (100.0%) |
Household Vehicle Usage in Industry borough
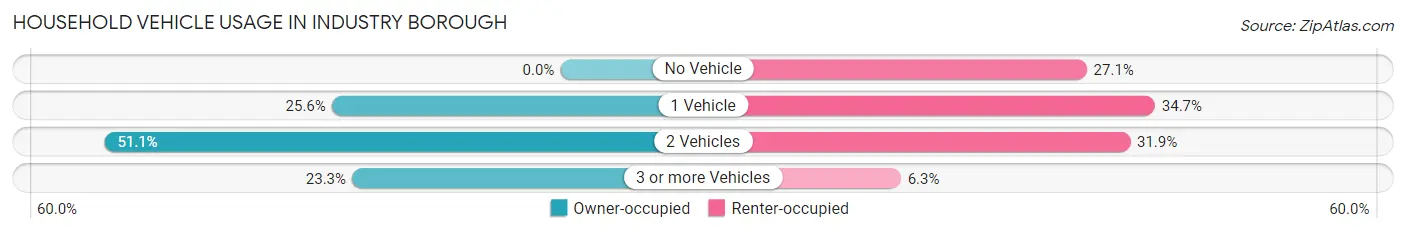
| Vehicles per Household | Owner-occupied | Renter-occupied |
| No Vehicle | 0 (0.0%) | 39 (27.1%) |
| 1 Vehicle | 147 (25.6%) | 50 (34.7%) |
| 2 Vehicles | 293 (51.0%) | 46 (31.9%) |
| 3 or more Vehicles | 134 (23.3%) | 9 (6.2%) |
| Total | 574 (100.0%) | 144 (100.0%) |
Real Estate & Mortgages in Industry borough
Real Estate and Mortgage Overview in Industry borough
| Characteristic | Without Mortgage | With Mortgage |
| Housing Units | 271 | 303 |
| Median Property Value | $172,500 | $166,700 |
| Median Household Income | $64,659 | $43 |
| Monthly Housing Costs | $587 | $3 |
| Real Estate Taxes | $1,868 | $2 |
Property Value by Mortgage Status in Industry borough
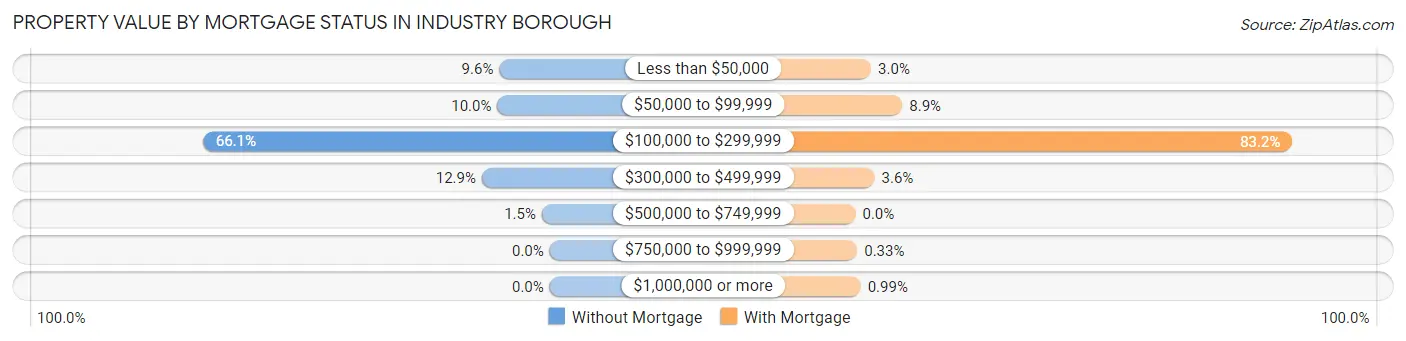
| Property Value | Without Mortgage | With Mortgage |
| Less than $50,000 | 26 (9.6%) | 9 (3.0%) |
| $50,000 to $99,999 | 27 (10.0%) | 27 (8.9%) |
| $100,000 to $299,999 | 179 (66.0%) | 252 (83.2%) |
| $300,000 to $499,999 | 35 (12.9%) | 11 (3.6%) |
| $500,000 to $749,999 | 4 (1.5%) | 0 (0.0%) |
| $750,000 to $999,999 | 0 (0.0%) | 1 (0.3%) |
| $1,000,000 or more | 0 (0.0%) | 3 (1.0%) |
| Total | 271 (100.0%) | 303 (100.0%) |
Household Income by Mortgage Status in Industry borough
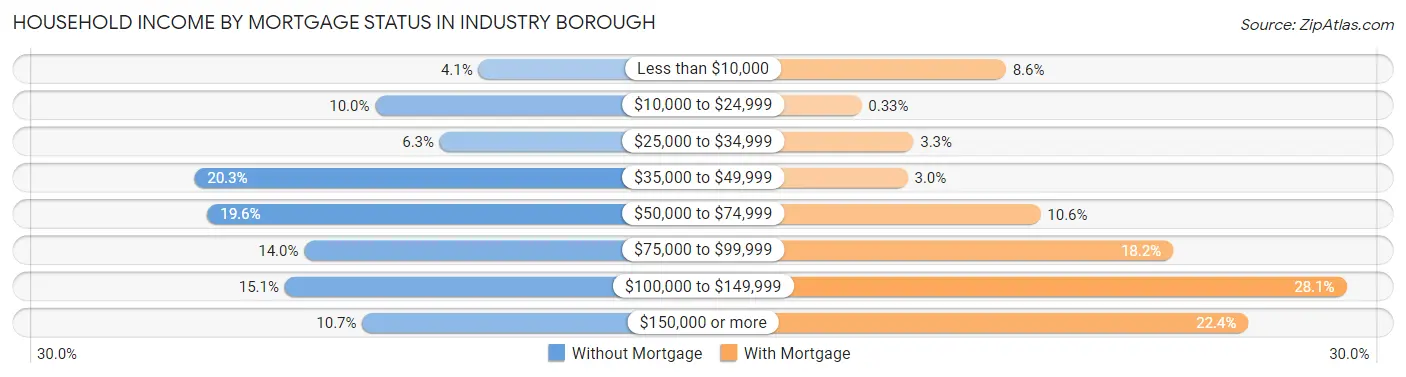
| Household Income | Without Mortgage | With Mortgage |
| Less than $10,000 | 11 (4.1%) | 26 (8.6%) |
| $10,000 to $24,999 | 27 (10.0%) | 1 (0.3%) |
| $25,000 to $34,999 | 17 (6.3%) | 10 (3.3%) |
| $35,000 to $49,999 | 55 (20.3%) | 9 (3.0%) |
| $50,000 to $74,999 | 53 (19.6%) | 32 (10.6%) |
| $75,000 to $99,999 | 38 (14.0%) | 55 (18.1%) |
| $100,000 to $149,999 | 41 (15.1%) | 85 (28.1%) |
| $150,000 or more | 29 (10.7%) | 68 (22.4%) |
| Total | 271 (100.0%) | 303 (100.0%) |
Property Value to Household Income Ratio in Industry borough
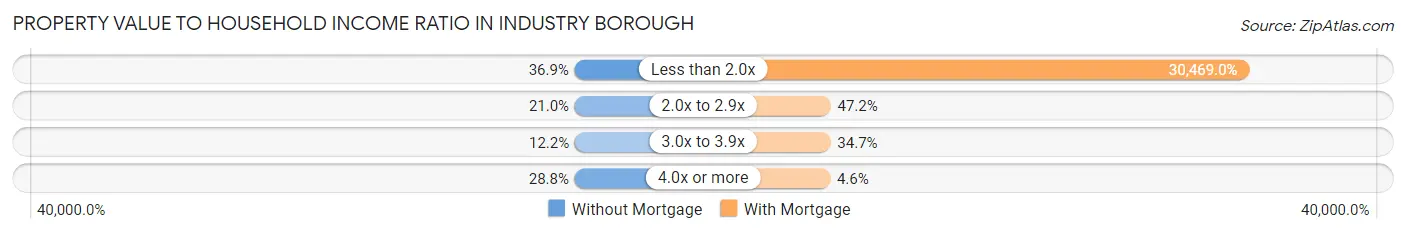
| Value-to-Income Ratio | Without Mortgage | With Mortgage |
| Less than 2.0x | 100 (36.9%) | 92,321 (30,469.0%) |
| 2.0x to 2.9x | 57 (21.0%) | 143 (47.2%) |
| 3.0x to 3.9x | 33 (12.2%) | 105 (34.6%) |
| 4.0x or more | 78 (28.8%) | 14 (4.6%) |
| Total | 271 (100.0%) | 303 (100.0%) |
Real Estate Taxes by Mortgage Status in Industry borough
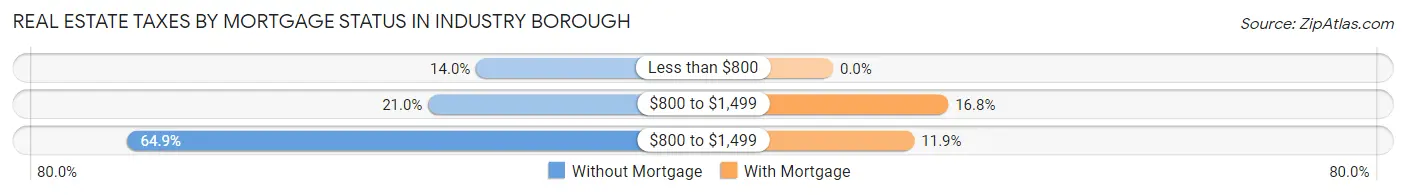
| Property Taxes | Without Mortgage | With Mortgage |
| Less than $800 | 38 (14.0%) | 0 (0.0%) |
| $800 to $1,499 | 57 (21.0%) | 51 (16.8%) |
| $800 to $1,499 | 176 (64.9%) | 36 (11.9%) |
| Total | 271 (100.0%) | 303 (100.0%) |
Health & Disability in Industry borough
Health Insurance Coverage by Age in Industry borough
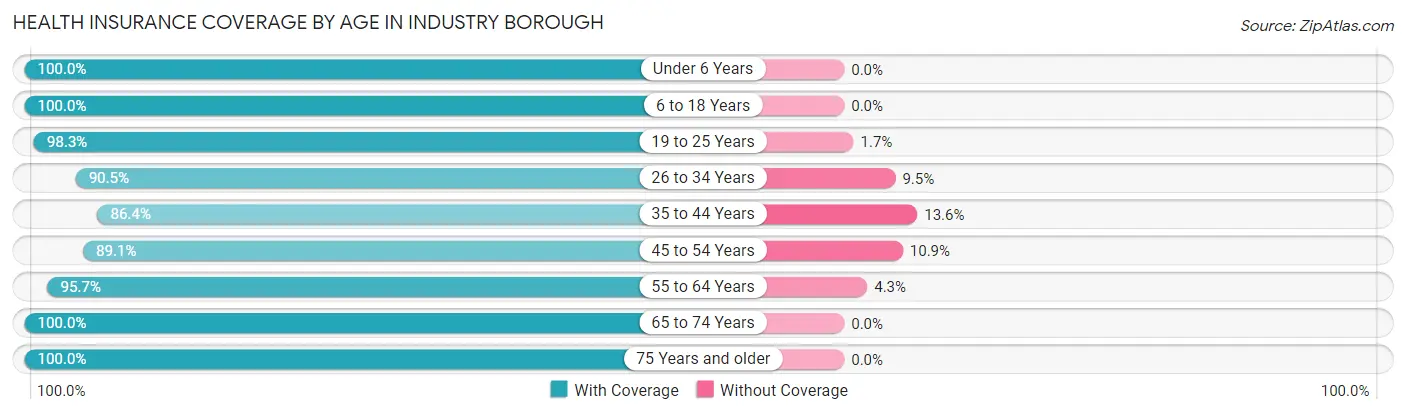
| Age Bracket | With Coverage | Without Coverage |
| Under 6 Years | 114 (100.0%) | 0 (0.0%) |
| 6 to 18 Years | 237 (100.0%) | 0 (0.0%) |
| 19 to 25 Years | 113 (98.3%) | 2 (1.7%) |
| 26 to 34 Years | 218 (90.5%) | 23 (9.5%) |
| 35 to 44 Years | 165 (86.4%) | 26 (13.6%) |
| 45 to 54 Years | 204 (89.1%) | 25 (10.9%) |
| 55 to 64 Years | 201 (95.7%) | 9 (4.3%) |
| 65 to 74 Years | 229 (100.0%) | 0 (0.0%) |
| 75 Years and older | 112 (100.0%) | 0 (0.0%) |
| Total | 1,593 (94.9%) | 85 (5.1%) |
Health Insurance Coverage by Citizenship Status in Industry borough
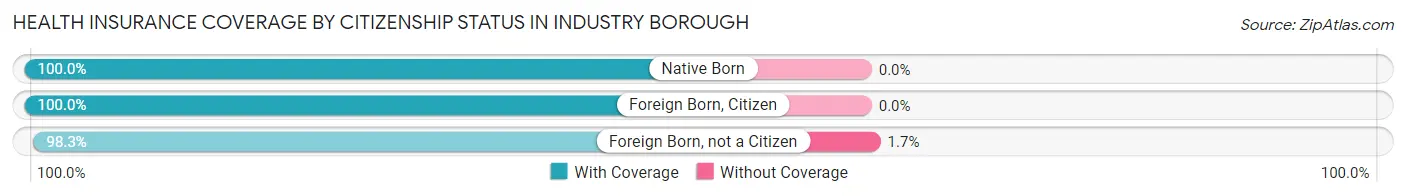
| Citizenship Status | With Coverage | Without Coverage |
| Native Born | 114 (100.0%) | 0 (0.0%) |
| Foreign Born, Citizen | 237 (100.0%) | 0 (0.0%) |
| Foreign Born, not a Citizen | 113 (98.3%) | 2 (1.7%) |
Health Insurance Coverage by Household Income in Industry borough
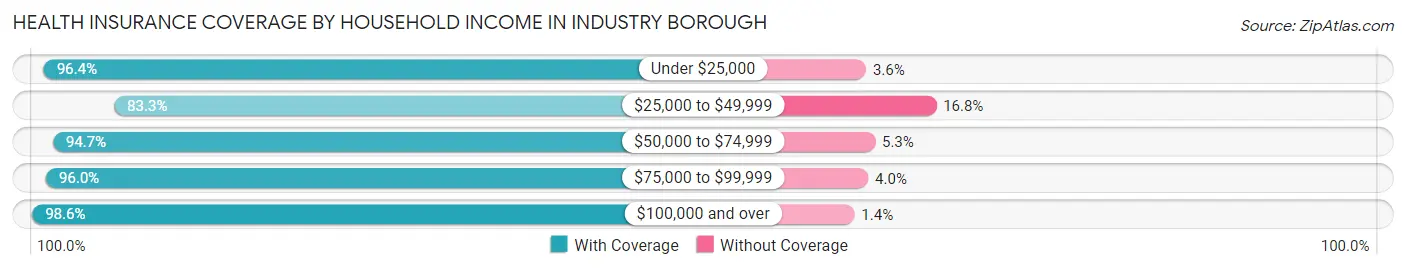
| Household Income | With Coverage | Without Coverage |
| Under $25,000 | 188 (96.4%) | 7 (3.6%) |
| $25,000 to $49,999 | 169 (83.3%) | 34 (16.8%) |
| $50,000 to $74,999 | 358 (94.7%) | 20 (5.3%) |
| $75,000 to $99,999 | 312 (96.0%) | 13 (4.0%) |
| $100,000 and over | 551 (98.6%) | 8 (1.4%) |
Public vs Private Health Insurance Coverage by Age in Industry borough
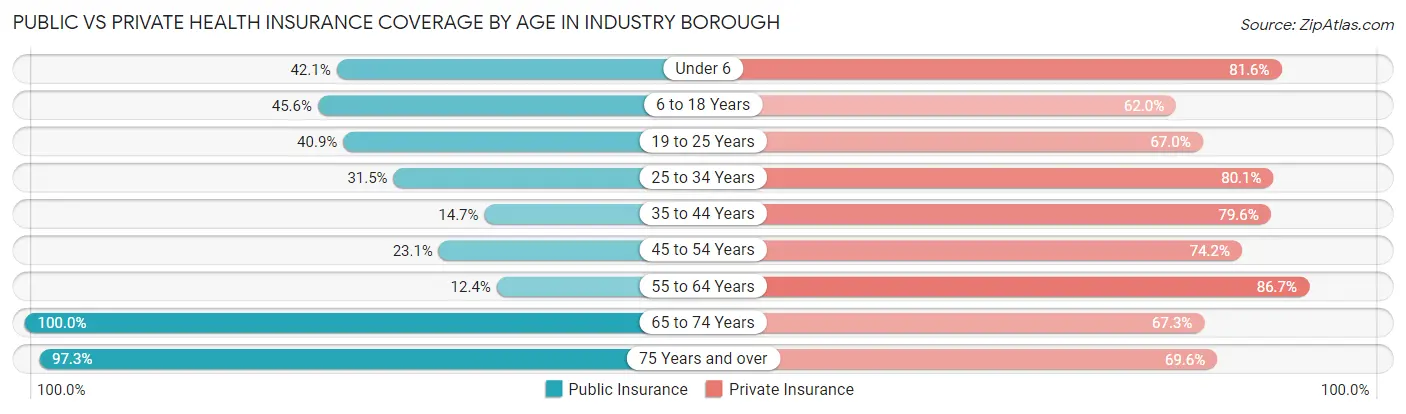
| Age Bracket | Public Insurance | Private Insurance |
| Under 6 | 48 (42.1%) | 93 (81.6%) |
| 6 to 18 Years | 108 (45.6%) | 147 (62.0%) |
| 19 to 25 Years | 47 (40.9%) | 77 (67.0%) |
| 25 to 34 Years | 76 (31.5%) | 193 (80.1%) |
| 35 to 44 Years | 28 (14.7%) | 152 (79.6%) |
| 45 to 54 Years | 53 (23.1%) | 170 (74.2%) |
| 55 to 64 Years | 26 (12.4%) | 182 (86.7%) |
| 65 to 74 Years | 229 (100.0%) | 154 (67.2%) |
| 75 Years and over | 109 (97.3%) | 78 (69.6%) |
| Total | 724 (43.1%) | 1,246 (74.3%) |
Disability Status by Sex by Age in Industry borough
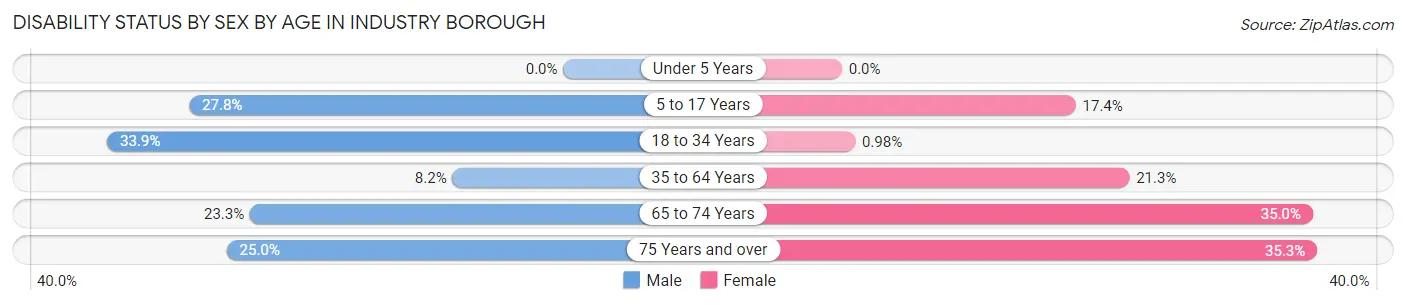
| Age Bracket | Male | Female |
| Under 5 Years | 0 (0.0%) | 0 (0.0%) |
| 5 to 17 Years | 25 (27.8%) | 25 (17.4%) |
| 18 to 34 Years | 63 (33.9%) | 2 (1.0%) |
| 35 to 64 Years | 26 (8.2%) | 67 (21.3%) |
| 65 to 74 Years | 20 (23.3%) | 50 (35.0%) |
| 75 Years and over | 11 (25.0%) | 24 (35.3%) |
Disability Class by Sex by Age in Industry borough
Disability Class: Hearing Difficulty
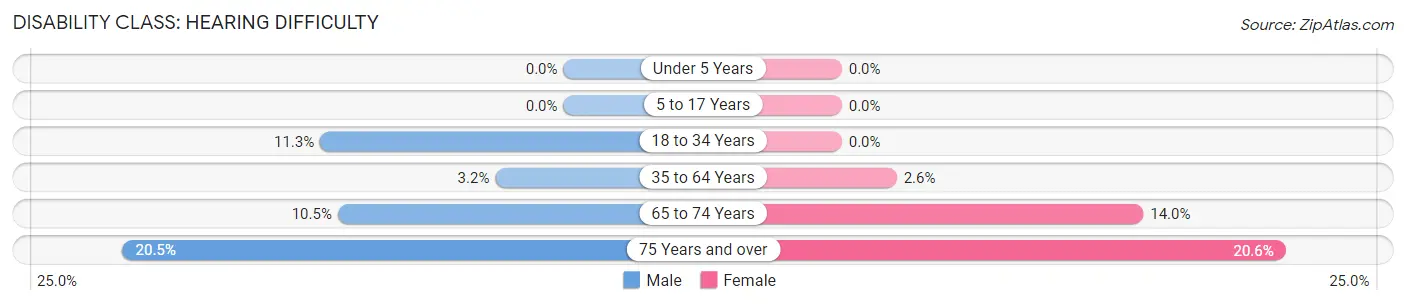
| Age Bracket | Male | Female |
| Under 5 Years | 0 (0.0%) | 0 (0.0%) |
| 5 to 17 Years | 0 (0.0%) | 0 (0.0%) |
| 18 to 34 Years | 21 (11.3%) | 0 (0.0%) |
| 35 to 64 Years | 10 (3.2%) | 8 (2.5%) |
| 65 to 74 Years | 9 (10.5%) | 20 (14.0%) |
| 75 Years and over | 9 (20.4%) | 14 (20.6%) |
Disability Class: Vision Difficulty
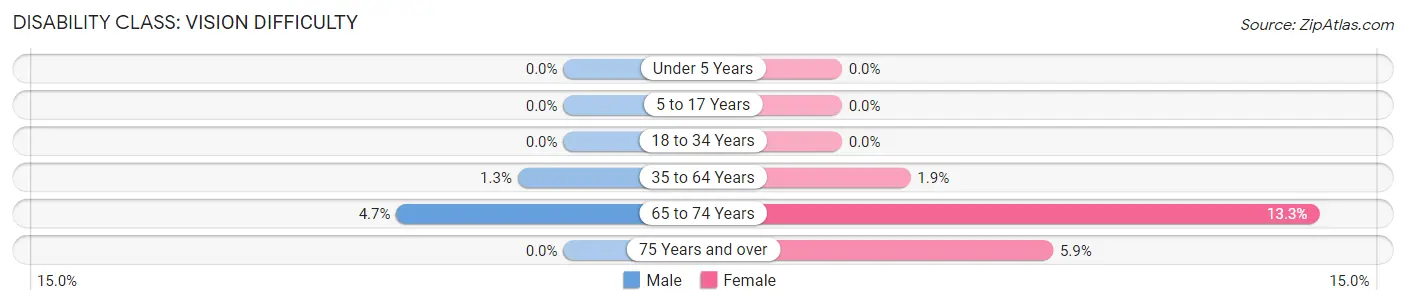
| Age Bracket | Male | Female |
| Under 5 Years | 0 (0.0%) | 0 (0.0%) |
| 5 to 17 Years | 0 (0.0%) | 0 (0.0%) |
| 18 to 34 Years | 0 (0.0%) | 0 (0.0%) |
| 35 to 64 Years | 4 (1.3%) | 6 (1.9%) |
| 65 to 74 Years | 4 (4.6%) | 19 (13.3%) |
| 75 Years and over | 0 (0.0%) | 4 (5.9%) |
Disability Class: Cognitive Difficulty
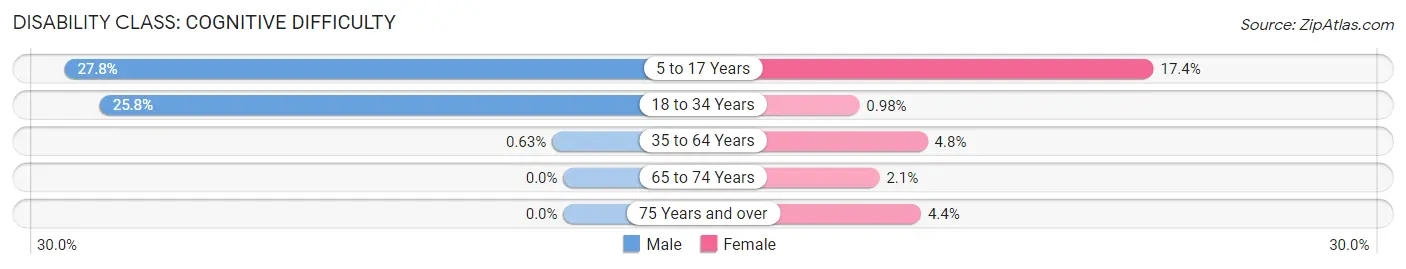
| Age Bracket | Male | Female |
| 5 to 17 Years | 25 (27.8%) | 25 (17.4%) |
| 18 to 34 Years | 48 (25.8%) | 2 (1.0%) |
| 35 to 64 Years | 2 (0.6%) | 15 (4.8%) |
| 65 to 74 Years | 0 (0.0%) | 3 (2.1%) |
| 75 Years and over | 0 (0.0%) | 3 (4.4%) |
Disability Class: Ambulatory Difficulty
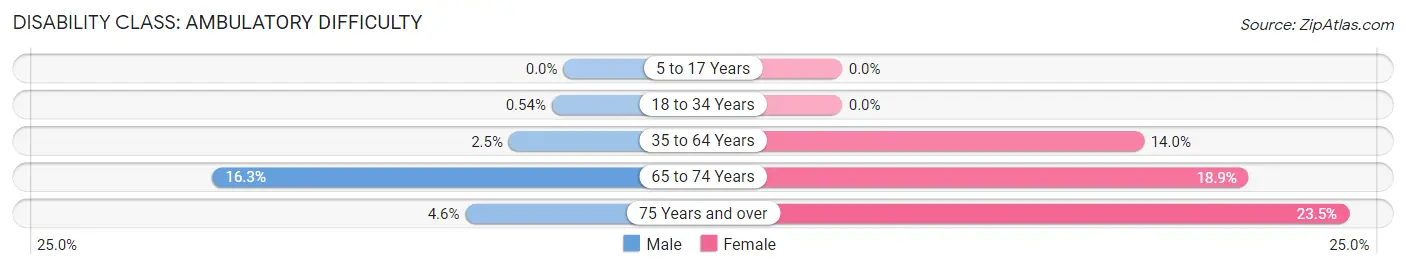
| Age Bracket | Male | Female |
| 5 to 17 Years | 0 (0.0%) | 0 (0.0%) |
| 18 to 34 Years | 1 (0.5%) | 0 (0.0%) |
| 35 to 64 Years | 8 (2.5%) | 44 (14.0%) |
| 65 to 74 Years | 14 (16.3%) | 27 (18.9%) |
| 75 Years and over | 2 (4.5%) | 16 (23.5%) |
Disability Class: Self-Care Difficulty
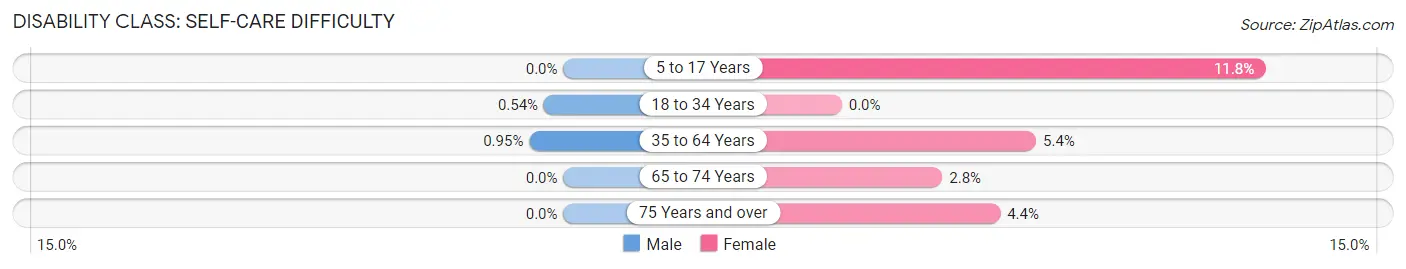
| Age Bracket | Male | Female |
| 5 to 17 Years | 0 (0.0%) | 17 (11.8%) |
| 18 to 34 Years | 1 (0.5%) | 0 (0.0%) |
| 35 to 64 Years | 3 (0.9%) | 17 (5.4%) |
| 65 to 74 Years | 0 (0.0%) | 4 (2.8%) |
| 75 Years and over | 0 (0.0%) | 3 (4.4%) |
Technology Access in Industry borough
Computing Device Access in Industry borough
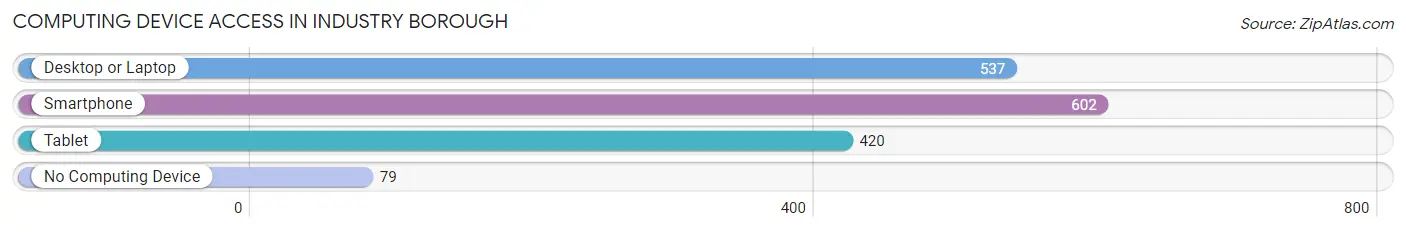
| Device Type | # Households | % Households |
| Desktop or Laptop | 537 | 74.8% |
| Smartphone | 602 | 83.8% |
| Tablet | 420 | 58.5% |
| No Computing Device | 79 | 11.0% |
| Total | 718 | 100.0% |
Internet Access in Industry borough
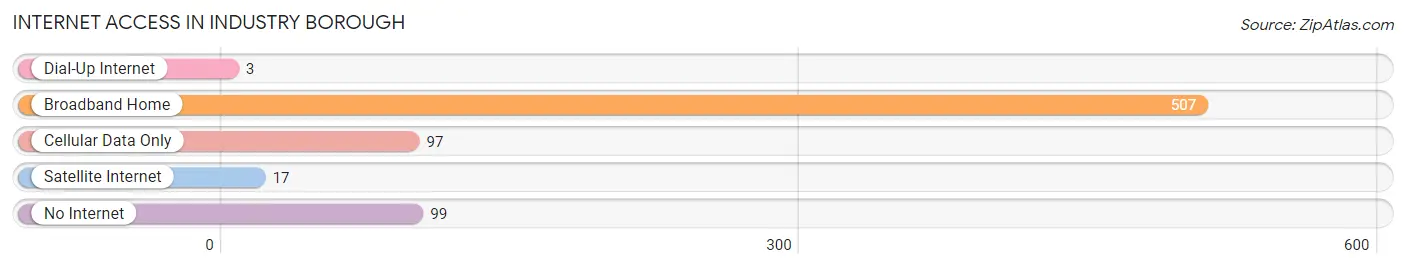
| Internet Type | # Households | % Households |
| Dial-Up Internet | 3 | 0.4% |
| Broadband Home | 507 | 70.6% |
| Cellular Data Only | 97 | 13.5% |
| Satellite Internet | 17 | 2.4% |
| No Internet | 99 | 13.8% |
| Total | 718 | 100.0% |
Industry borough Summary
Industry Borough is a small borough located in Beaver County, Pennsylvania. It is situated in the southwestern corner of the county, and is bordered by the townships of Chippewa, Raccoon, and Hanover. The borough is home to a population of approximately 1,400 people, and is part of the Pittsburgh metropolitan area.
History
Industry Borough was founded in 1832 by a group of settlers from the nearby town of Economy. The settlers were looking for a place to build a new town, and chose the area that is now Industry Borough. The town was named after the local industry that was present in the area, which included a sawmill, a gristmill, and a tannery.
The town grew steadily over the years, and by the late 19th century, it had become a thriving community. The town was home to a variety of businesses, including a hotel, a bank, a post office, and several stores. The town also had a school, a library, and a number of churches.
In the early 20th century, the town began to decline. The local industry had moved away, and the population began to dwindle. By the 1950s, the town had become a virtual ghost town. However, in the late 1970s, the town began to experience a resurgence. New businesses began to move into the area, and the population began to grow again.
Geography
Industry Borough is located in the southwestern corner of Beaver County, Pennsylvania. It is bordered by the townships of Chippewa, Raccoon, and Hanover. The borough is situated on the banks of the Beaver River, and is located approximately 25 miles northwest of Pittsburgh.
The borough covers an area of 1.2 square miles, and is home to a population of approximately 1,400 people. The town is served by two major highways, Interstate 376 and Pennsylvania Route 51.
Economy
The economy of Industry Borough is largely based on the service industry. The town is home to a variety of businesses, including restaurants, retail stores, and professional services. The town is also home to a number of manufacturing companies, including a steel mill and a plastics factory.
The town is also home to a number of small businesses, including a bakery, a hardware store, and a variety of other shops. The town is also home to a number of professional services, including lawyers, accountants, and doctors.
Demographics
As of the 2010 census, the population of Industry Borough was 1,400. The racial makeup of the town was 97.3% White, 0.7% African American, 0.3% Native American, 0.3% Asian, and 1.4% from other races. The median household income was $37,500, and the median family income was $45,000.
The town is served by the Beaver Area School District, which includes two elementary schools, a middle school, and a high school. The town is also home to a number of churches, including the First Presbyterian Church, the First United Methodist Church, and the St. John's Lutheran Church.
Conclusion
Industry Borough is a small borough located in Beaver County, Pennsylvania. It is situated in the southwestern corner of the county, and is bordered by the townships of Chippewa, Raccoon, and Hanover. The borough is home to a population of approximately 1,400 people, and is part of the Pittsburgh metropolitan area. The economy of the town is largely based on the service industry, and the town is served by the Beaver Area School District. The town is also home to a variety of businesses, including restaurants, retail stores, and professional services.
Common Questions
What is Per Capita Income in Industry borough?
Per Capita income in Industry borough is $33,668.
What is the Median Family Income in Industry borough?
Median Family Income in Industry borough is $84,722.
What is the Median Household income in Industry borough?
Median Household Income in Industry borough is $69,773.
What is Income or Wage Gap in Industry borough?
Income or Wage Gap in Industry borough is 35.6%.
Women in Industry borough earn 64.4 cents for every dollar earned by a man.
What is Family Income Deficit in Industry borough?
Family Income Deficit in Industry borough is $10,391.
Families that are below poverty line in Industry borough earn $10,391 less on average than the poverty threshold level.
What is Inequality or Gini Index in Industry borough?
Inequality or Gini Index in Industry borough is 0.37.
What is the Total Population of Industry borough?
Total Population of Industry borough is 1,678.
What is the Total Male Population of Industry borough?
Total Male Population of Industry borough is 754.
What is the Total Female Population of Industry borough?
Total Female Population of Industry borough is 924.
What is the Ratio of Males per 100 Females in Industry borough?
There are 81.60 Males per 100 Females in Industry borough.
What is the Ratio of Females per 100 Males in Industry borough?
There are 122.55 Females per 100 Males in Industry borough.
What is the Median Population Age in Industry borough?
Median Population Age in Industry borough is 40.9 Years.
What is the Average Family Size in Industry borough
Average Family Size in Industry borough is 2.7 People.
What is the Average Household Size in Industry borough
Average Household Size in Industry borough is 2.3 People.
How Large is the Labor Force in Industry borough?
There are 948 People in the Labor Forcein in Industry borough.
What is the Percentage of People in the Labor Force in Industry borough?
66.4% of People are in the Labor Force in Industry borough.
What is the Unemployment Rate in Industry borough?
Unemployment Rate in Industry borough is 6.8%.