Berlin, OH Map & Demographics
Berlin Map
Berlin Overview
$27,764
PER CAPITA INCOME
$86,667
AVG FAMILY INCOME
$73,214
AVG HOUSEHOLD INCOME
42.0%
WAGE / INCOME GAP [ % ]
58.0¢/ $1
WAGE / INCOME GAP [ $ ]
0.34
INEQUALITY / GINI INDEX
1,207
TOTAL POPULATION
614
MALE POPULATION
593
FEMALE POPULATION
103.54
MALES / 100 FEMALES
96.58
FEMALES / 100 MALES
39.2
MEDIAN AGE
3.5
AVG FAMILY SIZE
2.9
AVG HOUSEHOLD SIZE
679
LABOR FORCE [ PEOPLE ]
73.2%
PERCENT IN LABOR FORCE
Berlin Zip Codes
Berlin Area Codes
Income in Berlin
Income Overview in Berlin
Per Capita Income in Berlin is $27,764, while median incomes of families and households are $86,667 and $73,214 respectively.
| Characteristic | Number | Measure |
| Per Capita Income | 1,207 | $27,764 |
| Median Family Income | 322 | $86,667 |
| Mean Family Income | 322 | $91,393 |
| Median Household Income | 414 | $73,214 |
| Mean Household Income | 414 | $78,788 |
| Income Deficit | 322 | $0 |
| Wage / Income Gap (%) | 1,207 | 42.04% |
| Wage / Income Gap ($) | 1,207 | 57.96¢ per $1 |
| Gini / Inequality Index | 1,207 | 0.34 |
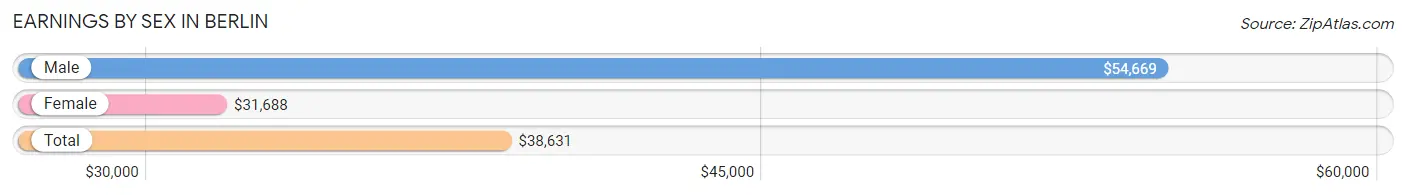
Earnings by Sex in Berlin
Average Earnings in Berlin are $38,631, $54,669 for men and $31,688 for women, a difference of 42.0%.
| Sex | Number | Average Earnings |
| Male | 365 (50.3%) | $54,669 |
| Female | 361 (49.7%) | $31,688 |
| Total | 726 (100.0%) | $38,631 |
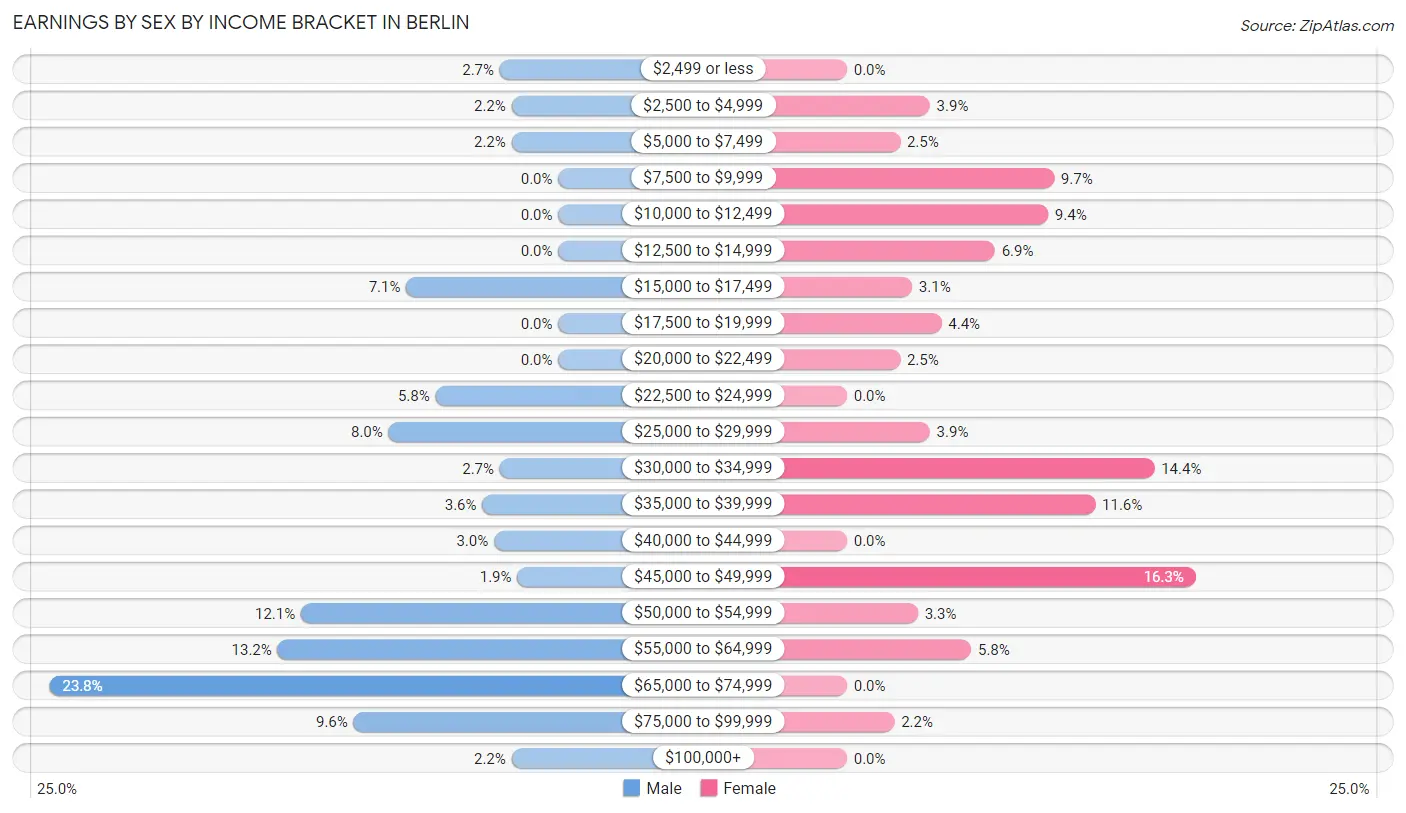
Earnings by Sex by Income Bracket in Berlin
The most common earnings brackets in Berlin are $65,000 to $74,999 for men (87 | 23.8%) and $45,000 to $49,999 for women (59 | 16.3%).
| Income | Male | Female |
| $2,499 or less | 10 (2.7%) | 0 (0.0%) |
| $2,500 to $4,999 | 8 (2.2%) | 14 (3.9%) |
| $5,000 to $7,499 | 8 (2.2%) | 9 (2.5%) |
| $7,500 to $9,999 | 0 (0.0%) | 35 (9.7%) |
| $10,000 to $12,499 | 0 (0.0%) | 34 (9.4%) |
| $12,500 to $14,999 | 0 (0.0%) | 25 (6.9%) |
| $15,000 to $17,499 | 26 (7.1%) | 11 (3.0%) |
| $17,500 to $19,999 | 0 (0.0%) | 16 (4.4%) |
| $20,000 to $22,499 | 0 (0.0%) | 9 (2.5%) |
| $22,500 to $24,999 | 21 (5.8%) | 0 (0.0%) |
| $25,000 to $29,999 | 29 (8.0%) | 14 (3.9%) |
| $30,000 to $34,999 | 10 (2.7%) | 52 (14.4%) |
| $35,000 to $39,999 | 13 (3.6%) | 42 (11.6%) |
| $40,000 to $44,999 | 11 (3.0%) | 0 (0.0%) |
| $45,000 to $49,999 | 7 (1.9%) | 59 (16.3%) |
| $50,000 to $54,999 | 44 (12.0%) | 12 (3.3%) |
| $55,000 to $64,999 | 48 (13.2%) | 21 (5.8%) |
| $65,000 to $74,999 | 87 (23.8%) | 0 (0.0%) |
| $75,000 to $99,999 | 35 (9.6%) | 8 (2.2%) |
| $100,000+ | 8 (2.2%) | 0 (0.0%) |
| Total | 365 (100.0%) | 361 (100.0%) |
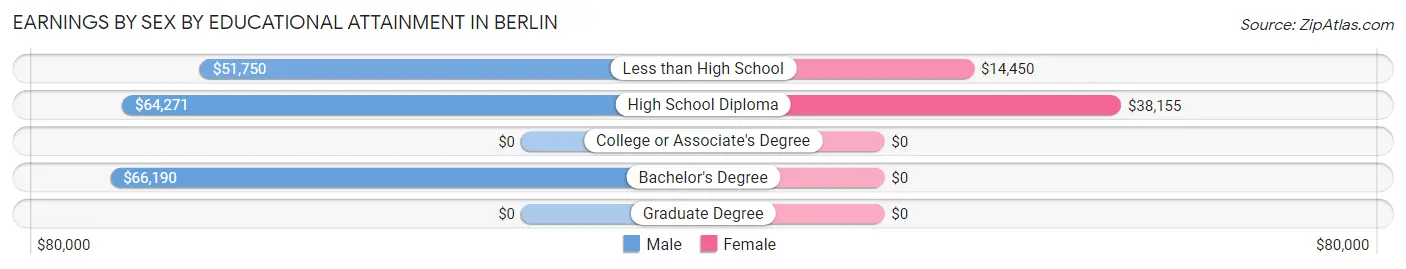
Earnings by Sex by Educational Attainment in Berlin
Average earnings in Berlin are $62,375 for men and $33,700 for women, a difference of 46.0%. Men with an educational attainment of bachelor's degree enjoy the highest average annual earnings of $66,190, while those with less than high school education earn the least with $51,750. Women with an educational attainment of high school diploma earn the most with the average annual earnings of $38,155, while those with less than high school education have the smallest earnings of $14,450.
| Educational Attainment | Male Income | Female Income |
| Less than High School | $51,750 | $14,450 |
| High School Diploma | $64,271 | $38,155 |
| College or Associate's Degree | - | - |
| Bachelor's Degree | $66,190 | $0 |
| Graduate Degree | - | - |
| Total | $62,375 | $33,700 |
Family Income in Berlin
Family Income Brackets in Berlin
According to the Berlin family income data, there are 129 families falling into the $100,000 to $149,999 income range, which is the most common income bracket and makes up 40.1% of all families.
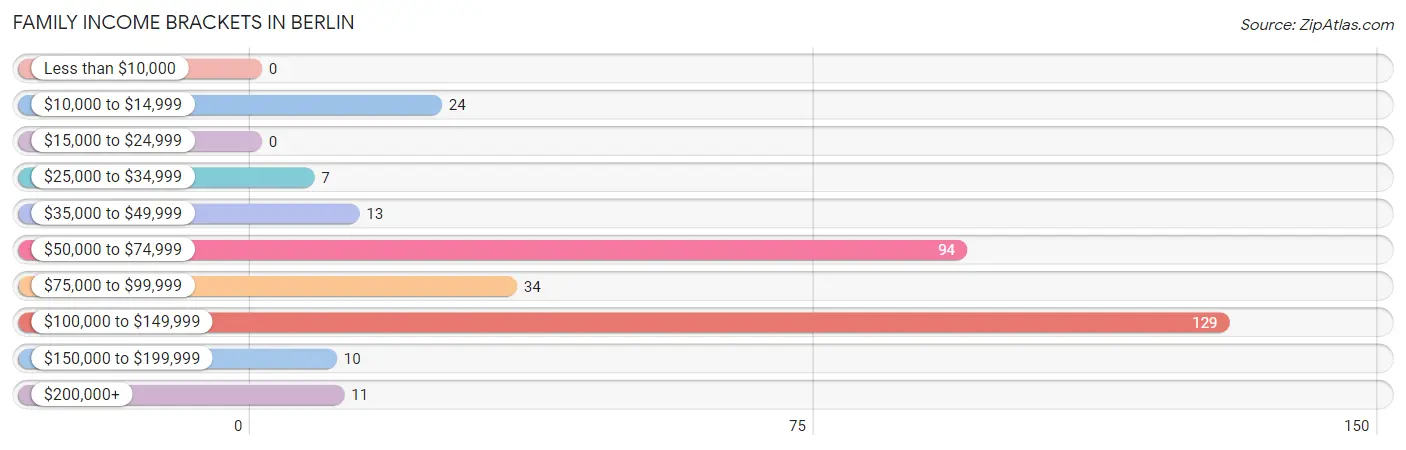
| Income Bracket | # Families | % Families |
| Less than $10,000 | 0 | 0.0% |
| $10,000 to $14,999 | 24 | 7.5% |
| $15,000 to $24,999 | 0 | 0.0% |
| $25,000 to $34,999 | 7 | 2.2% |
| $35,000 to $49,999 | 13 | 4.0% |
| $50,000 to $74,999 | 94 | 29.2% |
| $75,000 to $99,999 | 34 | 10.6% |
| $100,000 to $149,999 | 129 | 40.1% |
| $150,000 to $199,999 | 10 | 3.1% |
| $200,000+ | 11 | 3.4% |
Family Income by Famaliy Size in Berlin
4-person families (74 | 23.0%) account for the highest median family income in Berlin with $105,526 per family, while 2-person families (144 | 44.7%) have the highest median income of $36,607 per family member.
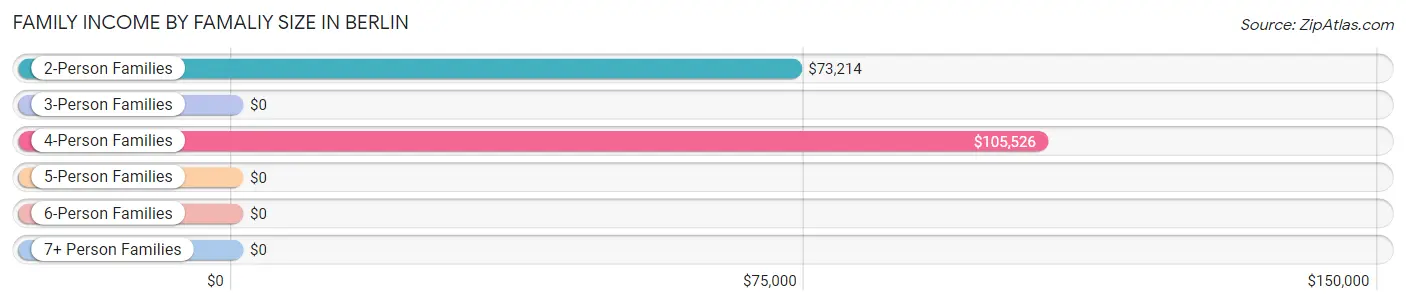
| Income Bracket | # Families | Median Income |
| 2-Person Families | 144 (44.7%) | $73,214 |
| 3-Person Families | 21 (6.5%) | $0 |
| 4-Person Families | 74 (23.0%) | $105,526 |
| 5-Person Families | 53 (16.5%) | $0 |
| 6-Person Families | 20 (6.2%) | $0 |
| 7+ Person Families | 10 (3.1%) | $0 |
| Total | 322 (100.0%) | $86,667 |
Family Income by Number of Earners in Berlin
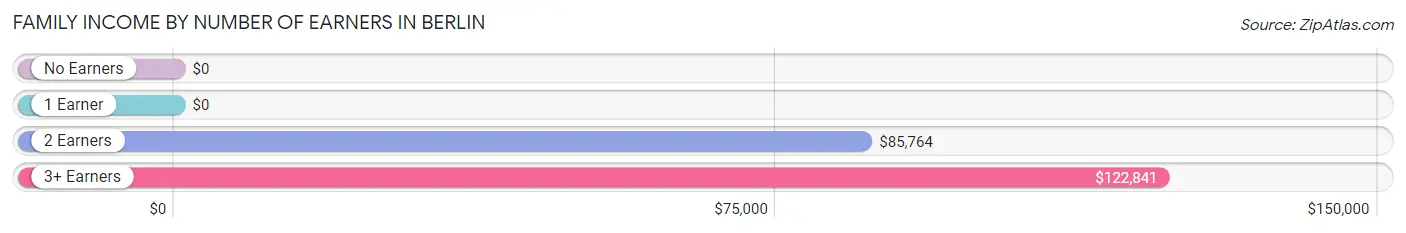
| Number of Earners | # Families | Median Income |
| No Earners | 31 (9.6%) | $0 |
| 1 Earner | 39 (12.1%) | $0 |
| 2 Earners | 185 (57.5%) | $85,764 |
| 3+ Earners | 67 (20.8%) | $122,841 |
| Total | 322 (100.0%) | $86,667 |
Household Income in Berlin
Household Income Brackets in Berlin
With 129 households falling in the category, the $100,000 to $149,999 income range is the most frequent in Berlin, accounting for 31.2% of all households.
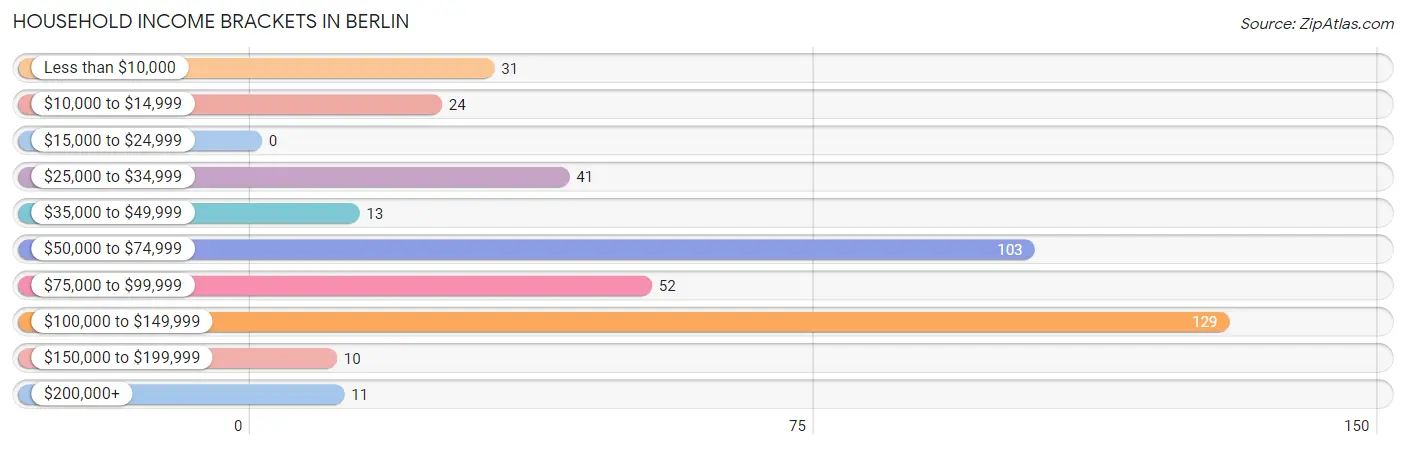
| Income Bracket | # Households | % Households |
| Less than $10,000 | 31 | 7.5% |
| $10,000 to $14,999 | 24 | 5.8% |
| $15,000 to $24,999 | 0 | 0.0% |
| $25,000 to $34,999 | 41 | 9.9% |
| $35,000 to $49,999 | 13 | 3.1% |
| $50,000 to $74,999 | 103 | 24.9% |
| $75,000 to $99,999 | 52 | 12.6% |
| $100,000 to $149,999 | 129 | 31.2% |
| $150,000 to $199,999 | 10 | 2.4% |
| $200,000+ | 11 | 2.7% |
Household Income by Householder Age in Berlin
The median household income in Berlin is $73,214, with the highest median household income of $104,542 found in the 45 to 64 years age bracket for the primary householder. A total of 141 households (34.1%) fall into this category. Meanwhile, the 15 to 24 years age bracket for the primary householder has the lowest median household income of $0, with 7 households (1.7%) in this group.
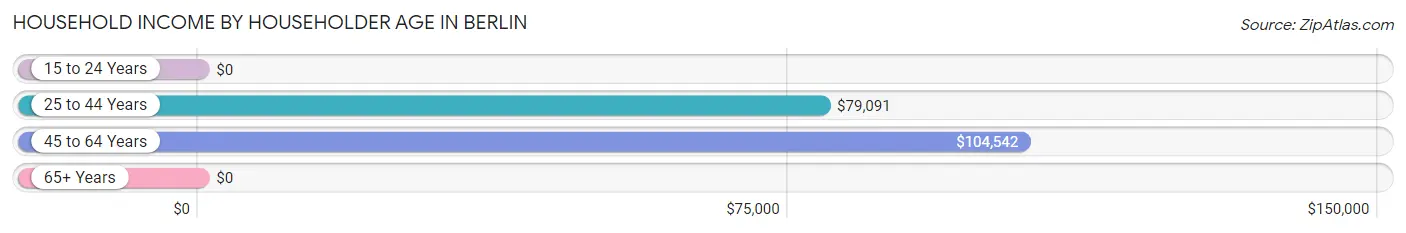
| Income Bracket | # Households | Median Income |
| 15 to 24 Years | 7 (1.7%) | $0 |
| 25 to 44 Years | 138 (33.3%) | $79,091 |
| 45 to 64 Years | 141 (34.1%) | $104,542 |
| 65+ Years | 128 (30.9%) | $0 |
| Total | 414 (100.0%) | $73,214 |
Poverty in Berlin
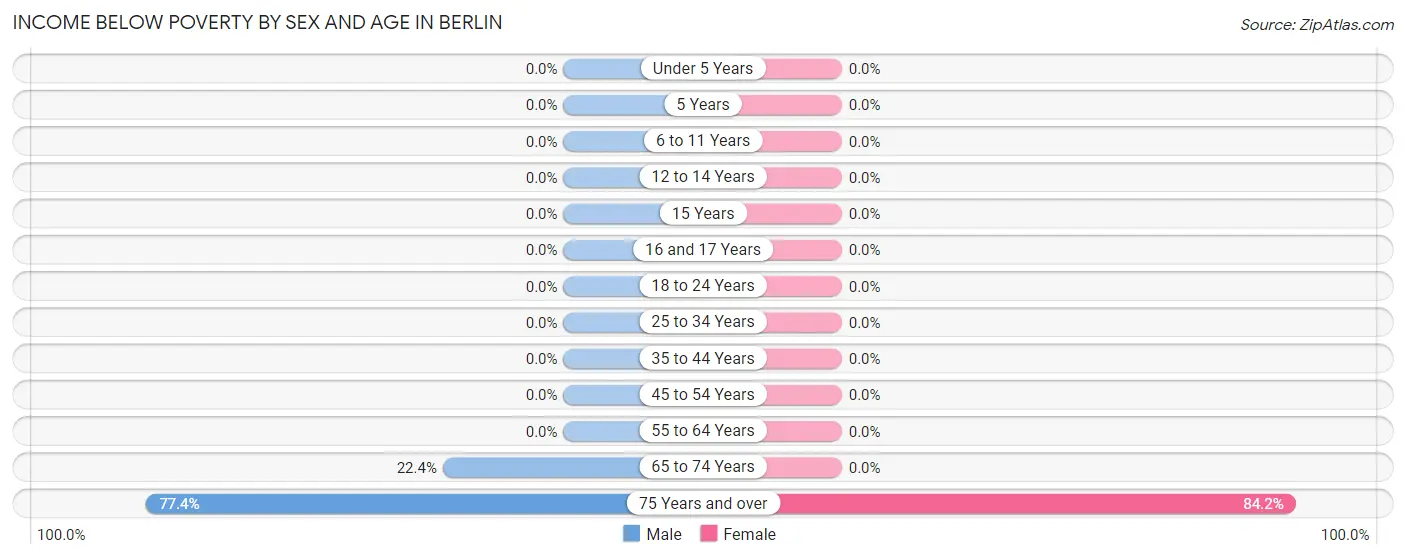
Income Below Poverty by Sex and Age in Berlin
With 6.4% poverty level for males and 8.1% for females among the residents of Berlin, 75 year old and over males and 75 year old and over females are the most vulnerable to poverty, with 24 males (77.4%) and 48 females (84.2%) in their respective age groups living below the poverty level.
| Age Bracket | Male | Female |
| Under 5 Years | 0 (0.0%) | 0 (0.0%) |
| 5 Years | 0 (0.0%) | 0 (0.0%) |
| 6 to 11 Years | 0 (0.0%) | 0 (0.0%) |
| 12 to 14 Years | 0 (0.0%) | 0 (0.0%) |
| 15 Years | 0 (0.0%) | 0 (0.0%) |
| 16 and 17 Years | 0 (0.0%) | 0 (0.0%) |
| 18 to 24 Years | 0 (0.0%) | 0 (0.0%) |
| 25 to 34 Years | 0 (0.0%) | 0 (0.0%) |
| 35 to 44 Years | 0 (0.0%) | 0 (0.0%) |
| 45 to 54 Years | 0 (0.0%) | 0 (0.0%) |
| 55 to 64 Years | 0 (0.0%) | 0 (0.0%) |
| 65 to 74 Years | 15 (22.4%) | 0 (0.0%) |
| 75 Years and over | 24 (77.4%) | 48 (84.2%) |
| Total | 39 (6.4%) | 48 (8.1%) |
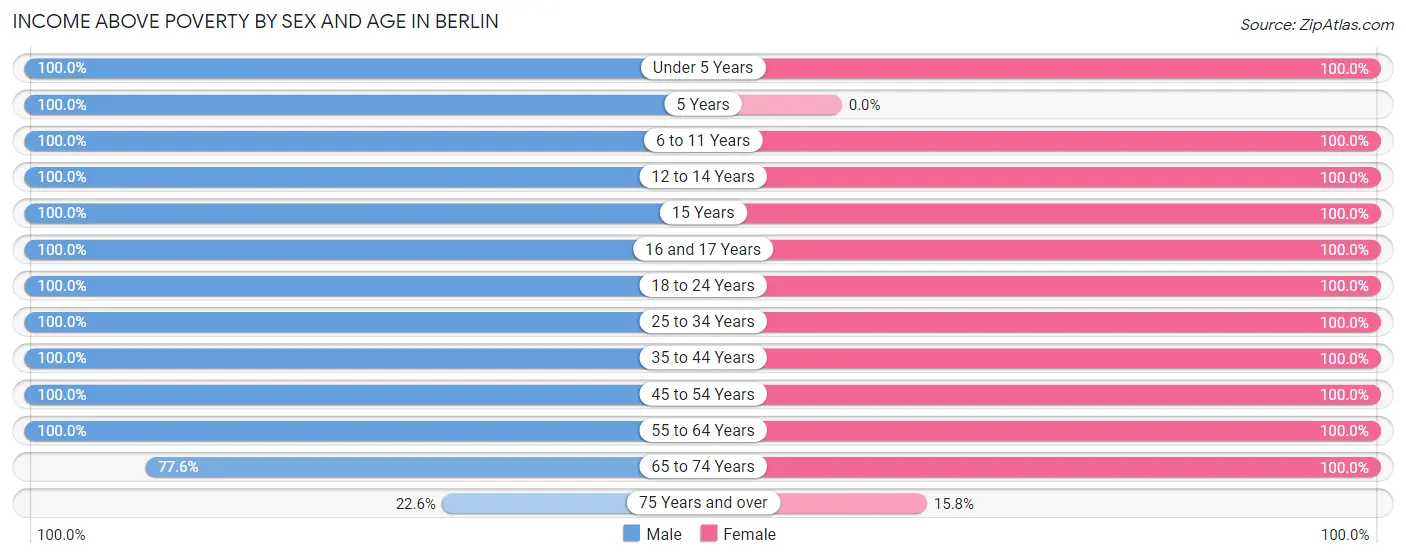
Income Above Poverty by Sex and Age in Berlin
According to the poverty statistics in Berlin, males aged under 5 years and females aged under 5 years are the age groups that are most secure financially, with 100.0% of males and 100.0% of females in these age groups living above the poverty line.
| Age Bracket | Male | Female |
| Under 5 Years | 20 (100.0%) | 34 (100.0%) |
| 5 Years | 20 (100.0%) | 0 (0.0%) |
| 6 to 11 Years | 120 (100.0%) | 10 (100.0%) |
| 12 to 14 Years | 7 (100.0%) | 26 (100.0%) |
| 15 Years | 20 (100.0%) | 22 (100.0%) |
| 16 and 17 Years | 10 (100.0%) | 26 (100.0%) |
| 18 to 24 Years | 62 (100.0%) | 37 (100.0%) |
| 25 to 34 Years | 53 (100.0%) | 120 (100.0%) |
| 35 to 44 Years | 91 (100.0%) | 55 (100.0%) |
| 45 to 54 Years | 50 (100.0%) | 50 (100.0%) |
| 55 to 64 Years | 63 (100.0%) | 99 (100.0%) |
| 65 to 74 Years | 52 (77.6%) | 57 (100.0%) |
| 75 Years and over | 7 (22.6%) | 9 (15.8%) |
| Total | 575 (93.6%) | 545 (91.9%) |
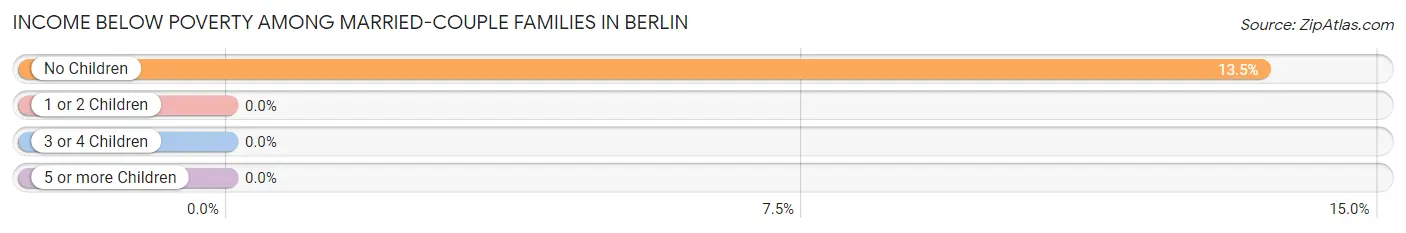
Income Below Poverty Among Married-Couple Families in Berlin
The poverty statistics for married-couple families in Berlin show that 7.9% or 24 of the total 304 families live below the poverty line. Families with no children have the highest poverty rate of 13.5%, comprising of 24 families. On the other hand, families with 1 or 2 children have the lowest poverty rate of 0.0%, which includes 0 families.
| Children | Above Poverty | Below Poverty |
| No Children | 154 (86.5%) | 24 (13.5%) |
| 1 or 2 Children | 53 (100.0%) | 0 (0.0%) |
| 3 or 4 Children | 73 (100.0%) | 0 (0.0%) |
| 5 or more Children | 0 (0.0%) | 0 (0.0%) |
| Total | 280 (92.1%) | 24 (7.9%) |
Income Below Poverty Among Single-Parent Households in Berlin
| Children | Single Father | Single Mother |
| No Children | 0 (0.0%) | 0 (0.0%) |
| 1 or 2 Children | 0 (0.0%) | 0 (0.0%) |
| 3 or 4 Children | 0 (0.0%) | 0 (0.0%) |
| 5 or more Children | 0 (0.0%) | 0 (0.0%) |
| Total | 0 (0.0%) | 0 (0.0%) |
Income Below Poverty Among Married-Couple vs Single-Parent Households in Berlin
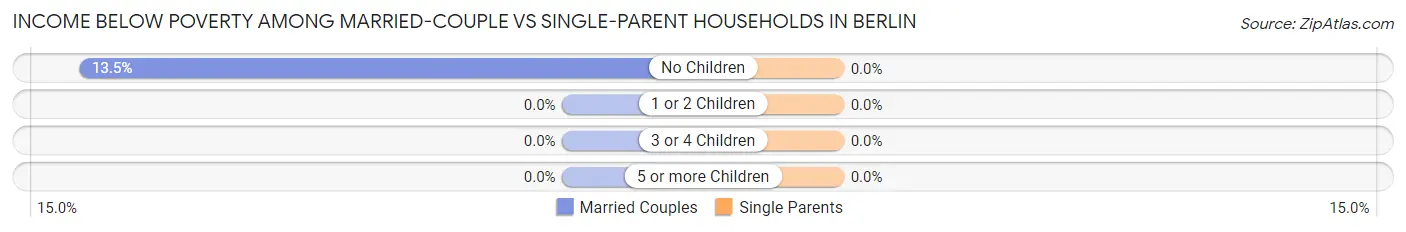
| Children | Married-Couple Families | Single-Parent Households |
| No Children | 24 (13.5%) | 0 (0.0%) |
| 1 or 2 Children | 0 (0.0%) | 0 (0.0%) |
| 3 or 4 Children | 0 (0.0%) | 0 (0.0%) |
| 5 or more Children | 0 (0.0%) | 0 (0.0%) |
| Total | 24 (7.9%) | 0 (0.0%) |
Race in Berlin
The most populous races in Berlin are , and White / Caucasian (1,207 | 100.0%).
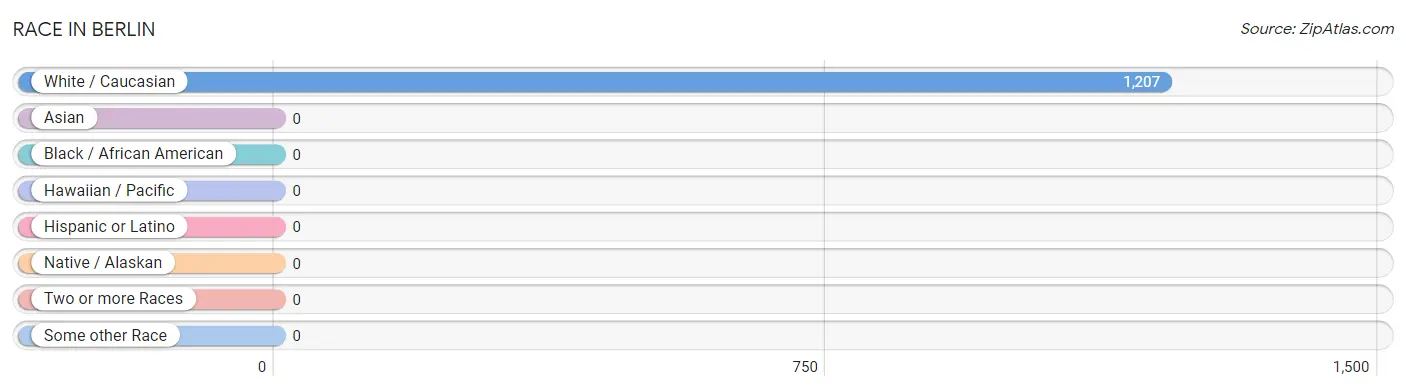
| Race | # Population | % Population |
| Asian | 0 | 0.0% |
| Black / African American | 0 | 0.0% |
| Hawaiian / Pacific | 0 | 0.0% |
| Hispanic or Latino | 0 | 0.0% |
| Native / Alaskan | 0 | 0.0% |
| White / Caucasian | 1,207 | 100.0% |
| Two or more Races | 0 | 0.0% |
| Some other Race | 0 | 0.0% |
| Total | 1,207 | 100.0% |
Ancestry in Berlin
The most populous ancestries reported in Berlin are German (413 | 34.2%), Swiss (234 | 19.4%), American (148 | 12.3%), Pennsylvania German (117 | 9.7%), and Irish (86 | 7.1%), together accounting for 82.7% of all Berlin residents.
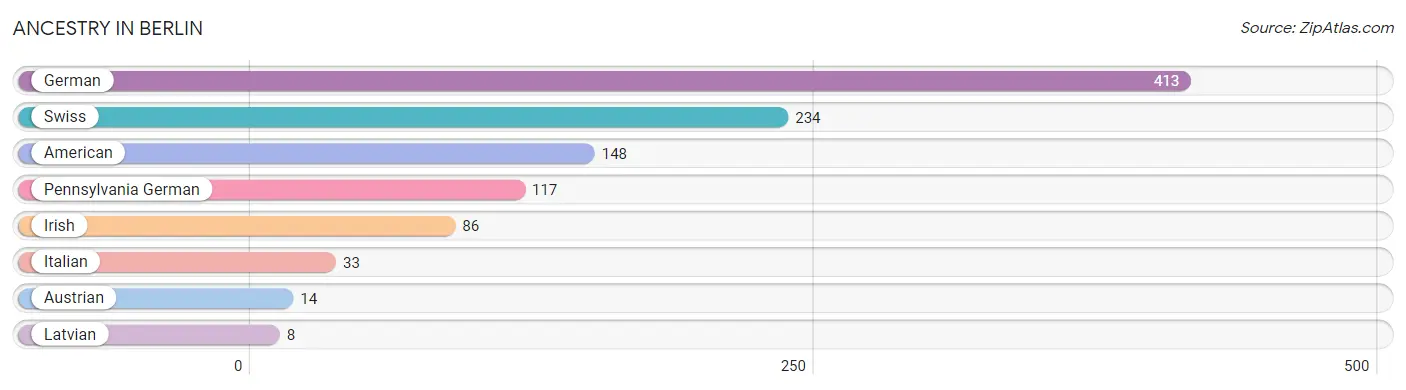
| Ancestry | # Population | % Population |
| American | 148 | 12.3% |
| Austrian | 14 | 1.2% |
| German | 413 | 34.2% |
| Irish | 86 | 7.1% |
| Italian | 33 | 2.7% |
| Latvian | 8 | 0.7% |
| Pennsylvania German | 117 | 9.7% |
| Swiss | 234 | 19.4% | View All 8 Rows |
Immigrants in Berlin

| Immigration Origin | # Population | % Population | View All 0 Rows |
Sex and Age in Berlin
Sex and Age in Berlin
The most populous age groups in Berlin are 5 to 9 Years (124 | 20.2%) for men and 25 to 29 Years (77 | 13.0%) for women.
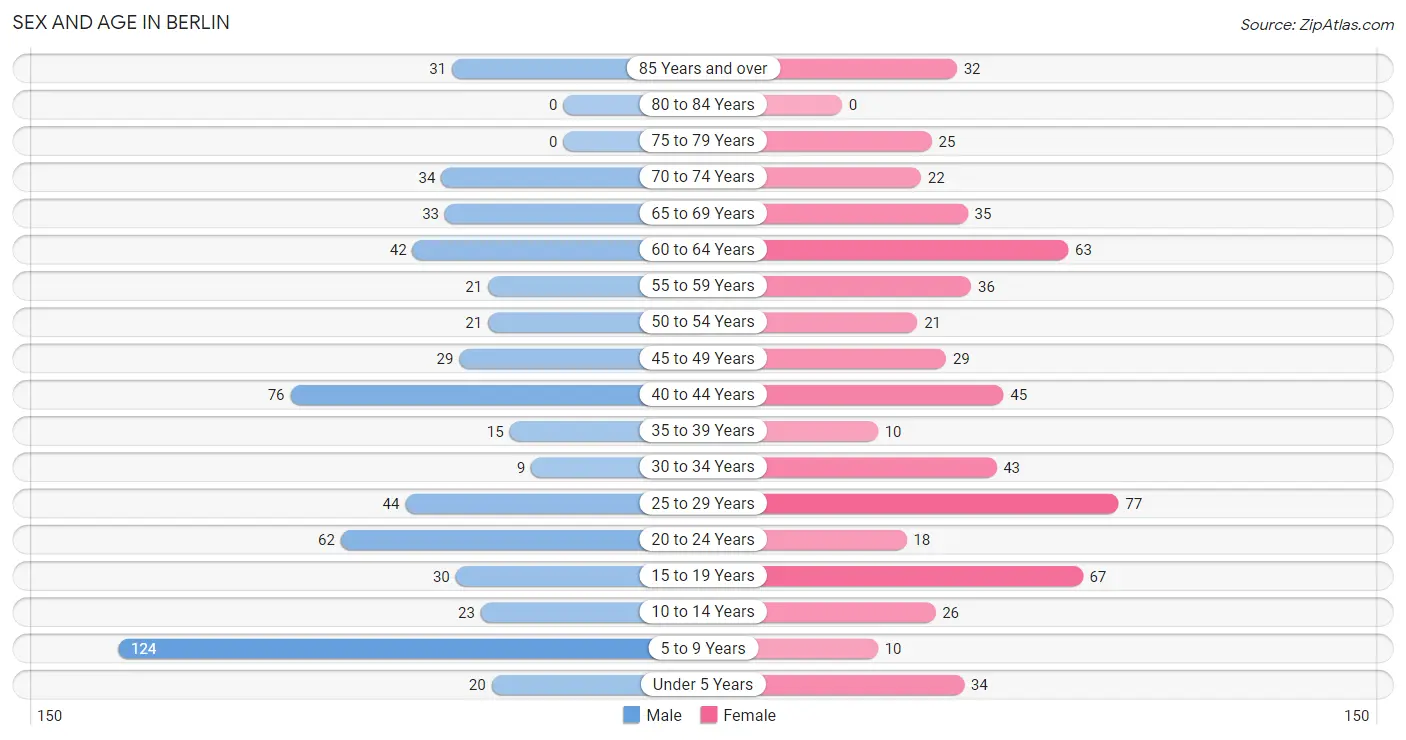
| Age Bracket | Male | Female |
| Under 5 Years | 20 (3.3%) | 34 (5.7%) |
| 5 to 9 Years | 124 (20.2%) | 10 (1.7%) |
| 10 to 14 Years | 23 (3.7%) | 26 (4.4%) |
| 15 to 19 Years | 30 (4.9%) | 67 (11.3%) |
| 20 to 24 Years | 62 (10.1%) | 18 (3.0%) |
| 25 to 29 Years | 44 (7.2%) | 77 (13.0%) |
| 30 to 34 Years | 9 (1.5%) | 43 (7.2%) |
| 35 to 39 Years | 15 (2.4%) | 10 (1.7%) |
| 40 to 44 Years | 76 (12.4%) | 45 (7.6%) |
| 45 to 49 Years | 29 (4.7%) | 29 (4.9%) |
| 50 to 54 Years | 21 (3.4%) | 21 (3.5%) |
| 55 to 59 Years | 21 (3.4%) | 36 (6.1%) |
| 60 to 64 Years | 42 (6.8%) | 63 (10.6%) |
| 65 to 69 Years | 33 (5.4%) | 35 (5.9%) |
| 70 to 74 Years | 34 (5.5%) | 22 (3.7%) |
| 75 to 79 Years | 0 (0.0%) | 25 (4.2%) |
| 80 to 84 Years | 0 (0.0%) | 0 (0.0%) |
| 85 Years and over | 31 (5.1%) | 32 (5.4%) |
| Total | 614 (100.0%) | 593 (100.0%) |
Families and Households in Berlin
Median Family Size in Berlin
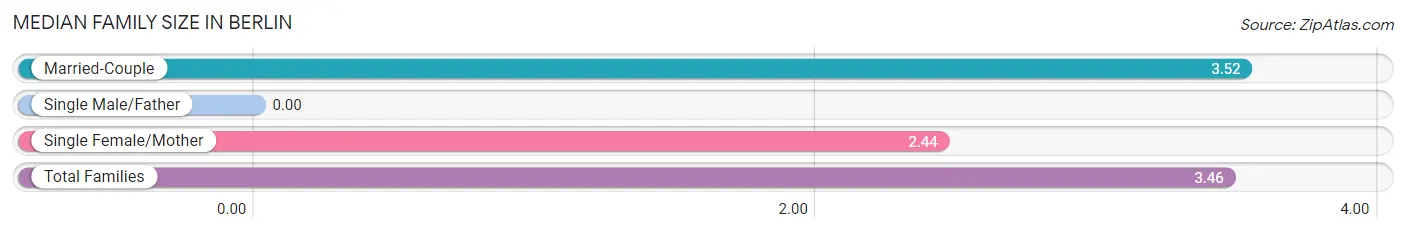
| Family Type | # Families | Family Size |
| Married-Couple | 304 (94.4%) | 3.52 |
| Single Male/Father | 0 (0.0%) | - |
| Single Female/Mother | 18 (5.6%) | 2.44 |
| Total Families | 322 (100.0%) | 3.46 |
Median Household Size in Berlin
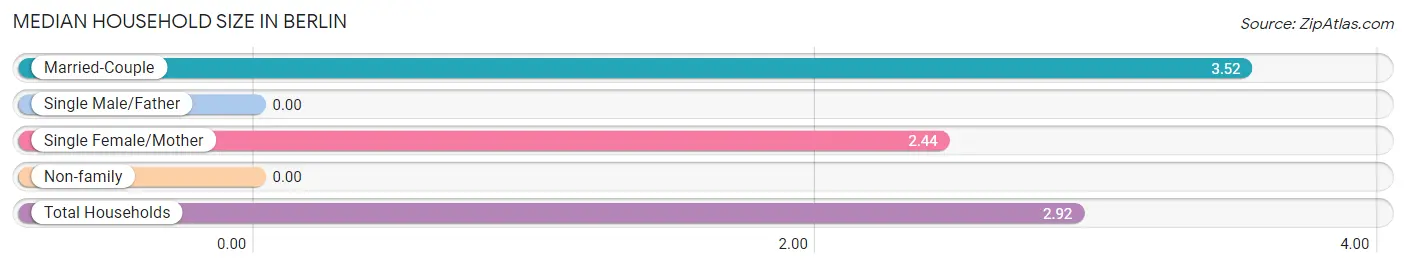
| Household Type | # Households | Household Size |
| Married-Couple | 304 (73.4%) | 3.52 |
| Single Male/Father | 0 (0.0%) | - |
| Single Female/Mother | 18 (4.3%) | 2.44 |
| Non-family | 92 (22.2%) | - |
| Total Households | 414 (100.0%) | 2.92 |
Household Size by Marriage Status in Berlin
Out of a total of 414 households in Berlin, 322 (77.8%) are family households, while 92 (22.2%) are nonfamily households. The most numerous type of family households are 2-person households, comprising 144, and the most common type of nonfamily households are 1-person households, comprising 92.
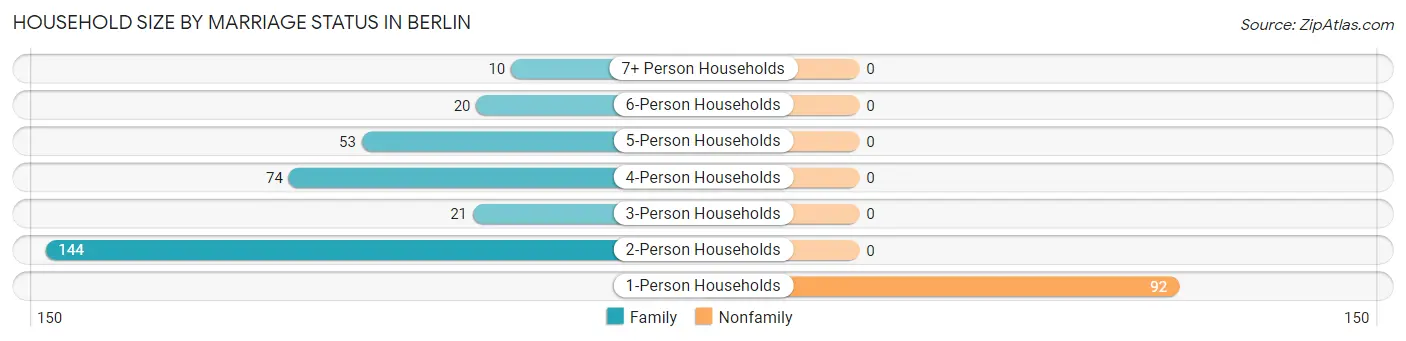
| Household Size | Family Households | Nonfamily Households |
| 1-Person Households | - | 92 (22.2%) |
| 2-Person Households | 144 (34.8%) | 0 (0.0%) |
| 3-Person Households | 21 (5.1%) | 0 (0.0%) |
| 4-Person Households | 74 (17.9%) | 0 (0.0%) |
| 5-Person Households | 53 (12.8%) | 0 (0.0%) |
| 6-Person Households | 20 (4.8%) | 0 (0.0%) |
| 7+ Person Households | 10 (2.4%) | 0 (0.0%) |
| Total | 322 (77.8%) | 92 (22.2%) |
Female Fertility in Berlin
Fertility by Age in Berlin
| Age Bracket | Women with Births | Births / 1,000 Women |
| 15 to 19 years | 0 (0.0%) | 0.0 |
| 20 to 34 years | 0 (0.0%) | 0.0 |
| 35 to 50 years | 0 (0.0%) | 0.0 |
| Total | 0 (0.0%) | 0.0 |
Fertility by Age by Marriage Status in Berlin
| Age Bracket | Married | Unmarried |
| 15 to 19 years | 0 (0.0%) | 0 (0.0%) |
| 20 to 34 years | 0 (0.0%) | 0 (0.0%) |
| 35 to 50 years | 0 (0.0%) | 0 (0.0%) |
| Total | 0 (0.0%) | 0 (0.0%) |
Fertility by Education in Berlin
| Educational Attainment | Women with Births | Births / 1,000 Women |
| Less than High School | 0 (0.0%) | 0.0 |
| High School Diploma | 0 (0.0%) | 0.0 |
| College or Associate's Degree | 0 (0.0%) | 0.0 |
| Bachelor's Degree | 0 (0.0%) | 0.0 |
| Graduate Degree | 0 (0.0%) | 0.0 |
| Total | 0 (0.0%) | 0.0 |
Fertility by Education by Marriage Status in Berlin
| Educational Attainment | Married | Unmarried |
| Less than High School | 0 (0.0%) | 0 (0.0%) |
| High School Diploma | 0 (0.0%) | 0 (0.0%) |
| College or Associate's Degree | 0 (0.0%) | 0 (0.0%) |
| Bachelor's Degree | 0 (0.0%) | 0 (0.0%) |
| Graduate Degree | 0 (0.0%) | 0 (0.0%) |
| Total | 0 (0.0%) | 0 (0.0%) |
Employment Characteristics in Berlin
Employment by Class of Employer in Berlin
Among the 671 employed individuals in Berlin, private company employees (486 | 72.4%), self-employed (not incorporated) (129 | 19.2%), and local government employees (33 | 4.9%) make up the most common classes of employment.
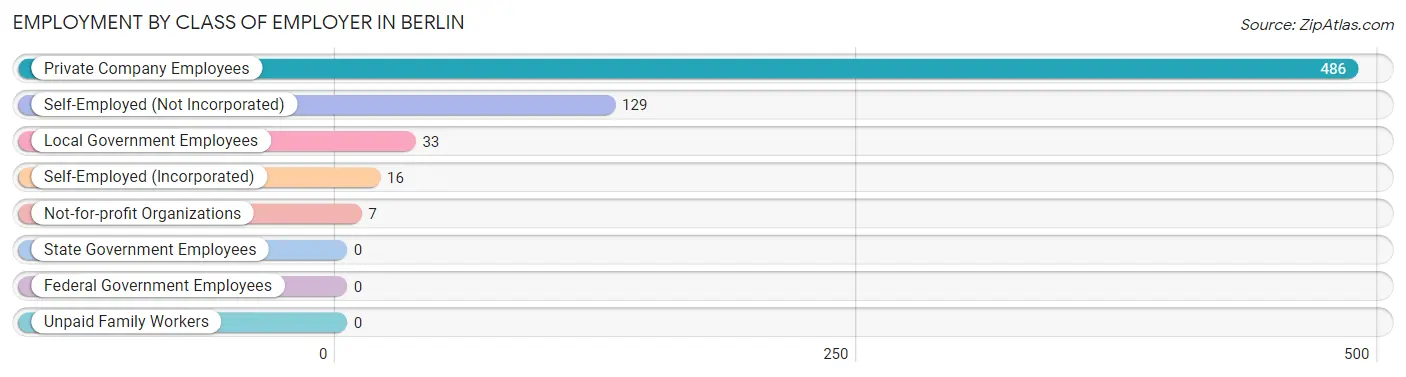
| Employer Class | # Employees | % Employees |
| Private Company Employees | 486 | 72.4% |
| Self-Employed (Incorporated) | 16 | 2.4% |
| Self-Employed (Not Incorporated) | 129 | 19.2% |
| Not-for-profit Organizations | 7 | 1.0% |
| Local Government Employees | 33 | 4.9% |
| State Government Employees | 0 | 0.0% |
| Federal Government Employees | 0 | 0.0% |
| Unpaid Family Workers | 0 | 0.0% |
| Total | 671 | 100.0% |
Employment Status by Age in Berlin
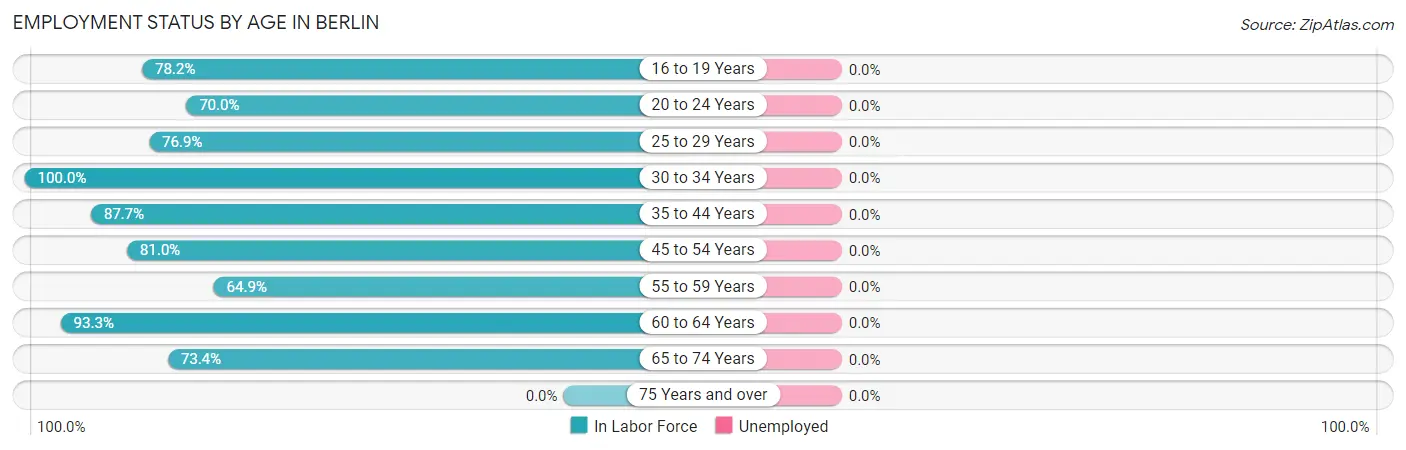
| Age Bracket | In Labor Force | Unemployed |
| 16 to 19 Years | 43 (78.2%) | 0 (0.0%) |
| 20 to 24 Years | 56 (70.0%) | 0 (0.0%) |
| 25 to 29 Years | 93 (76.9%) | 0 (0.0%) |
| 30 to 34 Years | 52 (100.0%) | 0 (0.0%) |
| 35 to 44 Years | 128 (87.7%) | 0 (0.0%) |
| 45 to 54 Years | 81 (81.0%) | 0 (0.0%) |
| 55 to 59 Years | 37 (64.9%) | 0 (0.0%) |
| 60 to 64 Years | 98 (93.3%) | 0 (0.0%) |
| 65 to 74 Years | 91 (73.4%) | 0 (0.0%) |
| 75 Years and over | 0 (0.0%) | 0 (0.0%) |
| Total | 679 (73.2%) | 0 (0.0%) |
Employment Status by Educational Attainment in Berlin
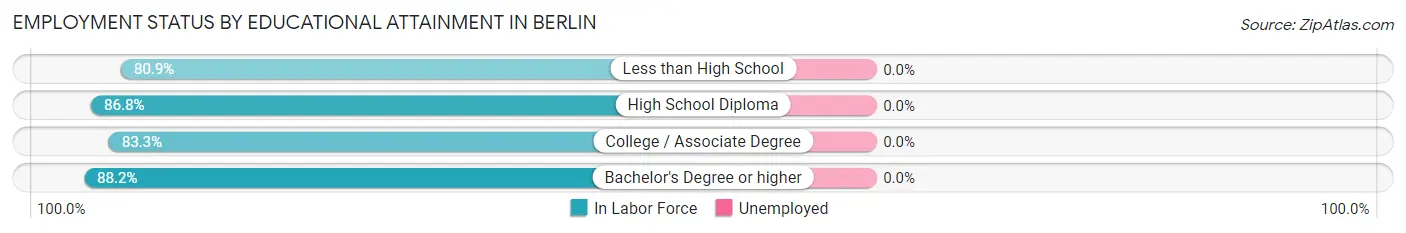
| Educational Attainment | In Labor Force | Unemployed |
| Less than High School | 195 (80.9%) | 0 (0.0%) |
| High School Diploma | 184 (86.8%) | 0 (0.0%) |
| College / Associate Degree | 50 (83.3%) | 0 (0.0%) |
| Bachelor's Degree or higher | 60 (88.2%) | 0 (0.0%) |
| Total | 489 (84.2%) | 0 (0.0%) |
Employment Occupations by Sex in Berlin
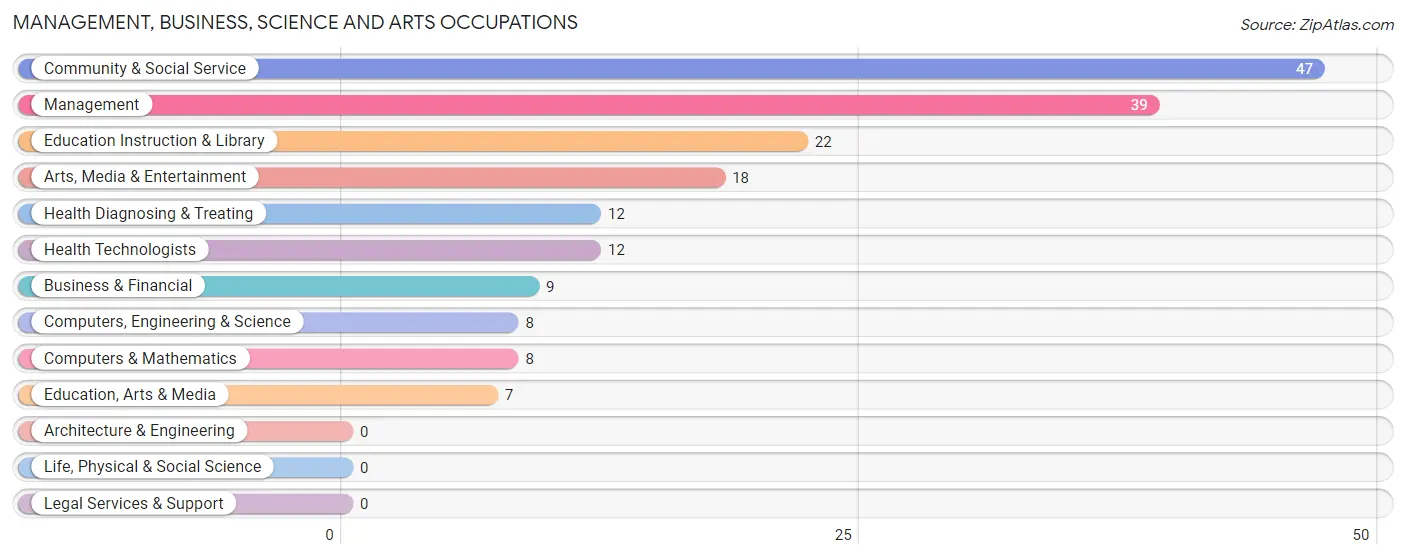
Management, Business, Science and Arts Occupations
The most common Management, Business, Science and Arts occupations in Berlin are Community & Social Service (47 | 6.9%), Management (39 | 5.7%), Education Instruction & Library (22 | 3.2%), Arts, Media & Entertainment (18 | 2.6%), and Health Diagnosing & Treating (12 | 1.8%).
Management, Business, Science and Arts Occupations by Sex
Within the Management, Business, Science and Arts occupations in Berlin, the most male-oriented occupations are Business & Financial (100.0%), Computers, Engineering & Science (100.0%), and Computers & Mathematics (100.0%), while the most female-oriented occupations are Education Instruction & Library (100.0%), Health Diagnosing & Treating (100.0%), and Health Technologists (100.0%).
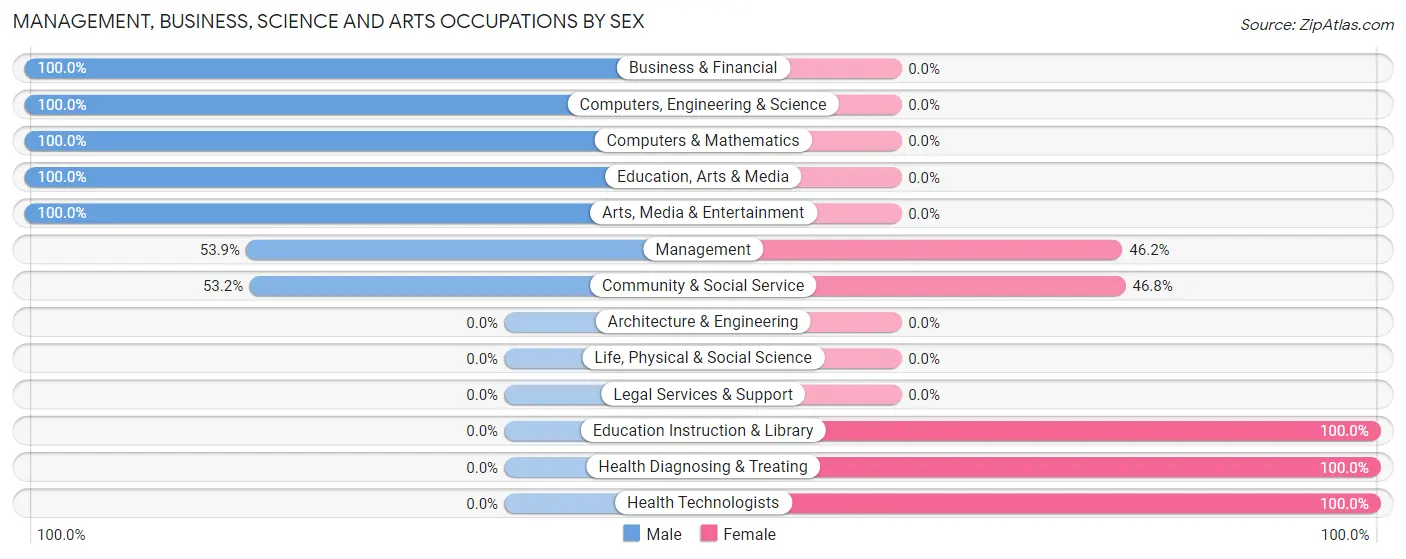
| Occupation | Male | Female |
| Management | 21 (53.8%) | 18 (46.2%) |
| Business & Financial | 9 (100.0%) | 0 (0.0%) |
| Computers, Engineering & Science | 8 (100.0%) | 0 (0.0%) |
| Computers & Mathematics | 8 (100.0%) | 0 (0.0%) |
| Architecture & Engineering | 0 (0.0%) | 0 (0.0%) |
| Life, Physical & Social Science | 0 (0.0%) | 0 (0.0%) |
| Community & Social Service | 25 (53.2%) | 22 (46.8%) |
| Education, Arts & Media | 7 (100.0%) | 0 (0.0%) |
| Legal Services & Support | 0 (0.0%) | 0 (0.0%) |
| Education Instruction & Library | 0 (0.0%) | 22 (100.0%) |
| Arts, Media & Entertainment | 18 (100.0%) | 0 (0.0%) |
| Health Diagnosing & Treating | 0 (0.0%) | 12 (100.0%) |
| Health Technologists | 0 (0.0%) | 12 (100.0%) |
| Total (Category) | 63 (54.8%) | 52 (45.2%) |
| Total (Overall) | 338 (49.8%) | 341 (50.2%) |
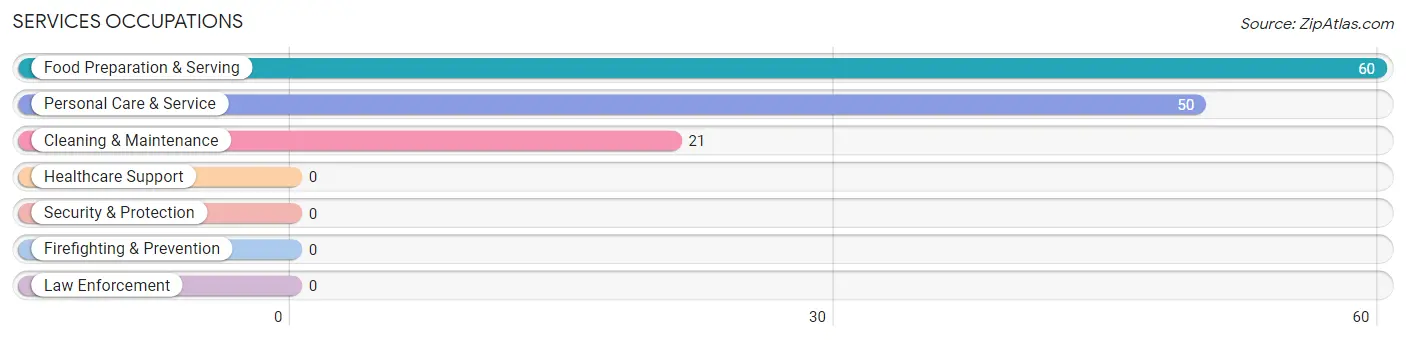
Services Occupations
The most common Services occupations in Berlin are Food Preparation & Serving (60 | 8.8%), Personal Care & Service (50 | 7.4%), and Cleaning & Maintenance (21 | 3.1%).
Services Occupations by Sex
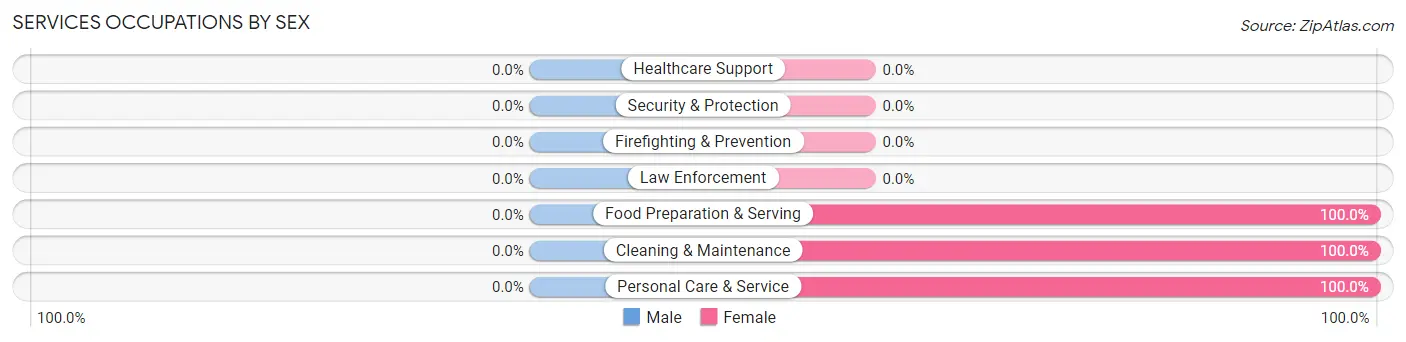
| Occupation | Male | Female |
| Healthcare Support | 0 (0.0%) | 0 (0.0%) |
| Security & Protection | 0 (0.0%) | 0 (0.0%) |
| Firefighting & Prevention | 0 (0.0%) | 0 (0.0%) |
| Law Enforcement | 0 (0.0%) | 0 (0.0%) |
| Food Preparation & Serving | 0 (0.0%) | 60 (100.0%) |
| Cleaning & Maintenance | 0 (0.0%) | 21 (100.0%) |
| Personal Care & Service | 0 (0.0%) | 50 (100.0%) |
| Total (Category) | 0 (0.0%) | 131 (100.0%) |
| Total (Overall) | 338 (49.8%) | 341 (50.2%) |
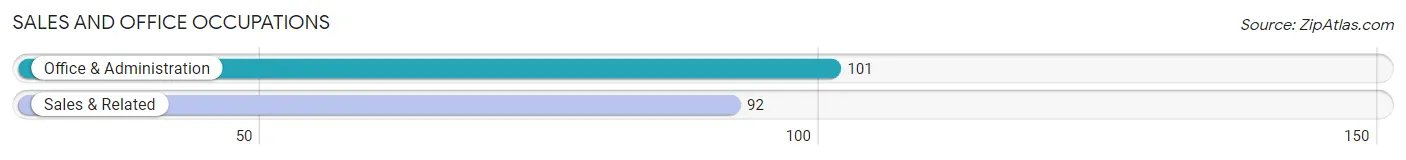
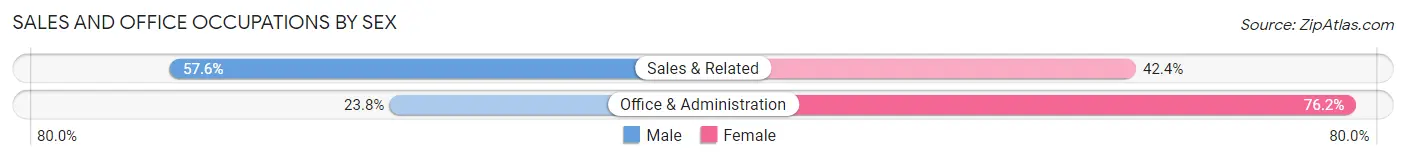
Sales and Office Occupations
The most common Sales and Office occupations in Berlin are Office & Administration (101 | 14.9%), and Sales & Related (92 | 13.6%).
Sales and Office Occupations by Sex
| Occupation | Male | Female |
| Sales & Related | 53 (57.6%) | 39 (42.4%) |
| Office & Administration | 24 (23.8%) | 77 (76.2%) |
| Total (Category) | 77 (39.9%) | 116 (60.1%) |
| Total (Overall) | 338 (49.8%) | 341 (50.2%) |
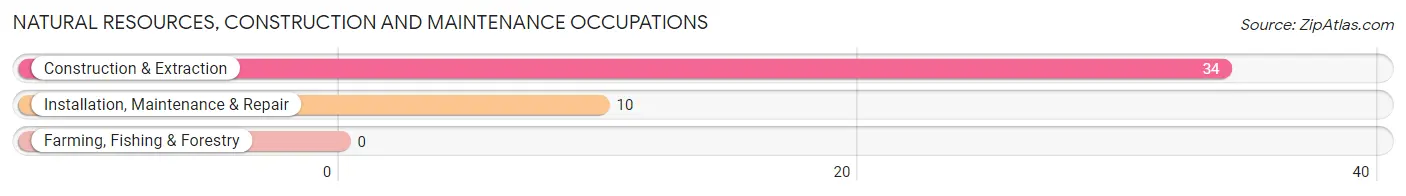
Natural Resources, Construction and Maintenance Occupations
The most common Natural Resources, Construction and Maintenance occupations in Berlin are Construction & Extraction (34 | 5.0%), and Installation, Maintenance & Repair (10 | 1.5%).
Natural Resources, Construction and Maintenance Occupations by Sex
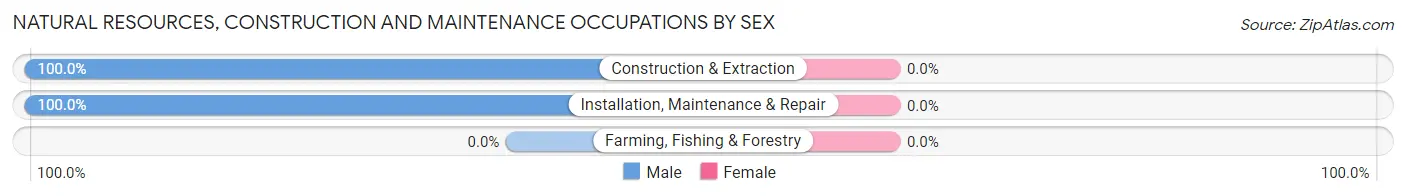
| Occupation | Male | Female |
| Farming, Fishing & Forestry | 0 (0.0%) | 0 (0.0%) |
| Construction & Extraction | 34 (100.0%) | 0 (0.0%) |
| Installation, Maintenance & Repair | 10 (100.0%) | 0 (0.0%) |
| Total (Category) | 44 (100.0%) | 0 (0.0%) |
| Total (Overall) | 338 (49.8%) | 341 (50.2%) |
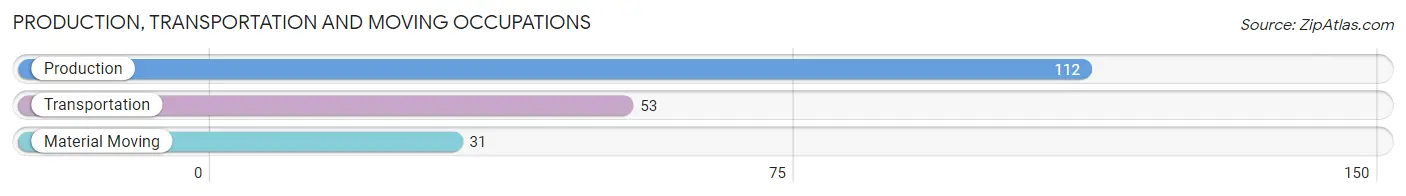
Production, Transportation and Moving Occupations
The most common Production, Transportation and Moving occupations in Berlin are Production (112 | 16.5%), Transportation (53 | 7.8%), and Material Moving (31 | 4.6%).
Production, Transportation and Moving Occupations by Sex
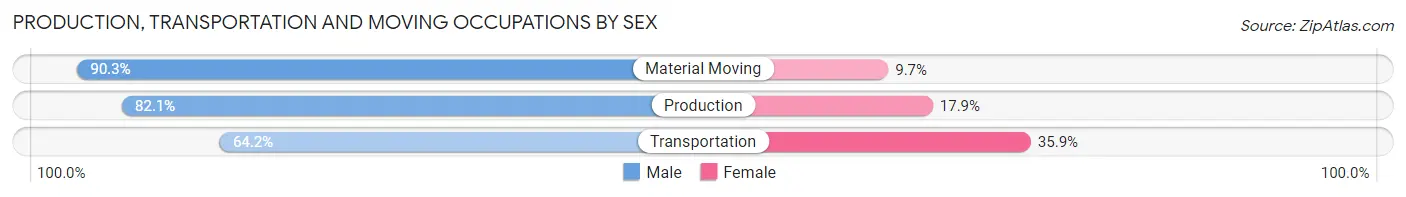
| Occupation | Male | Female |
| Production | 92 (82.1%) | 20 (17.9%) |
| Transportation | 34 (64.1%) | 19 (35.8%) |
| Material Moving | 28 (90.3%) | 3 (9.7%) |
| Total (Category) | 154 (78.6%) | 42 (21.4%) |
| Total (Overall) | 338 (49.8%) | 341 (50.2%) |
Employment Industries by Sex in Berlin
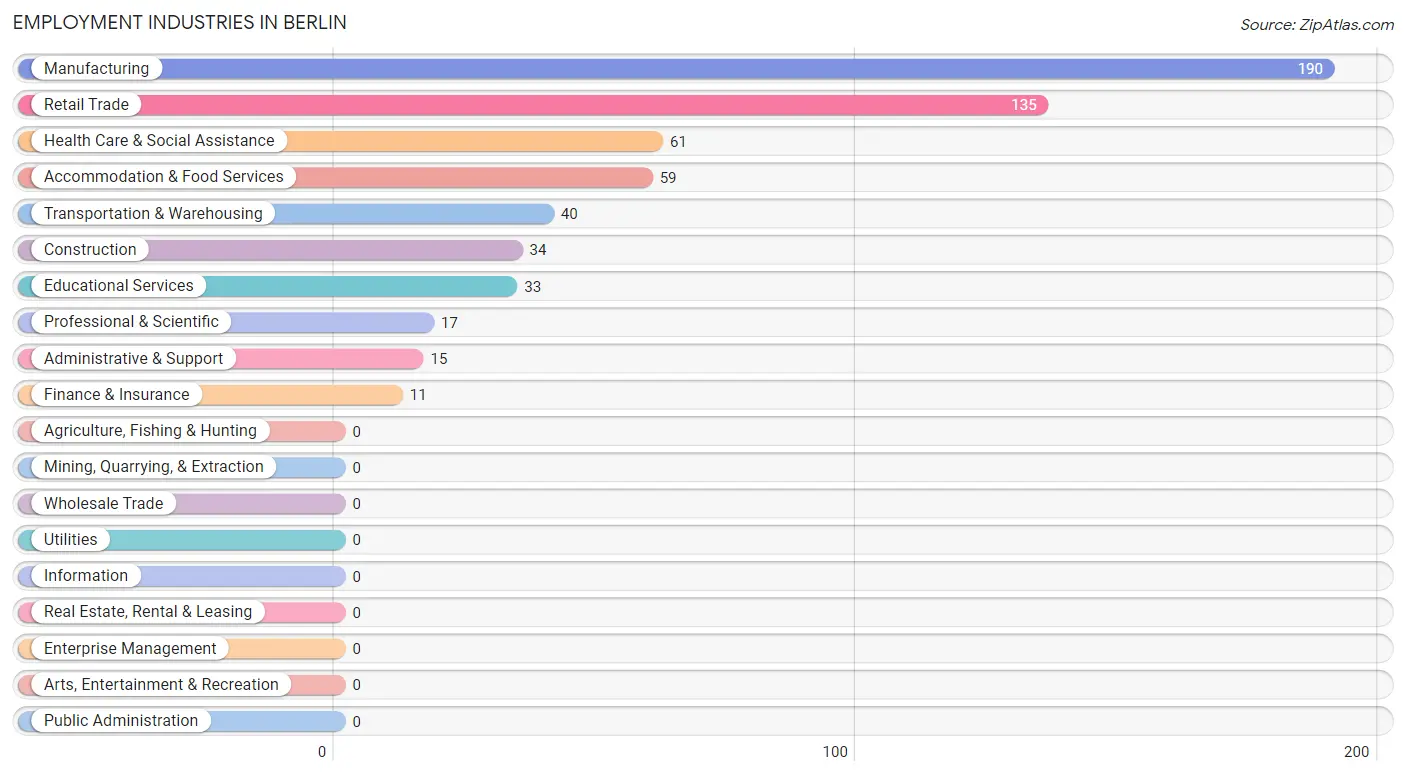
Employment Industries in Berlin
The major employment industries in Berlin include Manufacturing (190 | 28.0%), Retail Trade (135 | 19.9%), Health Care & Social Assistance (61 | 9.0%), Accommodation & Food Services (59 | 8.7%), and Transportation & Warehousing (40 | 5.9%).
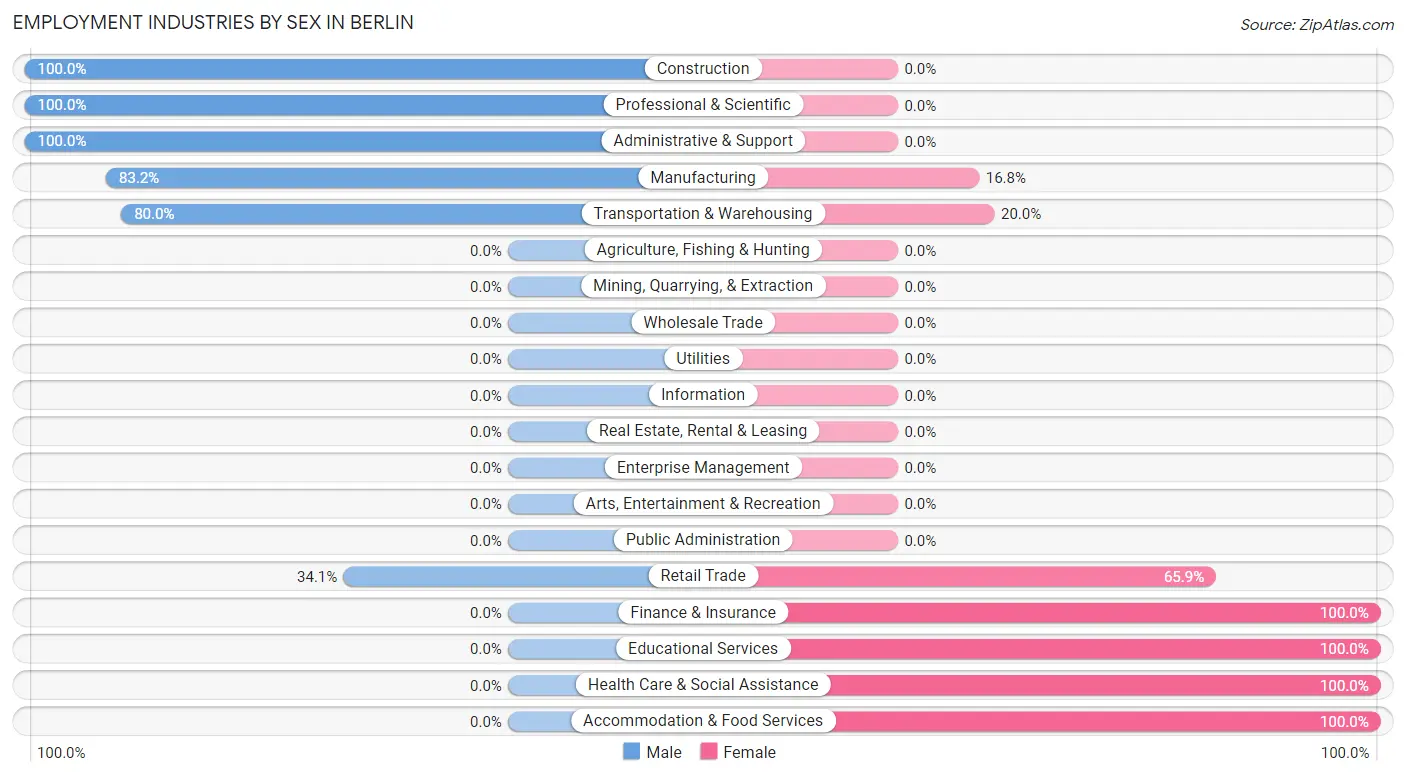
Employment Industries by Sex in Berlin
The Berlin industries that see more men than women are Construction (100.0%), Professional & Scientific (100.0%), and Administrative & Support (100.0%), whereas the industries that tend to have a higher number of women are Finance & Insurance (100.0%), Educational Services (100.0%), and Health Care & Social Assistance (100.0%).
| Industry | Male | Female |
| Agriculture, Fishing & Hunting | 0 (0.0%) | 0 (0.0%) |
| Mining, Quarrying, & Extraction | 0 (0.0%) | 0 (0.0%) |
| Construction | 34 (100.0%) | 0 (0.0%) |
| Manufacturing | 158 (83.2%) | 32 (16.8%) |
| Wholesale Trade | 0 (0.0%) | 0 (0.0%) |
| Retail Trade | 46 (34.1%) | 89 (65.9%) |
| Transportation & Warehousing | 32 (80.0%) | 8 (20.0%) |
| Utilities | 0 (0.0%) | 0 (0.0%) |
| Information | 0 (0.0%) | 0 (0.0%) |
| Finance & Insurance | 0 (0.0%) | 11 (100.0%) |
| Real Estate, Rental & Leasing | 0 (0.0%) | 0 (0.0%) |
| Professional & Scientific | 17 (100.0%) | 0 (0.0%) |
| Enterprise Management | 0 (0.0%) | 0 (0.0%) |
| Administrative & Support | 15 (100.0%) | 0 (0.0%) |
| Educational Services | 0 (0.0%) | 33 (100.0%) |
| Health Care & Social Assistance | 0 (0.0%) | 61 (100.0%) |
| Arts, Entertainment & Recreation | 0 (0.0%) | 0 (0.0%) |
| Accommodation & Food Services | 0 (0.0%) | 59 (100.0%) |
| Public Administration | 0 (0.0%) | 0 (0.0%) |
| Total | 338 (49.8%) | 341 (50.2%) |
Education in Berlin
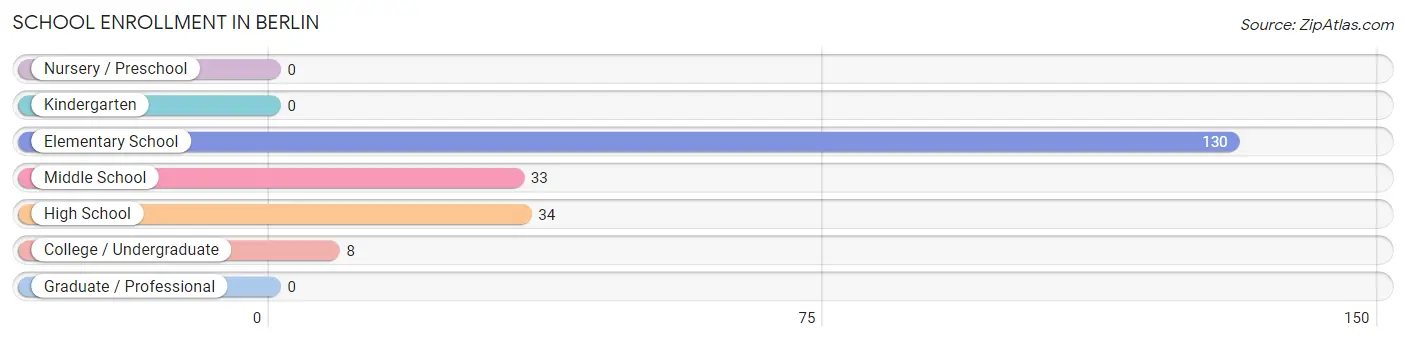
School Enrollment in Berlin
The most common levels of schooling among the 205 students in Berlin are elementary school (130 | 63.4%), high school (34 | 16.6%), and middle school (33 | 16.1%).
| School Level | # Students | % Students |
| Nursery / Preschool | 0 | 0.0% |
| Kindergarten | 0 | 0.0% |
| Elementary School | 130 | 63.4% |
| Middle School | 33 | 16.1% |
| High School | 34 | 16.6% |
| College / Undergraduate | 8 | 3.9% |
| Graduate / Professional | 0 | 0.0% |
| Total | 205 | 100.0% |
School Enrollment by Age by Funding Source in Berlin
Out of a total of 205 students who are enrolled in schools in Berlin, 64 (31.2%) attend a private institution, while the remaining 141 (68.8%) are enrolled in public schools. The age group of 20 to 24 year olds has the highest likelihood of being enrolled in private schools, with 8 (100.0% in the age bracket) enrolled. Conversely, the age group of 5 to 9 year old has the lowest likelihood of being enrolled in a private school, with 94 (82.5% in the age bracket) attending a public institution.
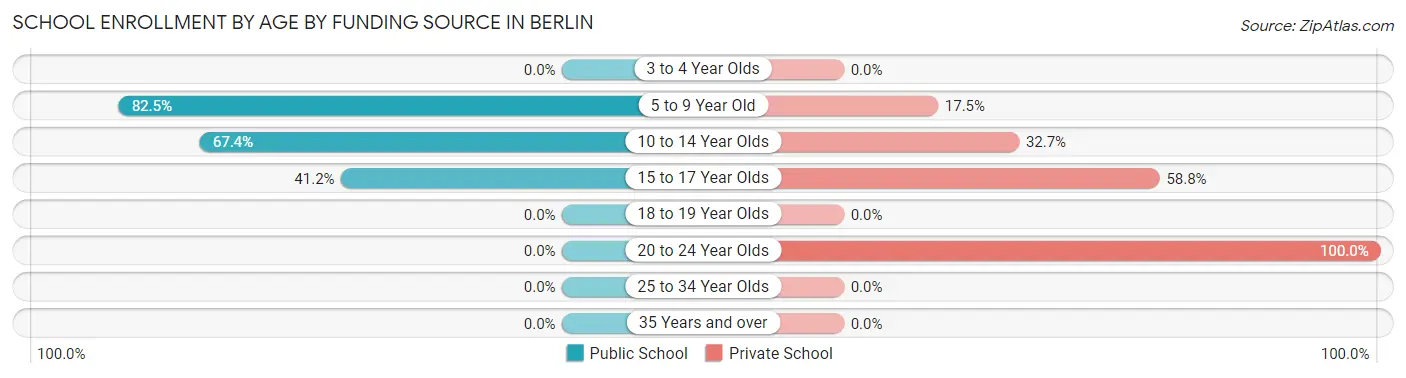
| Age Bracket | Public School | Private School |
| 3 to 4 Year Olds | 0 (0.0%) | 0 (0.0%) |
| 5 to 9 Year Old | 94 (82.5%) | 20 (17.5%) |
| 10 to 14 Year Olds | 33 (67.3%) | 16 (32.7%) |
| 15 to 17 Year Olds | 14 (41.2%) | 20 (58.8%) |
| 18 to 19 Year Olds | 0 (0.0%) | 0 (0.0%) |
| 20 to 24 Year Olds | 0 (0.0%) | 8 (100.0%) |
| 25 to 34 Year Olds | 0 (0.0%) | 0 (0.0%) |
| 35 Years and over | 0 (0.0%) | 0 (0.0%) |
| Total | 141 (68.8%) | 64 (31.2%) |
Educational Attainment by Field of Study in Berlin
Education (43 | 43.4%), science & technology (12 | 12.1%), bio, nature & agricultural (10 | 10.1%), business (9 | 9.1%), and communications (9 | 9.1%) are the most common fields of study among 99 individuals in Berlin who have obtained a bachelor's degree or higher.
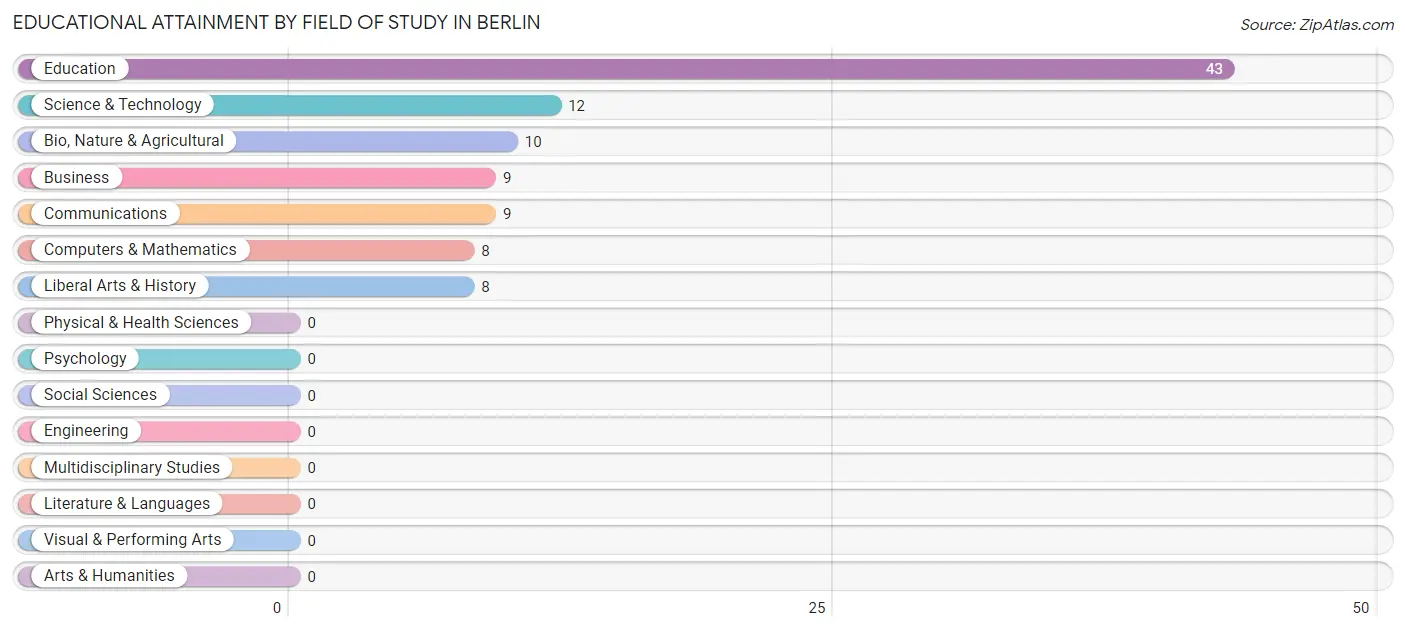
| Field of Study | # Graduates | % Graduates |
| Computers & Mathematics | 8 | 8.1% |
| Bio, Nature & Agricultural | 10 | 10.1% |
| Physical & Health Sciences | 0 | 0.0% |
| Psychology | 0 | 0.0% |
| Social Sciences | 0 | 0.0% |
| Engineering | 0 | 0.0% |
| Multidisciplinary Studies | 0 | 0.0% |
| Science & Technology | 12 | 12.1% |
| Business | 9 | 9.1% |
| Education | 43 | 43.4% |
| Literature & Languages | 0 | 0.0% |
| Liberal Arts & History | 8 | 8.1% |
| Visual & Performing Arts | 0 | 0.0% |
| Communications | 9 | 9.1% |
| Arts & Humanities | 0 | 0.0% |
| Total | 99 | 100.0% |
Transportation & Commute in Berlin
Vehicle Availability by Sex in Berlin
The most prevalent vehicle ownership categories in Berlin are males with 2 vehicles (171, accounting for 50.6%) and females with 2 vehicles (165, making up 51.3%).
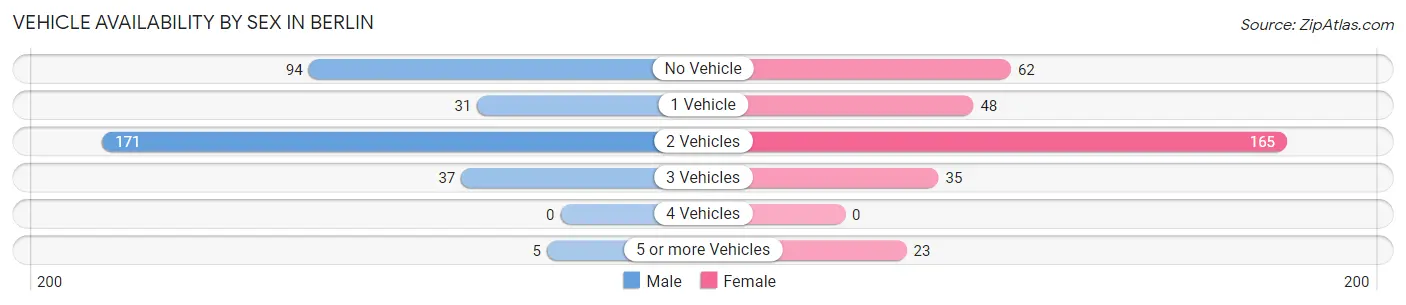
| Vehicles Available | Male | Female |
| No Vehicle | 94 (27.8%) | 62 (18.6%) |
| 1 Vehicle | 31 (9.2%) | 48 (14.4%) |
| 2 Vehicles | 171 (50.6%) | 165 (49.5%) |
| 3 Vehicles | 37 (11.0%) | 35 (10.5%) |
| 4 Vehicles | 0 (0.0%) | 0 (0.0%) |
| 5 or more Vehicles | 5 (1.5%) | 23 (6.9%) |
| Total | 338 (100.0%) | 333 (100.0%) |
Commute Time in Berlin
The most frequently occuring commute durations in Berlin are less than 5 minutes (163 commuters, 25.7%), 5 to 9 minutes (160 commuters, 25.2%), and 10 to 14 minutes (155 commuters, 24.4%).
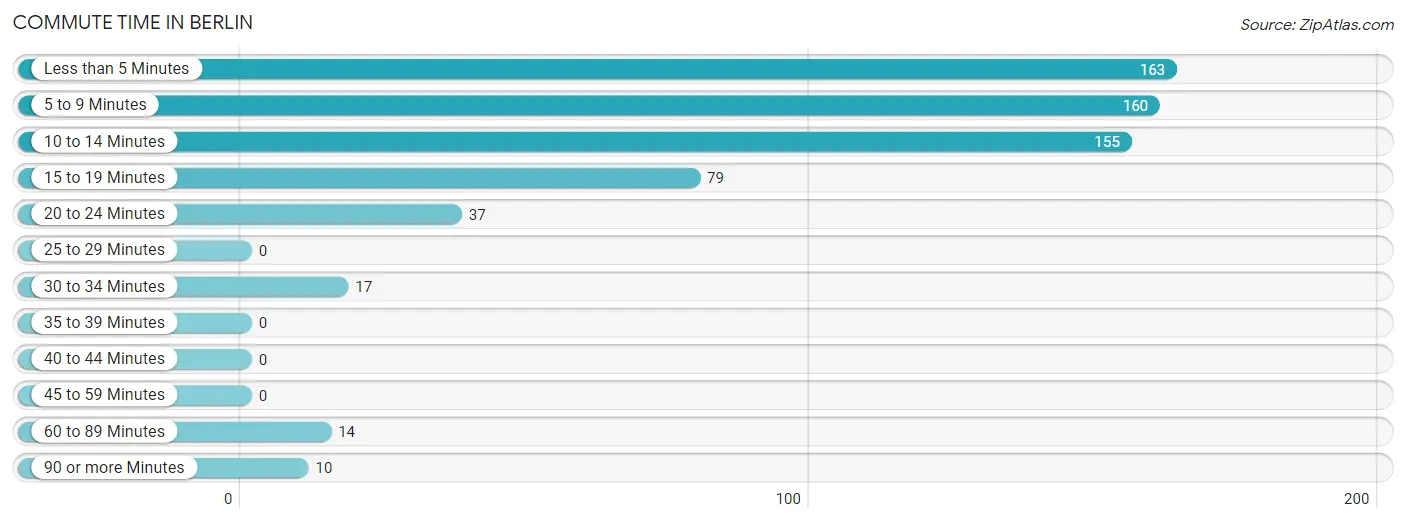
| Commute Time | # Commuters | % Commuters |
| Less than 5 Minutes | 163 | 25.7% |
| 5 to 9 Minutes | 160 | 25.2% |
| 10 to 14 Minutes | 155 | 24.4% |
| 15 to 19 Minutes | 79 | 12.4% |
| 20 to 24 Minutes | 37 | 5.8% |
| 25 to 29 Minutes | 0 | 0.0% |
| 30 to 34 Minutes | 17 | 2.7% |
| 35 to 39 Minutes | 0 | 0.0% |
| 40 to 44 Minutes | 0 | 0.0% |
| 45 to 59 Minutes | 0 | 0.0% |
| 60 to 89 Minutes | 14 | 2.2% |
| 90 or more Minutes | 10 | 1.6% |
Commute Time by Sex in Berlin
The most common commute times in Berlin are 10 to 14 minutes (100 commuters, 33.1%) for males and less than 5 minutes (137 commuters, 41.1%) for females.
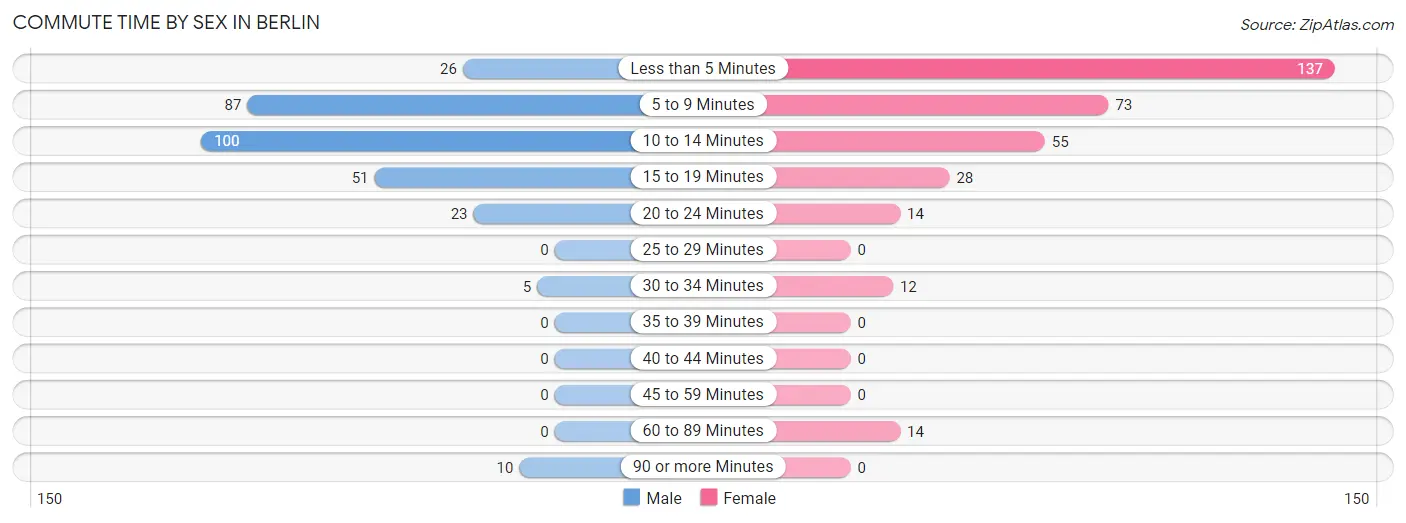
| Commute Time | Male | Female |
| Less than 5 Minutes | 26 (8.6%) | 137 (41.1%) |
| 5 to 9 Minutes | 87 (28.8%) | 73 (21.9%) |
| 10 to 14 Minutes | 100 (33.1%) | 55 (16.5%) |
| 15 to 19 Minutes | 51 (16.9%) | 28 (8.4%) |
| 20 to 24 Minutes | 23 (7.6%) | 14 (4.2%) |
| 25 to 29 Minutes | 0 (0.0%) | 0 (0.0%) |
| 30 to 34 Minutes | 5 (1.7%) | 12 (3.6%) |
| 35 to 39 Minutes | 0 (0.0%) | 0 (0.0%) |
| 40 to 44 Minutes | 0 (0.0%) | 0 (0.0%) |
| 45 to 59 Minutes | 0 (0.0%) | 0 (0.0%) |
| 60 to 89 Minutes | 0 (0.0%) | 14 (4.2%) |
| 90 or more Minutes | 10 (3.3%) | 0 (0.0%) |
Time of Departure to Work by Sex in Berlin
The most frequent times of departure to work in Berlin are 5:30 AM to 5:59 AM (81, 26.8%) for males and 9:00 AM to 9:59 AM (76, 22.8%) for females.
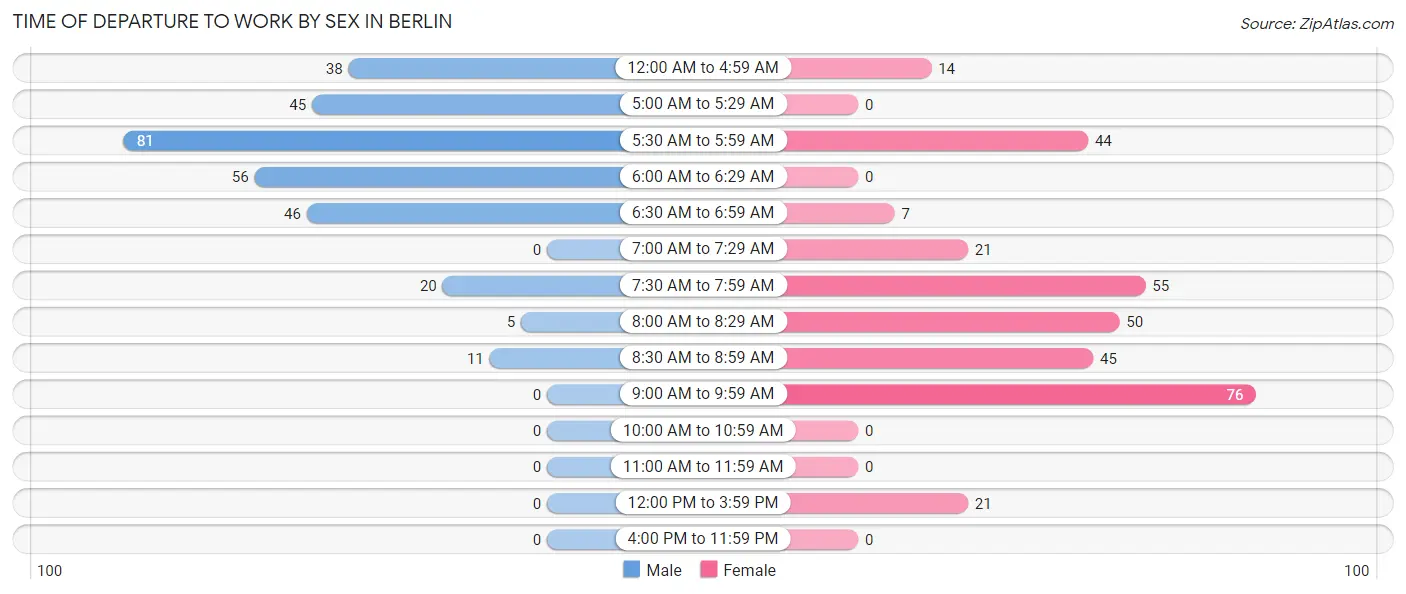
| Time of Departure | Male | Female |
| 12:00 AM to 4:59 AM | 38 (12.6%) | 14 (4.2%) |
| 5:00 AM to 5:29 AM | 45 (14.9%) | 0 (0.0%) |
| 5:30 AM to 5:59 AM | 81 (26.8%) | 44 (13.2%) |
| 6:00 AM to 6:29 AM | 56 (18.5%) | 0 (0.0%) |
| 6:30 AM to 6:59 AM | 46 (15.2%) | 7 (2.1%) |
| 7:00 AM to 7:29 AM | 0 (0.0%) | 21 (6.3%) |
| 7:30 AM to 7:59 AM | 20 (6.6%) | 55 (16.5%) |
| 8:00 AM to 8:29 AM | 5 (1.7%) | 50 (15.0%) |
| 8:30 AM to 8:59 AM | 11 (3.6%) | 45 (13.5%) |
| 9:00 AM to 9:59 AM | 0 (0.0%) | 76 (22.8%) |
| 10:00 AM to 10:59 AM | 0 (0.0%) | 0 (0.0%) |
| 11:00 AM to 11:59 AM | 0 (0.0%) | 0 (0.0%) |
| 12:00 PM to 3:59 PM | 0 (0.0%) | 21 (6.3%) |
| 4:00 PM to 11:59 PM | 0 (0.0%) | 0 (0.0%) |
| Total | 302 (100.0%) | 333 (100.0%) |
Housing Occupancy in Berlin
Occupancy by Ownership in Berlin
Of the total 414 dwellings in Berlin, owner-occupied units account for 298 (72.0%), while renter-occupied units make up 116 (28.0%).
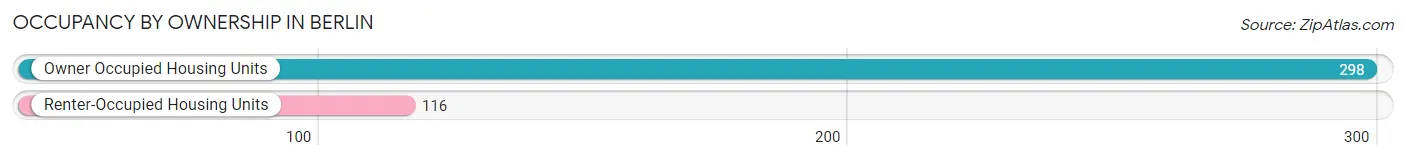
| Occupancy | # Housing Units | % Housing Units |
| Owner Occupied Housing Units | 298 | 72.0% |
| Renter-Occupied Housing Units | 116 | 28.0% |
| Total Occupied Housing Units | 414 | 100.0% |
Occupancy by Household Size in Berlin
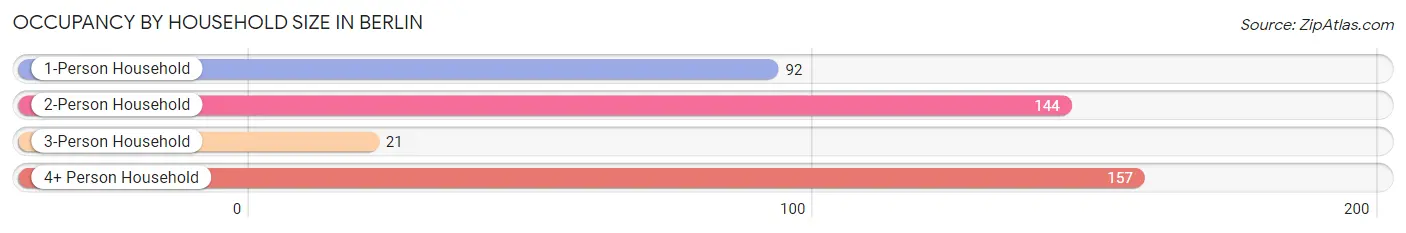
| Household Size | # Housing Units | % Housing Units |
| 1-Person Household | 92 | 22.2% |
| 2-Person Household | 144 | 34.8% |
| 3-Person Household | 21 | 5.1% |
| 4+ Person Household | 157 | 37.9% |
| Total Housing Units | 414 | 100.0% |
Occupancy by Ownership by Household Size in Berlin
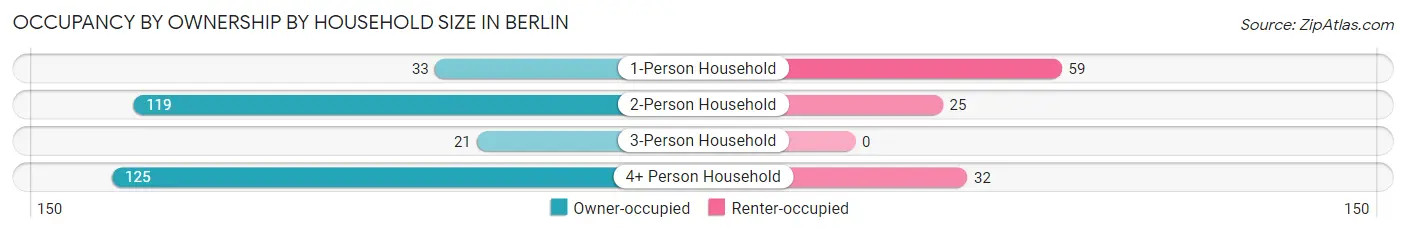
| Household Size | Owner-occupied | Renter-occupied |
| 1-Person Household | 33 (35.9%) | 59 (64.1%) |
| 2-Person Household | 119 (82.6%) | 25 (17.4%) |
| 3-Person Household | 21 (100.0%) | 0 (0.0%) |
| 4+ Person Household | 125 (79.6%) | 32 (20.4%) |
| Total Housing Units | 298 (72.0%) | 116 (28.0%) |
Occupancy by Educational Attainment in Berlin
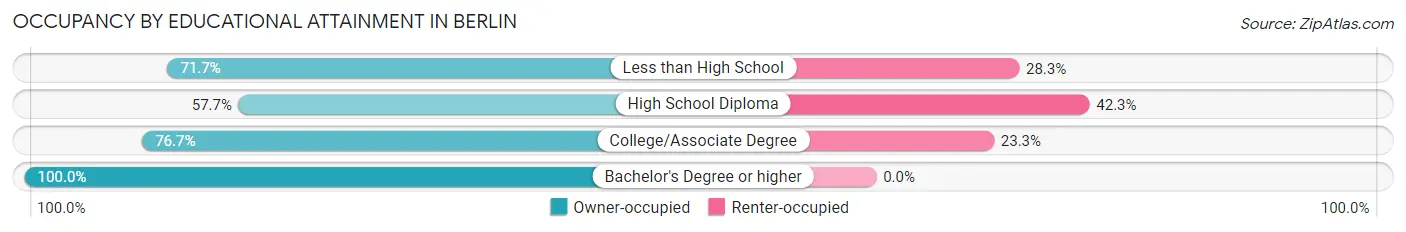
| Household Size | Owner-occupied | Renter-occupied |
| Less than High School | 172 (71.7%) | 68 (28.3%) |
| High School Diploma | 56 (57.7%) | 41 (42.3%) |
| College/Associate Degree | 23 (76.7%) | 7 (23.3%) |
| Bachelor's Degree or higher | 47 (100.0%) | 0 (0.0%) |
Occupancy by Age of Householder in Berlin
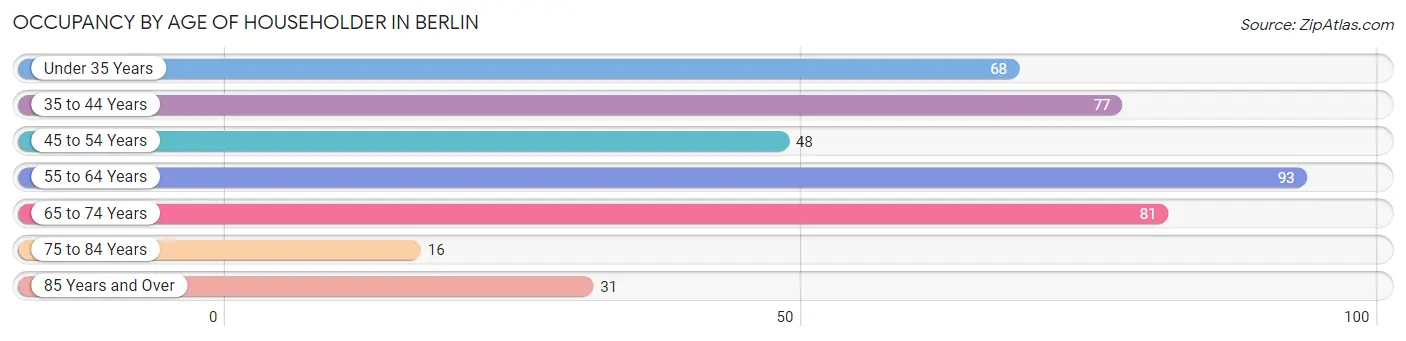
| Age Bracket | # Households | % Households |
| Under 35 Years | 68 | 16.4% |
| 35 to 44 Years | 77 | 18.6% |
| 45 to 54 Years | 48 | 11.6% |
| 55 to 64 Years | 93 | 22.5% |
| 65 to 74 Years | 81 | 19.6% |
| 75 to 84 Years | 16 | 3.9% |
| 85 Years and Over | 31 | 7.5% |
| Total | 414 | 100.0% |
Housing Finances in Berlin
Median Income by Occupancy in Berlin
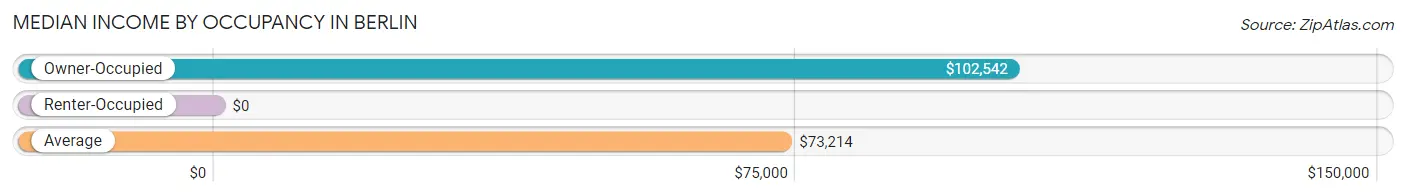
| Occupancy Type | # Households | Median Income |
| Owner-Occupied | 298 (72.0%) | $102,542 |
| Renter-Occupied | 116 (28.0%) | $0 |
| Average | 414 (100.0%) | $73,214 |
Occupancy by Householder Income Bracket in Berlin
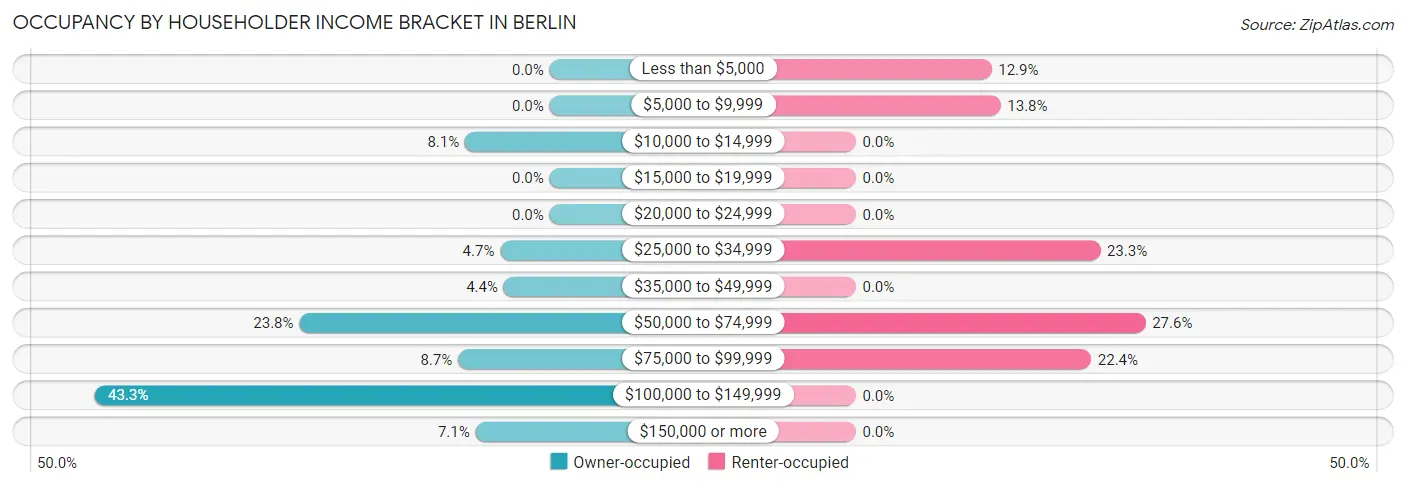
| Income Bracket | Owner-occupied | Renter-occupied |
| Less than $5,000 | 0 (0.0%) | 15 (12.9%) |
| $5,000 to $9,999 | 0 (0.0%) | 16 (13.8%) |
| $10,000 to $14,999 | 24 (8.1%) | 0 (0.0%) |
| $15,000 to $19,999 | 0 (0.0%) | 0 (0.0%) |
| $20,000 to $24,999 | 0 (0.0%) | 0 (0.0%) |
| $25,000 to $34,999 | 14 (4.7%) | 27 (23.3%) |
| $35,000 to $49,999 | 13 (4.4%) | 0 (0.0%) |
| $50,000 to $74,999 | 71 (23.8%) | 32 (27.6%) |
| $75,000 to $99,999 | 26 (8.7%) | 26 (22.4%) |
| $100,000 to $149,999 | 129 (43.3%) | 0 (0.0%) |
| $150,000 or more | 21 (7.0%) | 0 (0.0%) |
| Total | 298 (100.0%) | 116 (100.0%) |
Monthly Housing Cost Tiers in Berlin
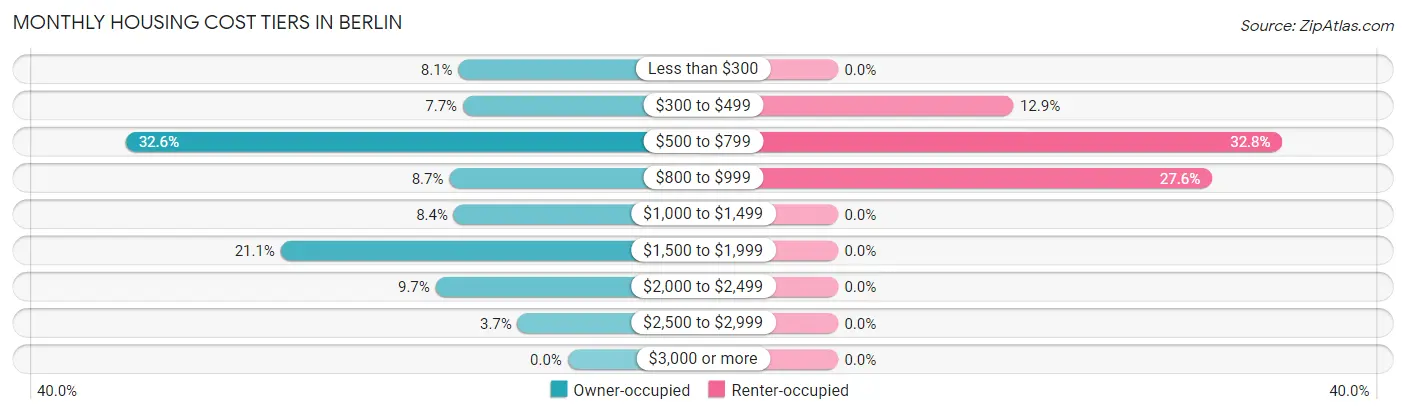
| Monthly Cost | Owner-occupied | Renter-occupied |
| Less than $300 | 24 (8.1%) | 0 (0.0%) |
| $300 to $499 | 23 (7.7%) | 15 (12.9%) |
| $500 to $799 | 97 (32.6%) | 38 (32.8%) |
| $800 to $999 | 26 (8.7%) | 32 (27.6%) |
| $1,000 to $1,499 | 25 (8.4%) | 0 (0.0%) |
| $1,500 to $1,999 | 63 (21.1%) | 0 (0.0%) |
| $2,000 to $2,499 | 29 (9.7%) | 0 (0.0%) |
| $2,500 to $2,999 | 11 (3.7%) | 0 (0.0%) |
| $3,000 or more | 0 (0.0%) | 0 (0.0%) |
| Total | 298 (100.0%) | 116 (100.0%) |
Physical Housing Characteristics in Berlin
Housing Structures in Berlin
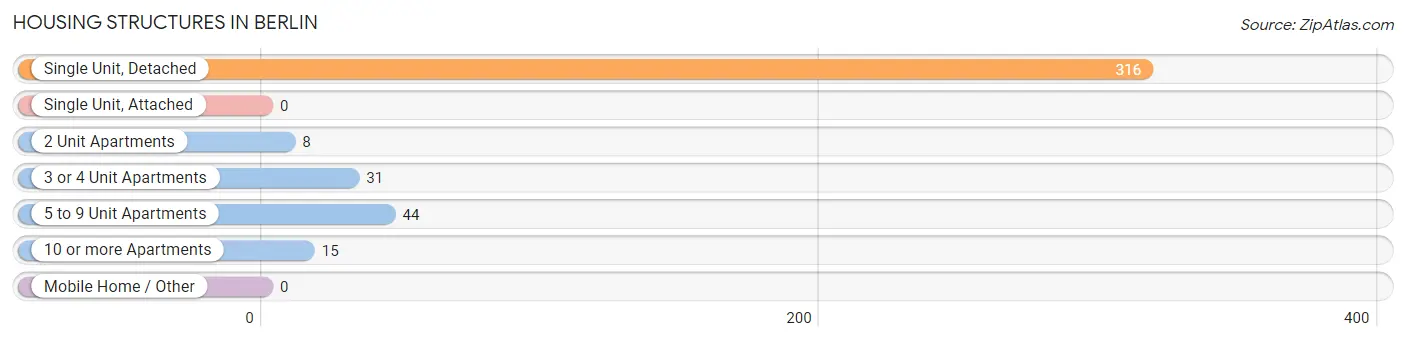
| Structure Type | # Housing Units | % Housing Units |
| Single Unit, Detached | 316 | 76.3% |
| Single Unit, Attached | 0 | 0.0% |
| 2 Unit Apartments | 8 | 1.9% |
| 3 or 4 Unit Apartments | 31 | 7.5% |
| 5 to 9 Unit Apartments | 44 | 10.6% |
| 10 or more Apartments | 15 | 3.6% |
| Mobile Home / Other | 0 | 0.0% |
| Total | 414 | 100.0% |
Housing Structures by Occupancy in Berlin
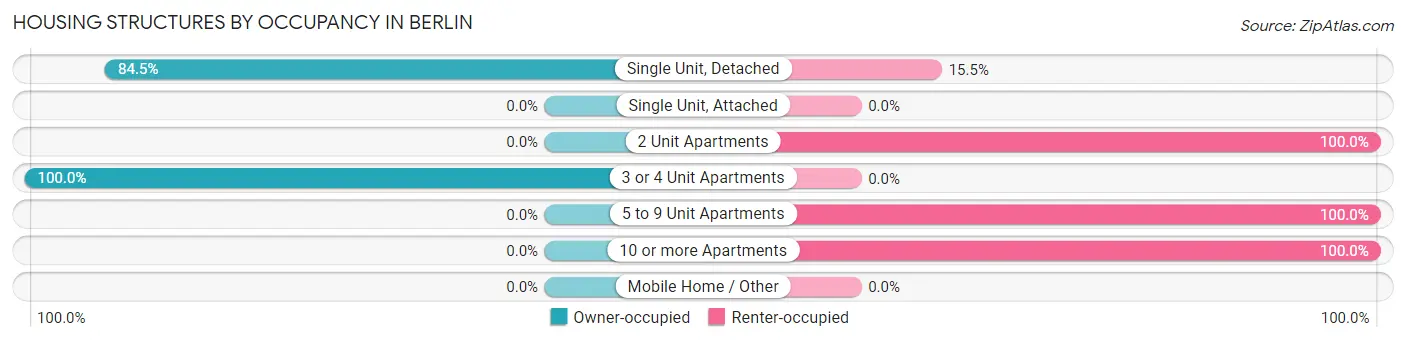
| Structure Type | Owner-occupied | Renter-occupied |
| Single Unit, Detached | 267 (84.5%) | 49 (15.5%) |
| Single Unit, Attached | 0 (0.0%) | 0 (0.0%) |
| 2 Unit Apartments | 0 (0.0%) | 8 (100.0%) |
| 3 or 4 Unit Apartments | 31 (100.0%) | 0 (0.0%) |
| 5 to 9 Unit Apartments | 0 (0.0%) | 44 (100.0%) |
| 10 or more Apartments | 0 (0.0%) | 15 (100.0%) |
| Mobile Home / Other | 0 (0.0%) | 0 (0.0%) |
| Total | 298 (72.0%) | 116 (28.0%) |
Housing Structures by Number of Rooms in Berlin
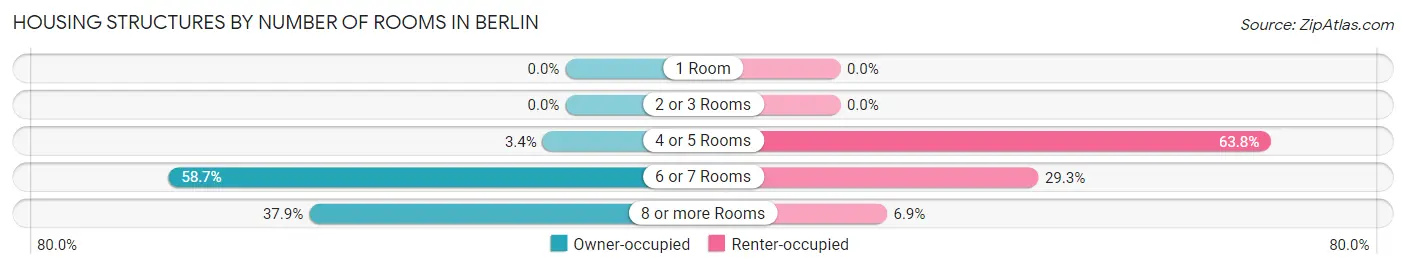
| Number of Rooms | Owner-occupied | Renter-occupied |
| 1 Room | 0 (0.0%) | 0 (0.0%) |
| 2 or 3 Rooms | 0 (0.0%) | 0 (0.0%) |
| 4 or 5 Rooms | 10 (3.4%) | 74 (63.8%) |
| 6 or 7 Rooms | 175 (58.7%) | 34 (29.3%) |
| 8 or more Rooms | 113 (37.9%) | 8 (6.9%) |
| Total | 298 (100.0%) | 116 (100.0%) |
Housing Structure by Heating Type in Berlin
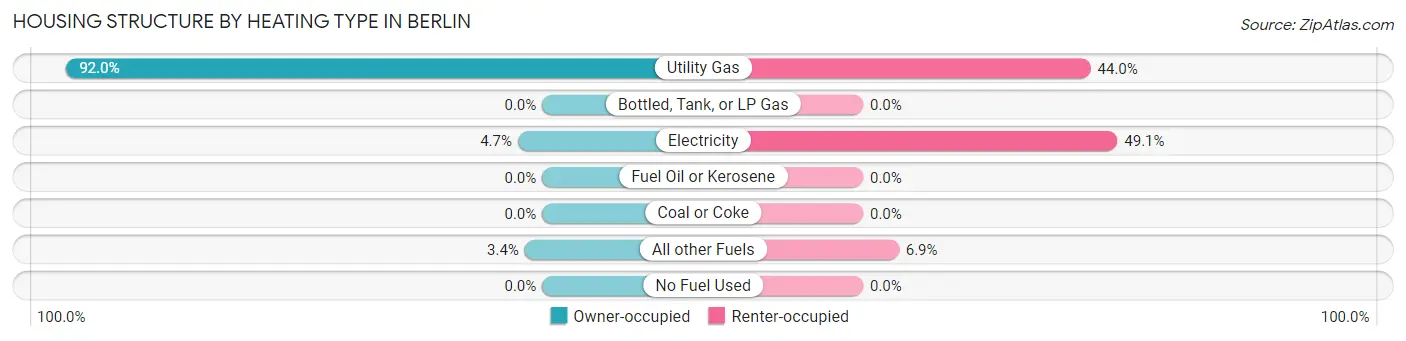
| Heating Type | Owner-occupied | Renter-occupied |
| Utility Gas | 274 (91.9%) | 51 (44.0%) |
| Bottled, Tank, or LP Gas | 0 (0.0%) | 0 (0.0%) |
| Electricity | 14 (4.7%) | 57 (49.1%) |
| Fuel Oil or Kerosene | 0 (0.0%) | 0 (0.0%) |
| Coal or Coke | 0 (0.0%) | 0 (0.0%) |
| All other Fuels | 10 (3.4%) | 8 (6.9%) |
| No Fuel Used | 0 (0.0%) | 0 (0.0%) |
| Total | 298 (100.0%) | 116 (100.0%) |
Household Vehicle Usage in Berlin
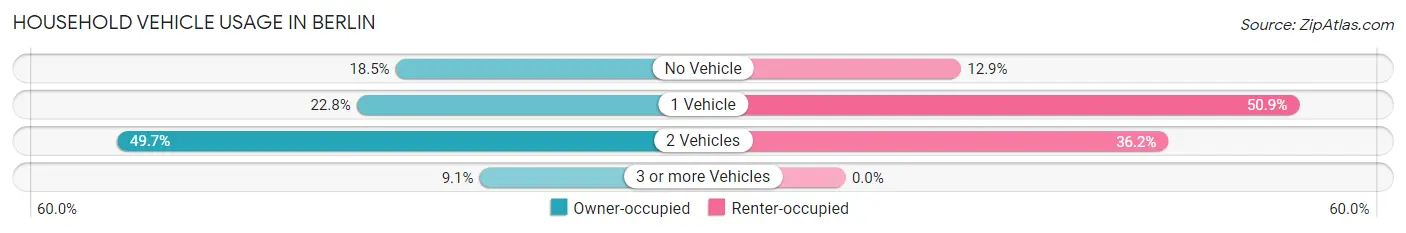
| Vehicles per Household | Owner-occupied | Renter-occupied |
| No Vehicle | 55 (18.5%) | 15 (12.9%) |
| 1 Vehicle | 68 (22.8%) | 59 (50.9%) |
| 2 Vehicles | 148 (49.7%) | 42 (36.2%) |
| 3 or more Vehicles | 27 (9.1%) | 0 (0.0%) |
| Total | 298 (100.0%) | 116 (100.0%) |
Real Estate & Mortgages in Berlin
Real Estate and Mortgage Overview in Berlin
| Characteristic | Without Mortgage | With Mortgage |
| Housing Units | 115 | 183 |
| Median Property Value | $328,800 | $303,400 |
| Median Household Income | $80,125 | $0 |
| Monthly Housing Costs | $532 | $0 |
| Real Estate Taxes | $2,511 | $0 |
Property Value by Mortgage Status in Berlin
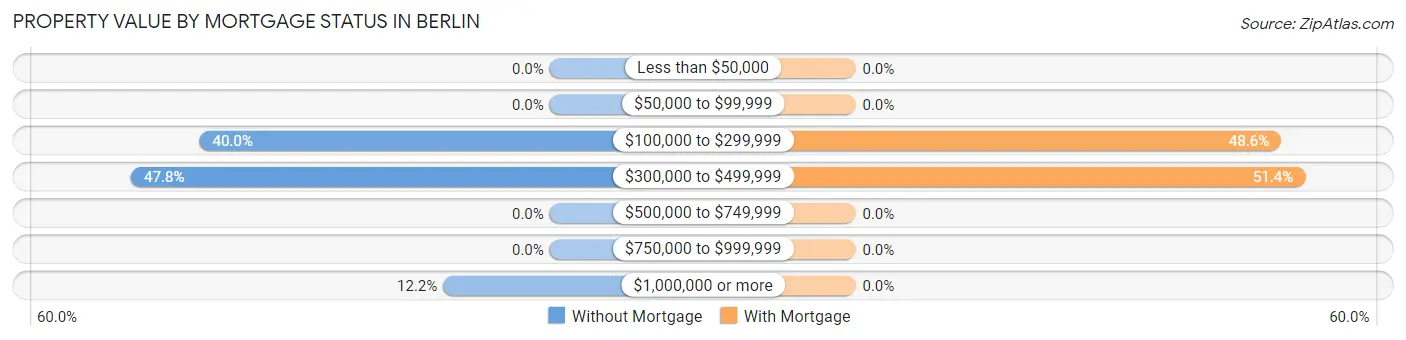
| Property Value | Without Mortgage | With Mortgage |
| Less than $50,000 | 0 (0.0%) | 0 (0.0%) |
| $50,000 to $99,999 | 0 (0.0%) | 0 (0.0%) |
| $100,000 to $299,999 | 46 (40.0%) | 89 (48.6%) |
| $300,000 to $499,999 | 55 (47.8%) | 94 (51.4%) |
| $500,000 to $749,999 | 0 (0.0%) | 0 (0.0%) |
| $750,000 to $999,999 | 0 (0.0%) | 0 (0.0%) |
| $1,000,000 or more | 14 (12.2%) | 0 (0.0%) |
| Total | 115 (100.0%) | 183 (100.0%) |
Household Income by Mortgage Status in Berlin
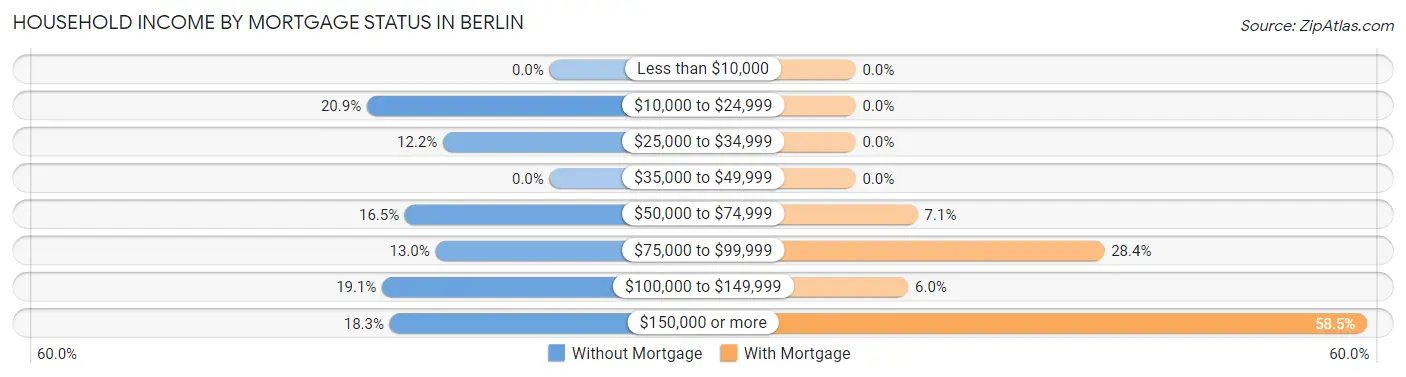
| Household Income | Without Mortgage | With Mortgage |
| Less than $10,000 | 0 (0.0%) | 0 (0.0%) |
| $10,000 to $24,999 | 24 (20.9%) | 0 (0.0%) |
| $25,000 to $34,999 | 14 (12.2%) | 0 (0.0%) |
| $35,000 to $49,999 | 0 (0.0%) | 0 (0.0%) |
| $50,000 to $74,999 | 19 (16.5%) | 13 (7.1%) |
| $75,000 to $99,999 | 15 (13.0%) | 52 (28.4%) |
| $100,000 to $149,999 | 22 (19.1%) | 11 (6.0%) |
| $150,000 or more | 21 (18.3%) | 107 (58.5%) |
| Total | 115 (100.0%) | 183 (100.0%) |
Property Value to Household Income Ratio in Berlin
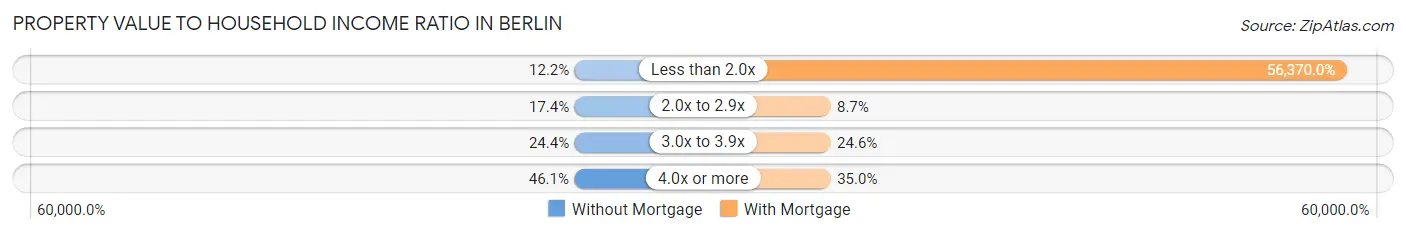
| Value-to-Income Ratio | Without Mortgage | With Mortgage |
| Less than 2.0x | 14 (12.2%) | 103,157 (56,369.9%) |
| 2.0x to 2.9x | 20 (17.4%) | 16 (8.7%) |
| 3.0x to 3.9x | 28 (24.3%) | 45 (24.6%) |
| 4.0x or more | 53 (46.1%) | 64 (35.0%) |
| Total | 115 (100.0%) | 183 (100.0%) |
Real Estate Taxes by Mortgage Status in Berlin
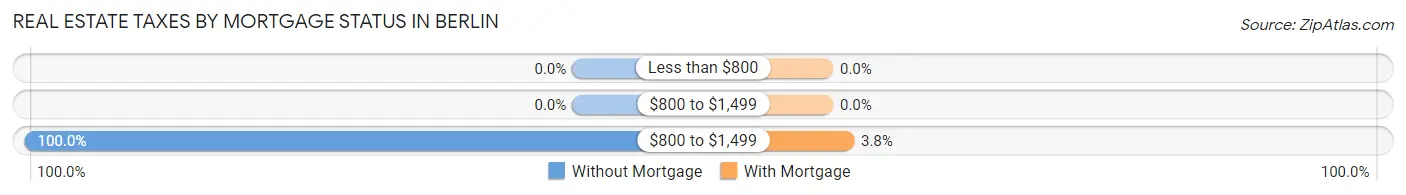
| Property Taxes | Without Mortgage | With Mortgage |
| Less than $800 | 0 (0.0%) | 0 (0.0%) |
| $800 to $1,499 | 0 (0.0%) | 0 (0.0%) |
| $800 to $1,499 | 115 (100.0%) | 7 (3.8%) |
| Total | 115 (100.0%) | 183 (100.0%) |
Health & Disability in Berlin
Health Insurance Coverage by Age in Berlin
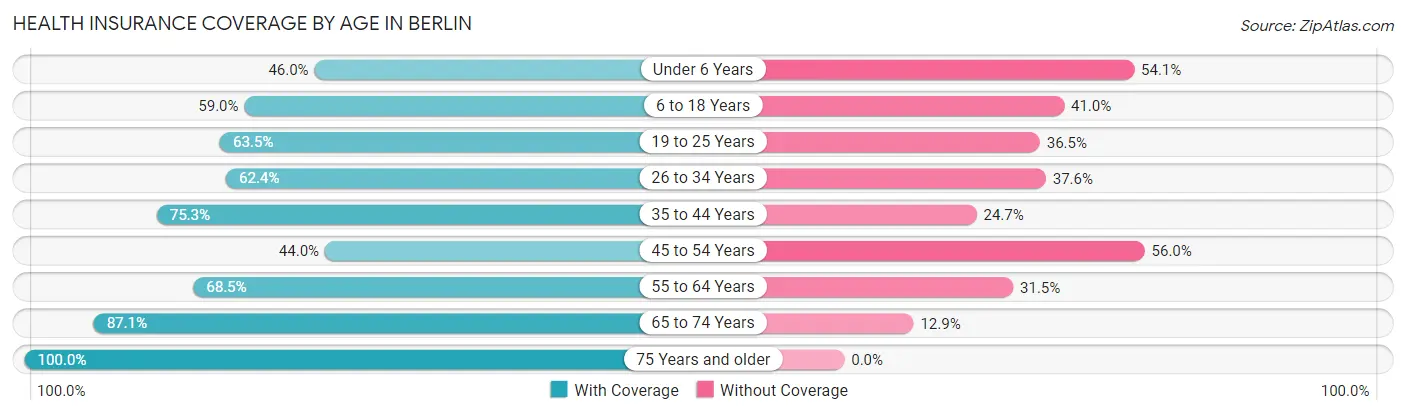
| Age Bracket | With Coverage | Without Coverage |
| Under 6 Years | 34 (46.0%) | 40 (54.0%) |
| 6 to 18 Years | 144 (59.0%) | 100 (41.0%) |
| 19 to 25 Years | 61 (63.5%) | 35 (36.5%) |
| 26 to 34 Years | 108 (62.4%) | 65 (37.6%) |
| 35 to 44 Years | 110 (75.3%) | 36 (24.7%) |
| 45 to 54 Years | 44 (44.0%) | 56 (56.0%) |
| 55 to 64 Years | 111 (68.5%) | 51 (31.5%) |
| 65 to 74 Years | 108 (87.1%) | 16 (12.9%) |
| 75 Years and older | 88 (100.0%) | 0 (0.0%) |
| Total | 808 (66.9%) | 399 (33.1%) |
Health Insurance Coverage by Citizenship Status in Berlin
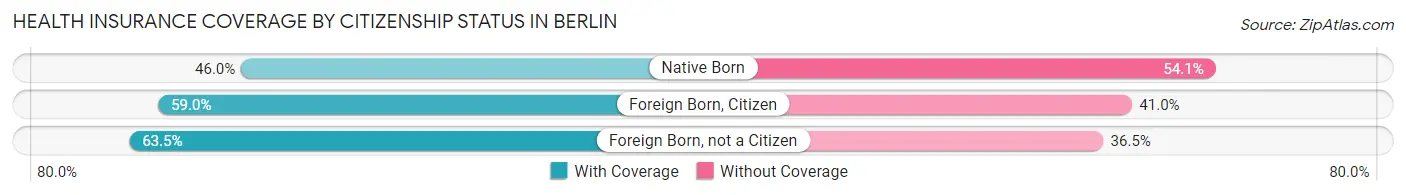
| Citizenship Status | With Coverage | Without Coverage |
| Native Born | 34 (46.0%) | 40 (54.0%) |
| Foreign Born, Citizen | 144 (59.0%) | 100 (41.0%) |
| Foreign Born, not a Citizen | 61 (63.5%) | 35 (36.5%) |
Health Insurance Coverage by Household Income in Berlin
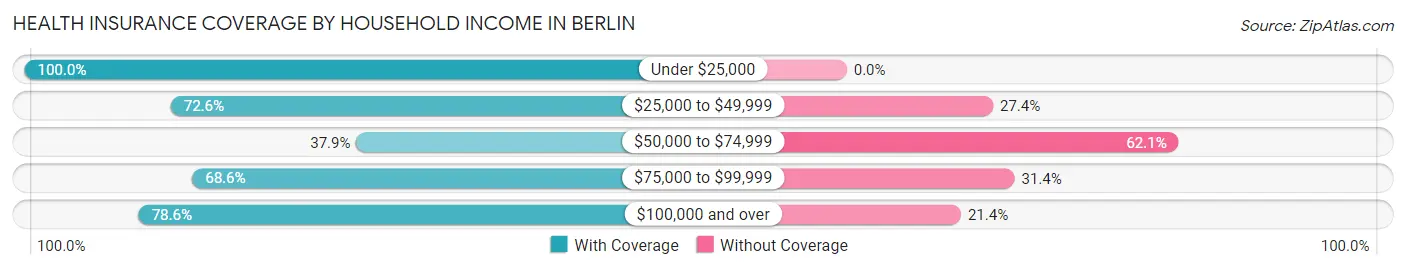
| Household Income | With Coverage | Without Coverage |
| Under $25,000 | 87 (100.0%) | 0 (0.0%) |
| $25,000 to $49,999 | 53 (72.6%) | 20 (27.4%) |
| $50,000 to $74,999 | 131 (37.9%) | 215 (62.1%) |
| $75,000 to $99,999 | 96 (68.6%) | 44 (31.4%) |
| $100,000 and over | 441 (78.6%) | 120 (21.4%) |
Public vs Private Health Insurance Coverage by Age in Berlin
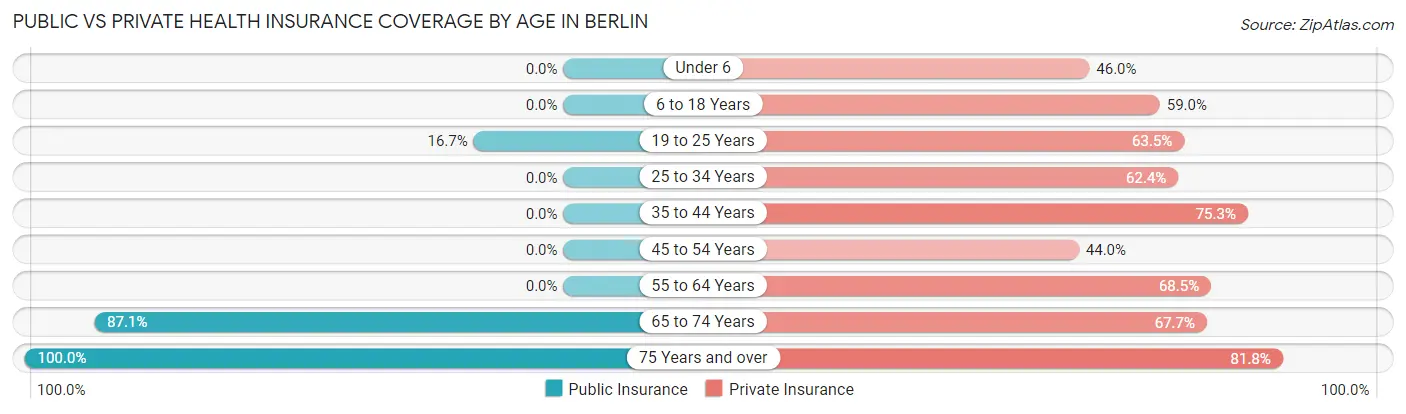
| Age Bracket | Public Insurance | Private Insurance |
| Under 6 | 0 (0.0%) | 34 (46.0%) |
| 6 to 18 Years | 0 (0.0%) | 144 (59.0%) |
| 19 to 25 Years | 16 (16.7%) | 61 (63.5%) |
| 25 to 34 Years | 0 (0.0%) | 108 (62.4%) |
| 35 to 44 Years | 0 (0.0%) | 110 (75.3%) |
| 45 to 54 Years | 0 (0.0%) | 44 (44.0%) |
| 55 to 64 Years | 0 (0.0%) | 111 (68.5%) |
| 65 to 74 Years | 108 (87.1%) | 84 (67.7%) |
| 75 Years and over | 88 (100.0%) | 72 (81.8%) |
| Total | 212 (17.6%) | 768 (63.6%) |
Disability Status by Sex by Age in Berlin
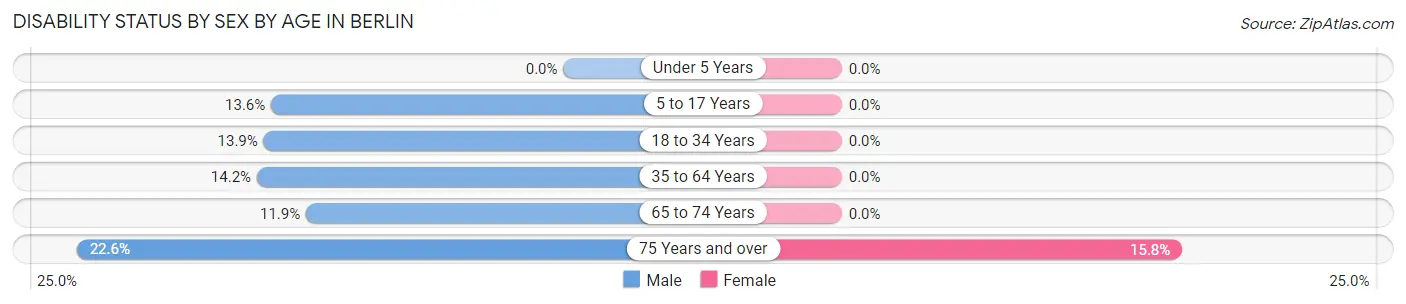
| Age Bracket | Male | Female |
| Under 5 Years | 0 (0.0%) | 0 (0.0%) |
| 5 to 17 Years | 24 (13.6%) | 0 (0.0%) |
| 18 to 34 Years | 16 (13.9%) | 0 (0.0%) |
| 35 to 64 Years | 29 (14.2%) | 0 (0.0%) |
| 65 to 74 Years | 8 (11.9%) | 0 (0.0%) |
| 75 Years and over | 7 (22.6%) | 9 (15.8%) |
Disability Class by Sex by Age in Berlin
Disability Class: Hearing Difficulty
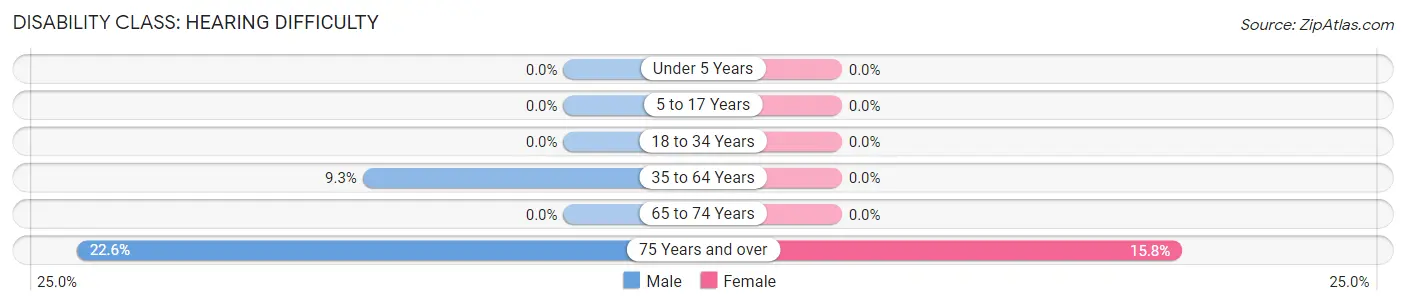
| Age Bracket | Male | Female |
| Under 5 Years | 0 (0.0%) | 0 (0.0%) |
| 5 to 17 Years | 0 (0.0%) | 0 (0.0%) |
| 18 to 34 Years | 0 (0.0%) | 0 (0.0%) |
| 35 to 64 Years | 19 (9.3%) | 0 (0.0%) |
| 65 to 74 Years | 0 (0.0%) | 0 (0.0%) |
| 75 Years and over | 7 (22.6%) | 9 (15.8%) |
Disability Class: Vision Difficulty
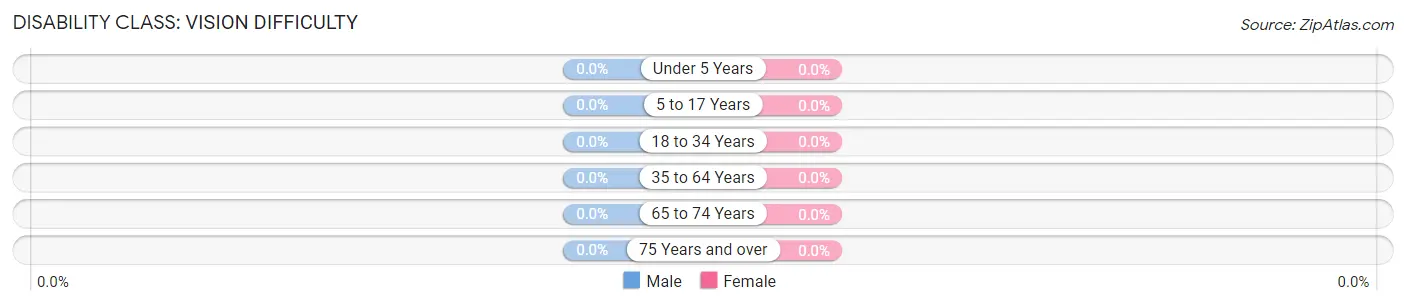
| Age Bracket | Male | Female |
| Under 5 Years | 0 (0.0%) | 0 (0.0%) |
| 5 to 17 Years | 0 (0.0%) | 0 (0.0%) |
| 18 to 34 Years | 0 (0.0%) | 0 (0.0%) |
| 35 to 64 Years | 0 (0.0%) | 0 (0.0%) |
| 65 to 74 Years | 0 (0.0%) | 0 (0.0%) |
| 75 Years and over | 0 (0.0%) | 0 (0.0%) |
Disability Class: Cognitive Difficulty
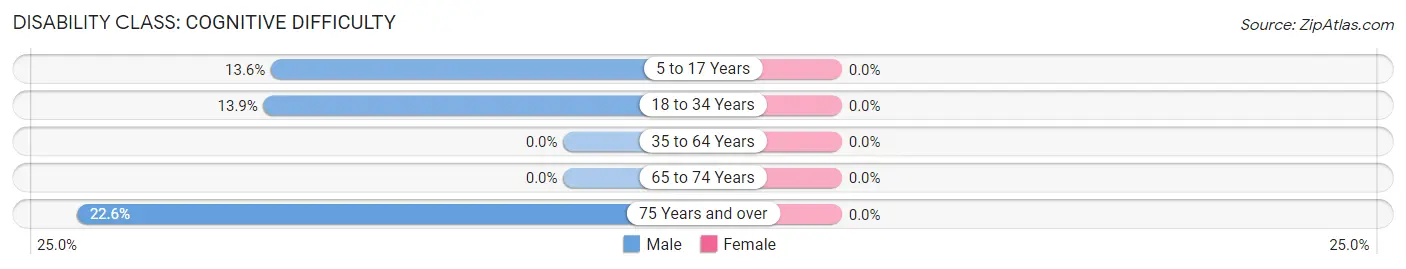
| Age Bracket | Male | Female |
| 5 to 17 Years | 24 (13.6%) | 0 (0.0%) |
| 18 to 34 Years | 16 (13.9%) | 0 (0.0%) |
| 35 to 64 Years | 0 (0.0%) | 0 (0.0%) |
| 65 to 74 Years | 0 (0.0%) | 0 (0.0%) |
| 75 Years and over | 7 (22.6%) | 0 (0.0%) |
Disability Class: Ambulatory Difficulty
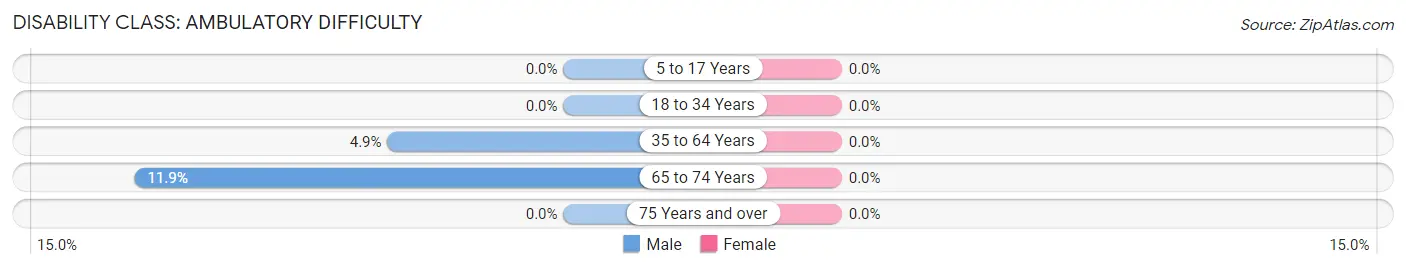
| Age Bracket | Male | Female |
| 5 to 17 Years | 0 (0.0%) | 0 (0.0%) |
| 18 to 34 Years | 0 (0.0%) | 0 (0.0%) |
| 35 to 64 Years | 10 (4.9%) | 0 (0.0%) |
| 65 to 74 Years | 8 (11.9%) | 0 (0.0%) |
| 75 Years and over | 0 (0.0%) | 0 (0.0%) |
Disability Class: Self-Care Difficulty
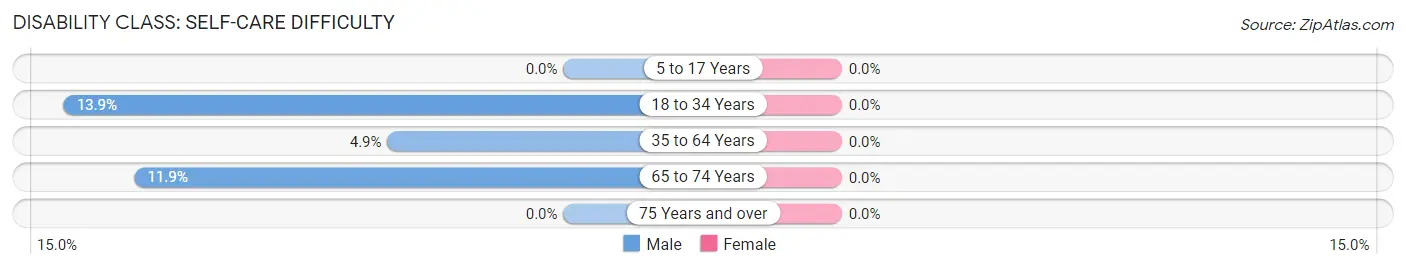
| Age Bracket | Male | Female |
| 5 to 17 Years | 0 (0.0%) | 0 (0.0%) |
| 18 to 34 Years | 16 (13.9%) | 0 (0.0%) |
| 35 to 64 Years | 10 (4.9%) | 0 (0.0%) |
| 65 to 74 Years | 8 (11.9%) | 0 (0.0%) |
| 75 Years and over | 0 (0.0%) | 0 (0.0%) |
Technology Access in Berlin
Computing Device Access in Berlin
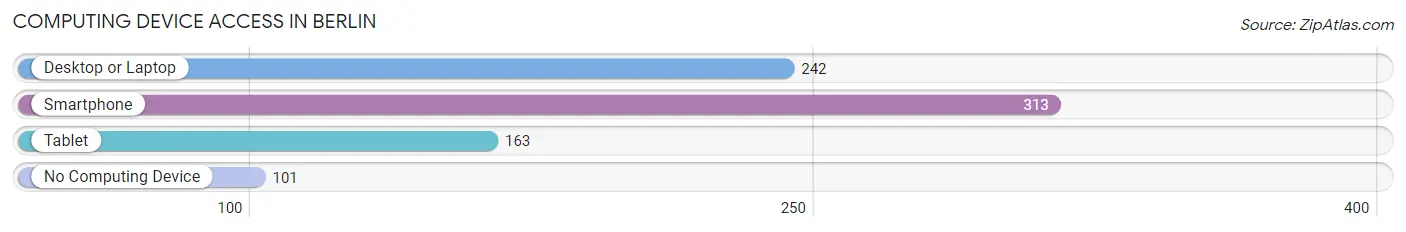
| Device Type | # Households | % Households |
| Desktop or Laptop | 242 | 58.5% |
| Smartphone | 313 | 75.6% |
| Tablet | 163 | 39.4% |
| No Computing Device | 101 | 24.4% |
| Total | 414 | 100.0% |
Internet Access in Berlin
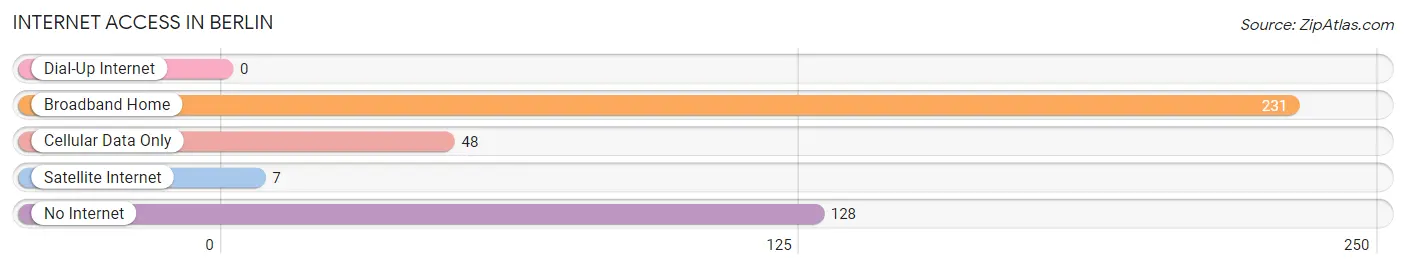
| Internet Type | # Households | % Households |
| Dial-Up Internet | 0 | 0.0% |
| Broadband Home | 231 | 55.8% |
| Cellular Data Only | 48 | 11.6% |
| Satellite Internet | 7 | 1.7% |
| No Internet | 128 | 30.9% |
| Total | 414 | 100.0% |
Berlin Summary
Berlin, Ohio is a small village located in Holmes County, Ohio. It is situated in the heart of Amish Country and is home to a population of approximately 1,000 people. The village is known for its quaint charm and its strong sense of community.
History
Berlin was founded in 1816 by a group of settlers from Pennsylvania. The village was originally known as Berlin Station, as it was a stop on the Ohio and Erie Canal. The village was officially incorporated in 1837.
In the late 19th century, Berlin was a thriving agricultural community. The village was home to several mills, including a grist mill, a saw mill, and a woolen mill. The village also had a blacksmith shop, a general store, and a post office.
In the early 20th century, Berlin began to experience a decline in population. This was due to the decline of the canal and the rise of the automobile. The village was also affected by the Great Depression.
Geography
Berlin is located in the rolling hills of Holmes County, Ohio. The village is situated on the banks of the Killbuck Creek. The village is surrounded by farmland and is home to several Amish communities.
The village is located approximately 40 miles south of Cleveland and 60 miles north of Columbus. The nearest major city is Wooster, which is located approximately 20 miles to the east.
Economy
The economy of Berlin is largely based on agriculture and tourism. The village is home to several Amish-owned businesses, including furniture stores, quilt shops, and bakeries. The village also has several antique stores and craft shops.
Berlin is also home to several tourist attractions, including the Amish and Mennonite Heritage Center, the Holmes County Flea Market, and the Berlin Farmers Market. The village is also home to several wineries and breweries.
Demographics
As of the 2010 census, the population of Berlin was 1,000. The racial makeup of the village was 97.2% White, 0.7% African American, 0.2% Native American, 0.2% Asian, 0.2% from other races, and 1.7% from two or more races. Hispanic or Latino of any race were 0.7% of the population.
The median household income in Berlin was $41,250, and the median family income was $48,750. The per capita income for the village was $19,945. About 8.2% of families and 10.2% of the population were below the poverty line, including 11.2% of those under age 18 and 8.2% of those age 65 or over.
Berlin is a small village with a strong sense of community. The village is home to a diverse population and is known for its quaint charm and its strong agricultural roots. The village is also home to several tourist attractions and is a popular destination for visitors to Amish Country.
Common Questions
What is Per Capita Income in Berlin?
Per Capita income in Berlin is $27,764.
What is the Median Family Income in Berlin?
Median Family Income in Berlin is $86,667.
What is the Median Household income in Berlin?
Median Household Income in Berlin is $73,214.
What is Income or Wage Gap in Berlin?
Income or Wage Gap in Berlin is 42.0%.
Women in Berlin earn 58.0 cents for every dollar earned by a man.
What is Inequality or Gini Index in Berlin?
Inequality or Gini Index in Berlin is 0.34.
What is the Total Population of Berlin?
Total Population of Berlin is 1,207.
What is the Total Male Population of Berlin?
Total Male Population of Berlin is 614.
What is the Total Female Population of Berlin?
Total Female Population of Berlin is 593.
What is the Ratio of Males per 100 Females in Berlin?
There are 103.54 Males per 100 Females in Berlin.
What is the Ratio of Females per 100 Males in Berlin?
There are 96.58 Females per 100 Males in Berlin.
What is the Median Population Age in Berlin?
Median Population Age in Berlin is 39.2 Years.
What is the Average Family Size in Berlin
Average Family Size in Berlin is 3.5 People.
What is the Average Household Size in Berlin
Average Household Size in Berlin is 2.9 People.
How Large is the Labor Force in Berlin?
There are 679 People in the Labor Forcein in Berlin.
What is the Percentage of People in the Labor Force in Berlin?
73.2% of People are in the Labor Force in Berlin.