Zip Codes with the Highest Percentage of Population with a Degree in Communications in Westerville, OH
RELATED REPORTS & OPTIONS
Communications
Westerville
Compare Zip Codes
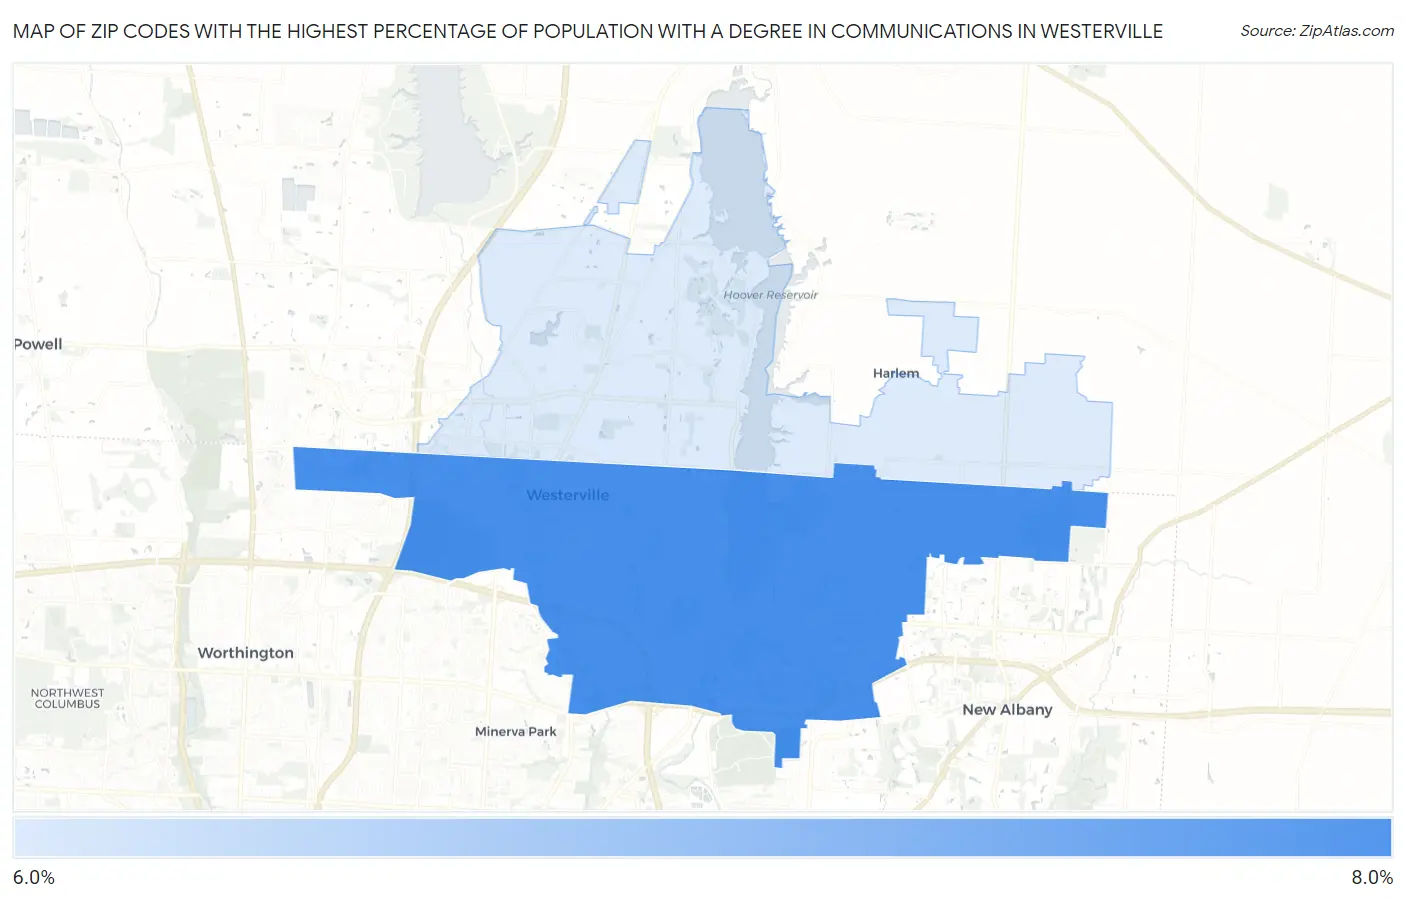
Map of Zip Codes with the Highest Percentage of Population with a Degree in Communications in Westerville
6.2%
6.4%
Zip Codes with the Highest Percentage of Population with a Degree in Communications in Westerville, OH
| Zip Code | % Graduates | vs State | vs National | |
| 1. | 43081 | 6.4% | 4.3%(+2.08)#141 | 4.1%(+2.25)#3,262 |
| 2. | 43082 | 6.2% | 4.3%(+1.85)#153 | 4.1%(+2.03)#3,531 |
1
Common Questions
What are the Top Zip Codes with the Highest Percentage of Population with a Degree in Communications in Westerville, OH?
Top Zip Codes with the Highest Percentage of Population with a Degree in Communications in Westerville, OH are:
What zip code has the Highest Percentage of Population with a Degree in Communications in Westerville, OH?
43081 has the Highest Percentage of Population with a Degree in Communications in Westerville, OH with 6.4%.
What is the Percentage of Population with a Degree in Communications in Westerville, OH?
Percentage of Population with a Degree in Communications in Westerville is 8.4%.
What is the Percentage of Population with a Degree in Communications in Ohio?
Percentage of Population with a Degree in Communications in Ohio is 4.3%.
What is the Percentage of Population with a Degree in Communications in the United States?
Percentage of Population with a Degree in Communications in the United States is 4.1%.