Zip Codes with the Highest Percentage of Population with a Degree in Communications in Ohio
RELATED REPORTS & OPTIONS
Communications
Ohio
Compare Zip Codes
Map of Zip Codes with the Highest Percentage of Population with a Degree in Communications in Ohio
0.0%
60.0%
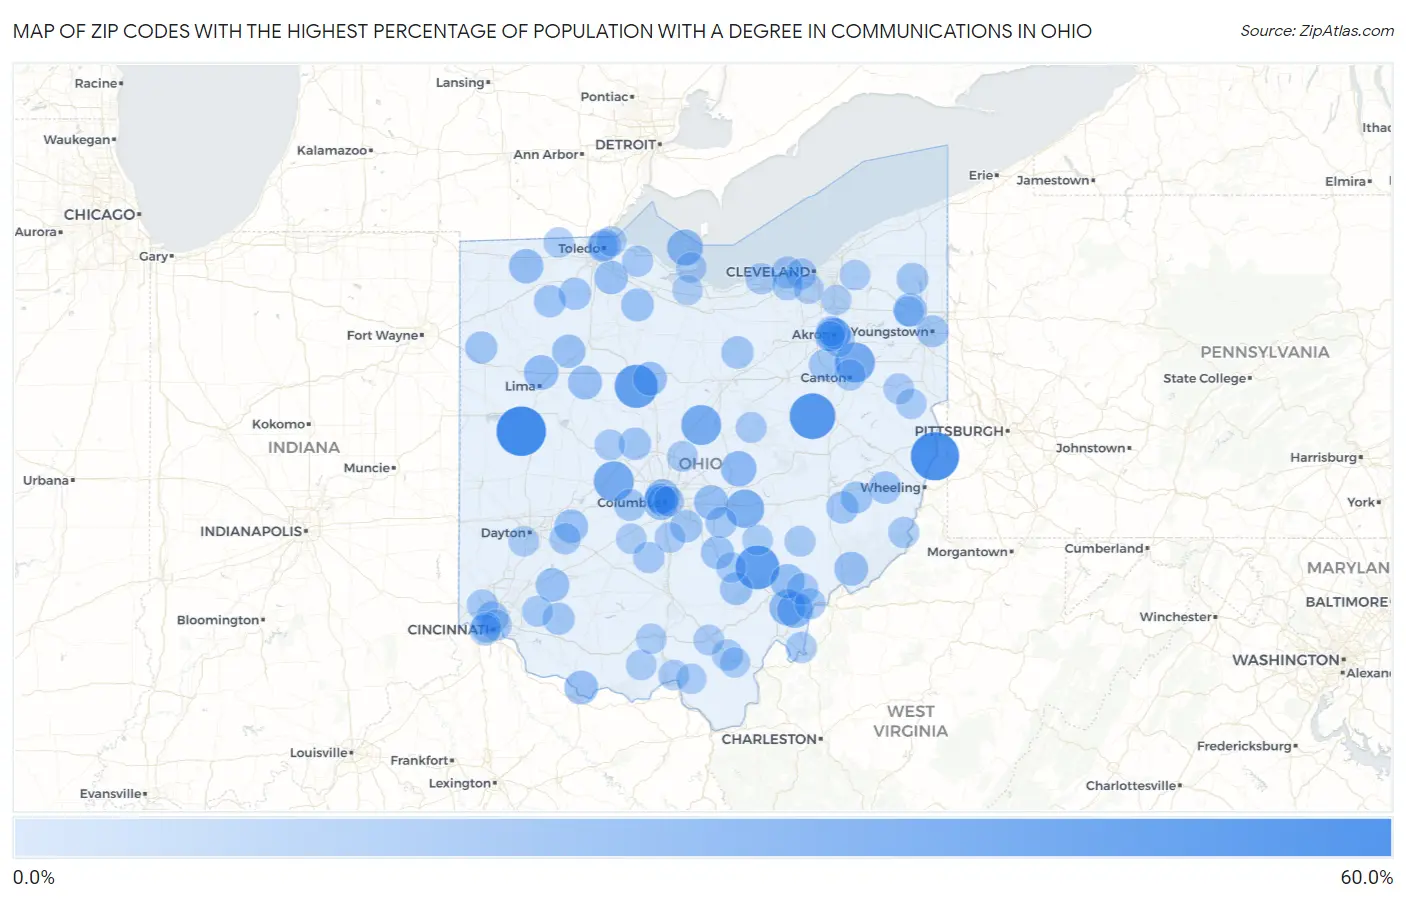
Zip Codes with the Highest Percentage of Population with a Degree in Communications in Ohio
| Zip Code | % Graduates | vs State | vs National | |
| 1. | 45336 | 60.0% | 4.3%(+55.7)#1 | 4.1%(+55.9)#31 |
| 2. | 43913 | 56.5% | 4.3%(+52.1)#2 | 4.1%(+52.3)#37 |
| 3. | 44687 | 49.3% | 4.3%(+44.9)#3 | 4.1%(+45.1)#54 |
| 4. | 43144 | 43.8% | 4.3%(+39.4)#4 | 4.1%(+39.6)#70 |
| 5. | 43323 | 42.2% | 4.3%(+37.9)#5 | 4.1%(+38.1)#73 |
| 6. | 44652 | 33.3% | 4.3%(+29.0)#6 | 4.1%(+29.2)#122 |
| 7. | 43029 | 33.3% | 4.3%(+29.0)#7 | 4.1%(+29.2)#123 |
| 8. | 43317 | 33.3% | 4.3%(+29.0)#8 | 4.1%(+29.2)#126 |
| 9. | 43739 | 29.3% | 4.3%(+25.0)#9 | 4.1%(+25.1)#161 |
| 10. | 45735 | 22.5% | 4.3%(+18.2)#10 | 4.1%(+18.4)#259 |
| 11. | 43456 | 22.4% | 4.3%(+18.1)#11 | 4.1%(+18.3)#261 |
| 12. | 45723 | 21.8% | 4.3%(+17.5)#12 | 4.1%(+17.6)#282 |
| 13. | 43071 | 21.1% | 4.3%(+16.8)#13 | 4.1%(+17.0)#298 |
| 14. | 43222 | 20.1% | 4.3%(+15.8)#14 | 4.1%(+16.0)#326 |
| 15. | 45820 | 19.0% | 4.3%(+14.7)#15 | 4.1%(+14.9)#366 |
| 16. | 44308 | 18.6% | 4.3%(+14.3)#16 | 4.1%(+14.5)#379 |
| 17. | 43553 | 18.5% | 4.3%(+14.2)#17 | 4.1%(+14.3)#388 |
| 18. | 45711 | 18.3% | 4.3%(+14.0)#18 | 4.1%(+14.1)#391 |
| 19. | 43033 | 18.2% | 4.3%(+13.9)#19 | 4.1%(+14.0)#392 |
| 20. | 43210 | 17.4% | 4.3%(+13.1)#20 | 4.1%(+13.3)#422 |
| 21. | 45835 | 17.2% | 4.3%(+12.9)#21 | 4.1%(+13.1)#431 |
| 22. | 45788 | 16.8% | 4.3%(+12.5)#22 | 4.1%(+12.7)#448 |
| 23. | 44849 | 16.8% | 4.3%(+12.5)#23 | 4.1%(+12.6)#451 |
| 24. | 45101 | 16.7% | 4.3%(+12.4)#24 | 4.1%(+12.5)#453 |
| 25. | 45316 | 16.3% | 4.3%(+12.0)#25 | 4.1%(+12.2)#478 |
| 26. | 44485 | 16.1% | 4.3%(+11.8)#26 | 4.1%(+12.0)#490 |
| 27. | 45113 | 16.1% | 4.3%(+11.8)#27 | 4.1%(+11.9)#492 |
| 28. | 43443 | 15.8% | 4.3%(+11.5)#28 | 4.1%(+11.6)#510 |
| 29. | 45868 | 15.4% | 4.3%(+11.1)#29 | 4.1%(+11.2)#531 |
| 30. | 43155 | 15.0% | 4.3%(+10.7)#30 | 4.1%(+10.8)#552 |
| 31. | 43407 | 14.3% | 4.3%(+9.98)#31 | 4.1%(+10.2)#599 |
| 32. | 45654 | 13.7% | 4.3%(+9.35)#32 | 4.1%(+9.53)#641 |
| 33. | 44874 | 13.2% | 4.3%(+8.90)#33 | 4.1%(+9.07)#691 |
| 34. | 43036 | 12.9% | 4.3%(+8.59)#34 | 4.1%(+8.77)#715 |
| 35. | 43759 | 12.9% | 4.3%(+8.59)#35 | 4.1%(+8.77)#716 |
| 36. | 43136 | 12.9% | 4.3%(+8.59)#36 | 4.1%(+8.76)#717 |
| 37. | 43569 | 12.6% | 4.3%(+8.31)#37 | 4.1%(+8.48)#750 |
| 38. | 43535 | 12.5% | 4.3%(+8.19)#38 | 4.1%(+8.36)#761 |
| 39. | 45886 | 12.5% | 4.3%(+8.19)#39 | 4.1%(+8.36)#762 |
| 40. | 43780 | 12.4% | 4.3%(+8.07)#40 | 4.1%(+8.24)#775 |
| 41. | 45232 | 12.3% | 4.3%(+7.97)#41 | 4.1%(+8.14)#782 |
| 42. | 45118 | 12.2% | 4.3%(+7.85)#42 | 4.1%(+8.02)#798 |
| 43. | 44614 | 12.1% | 4.3%(+7.80)#43 | 4.1%(+7.97)#805 |
| 44. | 44450 | 11.7% | 4.3%(+7.42)#44 | 4.1%(+7.59)#862 |
| 45. | 44140 | 11.6% | 4.3%(+7.30)#45 | 4.1%(+7.48)#878 |
| 46. | 44503 | 11.5% | 4.3%(+7.23)#46 | 4.1%(+7.40)#887 |
| 47. | 43608 | 11.5% | 4.3%(+7.22)#47 | 4.1%(+7.39)#892 |
| 48. | 43773 | 11.4% | 4.3%(+7.13)#48 | 4.1%(+7.31)#906 |
| 49. | 43162 | 11.2% | 4.3%(+6.92)#49 | 4.1%(+7.09)#941 |
| 50. | 44306 | 10.8% | 4.3%(+6.46)#50 | 4.1%(+6.63)#1,012 |
| 51. | 45724 | 10.7% | 4.3%(+6.35)#51 | 4.1%(+6.52)#1,037 |
| 52. | 45384 | 10.2% | 4.3%(+5.88)#52 | 4.1%(+6.05)#1,104 |
| 53. | 43148 | 10.2% | 4.3%(+5.85)#53 | 4.1%(+6.03)#1,107 |
| 54. | 43164 | 10.1% | 4.3%(+5.81)#54 | 4.1%(+5.99)#1,114 |
| 55. | 44703 | 10.0% | 4.3%(+5.64)#55 | 4.1%(+5.82)#1,162 |
| 56. | 43915 | 9.8% | 4.3%(+5.50)#56 | 4.1%(+5.67)#1,193 |
| 57. | 45251 | 9.8% | 4.3%(+5.49)#57 | 4.1%(+5.67)#1,195 |
| 58. | 45685 | 9.8% | 4.3%(+5.47)#58 | 4.1%(+5.65)#1,198 |
| 59. | 45206 | 9.7% | 4.3%(+5.36)#59 | 4.1%(+5.53)#1,224 |
| 60. | 45770 | 9.6% | 4.3%(+5.28)#60 | 4.1%(+5.45)#1,243 |
| 61. | 43432 | 9.5% | 4.3%(+5.22)#61 | 4.1%(+5.39)#1,255 |
| 62. | 44052 | 9.5% | 4.3%(+5.21)#62 | 4.1%(+5.38)#1,262 |
| 63. | 43212 | 9.5% | 4.3%(+5.16)#63 | 4.1%(+5.33)#1,277 |
| 64. | 45204 | 9.5% | 4.3%(+5.14)#64 | 4.1%(+5.32)#1,286 |
| 65. | 44304 | 9.4% | 4.3%(+5.07)#65 | 4.1%(+5.24)#1,303 |
| 66. | 45122 | 9.3% | 4.3%(+4.97)#66 | 4.1%(+5.14)#1,333 |
| 67. | 45742 | 9.3% | 4.3%(+4.95)#67 | 4.1%(+5.12)#1,336 |
| 68. | 43014 | 9.1% | 4.3%(+4.82)#68 | 4.1%(+4.99)#1,387 |
| 69. | 43756 | 9.0% | 4.3%(+4.73)#69 | 4.1%(+4.90)#1,423 |
| 70. | 43067 | 8.9% | 4.3%(+4.63)#70 | 4.1%(+4.80)#1,460 |
| 71. | 43620 | 8.9% | 4.3%(+4.61)#71 | 4.1%(+4.79)#1,465 |
| 72. | 43074 | 8.7% | 4.3%(+4.38)#72 | 4.1%(+4.55)#1,558 |
| 73. | 45205 | 8.6% | 4.3%(+4.30)#73 | 4.1%(+4.47)#1,587 |
| 74. | 44107 | 8.6% | 4.3%(+4.28)#74 | 4.1%(+4.45)#1,597 |
| 75. | 44070 | 8.5% | 4.3%(+4.24)#75 | 4.1%(+4.41)#1,613 |
| 76. | 43764 | 8.5% | 4.3%(+4.19)#76 | 4.1%(+4.36)#1,631 |
| 77. | 44427 | 8.5% | 4.3%(+4.14)#77 | 4.1%(+4.32)#1,656 |
| 78. | 43215 | 8.3% | 4.3%(+4.03)#78 | 4.1%(+4.21)#1,701 |
| 79. | 45662 | 8.3% | 4.3%(+4.02)#79 | 4.1%(+4.20)#1,702 |
| 80. | 43103 | 8.3% | 4.3%(+4.00)#80 | 4.1%(+4.17)#1,730 |
| 81. | 45640 | 8.3% | 4.3%(+3.98)#81 | 4.1%(+4.16)#1,734 |
| 82. | 43440 | 8.2% | 4.3%(+3.88)#82 | 4.1%(+4.05)#1,770 |
| 83. | 43203 | 8.1% | 4.3%(+3.83)#83 | 4.1%(+4.00)#1,803 |
| 84. | 45439 | 8.1% | 4.3%(+3.81)#84 | 4.1%(+3.98)#1,810 |
| 85. | 45657 | 8.1% | 4.3%(+3.78)#85 | 4.1%(+3.95)#1,832 |
| 86. | 43945 | 8.1% | 4.3%(+3.77)#86 | 4.1%(+3.94)#1,839 |
| 87. | 45661 | 8.0% | 4.3%(+3.72)#87 | 4.1%(+3.89)#1,865 |
| 88. | 43143 | 8.0% | 4.3%(+3.70)#88 | 4.1%(+3.87)#1,878 |
| 89. | 44072 | 7.9% | 4.3%(+3.64)#89 | 4.1%(+3.81)#1,913 |
| 90. | 43138 | 7.9% | 4.3%(+3.56)#90 | 4.1%(+3.74)#1,956 |
| 91. | 43611 | 7.8% | 4.3%(+3.49)#91 | 4.1%(+3.67)#2,010 |
| 92. | 45694 | 7.7% | 4.3%(+3.36)#92 | 4.1%(+3.53)#2,089 |
| 93. | 43540 | 7.5% | 4.3%(+3.23)#93 | 4.1%(+3.40)#2,167 |
| 94. | 44303 | 7.5% | 4.3%(+3.18)#94 | 4.1%(+3.35)#2,204 |
| 95. | 44824 | 7.5% | 4.3%(+3.17)#95 | 4.1%(+3.35)#2,206 |
| 96. | 44481 | 7.5% | 4.3%(+3.16)#96 | 4.1%(+3.33)#2,220 |
| 97. | 45674 | 7.5% | 4.3%(+3.15)#97 | 4.1%(+3.33)#2,227 |
| 98. | 44307 | 7.5% | 4.3%(+3.14)#98 | 4.1%(+3.32)#2,234 |
| 99. | 44056 | 7.4% | 4.3%(+3.13)#99 | 4.1%(+3.30)#2,240 |
| 100. | 44129 | 7.4% | 4.3%(+3.12)#100 | 4.1%(+3.29)#2,247 |
Common Questions
What are the Top 10 Zip Codes with the Highest Percentage of Population with a Degree in Communications in Ohio?
Top 10 Zip Codes with the Highest Percentage of Population with a Degree in Communications in Ohio are:
What zip code has the Highest Percentage of Population with a Degree in Communications in Ohio?
45336 has the Highest Percentage of Population with a Degree in Communications in Ohio with 60.0%.
What is the Percentage of Population with a Degree in Communications in the State of Ohio?
Percentage of Population with a Degree in Communications in Ohio is 4.3%.
What is the Percentage of Population with a Degree in Communications in the United States?
Percentage of Population with a Degree in Communications in the United States is 4.1%.