Good Hope, OH Map & Demographics
Good Hope Map
Good Hope Overview
$21,955
PER CAPITA INCOME
$58,281
AVG FAMILY INCOME
12.2%
WAGE / INCOME GAP [ % ]
87.8¢/ $1
WAGE / INCOME GAP [ $ ]
0.41
INEQUALITY / GINI INDEX
260
TOTAL POPULATION
118
MALE POPULATION
142
FEMALE POPULATION
83.10
MALES / 100 FEMALES
120.34
FEMALES / 100 MALES
34.7
MEDIAN AGE
3.3
AVG FAMILY SIZE
2.3
AVG HOUSEHOLD SIZE
85
LABOR FORCE [ PEOPLE ]
53.8%
PERCENT IN LABOR FORCE
Income in Good Hope
Income Overview in Good Hope
| Characteristic | Number | Measure |
| Per Capita Income | 260 | $21,955 |
| Median Family Income | 64 | $58,281 |
| Mean Family Income | 64 | $67,213 |
| Median Household Income | 112 | $0 |
| Mean Household Income | 112 | $50,869 |
| Income Deficit | 64 | $0 |
| Wage / Income Gap (%) | 260 | 12.16% |
| Wage / Income Gap ($) | 260 | 87.84¢ per $1 |
| Gini / Inequality Index | 260 | 0.41 |
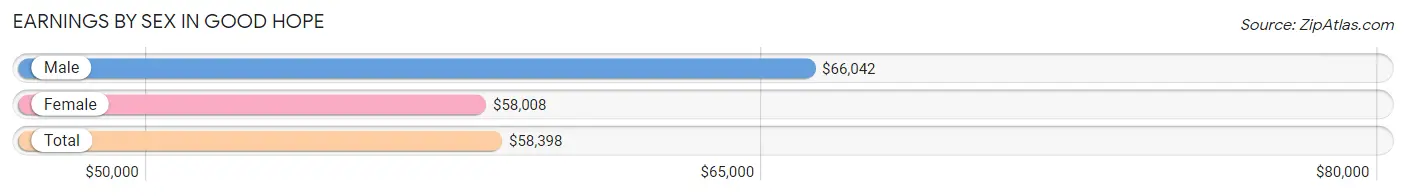
Earnings by Sex in Good Hope
Average Earnings in Good Hope are $58,398, $66,042 for men and $58,008 for women, a difference of 12.2%.
| Sex | Number | Average Earnings |
| Male | 34 (40.0%) | $66,042 |
| Female | 51 (60.0%) | $58,008 |
| Total | 85 (100.0%) | $58,398 |
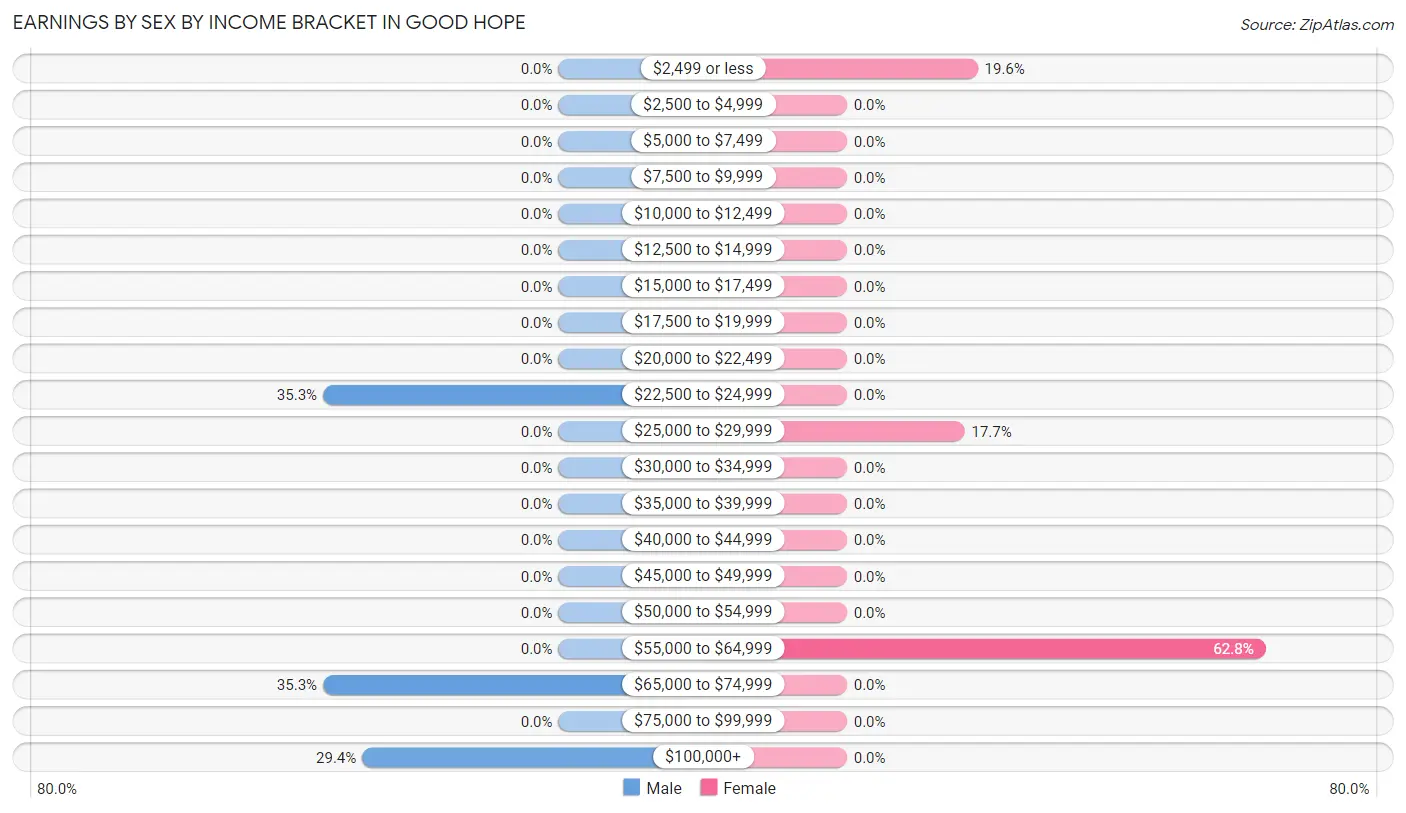
Earnings by Sex by Income Bracket in Good Hope
The most common earnings brackets in Good Hope are $22,500 to $24,999 for men (12 | 35.3%) and $55,000 to $64,999 for women (32 | 62.7%).
| Income | Male | Female |
| $2,499 or less | 0 (0.0%) | 10 (19.6%) |
| $2,500 to $4,999 | 0 (0.0%) | 0 (0.0%) |
| $5,000 to $7,499 | 0 (0.0%) | 0 (0.0%) |
| $7,500 to $9,999 | 0 (0.0%) | 0 (0.0%) |
| $10,000 to $12,499 | 0 (0.0%) | 0 (0.0%) |
| $12,500 to $14,999 | 0 (0.0%) | 0 (0.0%) |
| $15,000 to $17,499 | 0 (0.0%) | 0 (0.0%) |
| $17,500 to $19,999 | 0 (0.0%) | 0 (0.0%) |
| $20,000 to $22,499 | 0 (0.0%) | 0 (0.0%) |
| $22,500 to $24,999 | 12 (35.3%) | 0 (0.0%) |
| $25,000 to $29,999 | 0 (0.0%) | 9 (17.6%) |
| $30,000 to $34,999 | 0 (0.0%) | 0 (0.0%) |
| $35,000 to $39,999 | 0 (0.0%) | 0 (0.0%) |
| $40,000 to $44,999 | 0 (0.0%) | 0 (0.0%) |
| $45,000 to $49,999 | 0 (0.0%) | 0 (0.0%) |
| $50,000 to $54,999 | 0 (0.0%) | 0 (0.0%) |
| $55,000 to $64,999 | 0 (0.0%) | 32 (62.7%) |
| $65,000 to $74,999 | 12 (35.3%) | 0 (0.0%) |
| $75,000 to $99,999 | 0 (0.0%) | 0 (0.0%) |
| $100,000+ | 10 (29.4%) | 0 (0.0%) |
| Total | 34 (100.0%) | 51 (100.0%) |
Earnings by Sex by Educational Attainment in Good Hope
| Educational Attainment | Male Income | Female Income |
| Less than High School | - | - |
| High School Diploma | - | - |
| College or Associate's Degree | - | - |
| Bachelor's Degree | - | - |
| Graduate Degree | - | - |
| Total | - | - |
Family Income in Good Hope
Family Income Brackets in Good Hope
According to the Good Hope family income data, there are 32 families falling into the $50,000 to $74,999 income range, which is the most common income bracket and makes up 50.0% of all families.
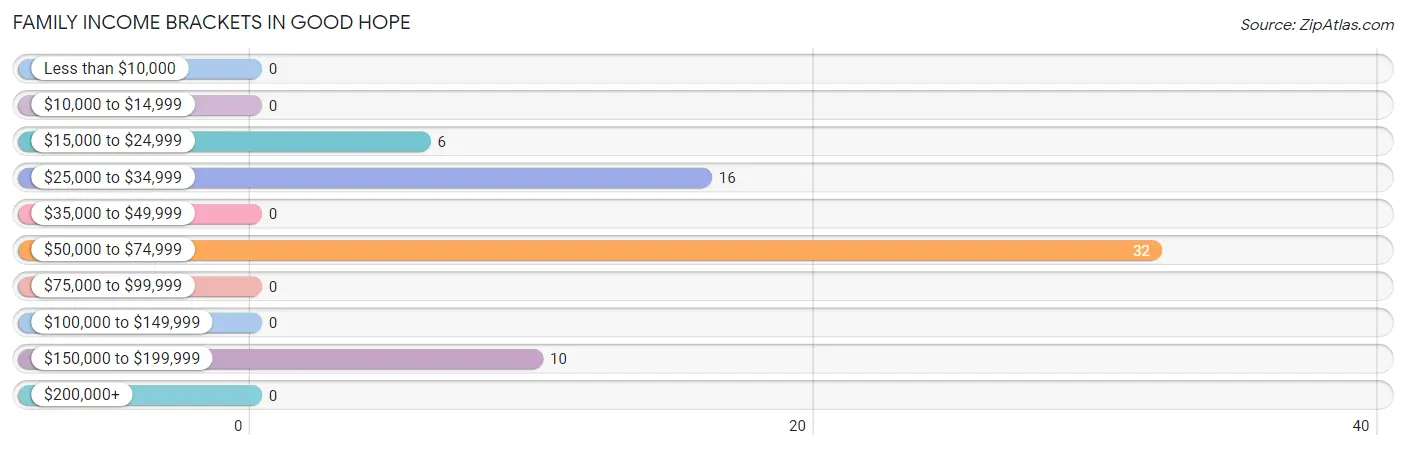
| Income Bracket | # Families | % Families |
| Less than $10,000 | 0 | 0.0% |
| $10,000 to $14,999 | 0 | 0.0% |
| $15,000 to $24,999 | 6 | 9.4% |
| $25,000 to $34,999 | 16 | 25.0% |
| $35,000 to $49,999 | 0 | 0.0% |
| $50,000 to $74,999 | 32 | 50.0% |
| $75,000 to $99,999 | 0 | 0.0% |
| $100,000 to $149,999 | 0 | 0.0% |
| $150,000 to $199,999 | 10 | 15.6% |
| $200,000+ | 0 | 0.0% |
Family Income by Famaliy Size in Good Hope
2-person families (22 | 34.4%) account for the highest median family income in Good Hope with $30,781 per family, while 2-person families (22 | 34.4%) have the highest median income of $15,390 per family member.
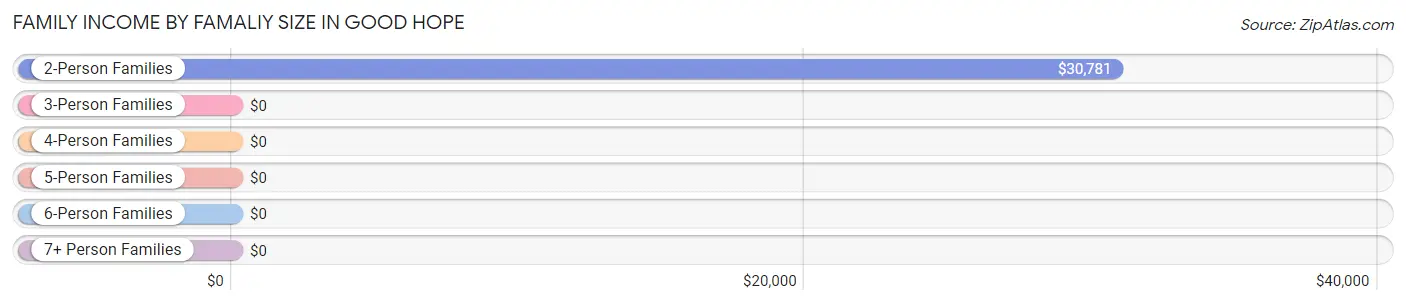
| Income Bracket | # Families | Median Income |
| 2-Person Families | 22 (34.4%) | $30,781 |
| 3-Person Families | 32 (50.0%) | $0 |
| 4-Person Families | 0 (0.0%) | $0 |
| 5-Person Families | 10 (15.6%) | $0 |
| 6-Person Families | 0 (0.0%) | $0 |
| 7+ Person Families | 0 (0.0%) | $0 |
| Total | 64 (100.0%) | $58,281 |
Family Income by Number of Earners in Good Hope
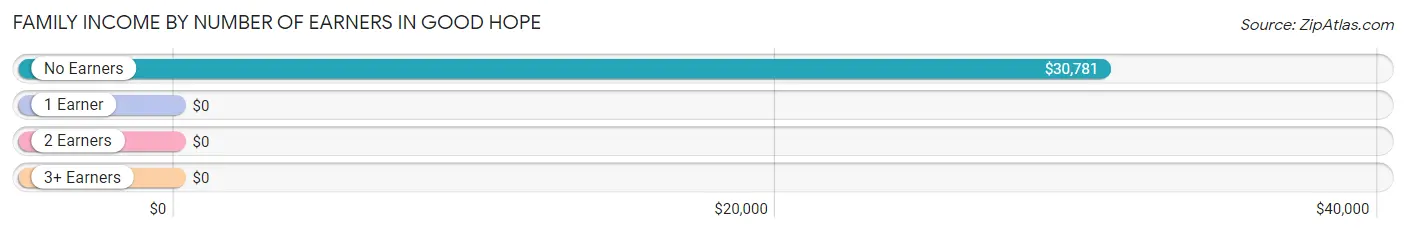
| Number of Earners | # Families | Median Income |
| No Earners | 22 (34.4%) | $30,781 |
| 1 Earner | 32 (50.0%) | $0 |
| 2 Earners | 0 (0.0%) | $0 |
| 3+ Earners | 10 (15.6%) | $0 |
| Total | 64 (100.0%) | $58,281 |
Household Income in Good Hope
Household Income Brackets in Good Hope
With 44 households falling in the category, the $50,000 to $74,999 income range is the most frequent in Good Hope, accounting for 39.3% of all households.
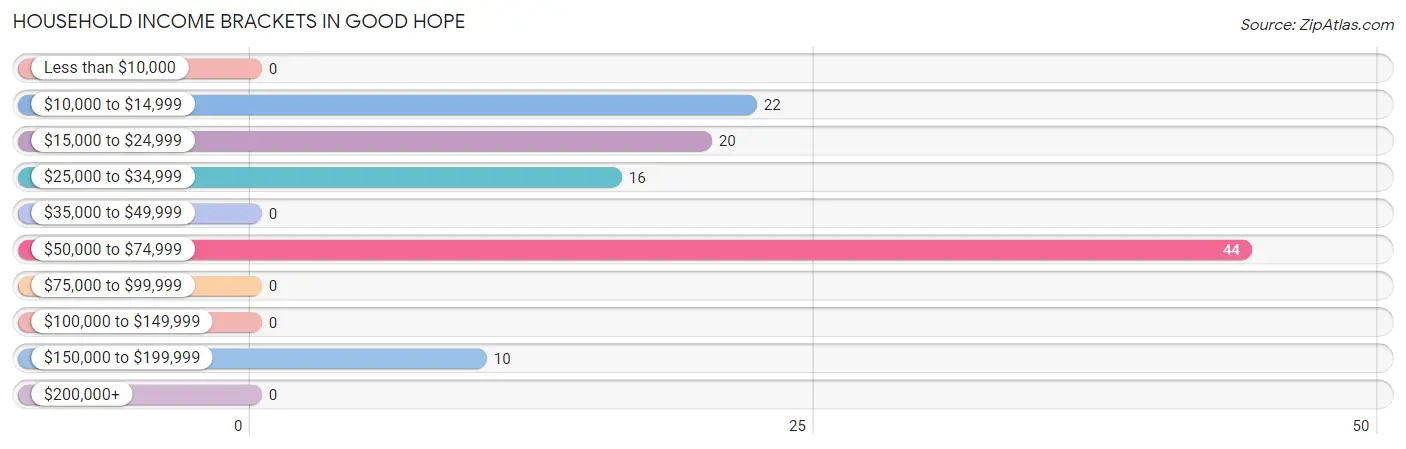
| Income Bracket | # Households | % Households |
| Less than $10,000 | 0 | 0.0% |
| $10,000 to $14,999 | 22 | 19.6% |
| $15,000 to $24,999 | 20 | 17.9% |
| $25,000 to $34,999 | 16 | 14.3% |
| $35,000 to $49,999 | 0 | 0.0% |
| $50,000 to $74,999 | 44 | 39.3% |
| $75,000 to $99,999 | 0 | 0.0% |
| $100,000 to $149,999 | 0 | 0.0% |
| $150,000 to $199,999 | 10 | 8.9% |
| $200,000+ | 0 | 0.0% |
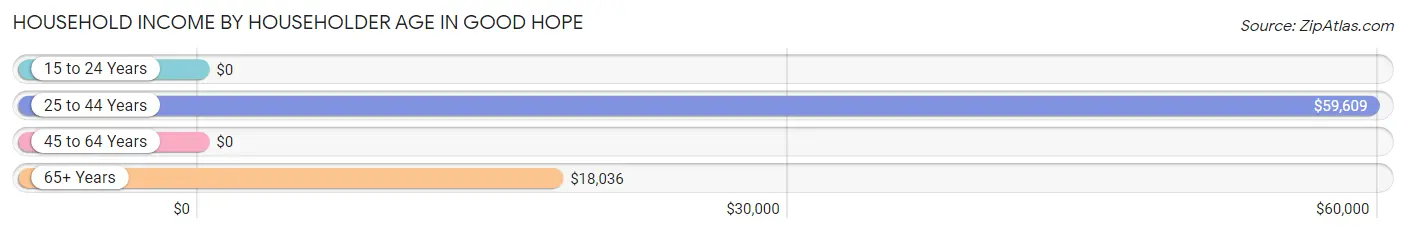
Household Income by Householder Age in Good Hope
The median household income in Good Hope is $0, with the highest median household income of $59,609 found in the 25 to 44 years age bracket for the primary householder. A total of 54 households (48.2%) fall into this category.
| Income Bracket | # Households | Median Income |
| 15 to 24 Years | 0 (0.0%) | $0 |
| 25 to 44 Years | 54 (48.2%) | $59,609 |
| 45 to 64 Years | 8 (7.1%) | $0 |
| 65+ Years | 50 (44.6%) | $18,036 |
| Total | 112 (100.0%) | $0 |
Poverty in Good Hope
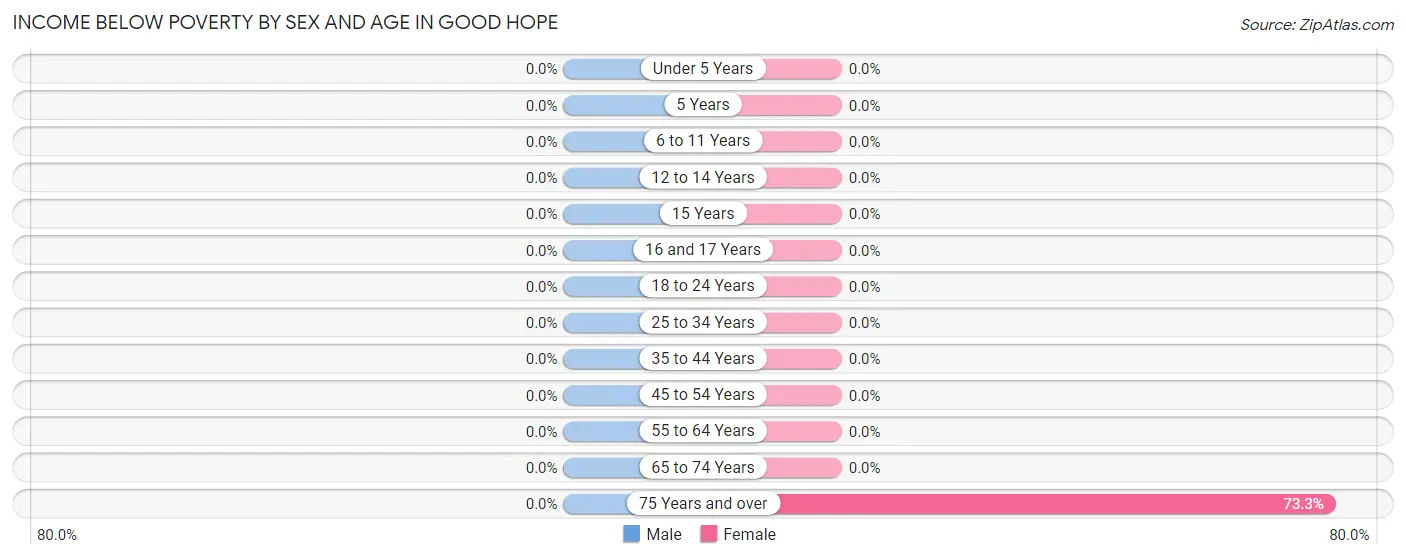
Income Below Poverty by Sex and Age in Good Hope
| Age Bracket | Male | Female |
| Under 5 Years | 0 (0.0%) | 0 (0.0%) |
| 5 Years | 0 (0.0%) | 0 (0.0%) |
| 6 to 11 Years | 0 (0.0%) | 0 (0.0%) |
| 12 to 14 Years | 0 (0.0%) | 0 (0.0%) |
| 15 Years | 0 (0.0%) | 0 (0.0%) |
| 16 and 17 Years | 0 (0.0%) | 0 (0.0%) |
| 18 to 24 Years | 0 (0.0%) | 0 (0.0%) |
| 25 to 34 Years | 0 (0.0%) | 0 (0.0%) |
| 35 to 44 Years | 0 (0.0%) | 0 (0.0%) |
| 45 to 54 Years | 0 (0.0%) | 0 (0.0%) |
| 55 to 64 Years | 0 (0.0%) | 0 (0.0%) |
| 65 to 74 Years | 0 (0.0%) | 0 (0.0%) |
| 75 Years and over | 0 (0.0%) | 22 (73.3%) |
| Total | 0 (0.0%) | 22 (15.5%) |
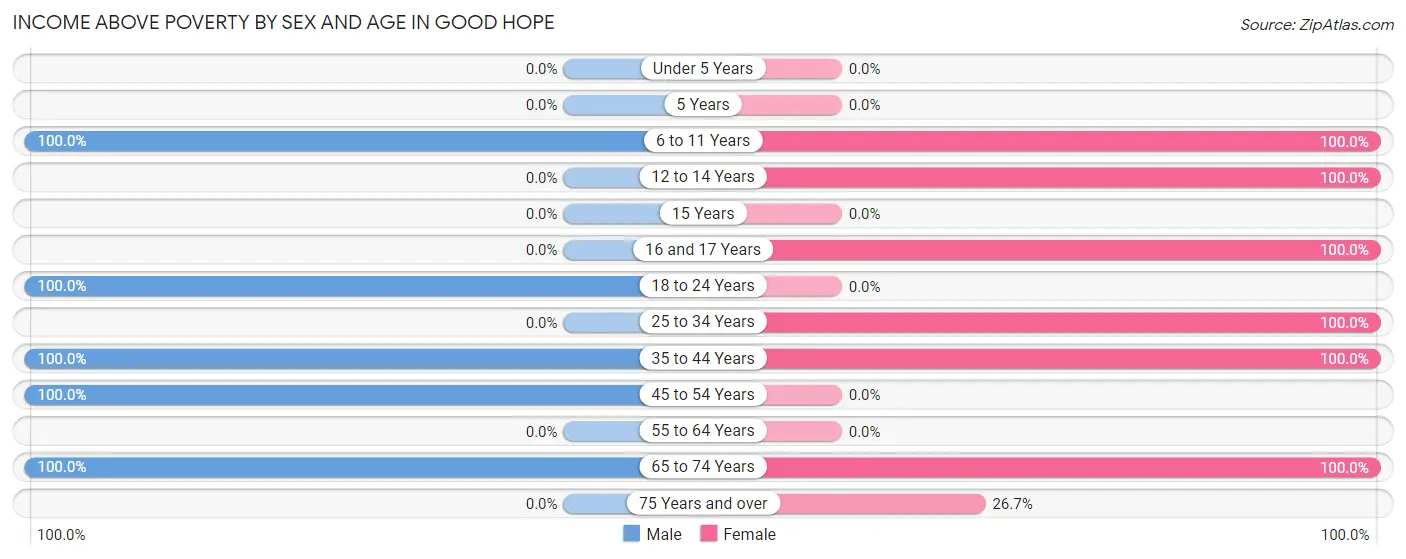
Income Above Poverty by Sex and Age in Good Hope
According to the poverty statistics in Good Hope, males aged 6 to 11 years and females aged 6 to 11 years are the age groups that are most secure financially, with 100.0% of males and 100.0% of females in these age groups living above the poverty line.
| Age Bracket | Male | Female |
| Under 5 Years | 0 (0.0%) | 0 (0.0%) |
| 5 Years | 0 (0.0%) | 0 (0.0%) |
| 6 to 11 Years | 49 (100.0%) | 46 (100.0%) |
| 12 to 14 Years | 0 (0.0%) | 7 (100.0%) |
| 15 Years | 0 (0.0%) | 0 (0.0%) |
| 16 and 17 Years | 0 (0.0%) | 10 (100.0%) |
| 18 to 24 Years | 12 (100.0%) | 0 (0.0%) |
| 25 to 34 Years | 0 (0.0%) | 9 (100.0%) |
| 35 to 44 Years | 22 (100.0%) | 32 (100.0%) |
| 45 to 54 Years | 8 (100.0%) | 0 (0.0%) |
| 55 to 64 Years | 0 (0.0%) | 0 (0.0%) |
| 65 to 74 Years | 27 (100.0%) | 8 (100.0%) |
| 75 Years and over | 0 (0.0%) | 8 (26.7%) |
| Total | 118 (100.0%) | 120 (84.5%) |
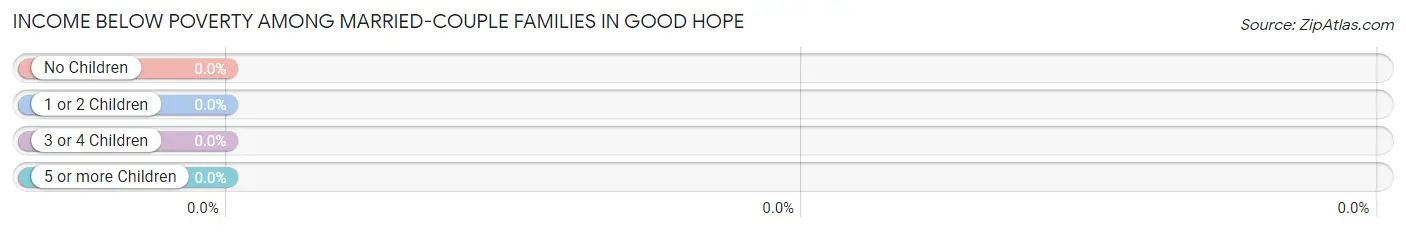
Income Below Poverty Among Married-Couple Families in Good Hope
| Children | Above Poverty | Below Poverty |
| No Children | 14 (100.0%) | 0 (0.0%) |
| 1 or 2 Children | 10 (100.0%) | 0 (0.0%) |
| 3 or 4 Children | 0 (0.0%) | 0 (0.0%) |
| 5 or more Children | 0 (0.0%) | 0 (0.0%) |
| Total | 24 (100.0%) | 0 (0.0%) |
Income Below Poverty Among Single-Parent Households in Good Hope
| Children | Single Father | Single Mother |
| No Children | 0 (0.0%) | 0 (0.0%) |
| 1 or 2 Children | 0 (0.0%) | 0 (0.0%) |
| 3 or 4 Children | 0 (0.0%) | 0 (0.0%) |
| 5 or more Children | 0 (0.0%) | 0 (0.0%) |
| Total | 0 (0.0%) | 0 (0.0%) |
Income Below Poverty Among Married-Couple vs Single-Parent Households in Good Hope
| Children | Married-Couple Families | Single-Parent Households |
| No Children | 0 (0.0%) | 0 (0.0%) |
| 1 or 2 Children | 0 (0.0%) | 0 (0.0%) |
| 3 or 4 Children | 0 (0.0%) | 0 (0.0%) |
| 5 or more Children | 0 (0.0%) | 0 (0.0%) |
| Total | 0 (0.0%) | 0 (0.0%) |
Race in Good Hope
The most populous races in Good Hope are , and White / Caucasian (260 | 100.0%).
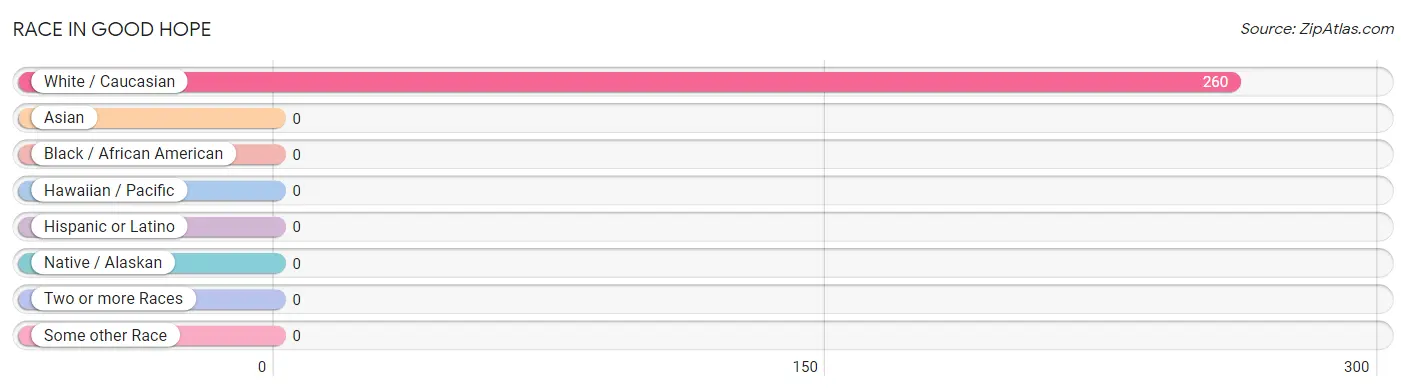
| Race | # Population | % Population |
| Asian | 0 | 0.0% |
| Black / African American | 0 | 0.0% |
| Hawaiian / Pacific | 0 | 0.0% |
| Hispanic or Latino | 0 | 0.0% |
| Native / Alaskan | 0 | 0.0% |
| White / Caucasian | 260 | 100.0% |
| Two or more Races | 0 | 0.0% |
| Some other Race | 0 | 0.0% |
| Total | 260 | 100.0% |
Ancestry in Good Hope
The most populous ancestries reported in Good Hope are German (181 | 69.6%), French (118 | 45.4%), Irish (41 | 15.8%), English (28 | 10.8%), and American (12 | 4.6%), together accounting for 146.2% of all Good Hope residents.
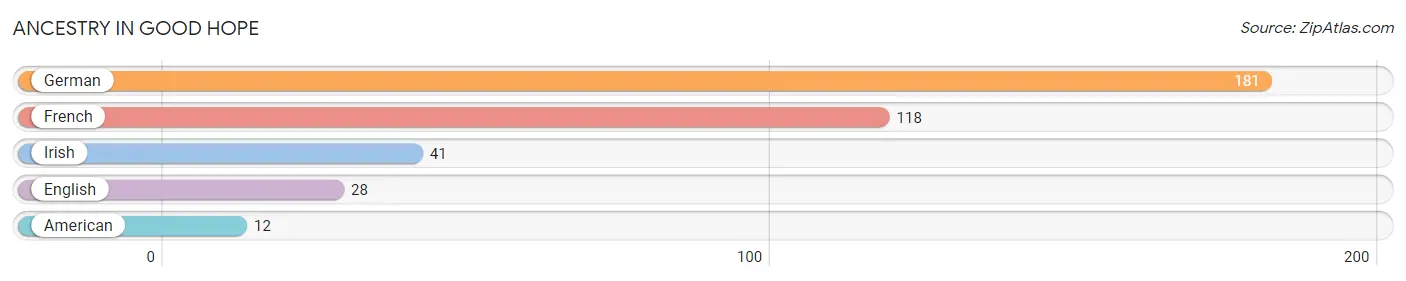
| Ancestry | # Population | % Population |
| American | 12 | 4.6% |
| English | 28 | 10.8% |
| French | 118 | 45.4% |
| German | 181 | 69.6% |
| Irish | 41 | 15.8% | View All 5 Rows |
Immigrants in Good Hope

| Immigration Origin | # Population | % Population | View All 0 Rows |
Sex and Age in Good Hope
Sex and Age in Good Hope
The most populous age groups in Good Hope are 5 to 9 Years (40 | 33.9%) for men and 10 to 14 Years (53 | 37.3%) for women.
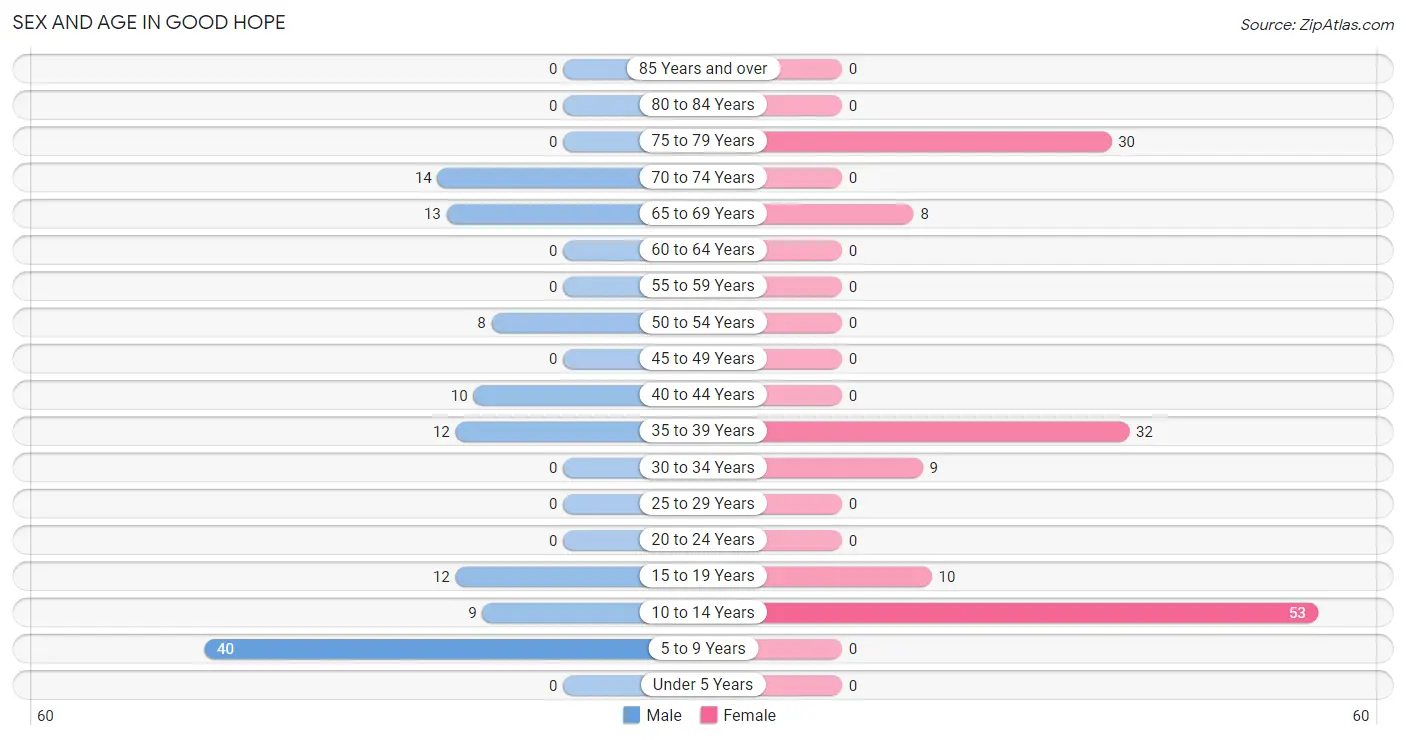
| Age Bracket | Male | Female |
| Under 5 Years | 0 (0.0%) | 0 (0.0%) |
| 5 to 9 Years | 40 (33.9%) | 0 (0.0%) |
| 10 to 14 Years | 9 (7.6%) | 53 (37.3%) |
| 15 to 19 Years | 12 (10.2%) | 10 (7.0%) |
| 20 to 24 Years | 0 (0.0%) | 0 (0.0%) |
| 25 to 29 Years | 0 (0.0%) | 0 (0.0%) |
| 30 to 34 Years | 0 (0.0%) | 9 (6.3%) |
| 35 to 39 Years | 12 (10.2%) | 32 (22.5%) |
| 40 to 44 Years | 10 (8.5%) | 0 (0.0%) |
| 45 to 49 Years | 0 (0.0%) | 0 (0.0%) |
| 50 to 54 Years | 8 (6.8%) | 0 (0.0%) |
| 55 to 59 Years | 0 (0.0%) | 0 (0.0%) |
| 60 to 64 Years | 0 (0.0%) | 0 (0.0%) |
| 65 to 69 Years | 13 (11.0%) | 8 (5.6%) |
| 70 to 74 Years | 14 (11.9%) | 0 (0.0%) |
| 75 to 79 Years | 0 (0.0%) | 30 (21.1%) |
| 80 to 84 Years | 0 (0.0%) | 0 (0.0%) |
| 85 Years and over | 0 (0.0%) | 0 (0.0%) |
| Total | 118 (100.0%) | 142 (100.0%) |
Families and Households in Good Hope
Median Family Size in Good Hope
The median family size in Good Hope is 3.31 persons per family, with single female/mother families (32 | 50.0%) accounting for the largest median family size of 3.69 persons per family. On the other hand, single male/father families (8 | 12.5%) represent the smallest median family size with 1.88 persons per family.
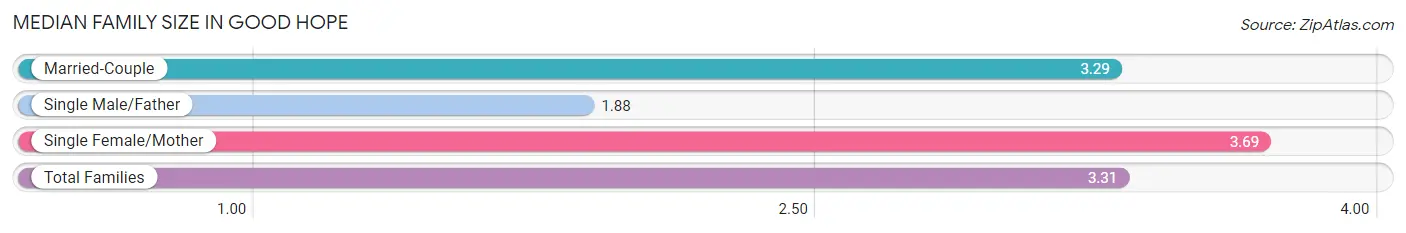
| Family Type | # Families | Family Size |
| Married-Couple | 24 (37.5%) | 3.29 |
| Single Male/Father | 8 (12.5%) | 1.88 |
| Single Female/Mother | 32 (50.0%) | 3.69 |
| Total Families | 64 (100.0%) | 3.31 |
Median Household Size in Good Hope
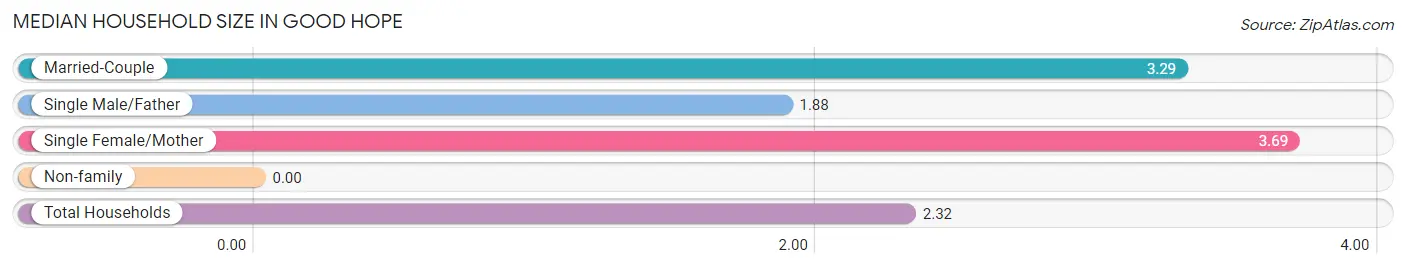
| Household Type | # Households | Household Size |
| Married-Couple | 24 (21.4%) | 3.29 |
| Single Male/Father | 8 (7.1%) | 1.88 |
| Single Female/Mother | 32 (28.6%) | 3.69 |
| Non-family | 48 (42.9%) | - |
| Total Households | 112 (100.0%) | 2.32 |
Household Size by Marriage Status in Good Hope
Out of a total of 112 households in Good Hope, 64 (57.1%) are family households, while 48 (42.9%) are nonfamily households. The most numerous type of family households are 3-person households, comprising 32, and the most common type of nonfamily households are 1-person households, comprising 48.
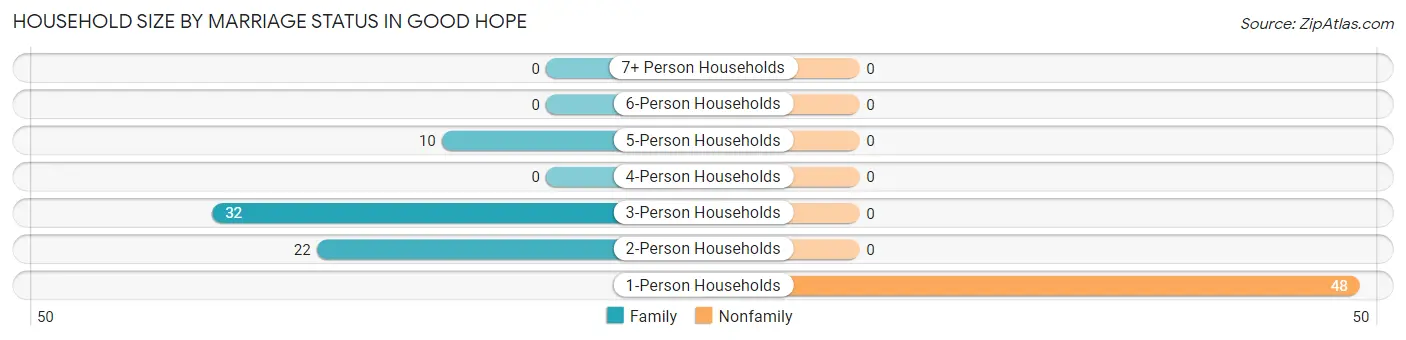
| Household Size | Family Households | Nonfamily Households |
| 1-Person Households | - | 48 (42.9%) |
| 2-Person Households | 22 (19.6%) | 0 (0.0%) |
| 3-Person Households | 32 (28.6%) | 0 (0.0%) |
| 4-Person Households | 0 (0.0%) | 0 (0.0%) |
| 5-Person Households | 10 (8.9%) | 0 (0.0%) |
| 6-Person Households | 0 (0.0%) | 0 (0.0%) |
| 7+ Person Households | 0 (0.0%) | 0 (0.0%) |
| Total | 64 (57.1%) | 48 (42.9%) |
Female Fertility in Good Hope
Fertility by Age in Good Hope
| Age Bracket | Women with Births | Births / 1,000 Women |
| 15 to 19 years | 0 (0.0%) | 0.0 |
| 20 to 34 years | 0 (0.0%) | 0.0 |
| 35 to 50 years | 0 (0.0%) | 0.0 |
| Total | 0 (0.0%) | 0.0 |
Fertility by Age by Marriage Status in Good Hope
| Age Bracket | Married | Unmarried |
| 15 to 19 years | 0 (0.0%) | 0 (0.0%) |
| 20 to 34 years | 0 (0.0%) | 0 (0.0%) |
| 35 to 50 years | 0 (0.0%) | 0 (0.0%) |
| Total | 0 (0.0%) | 0 (0.0%) |
Fertility by Education in Good Hope
| Educational Attainment | Women with Births | Births / 1,000 Women |
| Less than High School | 0 (0.0%) | 0.0 |
| High School Diploma | 0 (0.0%) | 0.0 |
| College or Associate's Degree | 0 (0.0%) | 0.0 |
| Bachelor's Degree | 0 (0.0%) | 0.0 |
| Graduate Degree | 0 (0.0%) | 0.0 |
| Total | 0 (0.0%) | 0.0 |
Fertility by Education by Marriage Status in Good Hope
| Educational Attainment | Married | Unmarried |
| Less than High School | 0 (0.0%) | 0 (0.0%) |
| High School Diploma | 0 (0.0%) | 0 (0.0%) |
| College or Associate's Degree | 0 (0.0%) | 0 (0.0%) |
| Bachelor's Degree | 0 (0.0%) | 0 (0.0%) |
| Graduate Degree | 0 (0.0%) | 0 (0.0%) |
| Total | 0 (0.0%) | 0 (0.0%) |
Employment Characteristics in Good Hope
Employment by Class of Employer in Good Hope
Among the 85 employed individuals in Good Hope, private company employees (44 | 51.8%), and local government employees (41 | 48.2%) make up the most common classes of employment.
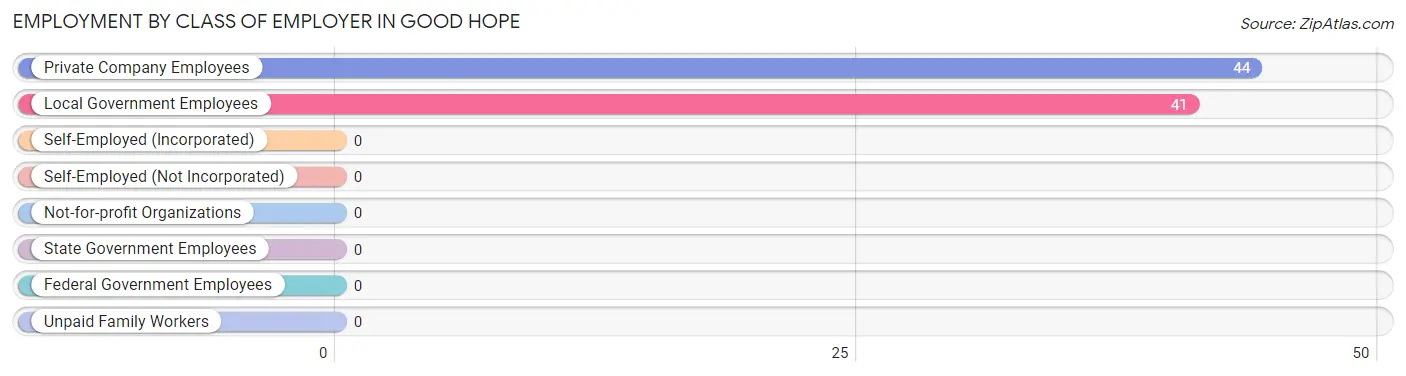
| Employer Class | # Employees | % Employees |
| Private Company Employees | 44 | 51.8% |
| Self-Employed (Incorporated) | 0 | 0.0% |
| Self-Employed (Not Incorporated) | 0 | 0.0% |
| Not-for-profit Organizations | 0 | 0.0% |
| Local Government Employees | 41 | 48.2% |
| State Government Employees | 0 | 0.0% |
| Federal Government Employees | 0 | 0.0% |
| Unpaid Family Workers | 0 | 0.0% |
| Total | 85 | 100.0% |
Employment Status by Age in Good Hope
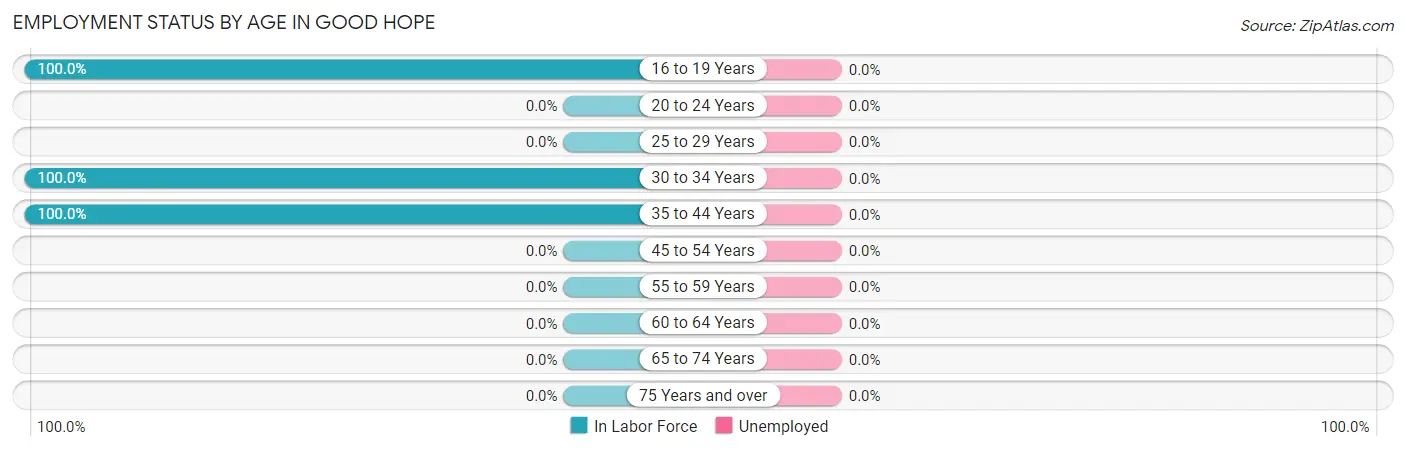
| Age Bracket | In Labor Force | Unemployed |
| 16 to 19 Years | 22 (100.0%) | 0 (0.0%) |
| 20 to 24 Years | 0 (0.0%) | 0 (0.0%) |
| 25 to 29 Years | 0 (0.0%) | 0 (0.0%) |
| 30 to 34 Years | 9 (100.0%) | 0 (0.0%) |
| 35 to 44 Years | 54 (100.0%) | 0 (0.0%) |
| 45 to 54 Years | 0 (0.0%) | 0 (0.0%) |
| 55 to 59 Years | 0 (0.0%) | 0 (0.0%) |
| 60 to 64 Years | 0 (0.0%) | 0 (0.0%) |
| 65 to 74 Years | 0 (0.0%) | 0 (0.0%) |
| 75 Years and over | 0 (0.0%) | 0 (0.0%) |
| Total | 85 (53.8%) | 0 (0.0%) |
Employment Status by Educational Attainment in Good Hope
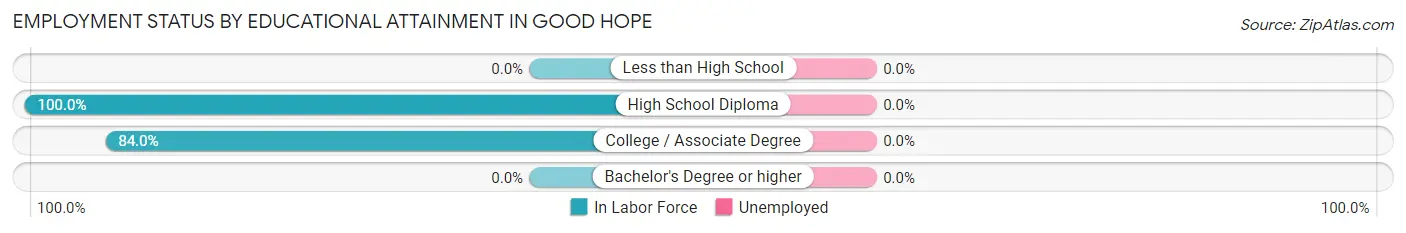
| Educational Attainment | In Labor Force | Unemployed |
| Less than High School | 0 (0.0%) | 0 (0.0%) |
| High School Diploma | 21 (100.0%) | 0 (0.0%) |
| College / Associate Degree | 42 (84.0%) | 0 (0.0%) |
| Bachelor's Degree or higher | 0 (0.0%) | 0 (0.0%) |
| Total | 63 (88.7%) | 0 (0.0%) |
Employment Occupations by Sex in Good Hope
Management, Business, Science and Arts Occupations
The most common Management, Business, Science and Arts occupations in Good Hope are , and Management (42 | 49.4%).
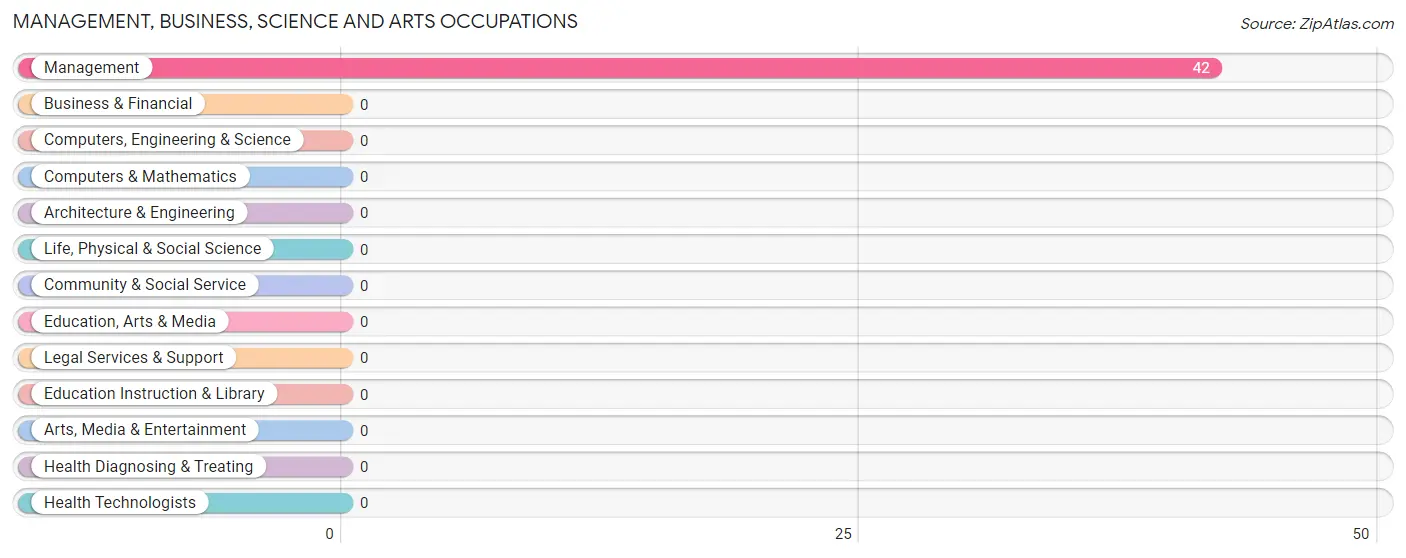
Management, Business, Science and Arts Occupations by Sex
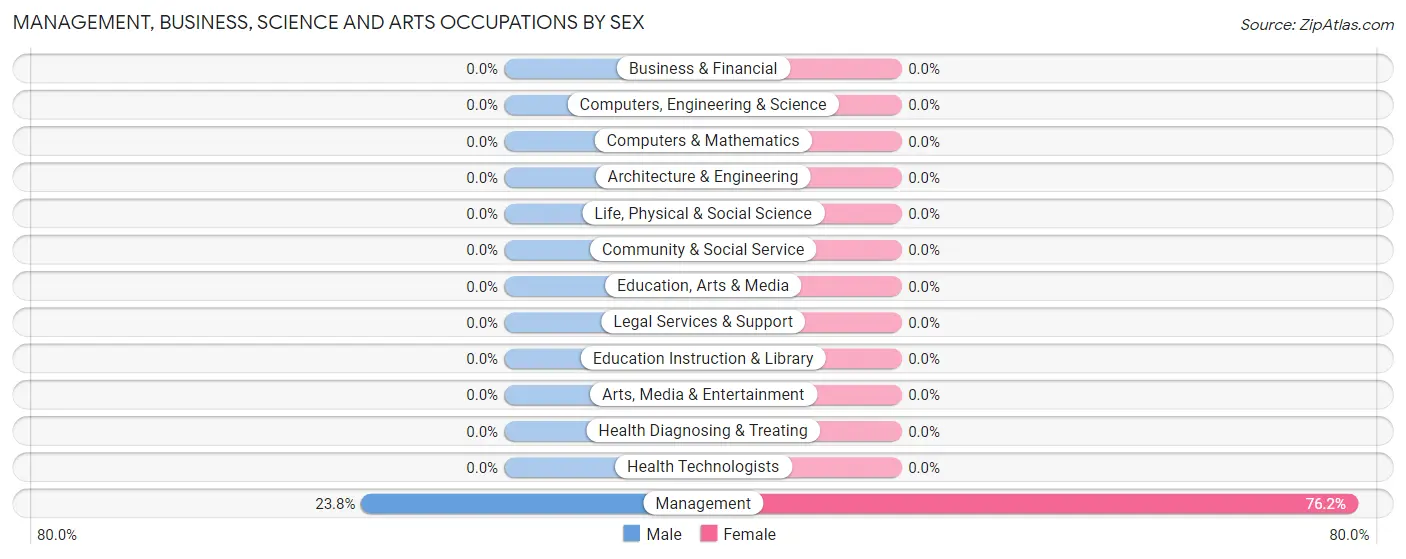
| Occupation | Male | Female |
| Management | 10 (23.8%) | 32 (76.2%) |
| Business & Financial | 0 (0.0%) | 0 (0.0%) |
| Computers, Engineering & Science | 0 (0.0%) | 0 (0.0%) |
| Computers & Mathematics | 0 (0.0%) | 0 (0.0%) |
| Architecture & Engineering | 0 (0.0%) | 0 (0.0%) |
| Life, Physical & Social Science | 0 (0.0%) | 0 (0.0%) |
| Community & Social Service | 0 (0.0%) | 0 (0.0%) |
| Education, Arts & Media | 0 (0.0%) | 0 (0.0%) |
| Legal Services & Support | 0 (0.0%) | 0 (0.0%) |
| Education Instruction & Library | 0 (0.0%) | 0 (0.0%) |
| Arts, Media & Entertainment | 0 (0.0%) | 0 (0.0%) |
| Health Diagnosing & Treating | 0 (0.0%) | 0 (0.0%) |
| Health Technologists | 0 (0.0%) | 0 (0.0%) |
| Total (Category) | 10 (23.8%) | 32 (76.2%) |
| Total (Overall) | 34 (40.0%) | 51 (60.0%) |
Services Occupations
The most common Services occupations in Good Hope are , and Food Preparation & Serving (10 | 11.8%).
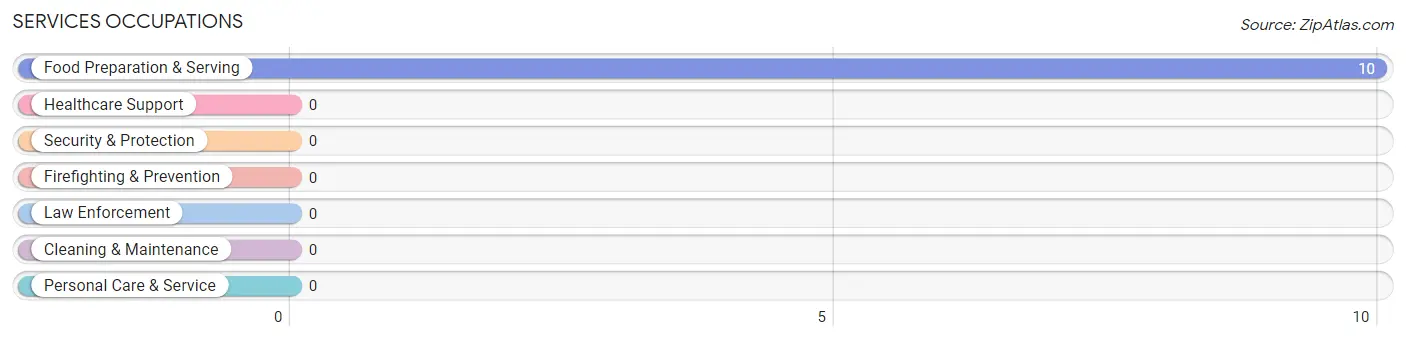
Services Occupations by Sex
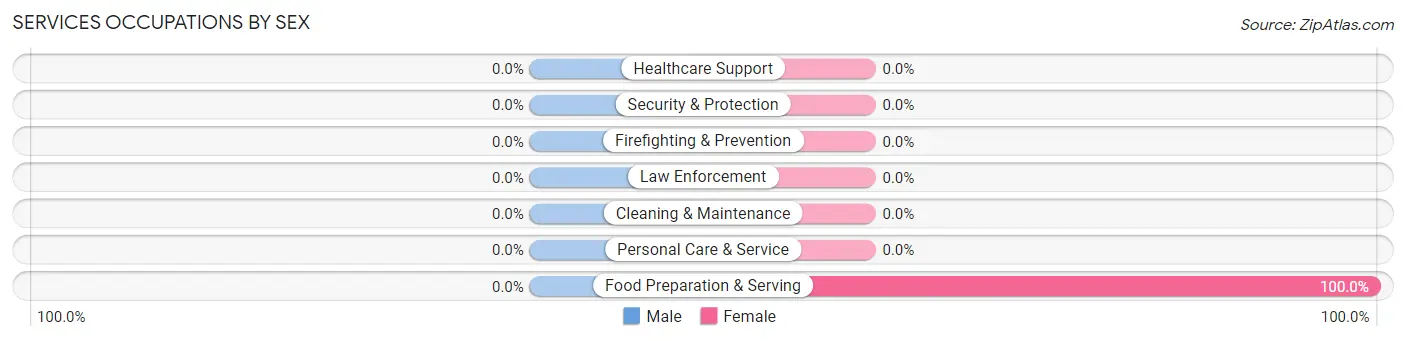
| Occupation | Male | Female |
| Healthcare Support | 0 (0.0%) | 0 (0.0%) |
| Security & Protection | 0 (0.0%) | 0 (0.0%) |
| Firefighting & Prevention | 0 (0.0%) | 0 (0.0%) |
| Law Enforcement | 0 (0.0%) | 0 (0.0%) |
| Food Preparation & Serving | 0 (0.0%) | 10 (100.0%) |
| Cleaning & Maintenance | 0 (0.0%) | 0 (0.0%) |
| Personal Care & Service | 0 (0.0%) | 0 (0.0%) |
| Total (Category) | 0 (0.0%) | 10 (100.0%) |
| Total (Overall) | 34 (40.0%) | 51 (60.0%) |
Sales and Office Occupations
The most common Sales and Office occupations in Good Hope are , and Office & Administration (9 | 10.6%).
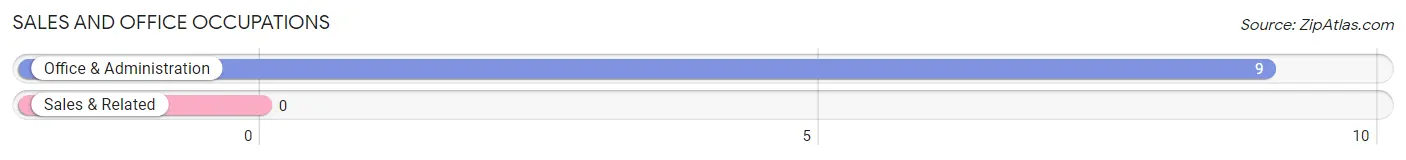
Sales and Office Occupations by Sex
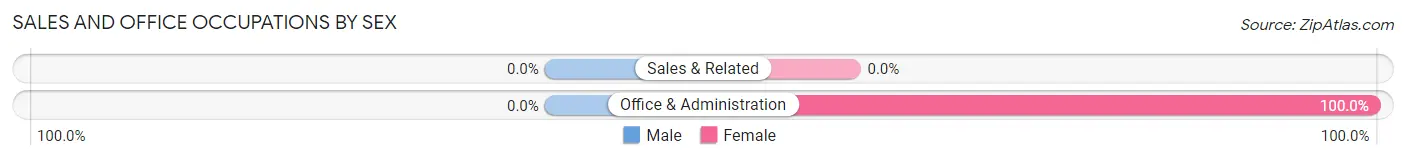
| Occupation | Male | Female |
| Sales & Related | 0 (0.0%) | 0 (0.0%) |
| Office & Administration | 0 (0.0%) | 9 (100.0%) |
| Total (Category) | 0 (0.0%) | 9 (100.0%) |
| Total (Overall) | 34 (40.0%) | 51 (60.0%) |
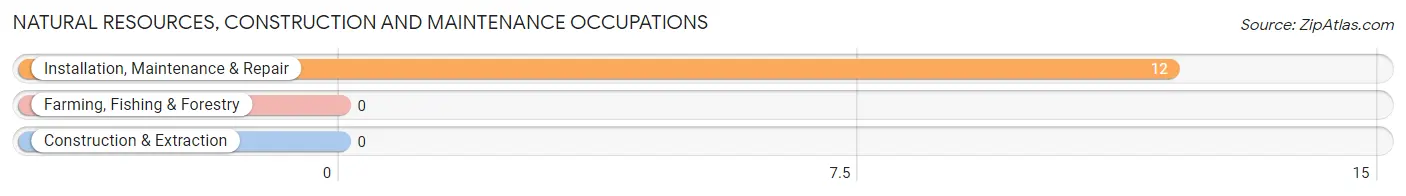
Natural Resources, Construction and Maintenance Occupations
The most common Natural Resources, Construction and Maintenance occupations in Good Hope are , and Installation, Maintenance & Repair (12 | 14.1%).
Natural Resources, Construction and Maintenance Occupations by Sex
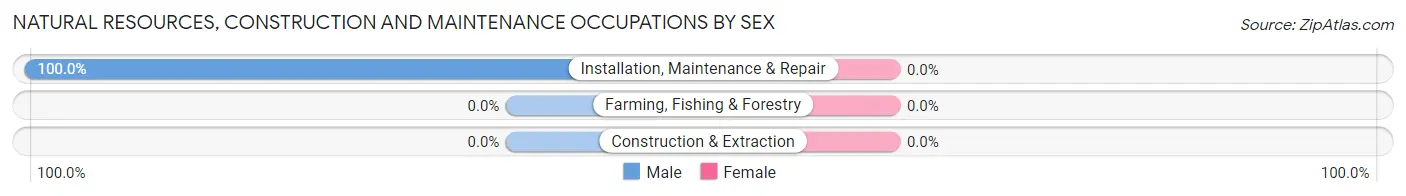
| Occupation | Male | Female |
| Farming, Fishing & Forestry | 0 (0.0%) | 0 (0.0%) |
| Construction & Extraction | 0 (0.0%) | 0 (0.0%) |
| Installation, Maintenance & Repair | 12 (100.0%) | 0 (0.0%) |
| Total (Category) | 12 (100.0%) | 0 (0.0%) |
| Total (Overall) | 34 (40.0%) | 51 (60.0%) |
Production, Transportation and Moving Occupations
The most common Production, Transportation and Moving occupations in Good Hope are , and Material Moving (12 | 14.1%).
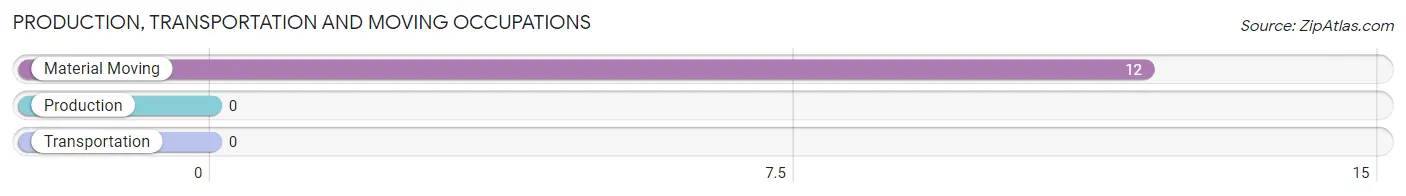
Production, Transportation and Moving Occupations by Sex
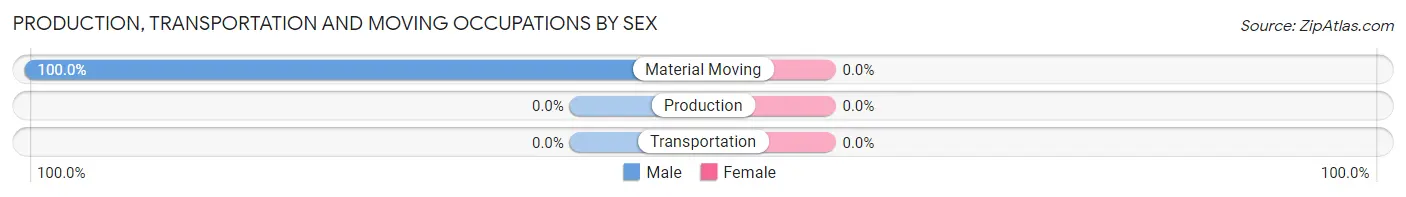
| Occupation | Male | Female |
| Production | 0 (0.0%) | 0 (0.0%) |
| Transportation | 0 (0.0%) | 0 (0.0%) |
| Material Moving | 12 (100.0%) | 0 (0.0%) |
| Total (Category) | 12 (100.0%) | 0 (0.0%) |
| Total (Overall) | 34 (40.0%) | 51 (60.0%) |
Employment Industries by Sex in Good Hope
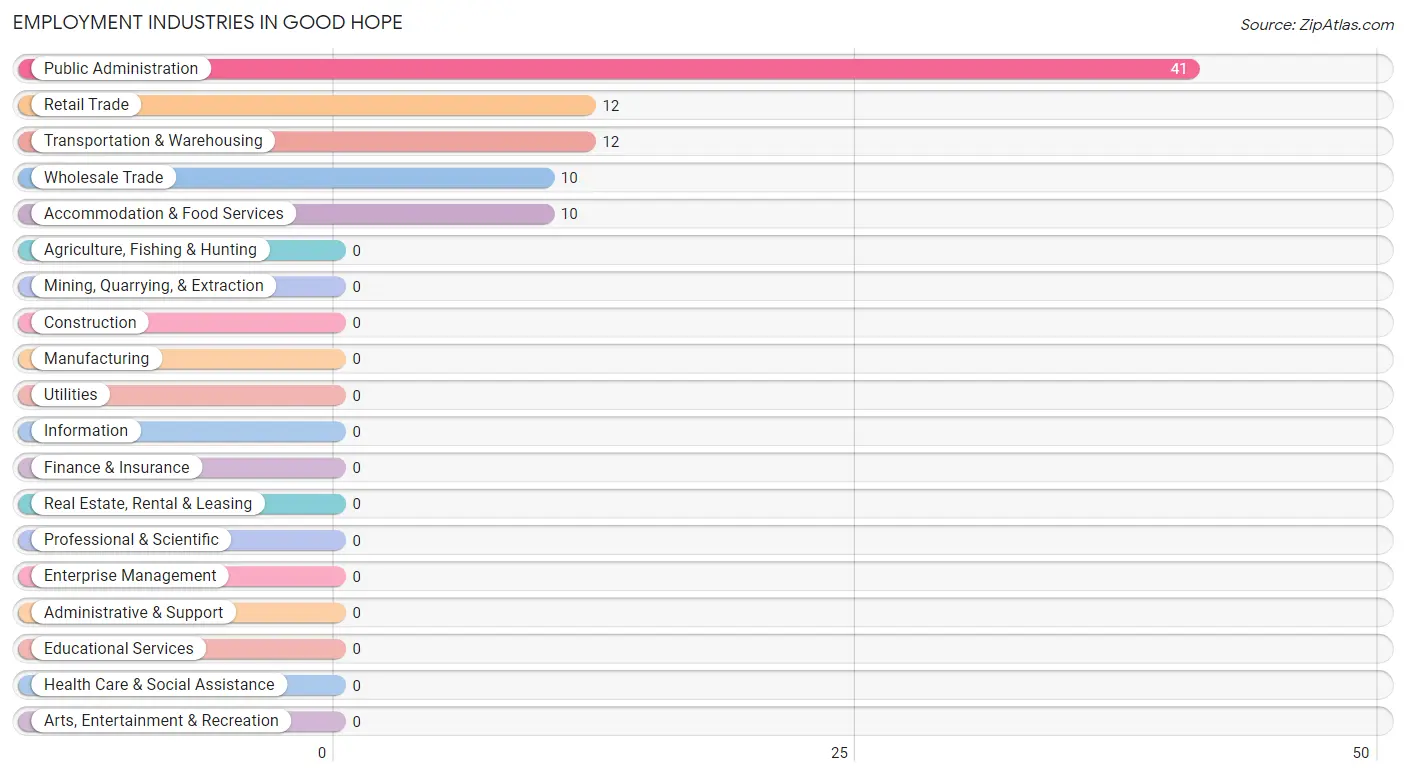
Employment Industries in Good Hope
The major employment industries in Good Hope include Public Administration (41 | 48.2%), Retail Trade (12 | 14.1%), Transportation & Warehousing (12 | 14.1%), Wholesale Trade (10 | 11.8%), and Accommodation & Food Services (10 | 11.8%).
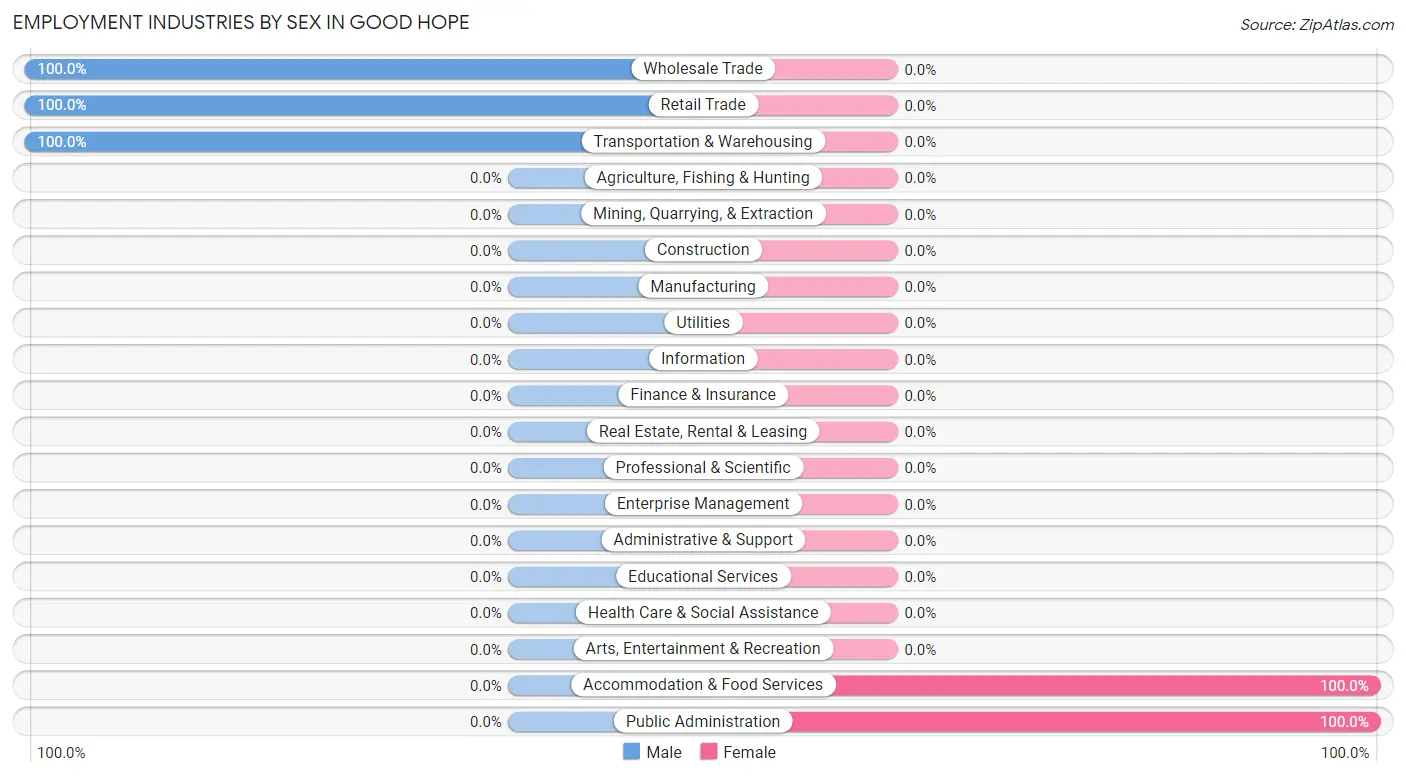
Employment Industries by Sex in Good Hope
The Good Hope industries that see more men than women are Wholesale Trade (100.0%), Retail Trade (100.0%), and Transportation & Warehousing (100.0%), whereas the industries that tend to have a higher number of women are Accommodation & Food Services (100.0%), and Public Administration (100.0%).
| Industry | Male | Female |
| Agriculture, Fishing & Hunting | 0 (0.0%) | 0 (0.0%) |
| Mining, Quarrying, & Extraction | 0 (0.0%) | 0 (0.0%) |
| Construction | 0 (0.0%) | 0 (0.0%) |
| Manufacturing | 0 (0.0%) | 0 (0.0%) |
| Wholesale Trade | 10 (100.0%) | 0 (0.0%) |
| Retail Trade | 12 (100.0%) | 0 (0.0%) |
| Transportation & Warehousing | 12 (100.0%) | 0 (0.0%) |
| Utilities | 0 (0.0%) | 0 (0.0%) |
| Information | 0 (0.0%) | 0 (0.0%) |
| Finance & Insurance | 0 (0.0%) | 0 (0.0%) |
| Real Estate, Rental & Leasing | 0 (0.0%) | 0 (0.0%) |
| Professional & Scientific | 0 (0.0%) | 0 (0.0%) |
| Enterprise Management | 0 (0.0%) | 0 (0.0%) |
| Administrative & Support | 0 (0.0%) | 0 (0.0%) |
| Educational Services | 0 (0.0%) | 0 (0.0%) |
| Health Care & Social Assistance | 0 (0.0%) | 0 (0.0%) |
| Arts, Entertainment & Recreation | 0 (0.0%) | 0 (0.0%) |
| Accommodation & Food Services | 0 (0.0%) | 10 (100.0%) |
| Public Administration | 0 (0.0%) | 41 (100.0%) |
| Total | 34 (40.0%) | 51 (60.0%) |
Education in Good Hope
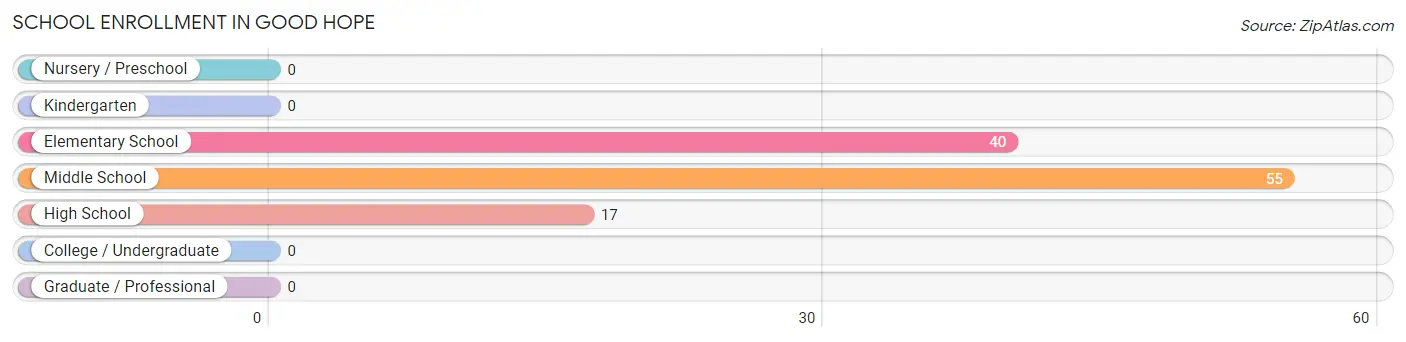
School Enrollment in Good Hope
The most common levels of schooling among the 112 students in Good Hope are middle school (55 | 49.1%), elementary school (40 | 35.7%), and high school (17 | 15.2%).
| School Level | # Students | % Students |
| Nursery / Preschool | 0 | 0.0% |
| Kindergarten | 0 | 0.0% |
| Elementary School | 40 | 35.7% |
| Middle School | 55 | 49.1% |
| High School | 17 | 15.2% |
| College / Undergraduate | 0 | 0.0% |
| Graduate / Professional | 0 | 0.0% |
| Total | 112 | 100.0% |
School Enrollment by Age by Funding Source in Good Hope
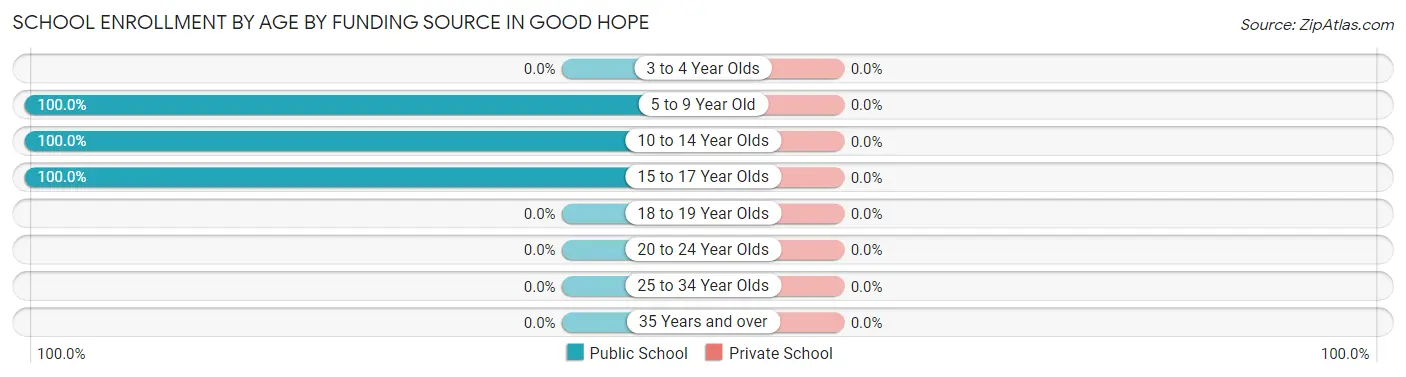
| Age Bracket | Public School | Private School |
| 3 to 4 Year Olds | 0 (0.0%) | 0 (0.0%) |
| 5 to 9 Year Old | 40 (100.0%) | 0 (0.0%) |
| 10 to 14 Year Olds | 62 (100.0%) | 0 (0.0%) |
| 15 to 17 Year Olds | 10 (100.0%) | 0 (0.0%) |
| 18 to 19 Year Olds | 0 (0.0%) | 0 (0.0%) |
| 20 to 24 Year Olds | 0 (0.0%) | 0 (0.0%) |
| 25 to 34 Year Olds | 0 (0.0%) | 0 (0.0%) |
| 35 Years and over | 0 (0.0%) | 0 (0.0%) |
| Total | 112 (100.0%) | 0 (0.0%) |
Educational Attainment by Field of Study in Good Hope
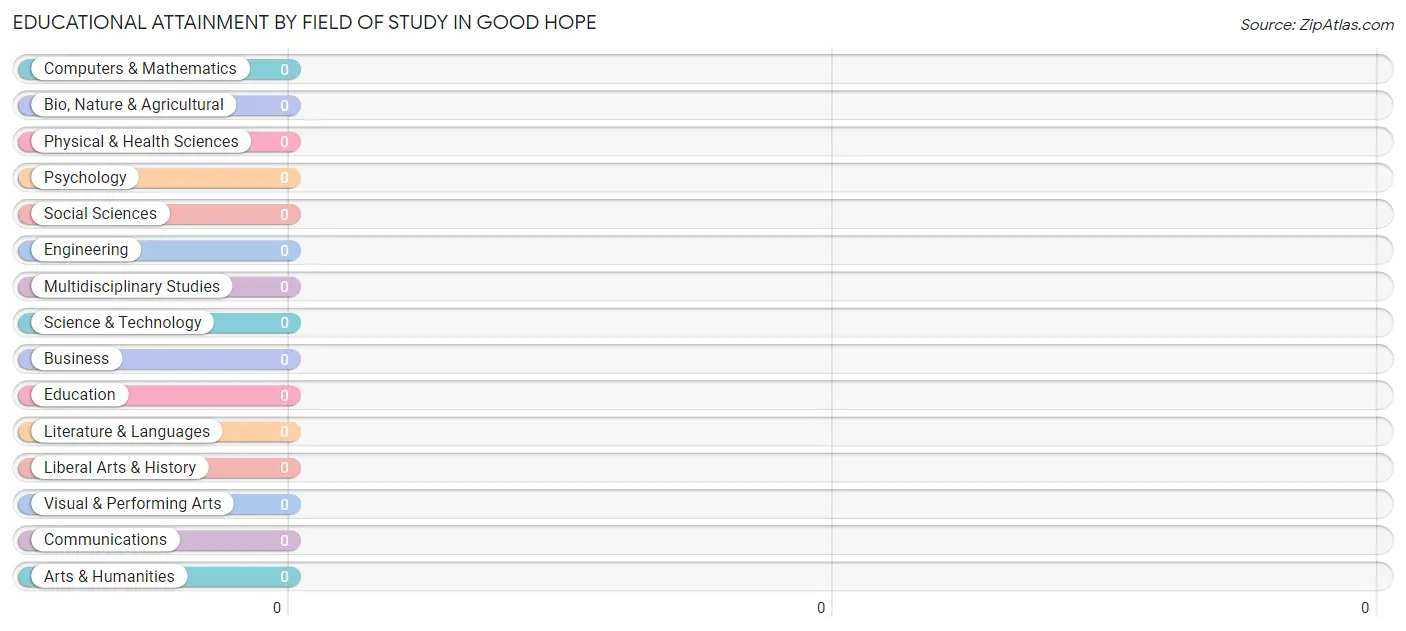
| Field of Study | # Graduates | % Graduates |
| Computers & Mathematics | 0 | 0.0% |
| Bio, Nature & Agricultural | 0 | 0.0% |
| Physical & Health Sciences | 0 | 0.0% |
| Psychology | 0 | 0.0% |
| Social Sciences | 0 | 0.0% |
| Engineering | 0 | 0.0% |
| Multidisciplinary Studies | 0 | 0.0% |
| Science & Technology | 0 | 0.0% |
| Business | 0 | 0.0% |
| Education | 0 | 0.0% |
| Literature & Languages | 0 | 0.0% |
| Liberal Arts & History | 0 | 0.0% |
| Visual & Performing Arts | 0 | 0.0% |
| Communications | 0 | 0.0% |
| Arts & Humanities | 0 | 0.0% |
| Total | 0 | 0.0% |
Transportation & Commute in Good Hope
Vehicle Availability by Sex in Good Hope
The most prevalent vehicle ownership categories in Good Hope are males with 3 vehicles (22, accounting for 64.7%) and females with 3 vehicles (19, making up 43.1%).
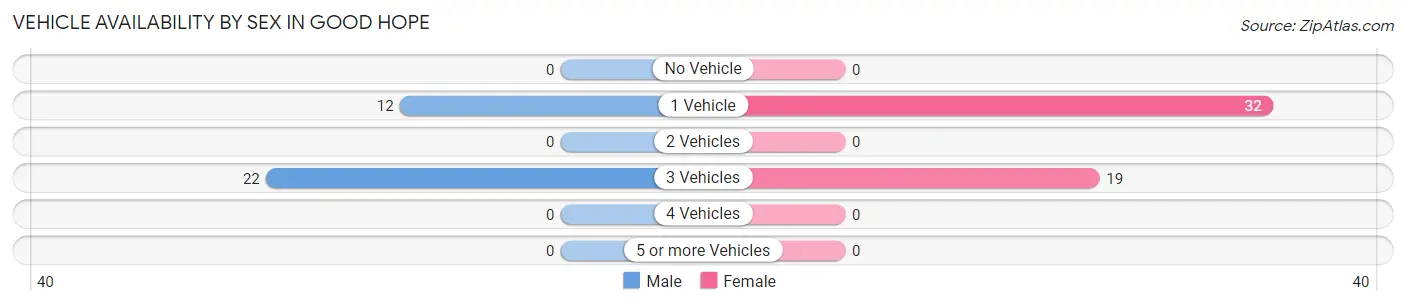
| Vehicles Available | Male | Female |
| No Vehicle | 0 (0.0%) | 0 (0.0%) |
| 1 Vehicle | 12 (35.3%) | 32 (62.7%) |
| 2 Vehicles | 0 (0.0%) | 0 (0.0%) |
| 3 Vehicles | 22 (64.7%) | 19 (37.2%) |
| 4 Vehicles | 0 (0.0%) | 0 (0.0%) |
| 5 or more Vehicles | 0 (0.0%) | 0 (0.0%) |
| Total | 34 (100.0%) | 51 (100.0%) |
Commute Time in Good Hope
The most frequently occuring commute durations in Good Hope are 10 to 14 minutes (63 commuters, 74.1%), 35 to 39 minutes (12 commuters, 14.1%), and 5 to 9 minutes (10 commuters, 11.8%).
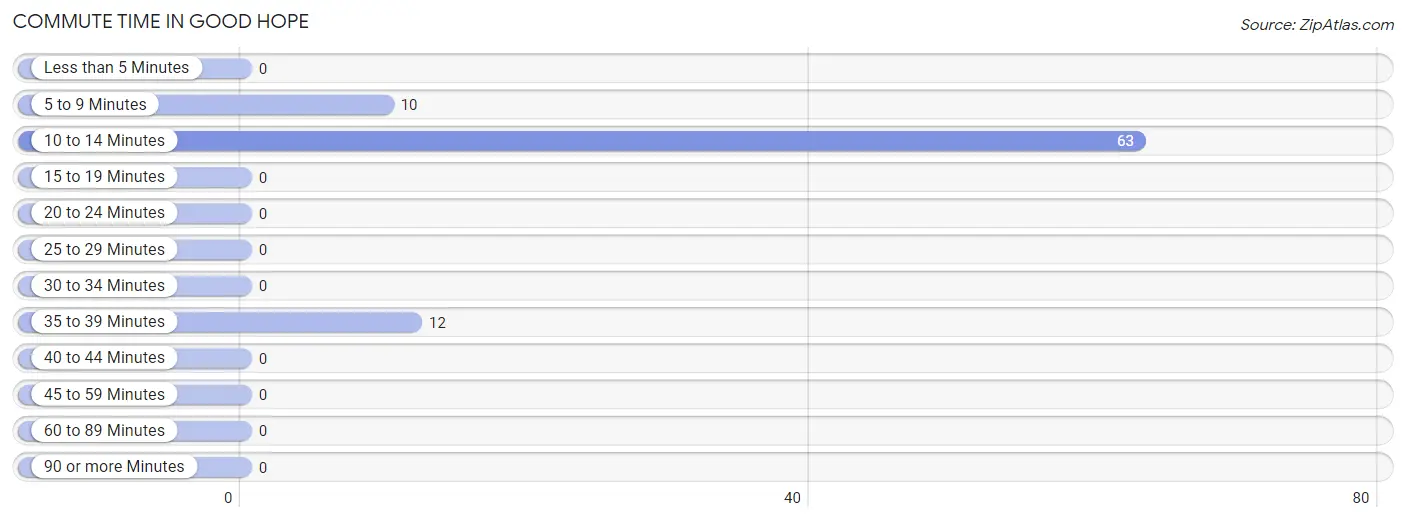
| Commute Time | # Commuters | % Commuters |
| Less than 5 Minutes | 0 | 0.0% |
| 5 to 9 Minutes | 10 | 11.8% |
| 10 to 14 Minutes | 63 | 74.1% |
| 15 to 19 Minutes | 0 | 0.0% |
| 20 to 24 Minutes | 0 | 0.0% |
| 25 to 29 Minutes | 0 | 0.0% |
| 30 to 34 Minutes | 0 | 0.0% |
| 35 to 39 Minutes | 12 | 14.1% |
| 40 to 44 Minutes | 0 | 0.0% |
| 45 to 59 Minutes | 0 | 0.0% |
| 60 to 89 Minutes | 0 | 0.0% |
| 90 or more Minutes | 0 | 0.0% |
Commute Time by Sex in Good Hope
The most common commute times in Good Hope are 10 to 14 minutes (12 commuters, 35.3%) for males and 10 to 14 minutes (51 commuters, 100.0%) for females.
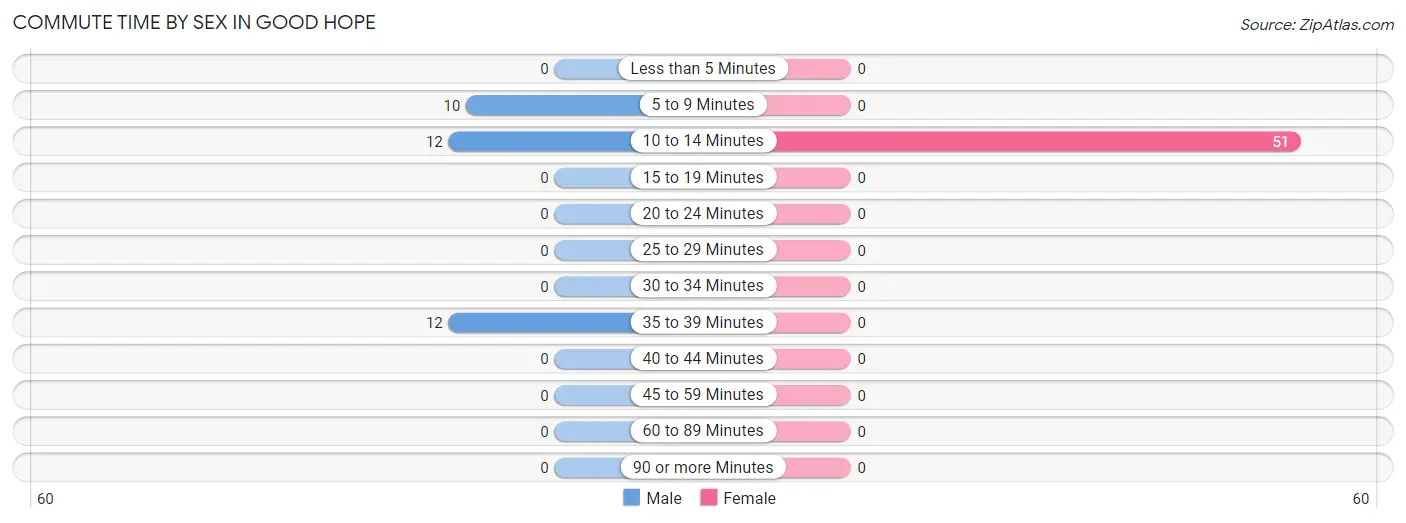
| Commute Time | Male | Female |
| Less than 5 Minutes | 0 (0.0%) | 0 (0.0%) |
| 5 to 9 Minutes | 10 (29.4%) | 0 (0.0%) |
| 10 to 14 Minutes | 12 (35.3%) | 51 (100.0%) |
| 15 to 19 Minutes | 0 (0.0%) | 0 (0.0%) |
| 20 to 24 Minutes | 0 (0.0%) | 0 (0.0%) |
| 25 to 29 Minutes | 0 (0.0%) | 0 (0.0%) |
| 30 to 34 Minutes | 0 (0.0%) | 0 (0.0%) |
| 35 to 39 Minutes | 12 (35.3%) | 0 (0.0%) |
| 40 to 44 Minutes | 0 (0.0%) | 0 (0.0%) |
| 45 to 59 Minutes | 0 (0.0%) | 0 (0.0%) |
| 60 to 89 Minutes | 0 (0.0%) | 0 (0.0%) |
| 90 or more Minutes | 0 (0.0%) | 0 (0.0%) |
Time of Departure to Work by Sex in Good Hope
The most frequent times of departure to work in Good Hope are 5:00 AM to 5:29 AM (12, 35.3%) for males and 6:30 AM to 6:59 AM (32, 62.7%) for females.
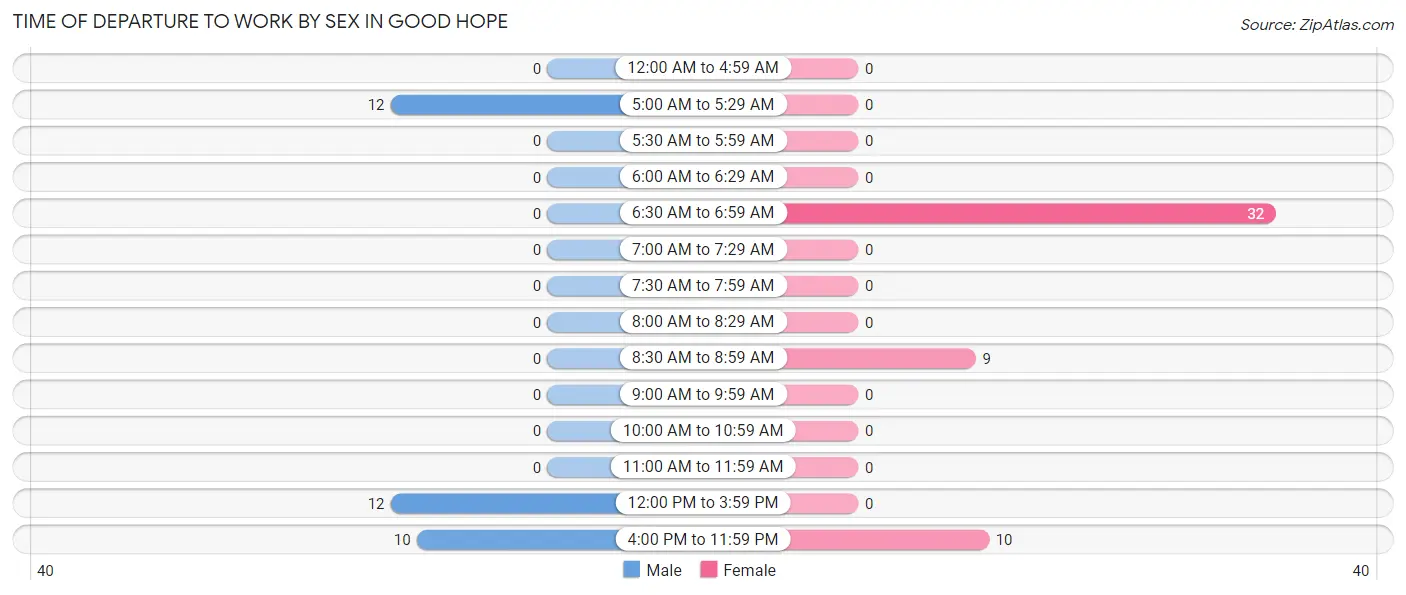
| Time of Departure | Male | Female |
| 12:00 AM to 4:59 AM | 0 (0.0%) | 0 (0.0%) |
| 5:00 AM to 5:29 AM | 12 (35.3%) | 0 (0.0%) |
| 5:30 AM to 5:59 AM | 0 (0.0%) | 0 (0.0%) |
| 6:00 AM to 6:29 AM | 0 (0.0%) | 0 (0.0%) |
| 6:30 AM to 6:59 AM | 0 (0.0%) | 32 (62.7%) |
| 7:00 AM to 7:29 AM | 0 (0.0%) | 0 (0.0%) |
| 7:30 AM to 7:59 AM | 0 (0.0%) | 0 (0.0%) |
| 8:00 AM to 8:29 AM | 0 (0.0%) | 0 (0.0%) |
| 8:30 AM to 8:59 AM | 0 (0.0%) | 9 (17.6%) |
| 9:00 AM to 9:59 AM | 0 (0.0%) | 0 (0.0%) |
| 10:00 AM to 10:59 AM | 0 (0.0%) | 0 (0.0%) |
| 11:00 AM to 11:59 AM | 0 (0.0%) | 0 (0.0%) |
| 12:00 PM to 3:59 PM | 12 (35.3%) | 0 (0.0%) |
| 4:00 PM to 11:59 PM | 10 (29.4%) | 10 (19.6%) |
| Total | 34 (100.0%) | 51 (100.0%) |
Housing Occupancy in Good Hope
Occupancy by Ownership in Good Hope
Of the total 112 dwellings in Good Hope, owner-occupied units account for 80 (71.4%), while renter-occupied units make up 32 (28.6%).
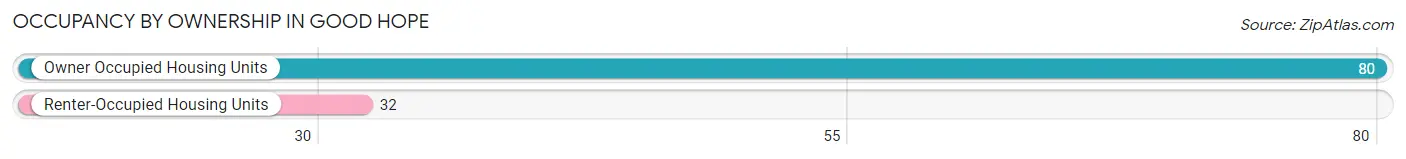
| Occupancy | # Housing Units | % Housing Units |
| Owner Occupied Housing Units | 80 | 71.4% |
| Renter-Occupied Housing Units | 32 | 28.6% |
| Total Occupied Housing Units | 112 | 100.0% |
Occupancy by Household Size in Good Hope
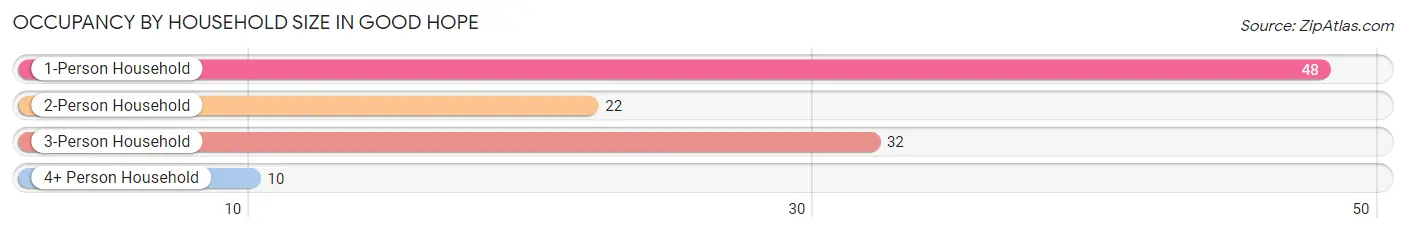
| Household Size | # Housing Units | % Housing Units |
| 1-Person Household | 48 | 42.9% |
| 2-Person Household | 22 | 19.6% |
| 3-Person Household | 32 | 28.6% |
| 4+ Person Household | 10 | 8.9% |
| Total Housing Units | 112 | 100.0% |
Occupancy by Ownership by Household Size in Good Hope
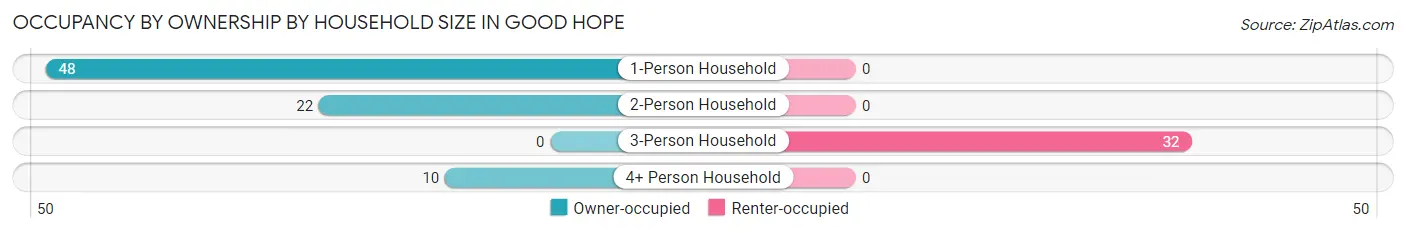
| Household Size | Owner-occupied | Renter-occupied |
| 1-Person Household | 48 (100.0%) | 0 (0.0%) |
| 2-Person Household | 22 (100.0%) | 0 (0.0%) |
| 3-Person Household | 0 (0.0%) | 32 (100.0%) |
| 4+ Person Household | 10 (100.0%) | 0 (0.0%) |
| Total Housing Units | 80 (71.4%) | 32 (28.6%) |
Occupancy by Educational Attainment in Good Hope
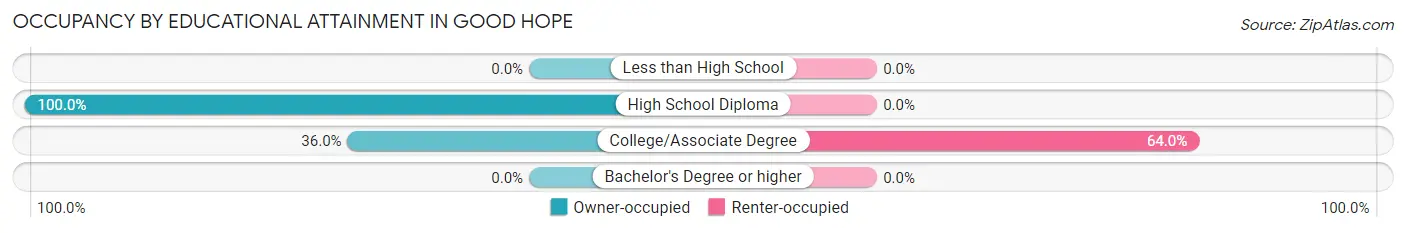
| Household Size | Owner-occupied | Renter-occupied |
| Less than High School | 0 (0.0%) | 0 (0.0%) |
| High School Diploma | 62 (100.0%) | 0 (0.0%) |
| College/Associate Degree | 18 (36.0%) | 32 (64.0%) |
| Bachelor's Degree or higher | 0 (0.0%) | 0 (0.0%) |
Occupancy by Age of Householder in Good Hope
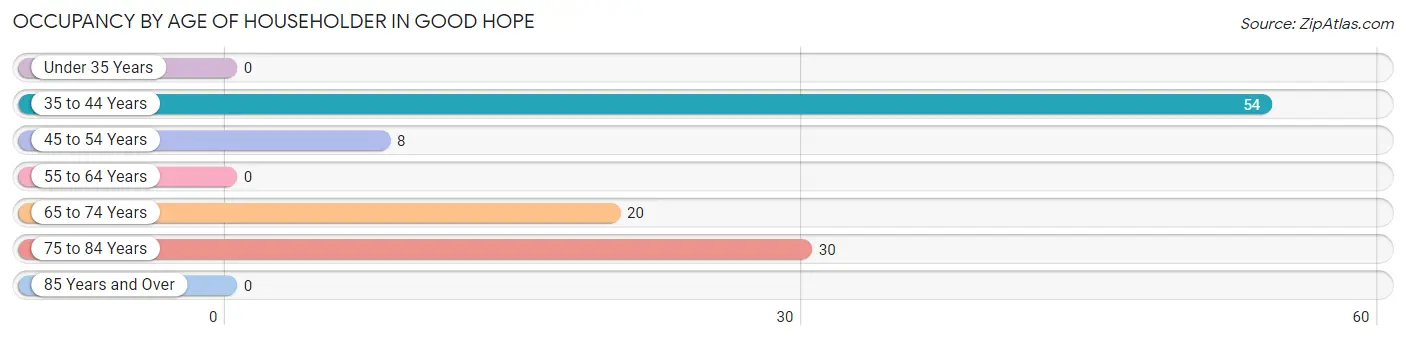
| Age Bracket | # Households | % Households |
| Under 35 Years | 0 | 0.0% |
| 35 to 44 Years | 54 | 48.2% |
| 45 to 54 Years | 8 | 7.1% |
| 55 to 64 Years | 0 | 0.0% |
| 65 to 74 Years | 20 | 17.9% |
| 75 to 84 Years | 30 | 26.8% |
| 85 Years and Over | 0 | 0.0% |
| Total | 112 | 100.0% |
Housing Finances in Good Hope
Median Income by Occupancy in Good Hope
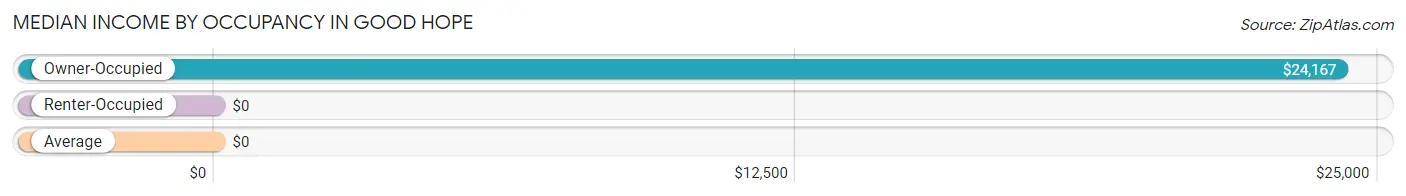
| Occupancy Type | # Households | Median Income |
| Owner-Occupied | 80 (71.4%) | $24,167 |
| Renter-Occupied | 32 (28.6%) | $0 |
| Average | 112 (100.0%) | $0 |
Occupancy by Householder Income Bracket in Good Hope
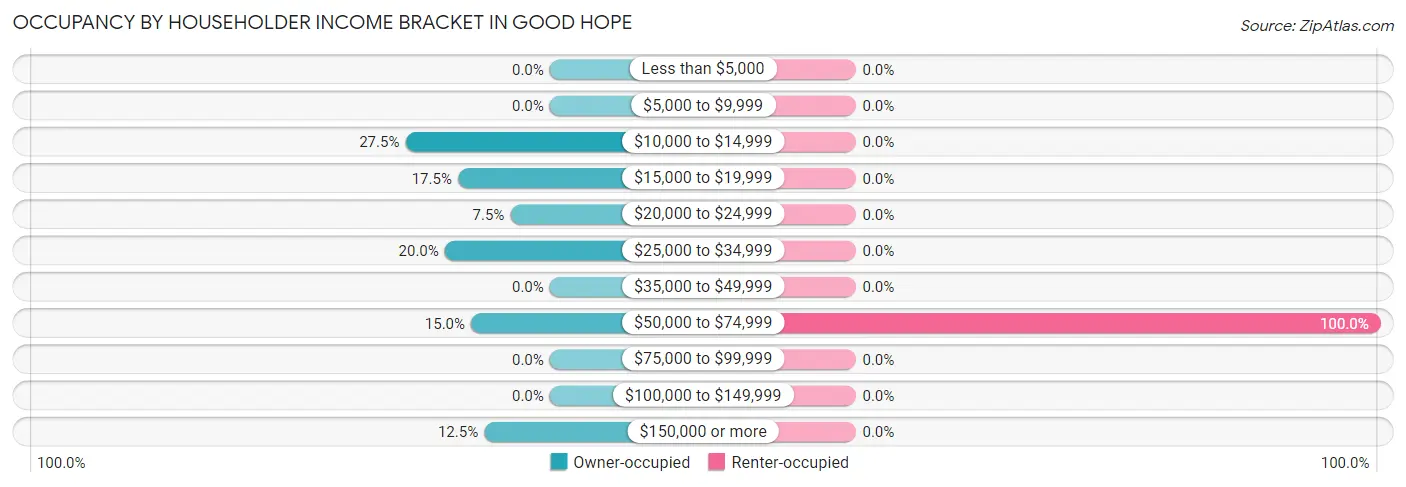
| Income Bracket | Owner-occupied | Renter-occupied |
| Less than $5,000 | 0 (0.0%) | 0 (0.0%) |
| $5,000 to $9,999 | 0 (0.0%) | 0 (0.0%) |
| $10,000 to $14,999 | 22 (27.5%) | 0 (0.0%) |
| $15,000 to $19,999 | 14 (17.5%) | 0 (0.0%) |
| $20,000 to $24,999 | 6 (7.5%) | 0 (0.0%) |
| $25,000 to $34,999 | 16 (20.0%) | 0 (0.0%) |
| $35,000 to $49,999 | 0 (0.0%) | 0 (0.0%) |
| $50,000 to $74,999 | 12 (15.0%) | 32 (100.0%) |
| $75,000 to $99,999 | 0 (0.0%) | 0 (0.0%) |
| $100,000 to $149,999 | 0 (0.0%) | 0 (0.0%) |
| $150,000 or more | 10 (12.5%) | 0 (0.0%) |
| Total | 80 (100.0%) | 32 (100.0%) |
Monthly Housing Cost Tiers in Good Hope
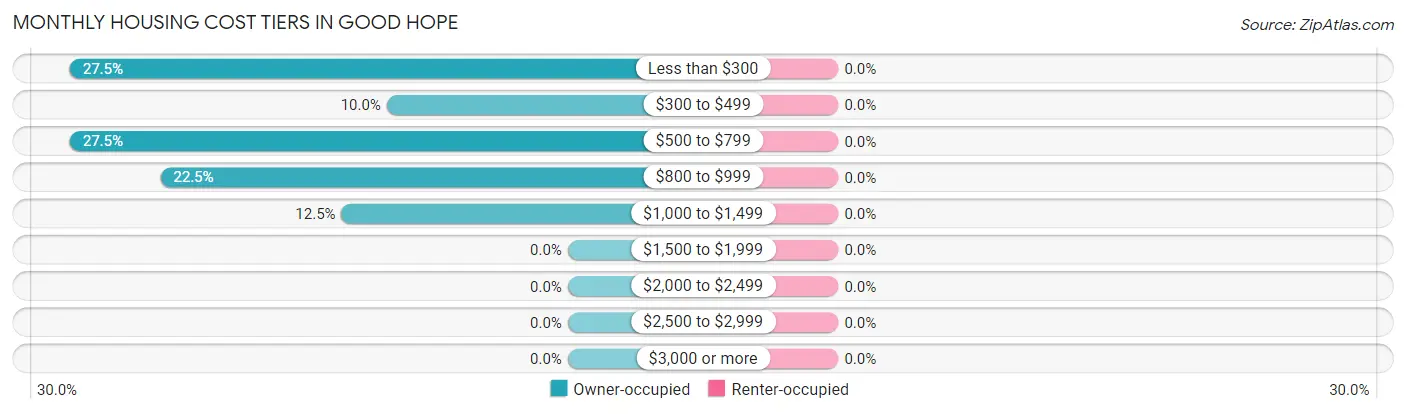
| Monthly Cost | Owner-occupied | Renter-occupied |
| Less than $300 | 22 (27.5%) | 0 (0.0%) |
| $300 to $499 | 8 (10.0%) | 0 (0.0%) |
| $500 to $799 | 22 (27.5%) | 0 (0.0%) |
| $800 to $999 | 18 (22.5%) | 0 (0.0%) |
| $1,000 to $1,499 | 10 (12.5%) | 0 (0.0%) |
| $1,500 to $1,999 | 0 (0.0%) | 0 (0.0%) |
| $2,000 to $2,499 | 0 (0.0%) | 0 (0.0%) |
| $2,500 to $2,999 | 0 (0.0%) | 0 (0.0%) |
| $3,000 or more | 0 (0.0%) | 0 (0.0%) |
| Total | 80 (100.0%) | 32 (100.0%) |
Physical Housing Characteristics in Good Hope
Housing Structures in Good Hope
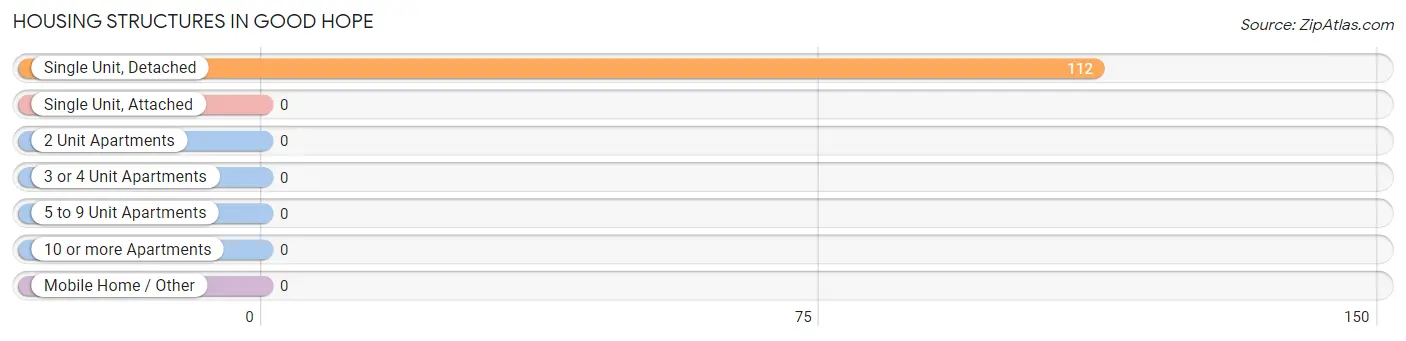
| Structure Type | # Housing Units | % Housing Units |
| Single Unit, Detached | 112 | 100.0% |
| Single Unit, Attached | 0 | 0.0% |
| 2 Unit Apartments | 0 | 0.0% |
| 3 or 4 Unit Apartments | 0 | 0.0% |
| 5 to 9 Unit Apartments | 0 | 0.0% |
| 10 or more Apartments | 0 | 0.0% |
| Mobile Home / Other | 0 | 0.0% |
| Total | 112 | 100.0% |
Housing Structures by Occupancy in Good Hope
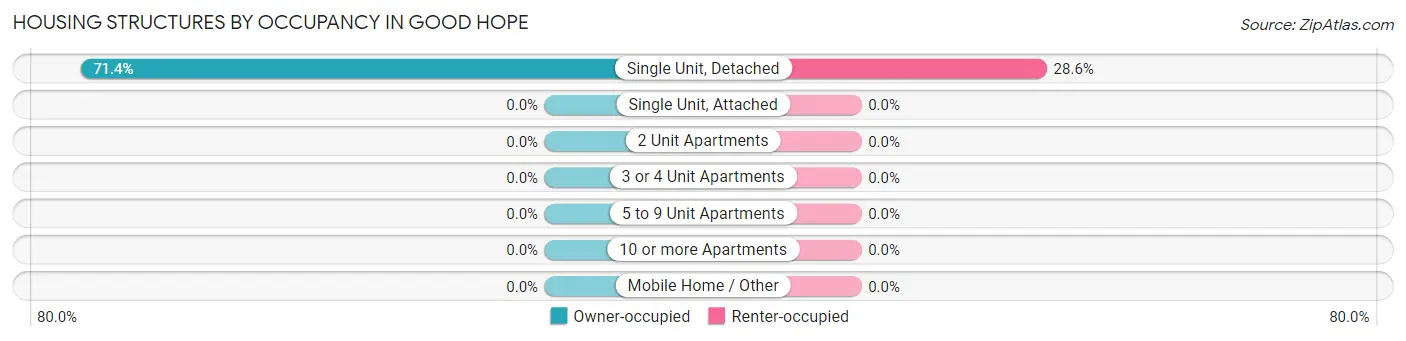
| Structure Type | Owner-occupied | Renter-occupied |
| Single Unit, Detached | 80 (71.4%) | 32 (28.6%) |
| Single Unit, Attached | 0 (0.0%) | 0 (0.0%) |
| 2 Unit Apartments | 0 (0.0%) | 0 (0.0%) |
| 3 or 4 Unit Apartments | 0 (0.0%) | 0 (0.0%) |
| 5 to 9 Unit Apartments | 0 (0.0%) | 0 (0.0%) |
| 10 or more Apartments | 0 (0.0%) | 0 (0.0%) |
| Mobile Home / Other | 0 (0.0%) | 0 (0.0%) |
| Total | 80 (71.4%) | 32 (28.6%) |
Housing Structures by Number of Rooms in Good Hope
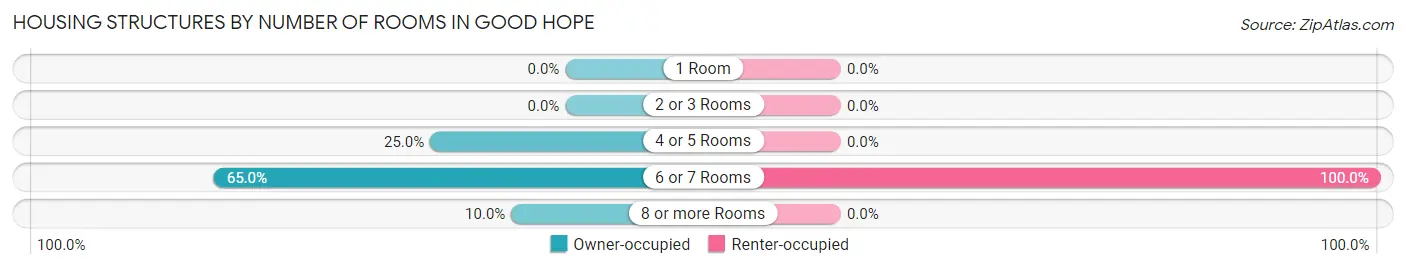
| Number of Rooms | Owner-occupied | Renter-occupied |
| 1 Room | 0 (0.0%) | 0 (0.0%) |
| 2 or 3 Rooms | 0 (0.0%) | 0 (0.0%) |
| 4 or 5 Rooms | 20 (25.0%) | 0 (0.0%) |
| 6 or 7 Rooms | 52 (65.0%) | 32 (100.0%) |
| 8 or more Rooms | 8 (10.0%) | 0 (0.0%) |
| Total | 80 (100.0%) | 32 (100.0%) |
Housing Structure by Heating Type in Good Hope
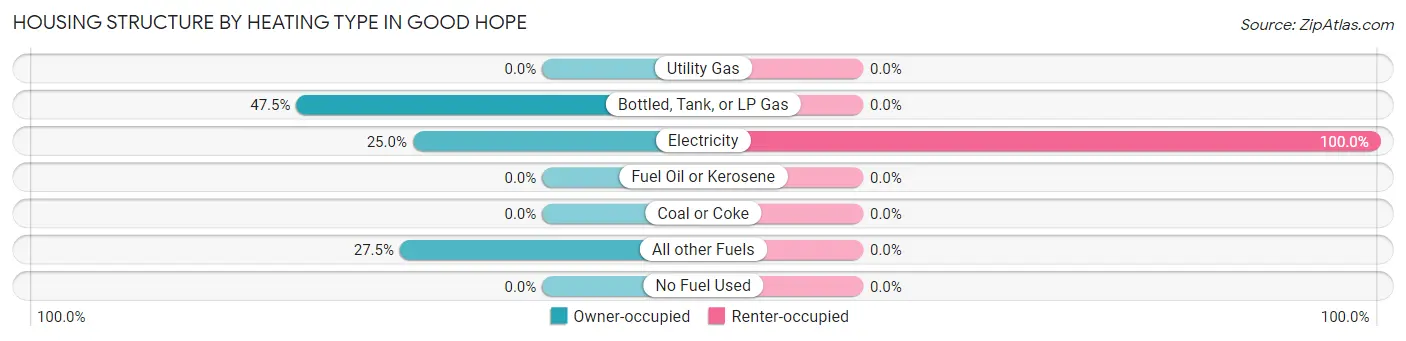
| Heating Type | Owner-occupied | Renter-occupied |
| Utility Gas | 0 (0.0%) | 0 (0.0%) |
| Bottled, Tank, or LP Gas | 38 (47.5%) | 0 (0.0%) |
| Electricity | 20 (25.0%) | 32 (100.0%) |
| Fuel Oil or Kerosene | 0 (0.0%) | 0 (0.0%) |
| Coal or Coke | 0 (0.0%) | 0 (0.0%) |
| All other Fuels | 22 (27.5%) | 0 (0.0%) |
| No Fuel Used | 0 (0.0%) | 0 (0.0%) |
| Total | 80 (100.0%) | 32 (100.0%) |
Household Vehicle Usage in Good Hope
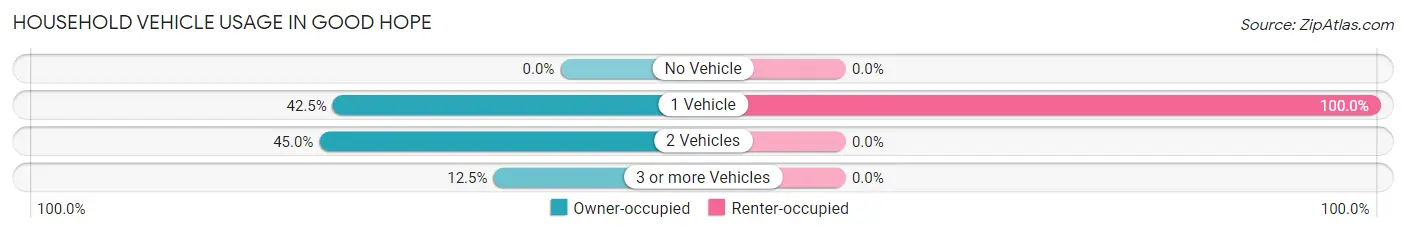
| Vehicles per Household | Owner-occupied | Renter-occupied |
| No Vehicle | 0 (0.0%) | 0 (0.0%) |
| 1 Vehicle | 34 (42.5%) | 32 (100.0%) |
| 2 Vehicles | 36 (45.0%) | 0 (0.0%) |
| 3 or more Vehicles | 10 (12.5%) | 0 (0.0%) |
| Total | 80 (100.0%) | 32 (100.0%) |
Real Estate & Mortgages in Good Hope
Real Estate and Mortgage Overview in Good Hope
| Characteristic | Without Mortgage | With Mortgage |
| Housing Units | 30 | 50 |
| Median Property Value | - | - |
| Median Household Income | $30,156 | $10 |
| Monthly Housing Costs | $275 | $0 |
| Real Estate Taxes | - | - |
Property Value by Mortgage Status in Good Hope
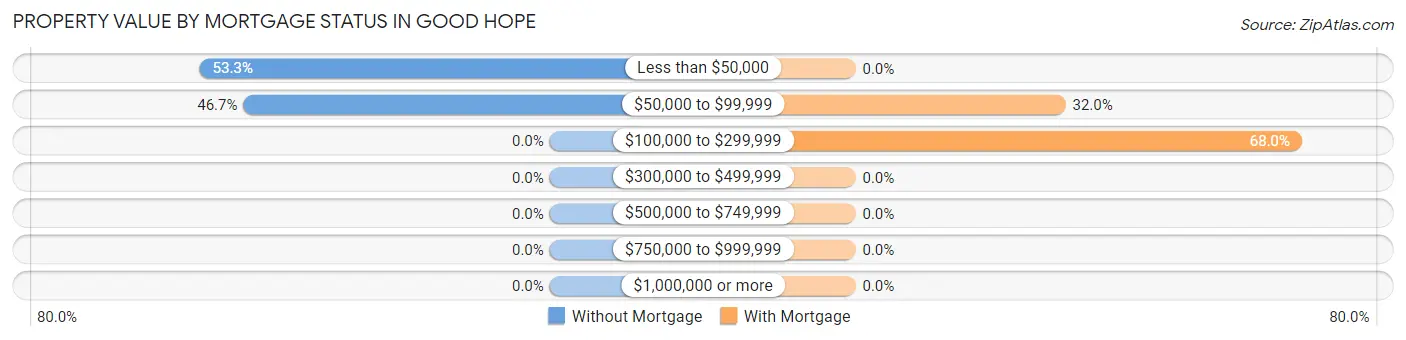
| Property Value | Without Mortgage | With Mortgage |
| Less than $50,000 | 16 (53.3%) | 0 (0.0%) |
| $50,000 to $99,999 | 14 (46.7%) | 16 (32.0%) |
| $100,000 to $299,999 | 0 (0.0%) | 34 (68.0%) |
| $300,000 to $499,999 | 0 (0.0%) | 0 (0.0%) |
| $500,000 to $749,999 | 0 (0.0%) | 0 (0.0%) |
| $750,000 to $999,999 | 0 (0.0%) | 0 (0.0%) |
| $1,000,000 or more | 0 (0.0%) | 0 (0.0%) |
| Total | 30 (100.0%) | 50 (100.0%) |
Household Income by Mortgage Status in Good Hope
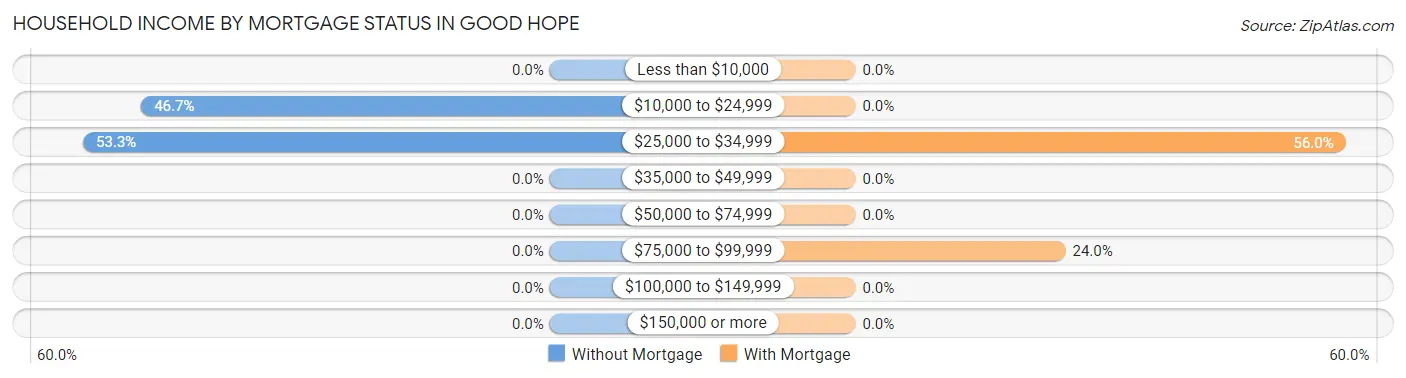
| Household Income | Without Mortgage | With Mortgage |
| Less than $10,000 | 0 (0.0%) | 0 (0.0%) |
| $10,000 to $24,999 | 14 (46.7%) | 0 (0.0%) |
| $25,000 to $34,999 | 16 (53.3%) | 28 (56.0%) |
| $35,000 to $49,999 | 0 (0.0%) | 0 (0.0%) |
| $50,000 to $74,999 | 0 (0.0%) | 0 (0.0%) |
| $75,000 to $99,999 | 0 (0.0%) | 12 (24.0%) |
| $100,000 to $149,999 | 0 (0.0%) | 0 (0.0%) |
| $150,000 or more | 0 (0.0%) | 0 (0.0%) |
| Total | 30 (100.0%) | 50 (100.0%) |
Property Value to Household Income Ratio in Good Hope
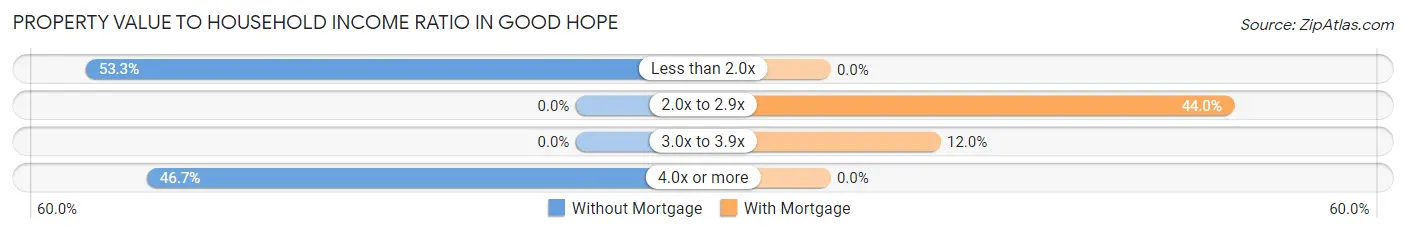
| Value-to-Income Ratio | Without Mortgage | With Mortgage |
| Less than 2.0x | 16 (53.3%) | 0 (0.0%) |
| 2.0x to 2.9x | 0 (0.0%) | 22 (44.0%) |
| 3.0x to 3.9x | 0 (0.0%) | 6 (12.0%) |
| 4.0x or more | 14 (46.7%) | 0 (0.0%) |
| Total | 30 (100.0%) | 50 (100.0%) |
Real Estate Taxes by Mortgage Status in Good Hope
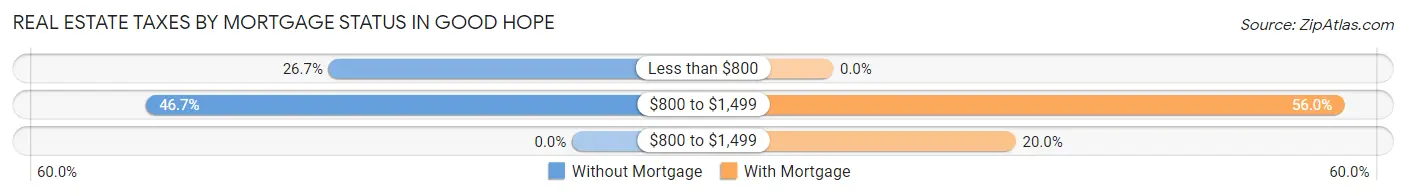
| Property Taxes | Without Mortgage | With Mortgage |
| Less than $800 | 8 (26.7%) | 0 (0.0%) |
| $800 to $1,499 | 14 (46.7%) | 28 (56.0%) |
| $800 to $1,499 | 0 (0.0%) | 10 (20.0%) |
| Total | 30 (100.0%) | 50 (100.0%) |
Health & Disability in Good Hope
Health Insurance Coverage by Age in Good Hope
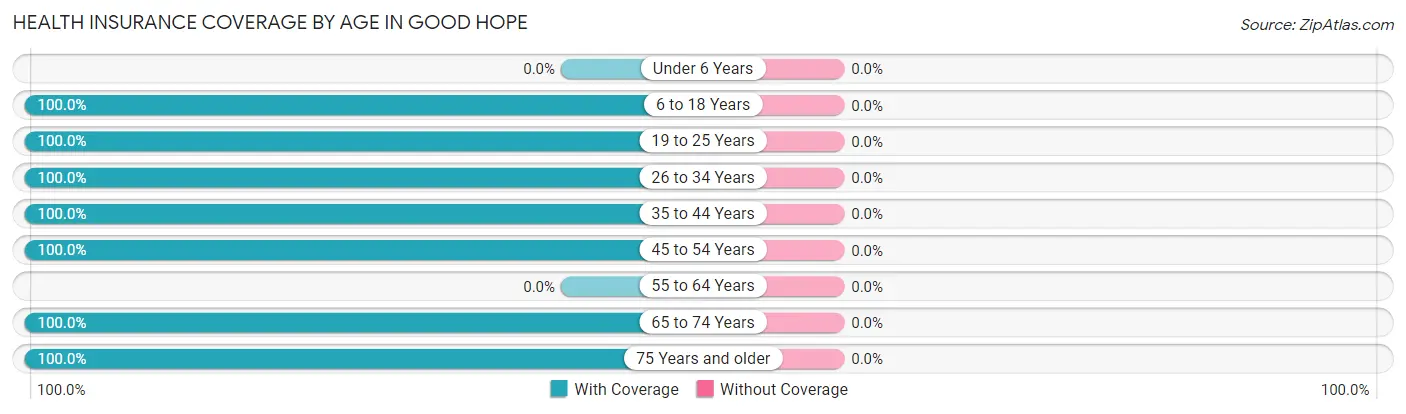
| Age Bracket | With Coverage | Without Coverage |
| Under 6 Years | 0 (0.0%) | 0 (0.0%) |
| 6 to 18 Years | 112 (100.0%) | 0 (0.0%) |
| 19 to 25 Years | 12 (100.0%) | 0 (0.0%) |
| 26 to 34 Years | 9 (100.0%) | 0 (0.0%) |
| 35 to 44 Years | 54 (100.0%) | 0 (0.0%) |
| 45 to 54 Years | 8 (100.0%) | 0 (0.0%) |
| 55 to 64 Years | 0 (0.0%) | 0 (0.0%) |
| 65 to 74 Years | 35 (100.0%) | 0 (0.0%) |
| 75 Years and older | 30 (100.0%) | 0 (0.0%) |
| Total | 260 (100.0%) | 0 (0.0%) |
Health Insurance Coverage by Citizenship Status in Good Hope
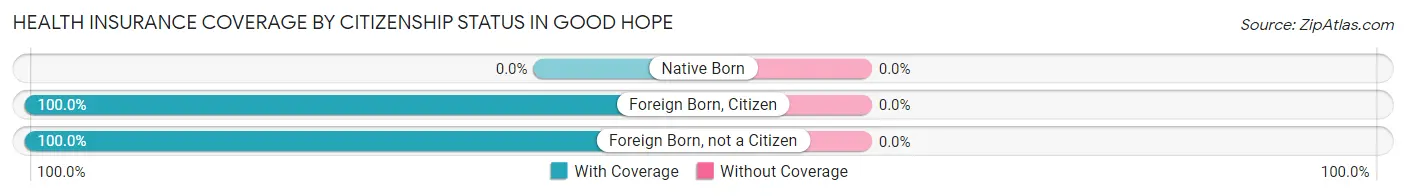
| Citizenship Status | With Coverage | Without Coverage |
| Native Born | 0 (0.0%) | 0 (0.0%) |
| Foreign Born, Citizen | 112 (100.0%) | 0 (0.0%) |
| Foreign Born, not a Citizen | 12 (100.0%) | 0 (0.0%) |
Health Insurance Coverage by Household Income in Good Hope
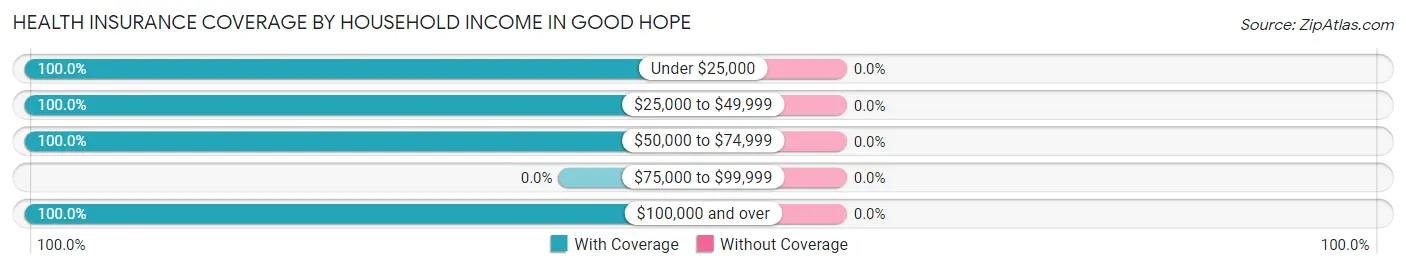
| Household Income | With Coverage | Without Coverage |
| Under $25,000 | 50 (100.0%) | 0 (0.0%) |
| $25,000 to $49,999 | 30 (100.0%) | 0 (0.0%) |
| $50,000 to $74,999 | 130 (100.0%) | 0 (0.0%) |
| $75,000 to $99,999 | 0 (0.0%) | 0 (0.0%) |
| $100,000 and over | 50 (100.0%) | 0 (0.0%) |
Public vs Private Health Insurance Coverage by Age in Good Hope
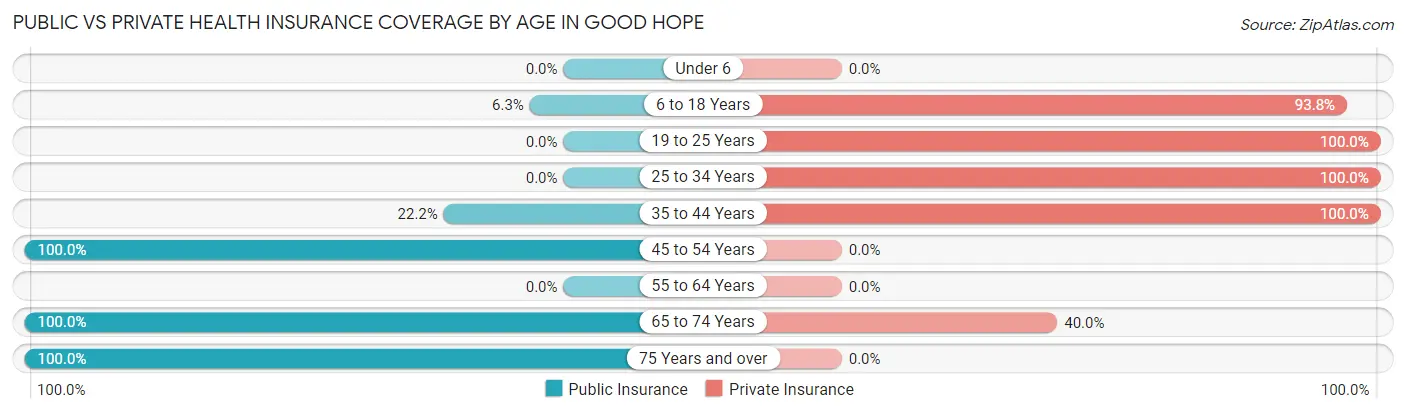
| Age Bracket | Public Insurance | Private Insurance |
| Under 6 | 0 (0.0%) | 0 (0.0%) |
| 6 to 18 Years | 7 (6.2%) | 105 (93.8%) |
| 19 to 25 Years | 0 (0.0%) | 12 (100.0%) |
| 25 to 34 Years | 0 (0.0%) | 9 (100.0%) |
| 35 to 44 Years | 12 (22.2%) | 54 (100.0%) |
| 45 to 54 Years | 8 (100.0%) | 0 (0.0%) |
| 55 to 64 Years | 0 (0.0%) | 0 (0.0%) |
| 65 to 74 Years | 35 (100.0%) | 14 (40.0%) |
| 75 Years and over | 30 (100.0%) | 0 (0.0%) |
| Total | 92 (35.4%) | 194 (74.6%) |
Disability Status by Sex by Age in Good Hope
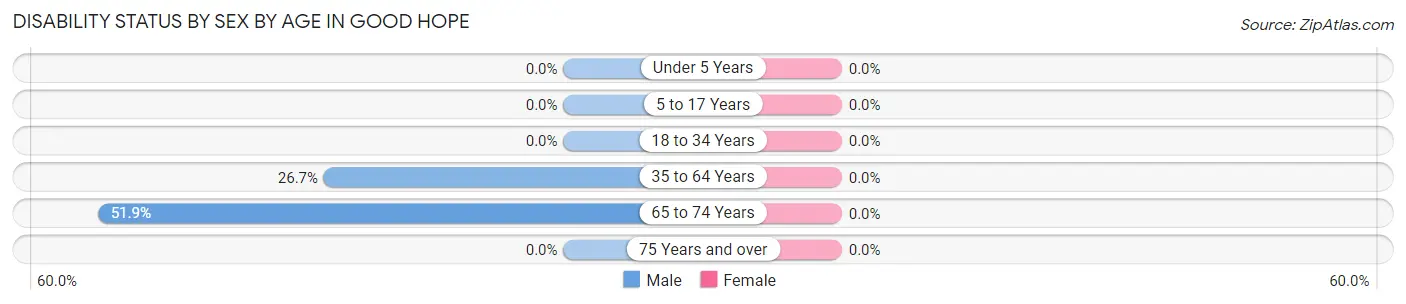
| Age Bracket | Male | Female |
| Under 5 Years | 0 (0.0%) | 0 (0.0%) |
| 5 to 17 Years | 0 (0.0%) | 0 (0.0%) |
| 18 to 34 Years | 0 (0.0%) | 0 (0.0%) |
| 35 to 64 Years | 8 (26.7%) | 0 (0.0%) |
| 65 to 74 Years | 14 (51.8%) | 0 (0.0%) |
| 75 Years and over | 0 (0.0%) | 0 (0.0%) |
Disability Class by Sex by Age in Good Hope
Disability Class: Hearing Difficulty
| Age Bracket | Male | Female |
| Under 5 Years | 0 (0.0%) | 0 (0.0%) |
| 5 to 17 Years | 0 (0.0%) | 0 (0.0%) |
| 18 to 34 Years | 0 (0.0%) | 0 (0.0%) |
| 35 to 64 Years | 0 (0.0%) | 0 (0.0%) |
| 65 to 74 Years | 0 (0.0%) | 0 (0.0%) |
| 75 Years and over | 0 (0.0%) | 0 (0.0%) |
Disability Class: Vision Difficulty
| Age Bracket | Male | Female |
| Under 5 Years | 0 (0.0%) | 0 (0.0%) |
| 5 to 17 Years | 0 (0.0%) | 0 (0.0%) |
| 18 to 34 Years | 0 (0.0%) | 0 (0.0%) |
| 35 to 64 Years | 0 (0.0%) | 0 (0.0%) |
| 65 to 74 Years | 0 (0.0%) | 0 (0.0%) |
| 75 Years and over | 0 (0.0%) | 0 (0.0%) |
Disability Class: Cognitive Difficulty
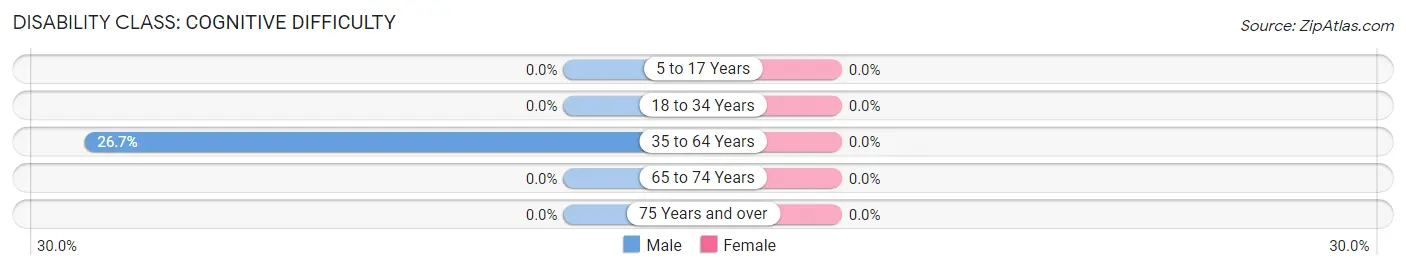
| Age Bracket | Male | Female |
| 5 to 17 Years | 0 (0.0%) | 0 (0.0%) |
| 18 to 34 Years | 0 (0.0%) | 0 (0.0%) |
| 35 to 64 Years | 8 (26.7%) | 0 (0.0%) |
| 65 to 74 Years | 0 (0.0%) | 0 (0.0%) |
| 75 Years and over | 0 (0.0%) | 0 (0.0%) |
Disability Class: Ambulatory Difficulty
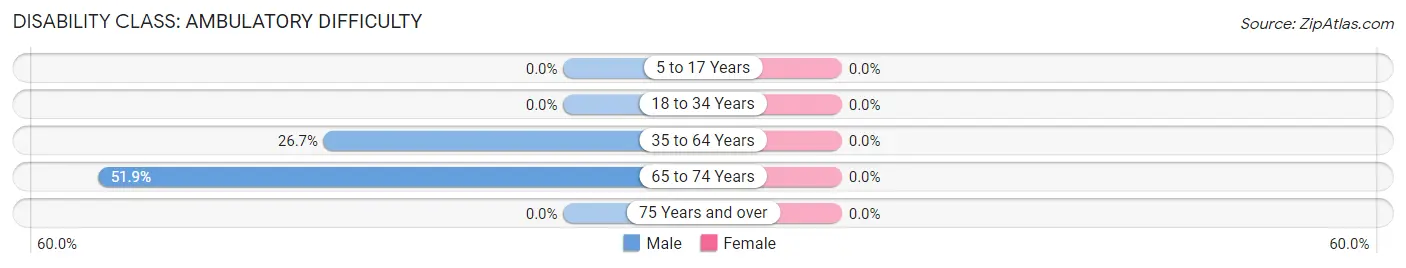
| Age Bracket | Male | Female |
| 5 to 17 Years | 0 (0.0%) | 0 (0.0%) |
| 18 to 34 Years | 0 (0.0%) | 0 (0.0%) |
| 35 to 64 Years | 8 (26.7%) | 0 (0.0%) |
| 65 to 74 Years | 14 (51.8%) | 0 (0.0%) |
| 75 Years and over | 0 (0.0%) | 0 (0.0%) |
Disability Class: Self-Care Difficulty
| Age Bracket | Male | Female |
| 5 to 17 Years | 0 (0.0%) | 0 (0.0%) |
| 18 to 34 Years | 0 (0.0%) | 0 (0.0%) |
| 35 to 64 Years | 0 (0.0%) | 0 (0.0%) |
| 65 to 74 Years | 0 (0.0%) | 0 (0.0%) |
| 75 Years and over | 0 (0.0%) | 0 (0.0%) |
Technology Access in Good Hope
Computing Device Access in Good Hope
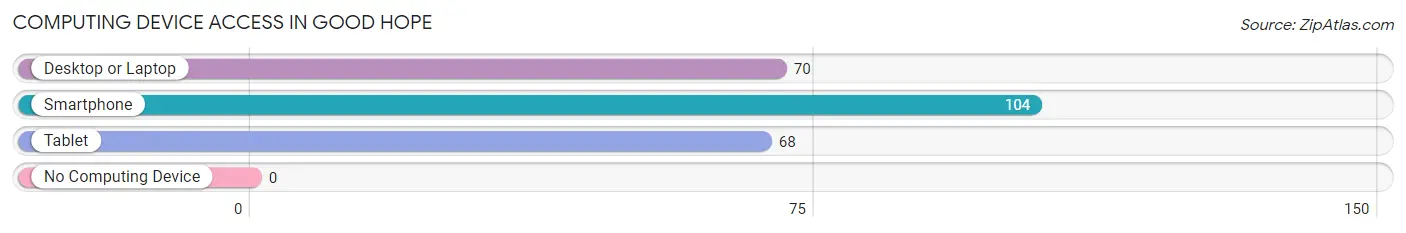
| Device Type | # Households | % Households |
| Desktop or Laptop | 70 | 62.5% |
| Smartphone | 104 | 92.9% |
| Tablet | 68 | 60.7% |
| No Computing Device | 0 | 0.0% |
| Total | 112 | 100.0% |
Internet Access in Good Hope
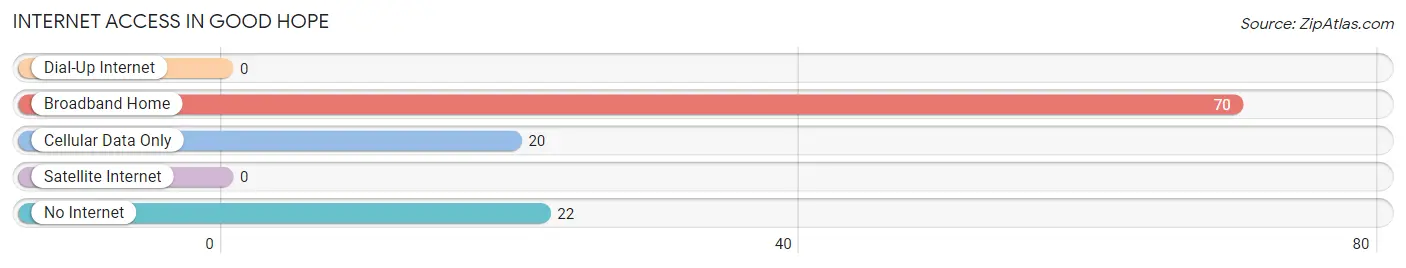
| Internet Type | # Households | % Households |
| Dial-Up Internet | 0 | 0.0% |
| Broadband Home | 70 | 62.5% |
| Cellular Data Only | 20 | 17.9% |
| Satellite Internet | 0 | 0.0% |
| No Internet | 22 | 19.6% |
| Total | 112 | 100.0% |
Good Hope Summary
Good Hope is a small village located in the southeastern corner of Ohio, in the county of Hocking. It is situated on the banks of the Hocking River, and is surrounded by rolling hills and lush forests. The village has a population of just over 500 people, and is a popular destination for outdoor recreation.
History
Good Hope was founded in 1817 by a group of settlers from Pennsylvania. The village was named after the nearby Good Hope Methodist Church, which was built in 1820. The village grew slowly over the years, and by the mid-1800s, it had become a thriving agricultural community. The village was home to several mills, a blacksmith shop, and a general store.
In the late 1800s, the village began to decline as the railroad bypassed it. The population dwindled, and by the early 1900s, the village was nearly abandoned. In the 1950s, the village was revitalized by the construction of a new bridge over the Hocking River. This allowed for increased access to the village, and the population began to grow again.
Geography
Good Hope is located in the southeastern corner of Ohio, in the county of Hocking. It is situated on the banks of the Hocking River, and is surrounded by rolling hills and lush forests. The village is located approximately 25 miles from the city of Columbus, and is accessible by State Route 664.
The village is located in a temperate climate, with hot summers and cold winters. The average temperature in the summer is around 75 degrees Fahrenheit, and the average temperature in the winter is around 35 degrees Fahrenheit. The village receives an average of 40 inches of precipitation per year.
Economy
The economy of Good Hope is largely based on agriculture and tourism. The village is home to several farms, which produce a variety of crops, including corn, soybeans, and wheat. The village is also home to several small businesses, including a general store, a gas station, and a restaurant.
The village is a popular destination for outdoor recreation, and is home to several parks and trails. The village is also home to several campgrounds, which attract visitors from all over the region.
Demographics
As of the 2010 census, the population of Good Hope was 514 people. The racial makeup of the village was 97.3% White, 0.6% African American, 0.2% Native American, 0.2% Asian, and 1.7% from other races. The median household income was $37,500, and the median age was 41.
Good Hope is a small, rural village with a close-knit community. The village is home to several churches, and is a popular destination for outdoor recreation. The village is a great place to live, work, and raise a family.
Common Questions
What is Per Capita Income in Good Hope?
Per Capita income in Good Hope is $21,955.
What is the Median Family Income in Good Hope?
Median Family Income in Good Hope is $58,281.
What is Income or Wage Gap in Good Hope?
Income or Wage Gap in Good Hope is 12.2%.
Women in Good Hope earn 87.8 cents for every dollar earned by a man.
What is Inequality or Gini Index in Good Hope?
Inequality or Gini Index in Good Hope is 0.41.
What is the Total Population of Good Hope?
Total Population of Good Hope is 260.
What is the Total Male Population of Good Hope?
Total Male Population of Good Hope is 118.
What is the Total Female Population of Good Hope?
Total Female Population of Good Hope is 142.
What is the Ratio of Males per 100 Females in Good Hope?
There are 83.10 Males per 100 Females in Good Hope.
What is the Ratio of Females per 100 Males in Good Hope?
There are 120.34 Females per 100 Males in Good Hope.
What is the Median Population Age in Good Hope?
Median Population Age in Good Hope is 34.7 Years.
What is the Average Family Size in Good Hope
Average Family Size in Good Hope is 3.3 People.
What is the Average Household Size in Good Hope
Average Household Size in Good Hope is 2.3 People.
How Large is the Labor Force in Good Hope?
There are 85 People in the Labor Forcein in Good Hope.
What is the Percentage of People in the Labor Force in Good Hope?
53.8% of People are in the Labor Force in Good Hope.