Octa, OH Map & Demographics
Octa Map
Octa Overview
$21,126
PER CAPITA INCOME
$59,375
AVG FAMILY INCOME
50.9%
WAGE / INCOME GAP [ % ]
49.1¢/ $1
WAGE / INCOME GAP [ $ ]
0.36
INEQUALITY / GINI INDEX
50
TOTAL POPULATION
27
MALE POPULATION
23
FEMALE POPULATION
117.39
MALES / 100 FEMALES
85.19
FEMALES / 100 MALES
54.3
MEDIAN AGE
2.3
AVG FAMILY SIZE
1.9
AVG HOUSEHOLD SIZE
22
LABOR FORCE [ PEOPLE ]
48.9%
PERCENT IN LABOR FORCE
Income in Octa
Income Overview in Octa
| Characteristic | Number | Measure |
| Per Capita Income | 50 | $21,126 |
| Median Family Income | 14 | $59,375 |
| Mean Family Income | 14 | $56,143 |
| Median Household Income | 27 | $0 |
| Mean Household Income | 27 | $39,196 |
| Income Deficit | 14 | $0 |
| Wage / Income Gap (%) | 50 | 50.89% |
| Wage / Income Gap ($) | 50 | 49.11¢ per $1 |
| Gini / Inequality Index | 50 | 0.36 |
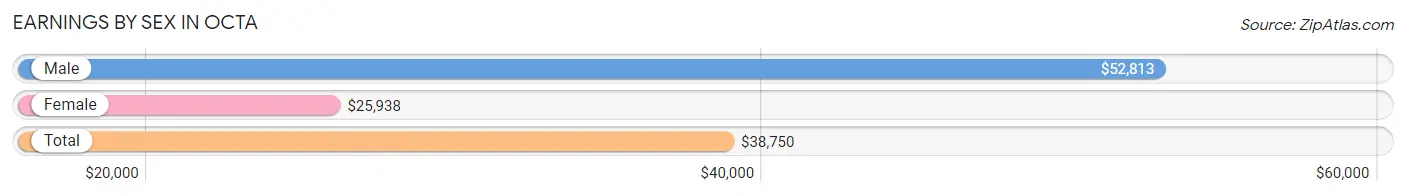
Earnings by Sex in Octa
Average Earnings in Octa are $38,750, $52,813 for men and $25,938 for women, a difference of 50.9%.
| Sex | Number | Average Earnings |
| Male | 13 (59.1%) | $52,813 |
| Female | 9 (40.9%) | $25,938 |
| Total | 22 (100.0%) | $38,750 |
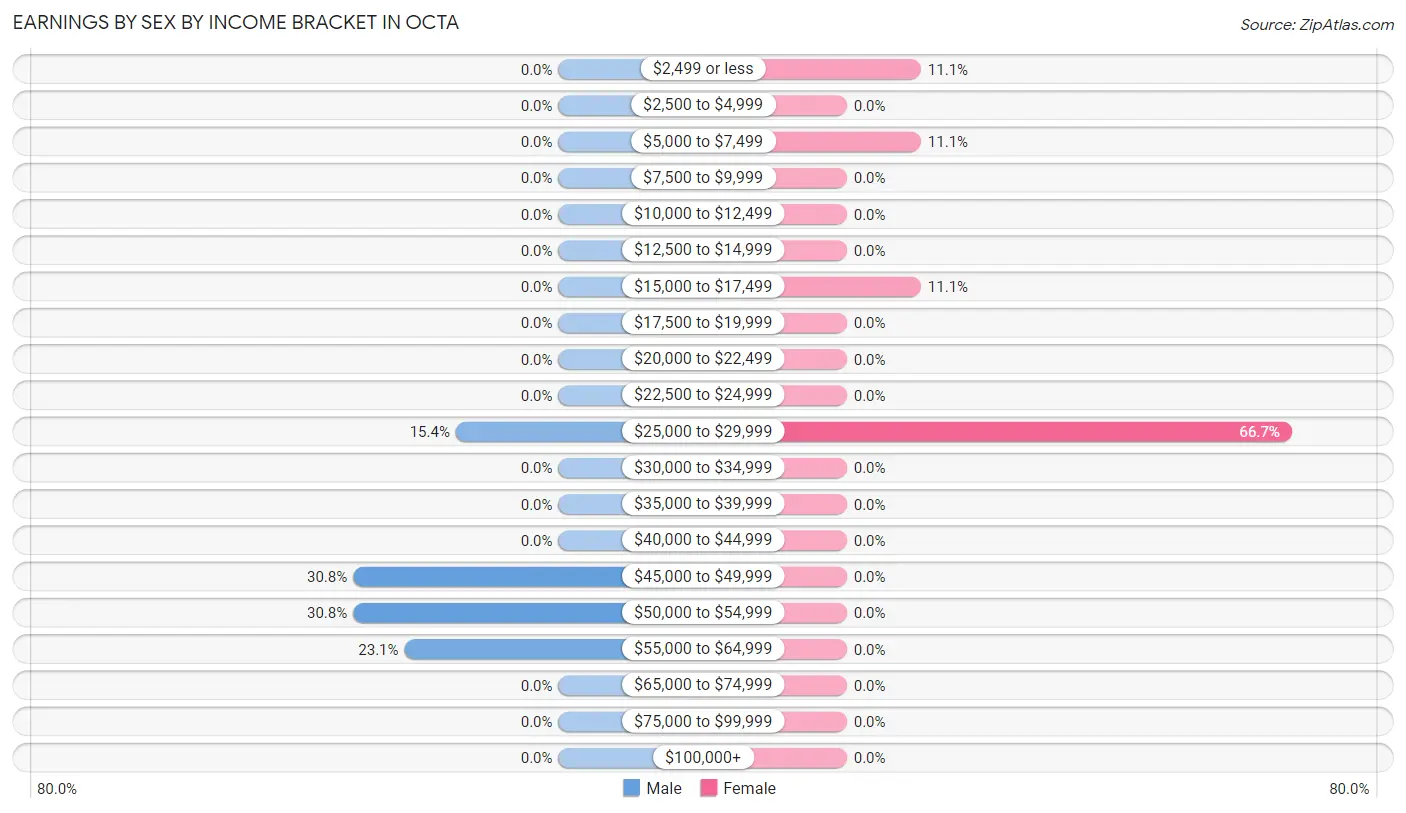
Earnings by Sex by Income Bracket in Octa
The most common earnings brackets in Octa are $45,000 to $49,999 for men (4 | 30.8%) and $25,000 to $29,999 for women (6 | 66.7%).
| Income | Male | Female |
| $2,499 or less | 0 (0.0%) | 1 (11.1%) |
| $2,500 to $4,999 | 0 (0.0%) | 0 (0.0%) |
| $5,000 to $7,499 | 0 (0.0%) | 1 (11.1%) |
| $7,500 to $9,999 | 0 (0.0%) | 0 (0.0%) |
| $10,000 to $12,499 | 0 (0.0%) | 0 (0.0%) |
| $12,500 to $14,999 | 0 (0.0%) | 0 (0.0%) |
| $15,000 to $17,499 | 0 (0.0%) | 1 (11.1%) |
| $17,500 to $19,999 | 0 (0.0%) | 0 (0.0%) |
| $20,000 to $22,499 | 0 (0.0%) | 0 (0.0%) |
| $22,500 to $24,999 | 0 (0.0%) | 0 (0.0%) |
| $25,000 to $29,999 | 2 (15.4%) | 6 (66.7%) |
| $30,000 to $34,999 | 0 (0.0%) | 0 (0.0%) |
| $35,000 to $39,999 | 0 (0.0%) | 0 (0.0%) |
| $40,000 to $44,999 | 0 (0.0%) | 0 (0.0%) |
| $45,000 to $49,999 | 4 (30.8%) | 0 (0.0%) |
| $50,000 to $54,999 | 4 (30.8%) | 0 (0.0%) |
| $55,000 to $64,999 | 3 (23.1%) | 0 (0.0%) |
| $65,000 to $74,999 | 0 (0.0%) | 0 (0.0%) |
| $75,000 to $99,999 | 0 (0.0%) | 0 (0.0%) |
| $100,000+ | 0 (0.0%) | 0 (0.0%) |
| Total | 13 (100.0%) | 9 (100.0%) |
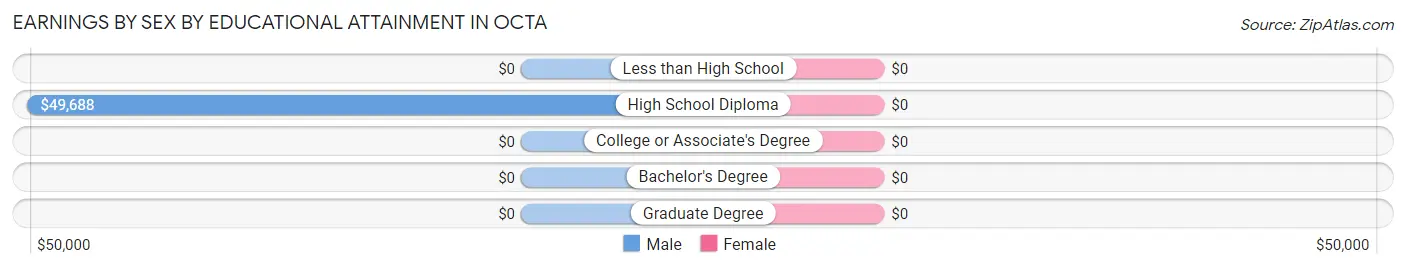
Earnings by Sex by Educational Attainment in Octa
| Educational Attainment | Male Income | Female Income |
| Less than High School | - | - |
| High School Diploma | $49,688 | $0 |
| College or Associate's Degree | - | - |
| Bachelor's Degree | - | - |
| Graduate Degree | - | - |
| Total | $52,813 | $26,250 |
Family Income in Octa
Family Income Brackets in Octa
According to the Octa family income data, there are 6 families falling into the $50,000 to $74,999 income range, which is the most common income bracket and makes up 42.9% of all families.
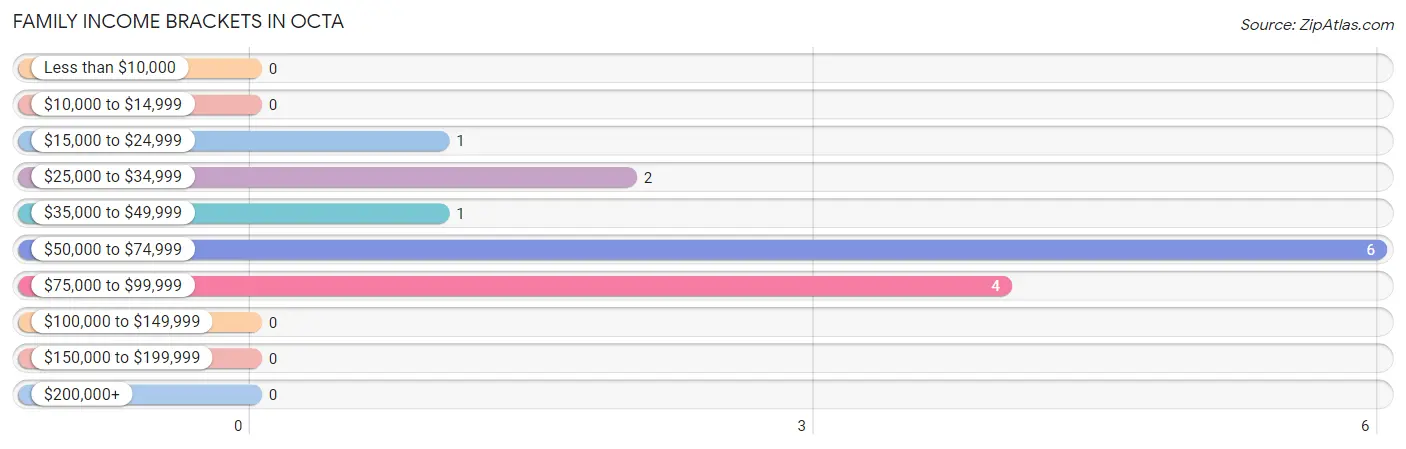
| Income Bracket | # Families | % Families |
| Less than $10,000 | 0 | 0.0% |
| $10,000 to $14,999 | 0 | 0.0% |
| $15,000 to $24,999 | 1 | 7.1% |
| $25,000 to $34,999 | 2 | 14.3% |
| $35,000 to $49,999 | 1 | 7.1% |
| $50,000 to $74,999 | 6 | 42.9% |
| $75,000 to $99,999 | 4 | 28.6% |
| $100,000 to $149,999 | 0 | 0.0% |
| $150,000 to $199,999 | 0 | 0.0% |
| $200,000+ | 0 | 0.0% |
Family Income by Famaliy Size in Octa
2-person families (11 | 78.6%) account for the highest median family income in Octa with $63,125 per family, while 2-person families (11 | 78.6%) have the highest median income of $31,562 per family member.
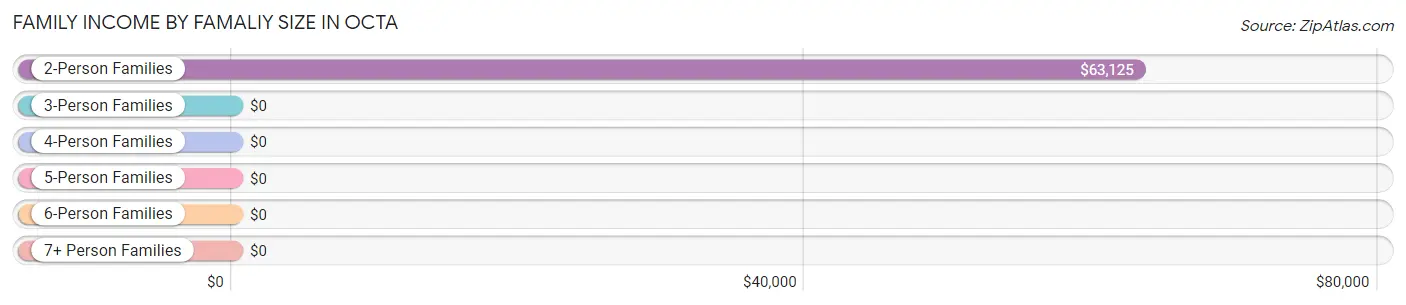
| Income Bracket | # Families | Median Income |
| 2-Person Families | 11 (78.6%) | $63,125 |
| 3-Person Families | 2 (14.3%) | $0 |
| 4-Person Families | 0 (0.0%) | $0 |
| 5-Person Families | 1 (7.1%) | $0 |
| 6-Person Families | 0 (0.0%) | $0 |
| 7+ Person Families | 0 (0.0%) | $0 |
| Total | 14 (100.0%) | $59,375 |
Family Income by Number of Earners in Octa
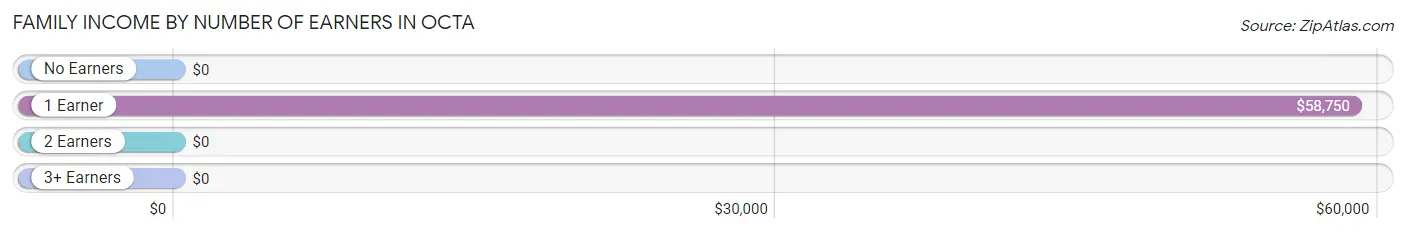
| Number of Earners | # Families | Median Income |
| No Earners | 0 (0.0%) | $0 |
| 1 Earner | 8 (57.1%) | $58,750 |
| 2 Earners | 6 (42.9%) | $0 |
| 3+ Earners | 0 (0.0%) | $0 |
| Total | 14 (100.0%) | $59,375 |
Household Income in Octa
Household Income Brackets in Octa
With 9 households falling in the category, the $50,000 to $74,999 income range is the most frequent in Octa, accounting for 33.3% of all households.
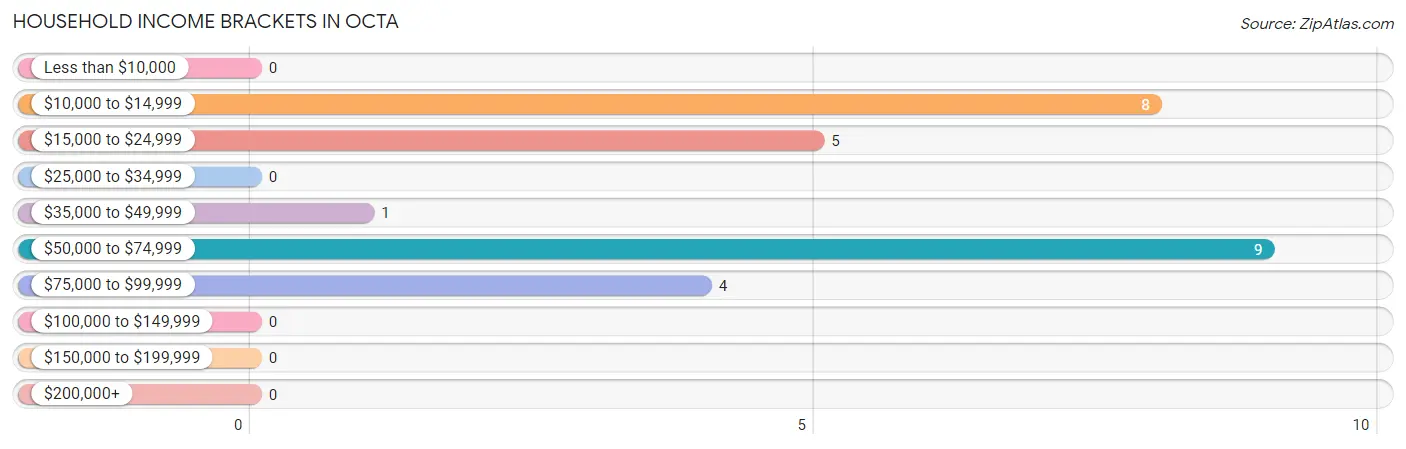
| Income Bracket | # Households | % Households |
| Less than $10,000 | 0 | 0.0% |
| $10,000 to $14,999 | 8 | 29.6% |
| $15,000 to $24,999 | 5 | 18.5% |
| $25,000 to $34,999 | 0 | 0.0% |
| $35,000 to $49,999 | 1 | 3.7% |
| $50,000 to $74,999 | 9 | 33.3% |
| $75,000 to $99,999 | 4 | 14.8% |
| $100,000 to $149,999 | 0 | 0.0% |
| $150,000 to $199,999 | 0 | 0.0% |
| $200,000+ | 0 | 0.0% |
Household Income by Householder Age in Octa
The median household income in Octa is $0, with the highest median household income of $63,125 found in the 45 to 64 years age bracket for the primary householder. A total of 11 households (40.7%) fall into this category.
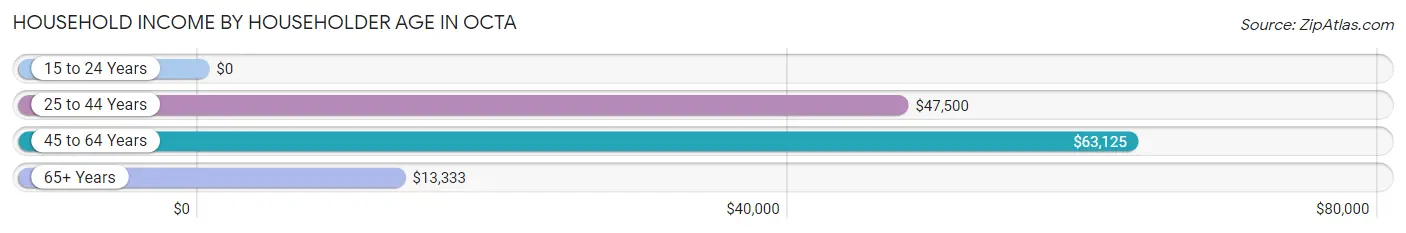
| Income Bracket | # Households | Median Income |
| 15 to 24 Years | 0 (0.0%) | $0 |
| 25 to 44 Years | 4 (14.8%) | $47,500 |
| 45 to 64 Years | 11 (40.7%) | $63,125 |
| 65+ Years | 12 (44.4%) | $13,333 |
| Total | 27 (100.0%) | $0 |
Poverty in Octa
Income Below Poverty by Sex and Age in Octa
With 33.3% poverty level for males and 39.1% for females among the residents of Octa, 6 to 11 year old males and 25 to 34 year old females are the most vulnerable to poverty, with 2 males (100.0%) and 1 females (100.0%) in their respective age groups living below the poverty level.
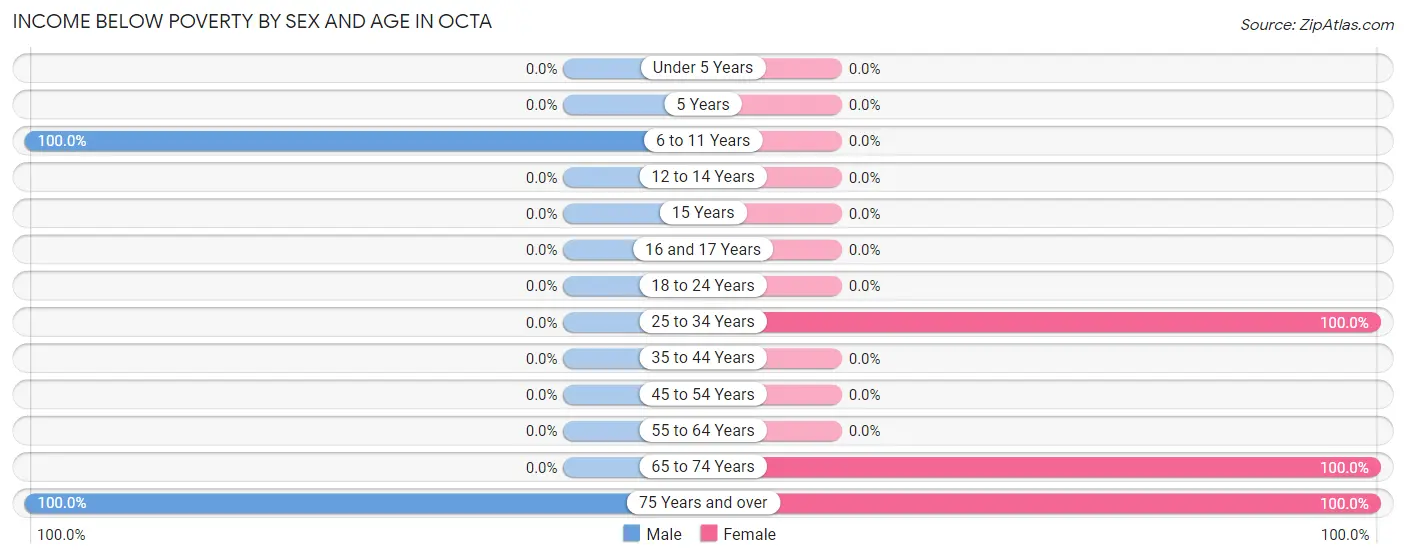
| Age Bracket | Male | Female |
| Under 5 Years | 0 (0.0%) | 0 (0.0%) |
| 5 Years | 0 (0.0%) | 0 (0.0%) |
| 6 to 11 Years | 2 (100.0%) | 0 (0.0%) |
| 12 to 14 Years | 0 (0.0%) | 0 (0.0%) |
| 15 Years | 0 (0.0%) | 0 (0.0%) |
| 16 and 17 Years | 0 (0.0%) | 0 (0.0%) |
| 18 to 24 Years | 0 (0.0%) | 0 (0.0%) |
| 25 to 34 Years | 0 (0.0%) | 1 (100.0%) |
| 35 to 44 Years | 0 (0.0%) | 0 (0.0%) |
| 45 to 54 Years | 0 (0.0%) | 0 (0.0%) |
| 55 to 64 Years | 0 (0.0%) | 0 (0.0%) |
| 65 to 74 Years | 0 (0.0%) | 5 (100.0%) |
| 75 Years and over | 7 (100.0%) | 3 (100.0%) |
| Total | 9 (33.3%) | 9 (39.1%) |
Income Above Poverty by Sex and Age in Octa
According to the poverty statistics in Octa, males aged 16 and 17 years and females aged 15 years are the age groups that are most secure financially, with 100.0% of males and 100.0% of females in these age groups living above the poverty line.
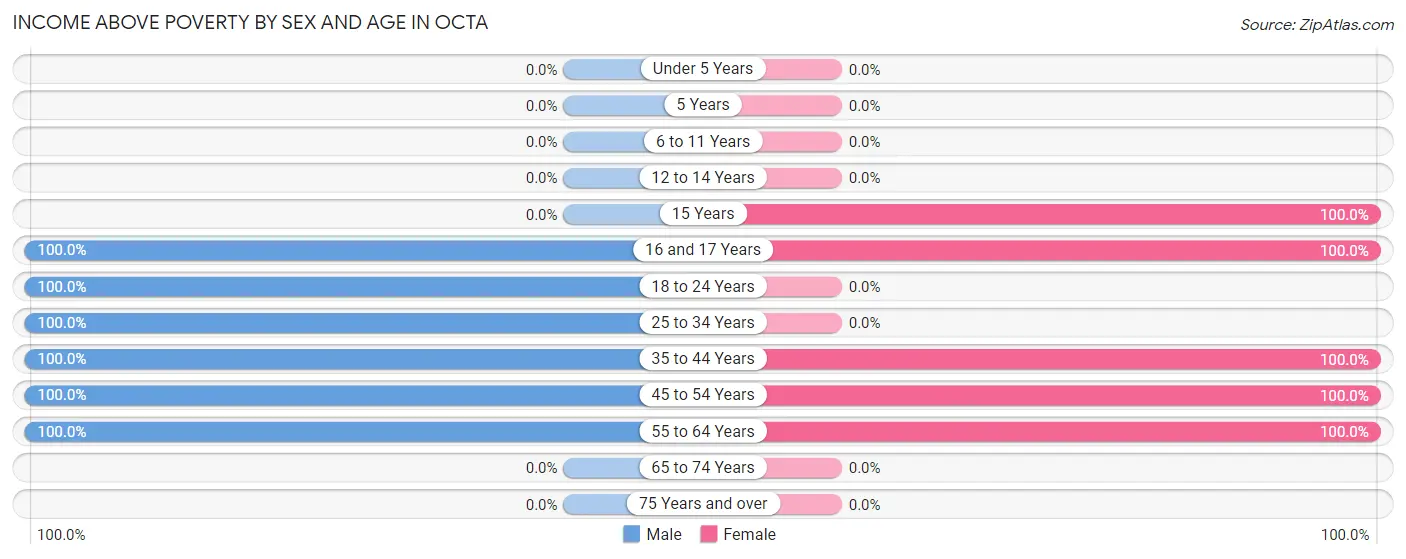
| Age Bracket | Male | Female |
| Under 5 Years | 0 (0.0%) | 0 (0.0%) |
| 5 Years | 0 (0.0%) | 0 (0.0%) |
| 6 to 11 Years | 0 (0.0%) | 0 (0.0%) |
| 12 to 14 Years | 0 (0.0%) | 0 (0.0%) |
| 15 Years | 0 (0.0%) | 3 (100.0%) |
| 16 and 17 Years | 1 (100.0%) | 2 (100.0%) |
| 18 to 24 Years | 2 (100.0%) | 0 (0.0%) |
| 25 to 34 Years | 2 (100.0%) | 0 (0.0%) |
| 35 to 44 Years | 2 (100.0%) | 3 (100.0%) |
| 45 to 54 Years | 6 (100.0%) | 4 (100.0%) |
| 55 to 64 Years | 5 (100.0%) | 2 (100.0%) |
| 65 to 74 Years | 0 (0.0%) | 0 (0.0%) |
| 75 Years and over | 0 (0.0%) | 0 (0.0%) |
| Total | 18 (66.7%) | 14 (60.9%) |
Income Below Poverty Among Married-Couple Families in Octa
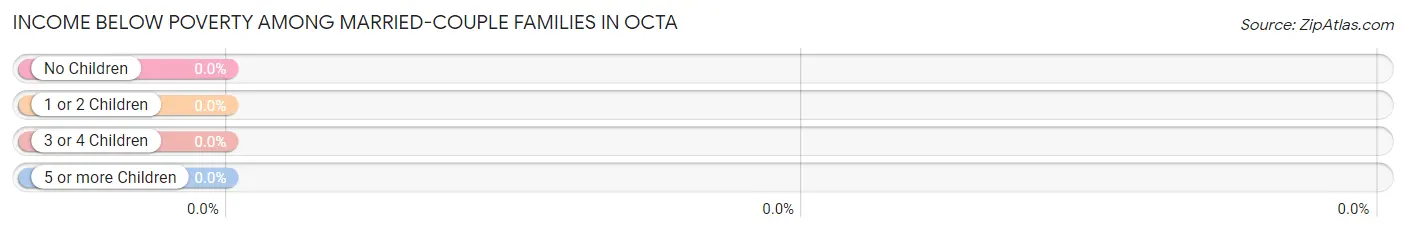
| Children | Above Poverty | Below Poverty |
| No Children | 8 (100.0%) | 0 (0.0%) |
| 1 or 2 Children | 1 (100.0%) | 0 (0.0%) |
| 3 or 4 Children | 0 (0.0%) | 0 (0.0%) |
| 5 or more Children | 0 (0.0%) | 0 (0.0%) |
| Total | 9 (100.0%) | 0 (0.0%) |
Income Below Poverty Among Single-Parent Households in Octa
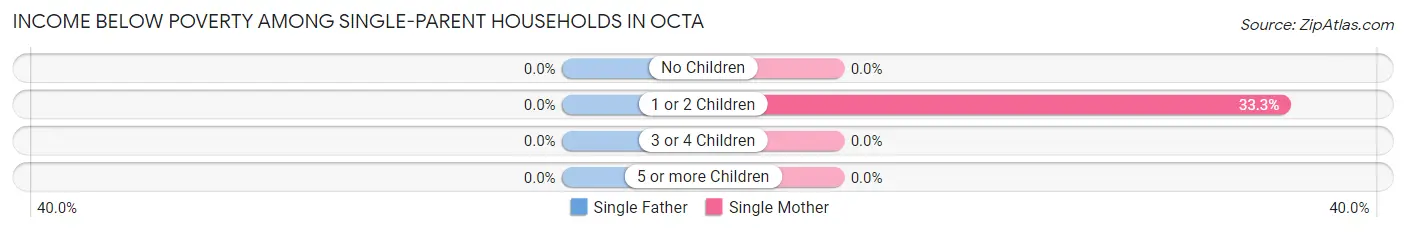
| Children | Single Father | Single Mother |
| No Children | 0 (0.0%) | 0 (0.0%) |
| 1 or 2 Children | 0 (0.0%) | 1 (33.3%) |
| 3 or 4 Children | 0 (0.0%) | 0 (0.0%) |
| 5 or more Children | 0 (0.0%) | 0 (0.0%) |
| Total | 0 (0.0%) | 1 (33.3%) |
Income Below Poverty Among Married-Couple vs Single-Parent Households in Octa
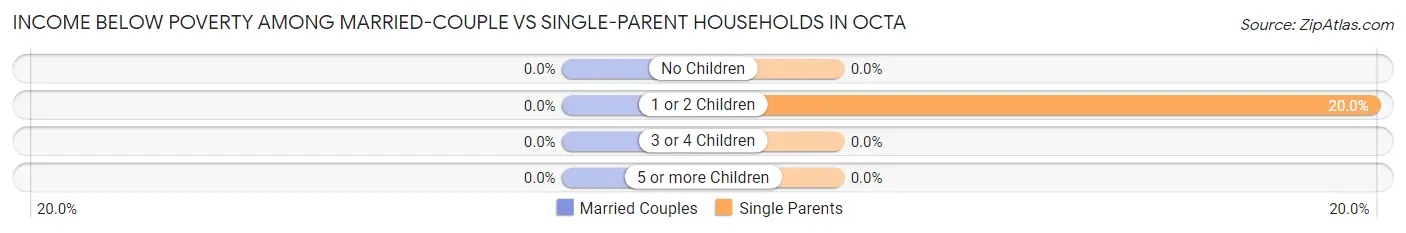
| Children | Married-Couple Families | Single-Parent Households |
| No Children | 0 (0.0%) | 0 (0.0%) |
| 1 or 2 Children | 0 (0.0%) | 1 (20.0%) |
| 3 or 4 Children | 0 (0.0%) | 0 (0.0%) |
| 5 or more Children | 0 (0.0%) | 0 (0.0%) |
| Total | 0 (0.0%) | 1 (20.0%) |
Race in Octa
The most populous races in Octa are , and White / Caucasian (50 | 100.0%).
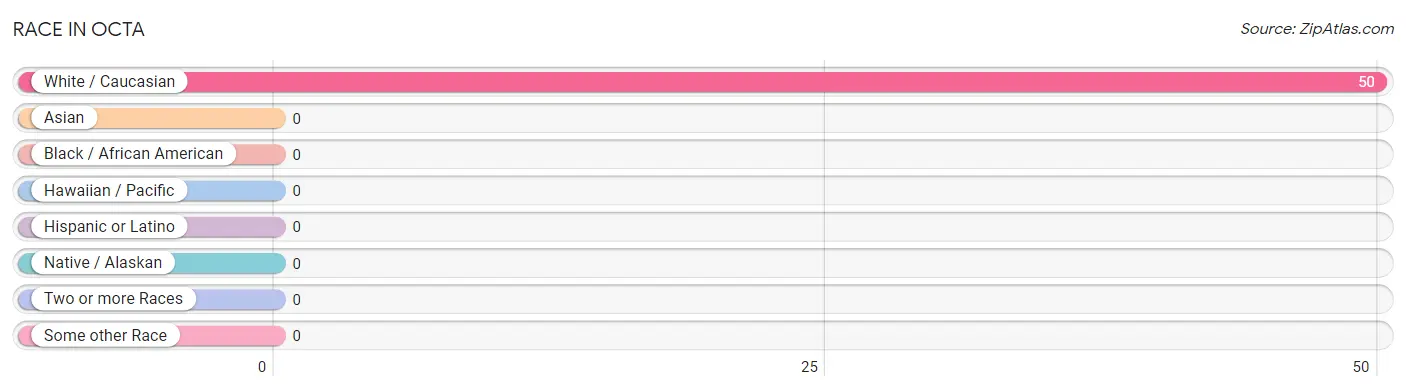
| Race | # Population | % Population |
| Asian | 0 | 0.0% |
| Black / African American | 0 | 0.0% |
| Hawaiian / Pacific | 0 | 0.0% |
| Hispanic or Latino | 0 | 0.0% |
| Native / Alaskan | 0 | 0.0% |
| White / Caucasian | 50 | 100.0% |
| Two or more Races | 0 | 0.0% |
| Some other Race | 0 | 0.0% |
| Total | 50 | 100.0% |
Ancestry in Octa
The most populous ancestries reported in Octa are American (16 | 32.0%), Irish (14 | 28.0%), and English (3 | 6.0%), together accounting for 66.0% of all Octa residents.
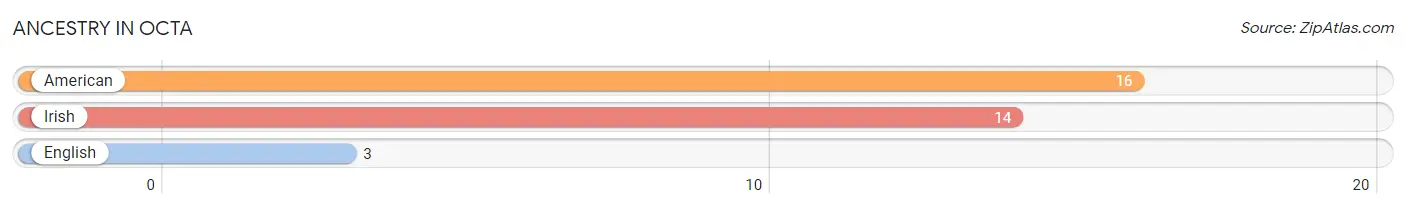
| Ancestry | # Population | % Population |
| American | 16 | 32.0% |
| English | 3 | 6.0% |
| Irish | 14 | 28.0% | View All 3 Rows |
Immigrants in Octa

| Immigration Origin | # Population | % Population | View All 0 Rows |
Sex and Age in Octa
Sex and Age in Octa
The most populous age groups in Octa are 55 to 59 Years (5 | 18.5%) for men and 15 to 19 Years (5 | 21.7%) for women.
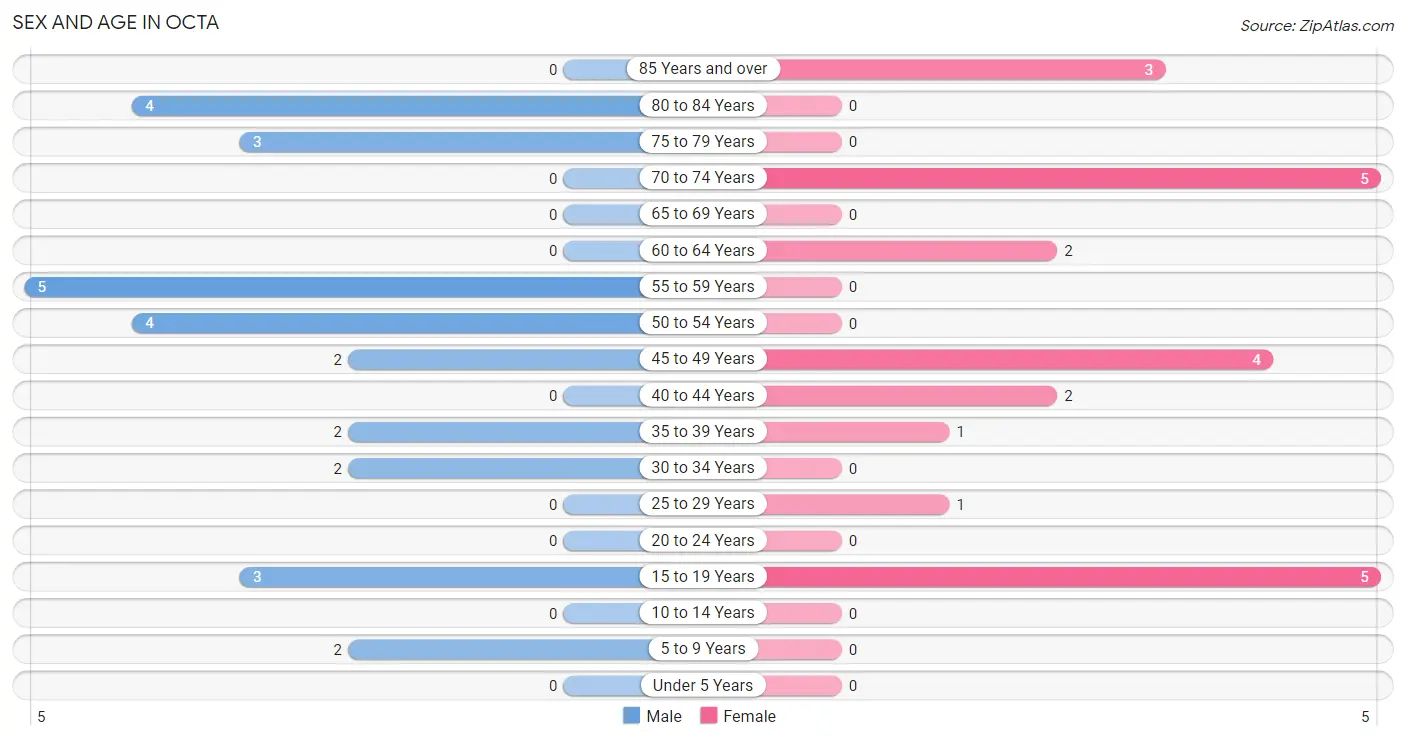
| Age Bracket | Male | Female |
| Under 5 Years | 0 (0.0%) | 0 (0.0%) |
| 5 to 9 Years | 2 (7.4%) | 0 (0.0%) |
| 10 to 14 Years | 0 (0.0%) | 0 (0.0%) |
| 15 to 19 Years | 3 (11.1%) | 5 (21.7%) |
| 20 to 24 Years | 0 (0.0%) | 0 (0.0%) |
| 25 to 29 Years | 0 (0.0%) | 1 (4.3%) |
| 30 to 34 Years | 2 (7.4%) | 0 (0.0%) |
| 35 to 39 Years | 2 (7.4%) | 1 (4.3%) |
| 40 to 44 Years | 0 (0.0%) | 2 (8.7%) |
| 45 to 49 Years | 2 (7.4%) | 4 (17.4%) |
| 50 to 54 Years | 4 (14.8%) | 0 (0.0%) |
| 55 to 59 Years | 5 (18.5%) | 0 (0.0%) |
| 60 to 64 Years | 0 (0.0%) | 2 (8.7%) |
| 65 to 69 Years | 0 (0.0%) | 0 (0.0%) |
| 70 to 74 Years | 0 (0.0%) | 5 (21.7%) |
| 75 to 79 Years | 3 (11.1%) | 0 (0.0%) |
| 80 to 84 Years | 4 (14.8%) | 0 (0.0%) |
| 85 Years and over | 0 (0.0%) | 3 (13.0%) |
| Total | 27 (100.0%) | 23 (100.0%) |
Families and Households in Octa
Median Family Size in Octa
The median family size in Octa is 2.29 persons per family, with married-couple families (9 | 64.3%) accounting for the largest median family size of 2.44 persons per family. On the other hand, single male/father families (2 | 14.3%) represent the smallest median family size with 1.50 persons per family.
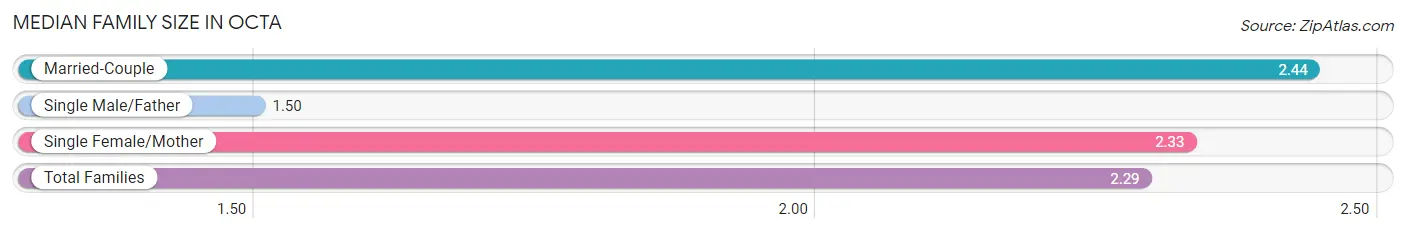
| Family Type | # Families | Family Size |
| Married-Couple | 9 (64.3%) | 2.44 |
| Single Male/Father | 2 (14.3%) | 1.50 |
| Single Female/Mother | 3 (21.4%) | 2.33 |
| Total Families | 14 (100.0%) | 2.29 |
Median Household Size in Octa
The median household size in Octa is 1.85 persons per household, with single female/mother households (3 | 11.1%) accounting for the largest median household size of 3 persons per household. non-family households (13 | 48.1%) represent the smallest median household size with 1.23 persons per household.
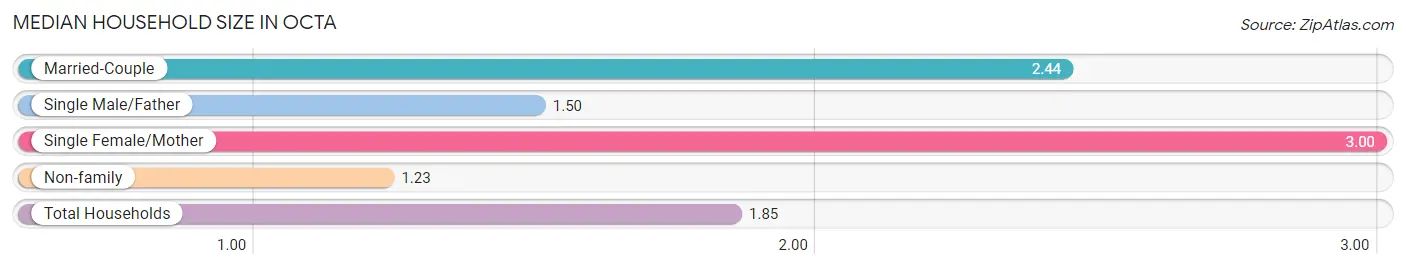
| Household Type | # Households | Household Size |
| Married-Couple | 9 (33.3%) | 2.44 |
| Single Male/Father | 2 (7.4%) | 1.50 |
| Single Female/Mother | 3 (11.1%) | 3.00 |
| Non-family | 13 (48.1%) | 1.23 |
| Total Households | 27 (100.0%) | 1.85 |
Household Size by Marriage Status in Octa
Out of a total of 27 households in Octa, 14 (51.8%) are family households, while 13 (48.1%) are nonfamily households. The most numerous type of family households are 2-person households, comprising 11, and the most common type of nonfamily households are 1-person households, comprising 9.
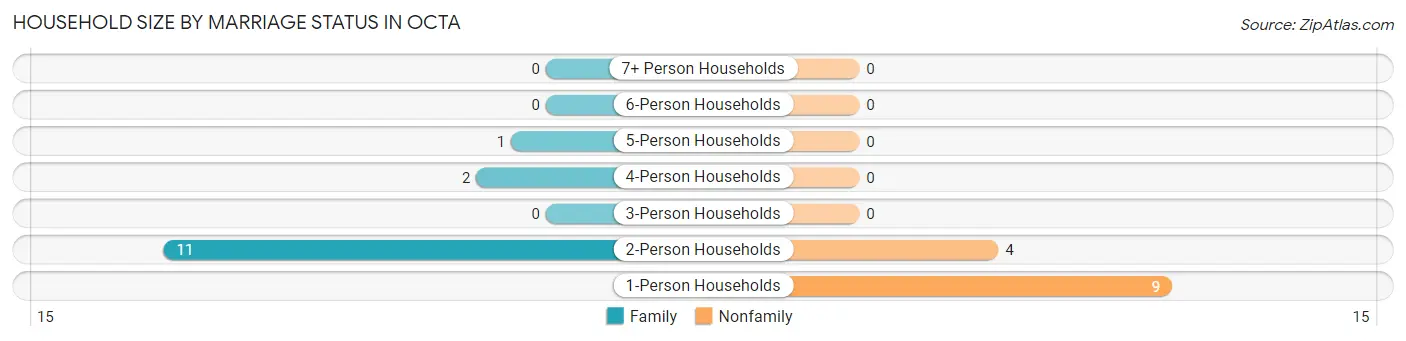
| Household Size | Family Households | Nonfamily Households |
| 1-Person Households | - | 9 (33.3%) |
| 2-Person Households | 11 (40.7%) | 4 (14.8%) |
| 3-Person Households | 0 (0.0%) | 0 (0.0%) |
| 4-Person Households | 2 (7.4%) | 0 (0.0%) |
| 5-Person Households | 1 (3.7%) | 0 (0.0%) |
| 6-Person Households | 0 (0.0%) | 0 (0.0%) |
| 7+ Person Households | 0 (0.0%) | 0 (0.0%) |
| Total | 14 (51.8%) | 13 (48.1%) |
Female Fertility in Octa
Fertility by Age in Octa
| Age Bracket | Women with Births | Births / 1,000 Women |
| 15 to 19 years | 0 (0.0%) | 0.0 |
| 20 to 34 years | 0 (0.0%) | 0.0 |
| 35 to 50 years | 0 (0.0%) | 0.0 |
| Total | 0 (0.0%) | 0.0 |
Fertility by Age by Marriage Status in Octa
| Age Bracket | Married | Unmarried |
| 15 to 19 years | 0 (0.0%) | 0 (0.0%) |
| 20 to 34 years | 0 (0.0%) | 0 (0.0%) |
| 35 to 50 years | 0 (0.0%) | 0 (0.0%) |
| Total | 0 (0.0%) | 0 (0.0%) |
Fertility by Education in Octa
| Educational Attainment | Women with Births | Births / 1,000 Women |
| Less than High School | 0 (0.0%) | 0.0 |
| High School Diploma | 0 (0.0%) | 0.0 |
| College or Associate's Degree | 0 (0.0%) | 0.0 |
| Bachelor's Degree | 0 (0.0%) | 0.0 |
| Graduate Degree | 0 (0.0%) | 0.0 |
| Total | 0 (0.0%) | 0.0 |
Fertility by Education by Marriage Status in Octa
| Educational Attainment | Married | Unmarried |
| Less than High School | 0 (0.0%) | 0 (0.0%) |
| High School Diploma | 0 (0.0%) | 0 (0.0%) |
| College or Associate's Degree | 0 (0.0%) | 0 (0.0%) |
| Bachelor's Degree | 0 (0.0%) | 0 (0.0%) |
| Graduate Degree | 0 (0.0%) | 0 (0.0%) |
| Total | 0 (0.0%) | 0 (0.0%) |
Employment Characteristics in Octa
Employment by Class of Employer in Octa
Among the 19 employed individuals in Octa, private company employees (15 | 78.9%), and local government employees (4 | 21.0%) make up the most common classes of employment.
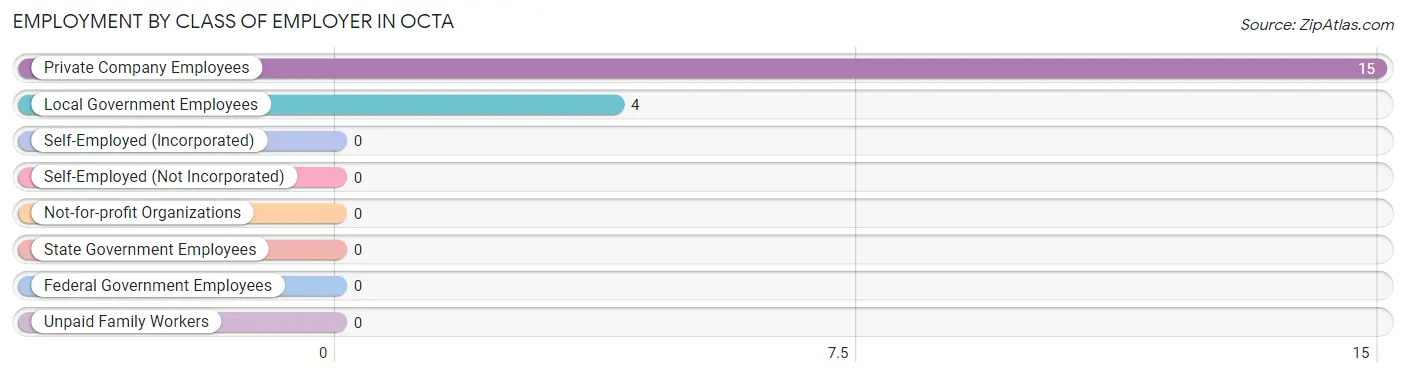
| Employer Class | # Employees | % Employees |
| Private Company Employees | 15 | 78.9% |
| Self-Employed (Incorporated) | 0 | 0.0% |
| Self-Employed (Not Incorporated) | 0 | 0.0% |
| Not-for-profit Organizations | 0 | 0.0% |
| Local Government Employees | 4 | 21.0% |
| State Government Employees | 0 | 0.0% |
| Federal Government Employees | 0 | 0.0% |
| Unpaid Family Workers | 0 | 0.0% |
| Total | 19 | 100.0% |
Employment Status by Age in Octa
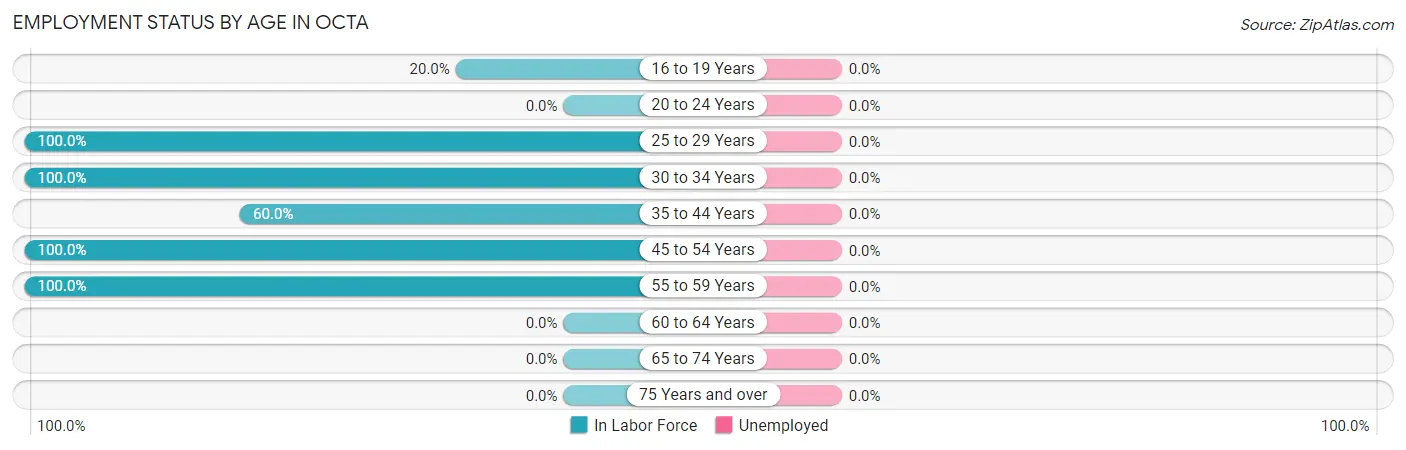
| Age Bracket | In Labor Force | Unemployed |
| 16 to 19 Years | 1 (20.0%) | 0 (0.0%) |
| 20 to 24 Years | 0 (0.0%) | 0 (0.0%) |
| 25 to 29 Years | 1 (100.0%) | 0 (0.0%) |
| 30 to 34 Years | 2 (100.0%) | 0 (0.0%) |
| 35 to 44 Years | 3 (60.0%) | 0 (0.0%) |
| 45 to 54 Years | 10 (100.0%) | 0 (0.0%) |
| 55 to 59 Years | 5 (100.0%) | 0 (0.0%) |
| 60 to 64 Years | 0 (0.0%) | 0 (0.0%) |
| 65 to 74 Years | 0 (0.0%) | 0 (0.0%) |
| 75 Years and over | 0 (0.0%) | 0 (0.0%) |
| Total | 22 (48.9%) | 0 (0.0%) |
Employment Status by Educational Attainment in Octa
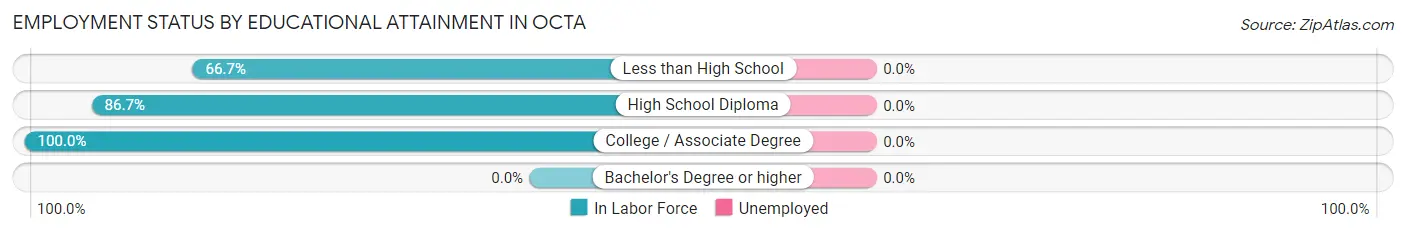
| Educational Attainment | In Labor Force | Unemployed |
| Less than High School | 4 (66.7%) | 0 (0.0%) |
| High School Diploma | 13 (86.7%) | 0 (0.0%) |
| College / Associate Degree | 4 (100.0%) | 0 (0.0%) |
| Bachelor's Degree or higher | 0 (0.0%) | 0 (0.0%) |
| Total | 21 (84.0%) | 0 (0.0%) |
Employment Occupations by Sex in Octa
Management, Business, Science and Arts Occupations
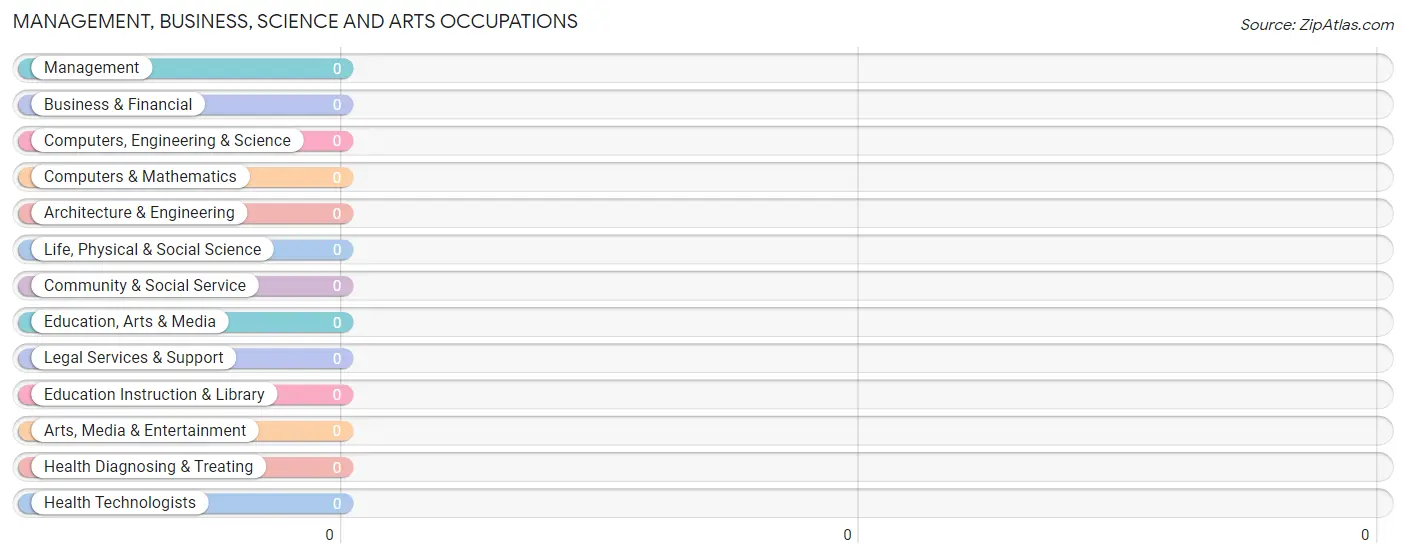
Management, Business, Science and Arts Occupations by Sex
| Occupation | Male | Female |
| Management | 0 (0.0%) | 0 (0.0%) |
| Business & Financial | 0 (0.0%) | 0 (0.0%) |
| Computers, Engineering & Science | 0 (0.0%) | 0 (0.0%) |
| Computers & Mathematics | 0 (0.0%) | 0 (0.0%) |
| Architecture & Engineering | 0 (0.0%) | 0 (0.0%) |
| Life, Physical & Social Science | 0 (0.0%) | 0 (0.0%) |
| Community & Social Service | 0 (0.0%) | 0 (0.0%) |
| Education, Arts & Media | 0 (0.0%) | 0 (0.0%) |
| Legal Services & Support | 0 (0.0%) | 0 (0.0%) |
| Education Instruction & Library | 0 (0.0%) | 0 (0.0%) |
| Arts, Media & Entertainment | 0 (0.0%) | 0 (0.0%) |
| Health Diagnosing & Treating | 0 (0.0%) | 0 (0.0%) |
| Health Technologists | 0 (0.0%) | 0 (0.0%) |
| Total (Category) | 0 (0.0%) | 0 (0.0%) |
| Total (Overall) | 13 (59.1%) | 9 (40.9%) |
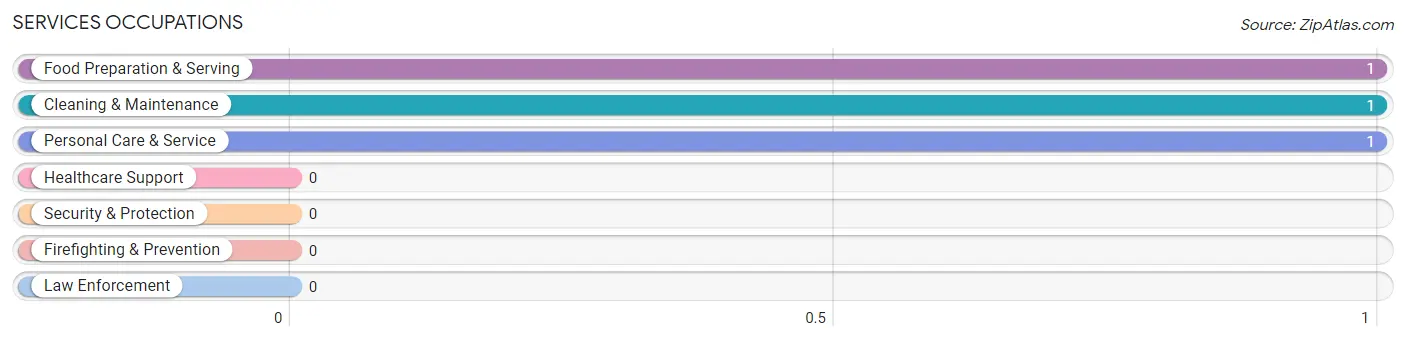
Services Occupations
The most common Services occupations in Octa are Food Preparation & Serving (1 | 4.5%), Cleaning & Maintenance (1 | 4.5%), and Personal Care & Service (1 | 4.5%).
Services Occupations by Sex
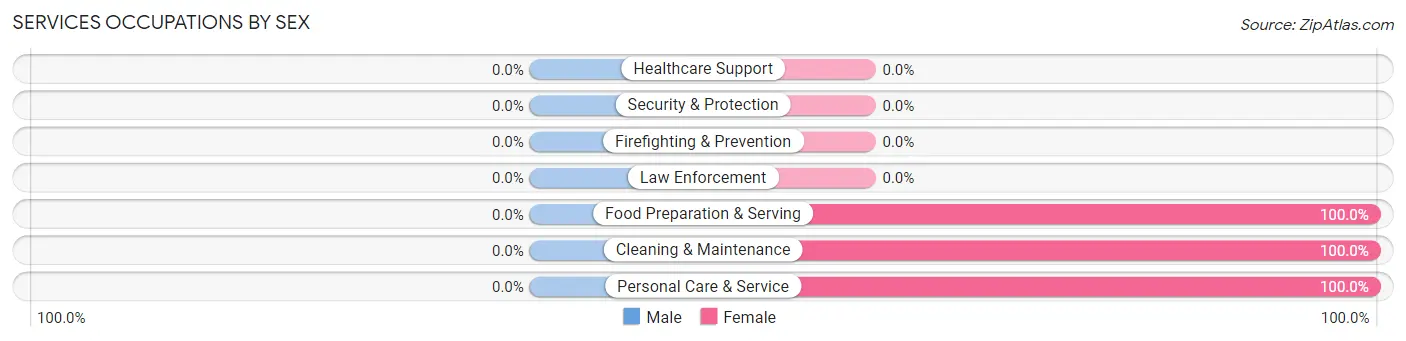
| Occupation | Male | Female |
| Healthcare Support | 0 (0.0%) | 0 (0.0%) |
| Security & Protection | 0 (0.0%) | 0 (0.0%) |
| Firefighting & Prevention | 0 (0.0%) | 0 (0.0%) |
| Law Enforcement | 0 (0.0%) | 0 (0.0%) |
| Food Preparation & Serving | 0 (0.0%) | 1 (100.0%) |
| Cleaning & Maintenance | 0 (0.0%) | 1 (100.0%) |
| Personal Care & Service | 0 (0.0%) | 1 (100.0%) |
| Total (Category) | 0 (0.0%) | 3 (100.0%) |
| Total (Overall) | 13 (59.1%) | 9 (40.9%) |
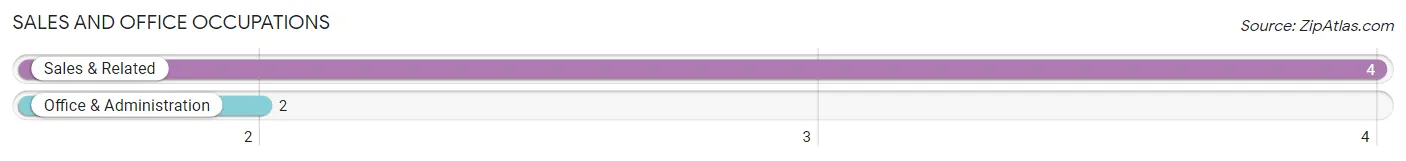
Sales and Office Occupations
The most common Sales and Office occupations in Octa are Sales & Related (4 | 18.2%), and Office & Administration (2 | 9.1%).
Sales and Office Occupations by Sex
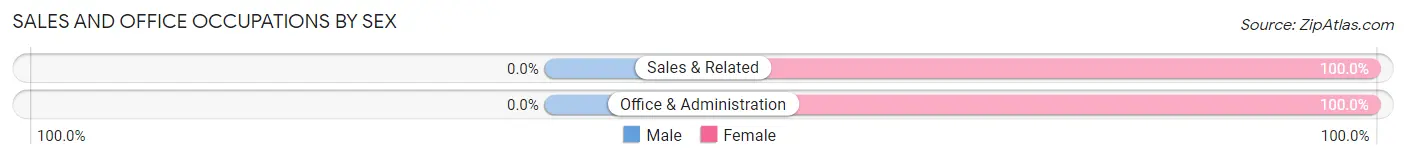
| Occupation | Male | Female |
| Sales & Related | 0 (0.0%) | 4 (100.0%) |
| Office & Administration | 0 (0.0%) | 2 (100.0%) |
| Total (Category) | 0 (0.0%) | 6 (100.0%) |
| Total (Overall) | 13 (59.1%) | 9 (40.9%) |
Natural Resources, Construction and Maintenance Occupations
The most common Natural Resources, Construction and Maintenance occupations in Octa are Farming, Fishing & Forestry (6 | 27.3%), Construction & Extraction (4 | 18.2%), and Installation, Maintenance & Repair (2 | 9.1%).
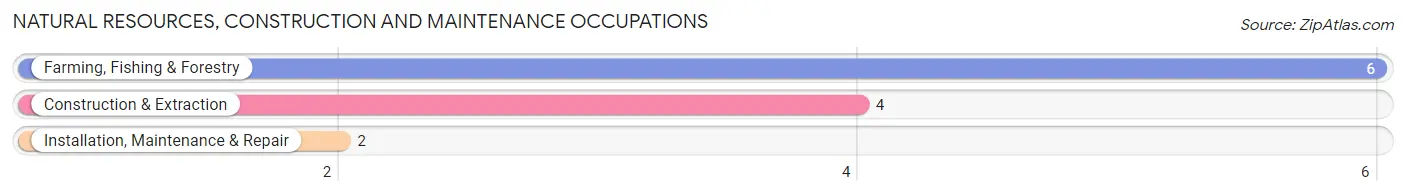
Natural Resources, Construction and Maintenance Occupations by Sex
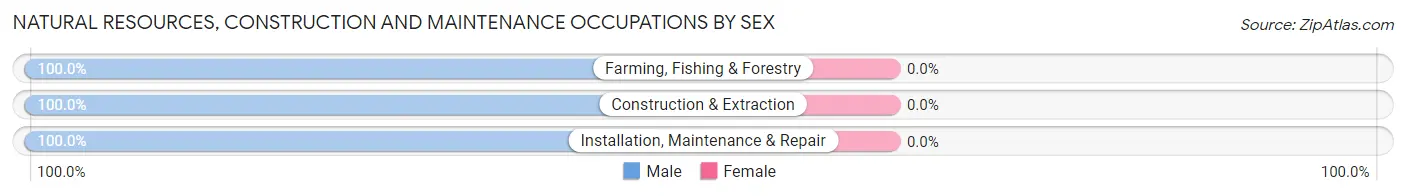
| Occupation | Male | Female |
| Farming, Fishing & Forestry | 6 (100.0%) | 0 (0.0%) |
| Construction & Extraction | 4 (100.0%) | 0 (0.0%) |
| Installation, Maintenance & Repair | 2 (100.0%) | 0 (0.0%) |
| Total (Category) | 12 (100.0%) | 0 (0.0%) |
| Total (Overall) | 13 (59.1%) | 9 (40.9%) |
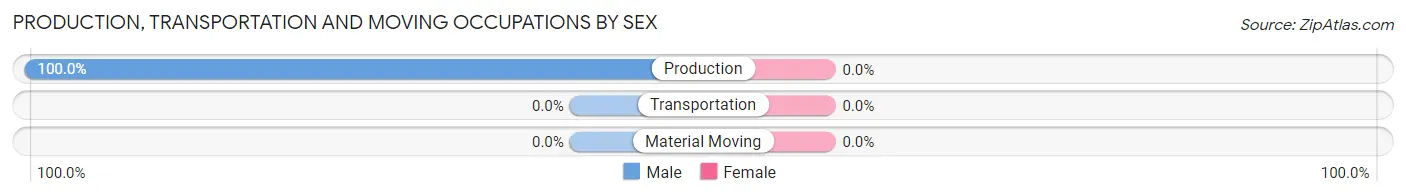
Production, Transportation and Moving Occupations
The most common Production, Transportation and Moving occupations in Octa are , and Production (1 | 4.5%).
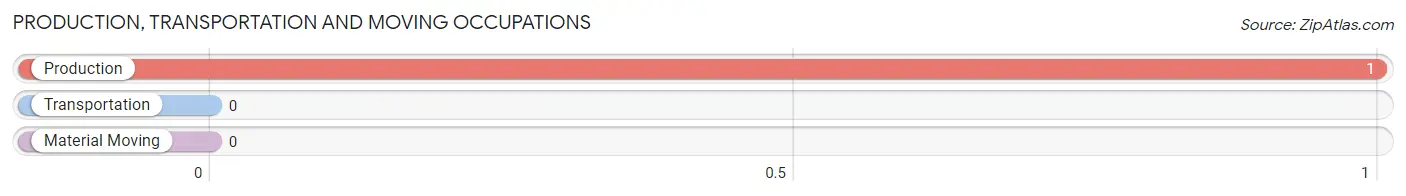
Production, Transportation and Moving Occupations by Sex
| Occupation | Male | Female |
| Production | 1 (100.0%) | 0 (0.0%) |
| Transportation | 0 (0.0%) | 0 (0.0%) |
| Material Moving | 0 (0.0%) | 0 (0.0%) |
| Total (Category) | 1 (100.0%) | 0 (0.0%) |
| Total (Overall) | 13 (59.1%) | 9 (40.9%) |
Employment Industries by Sex in Octa
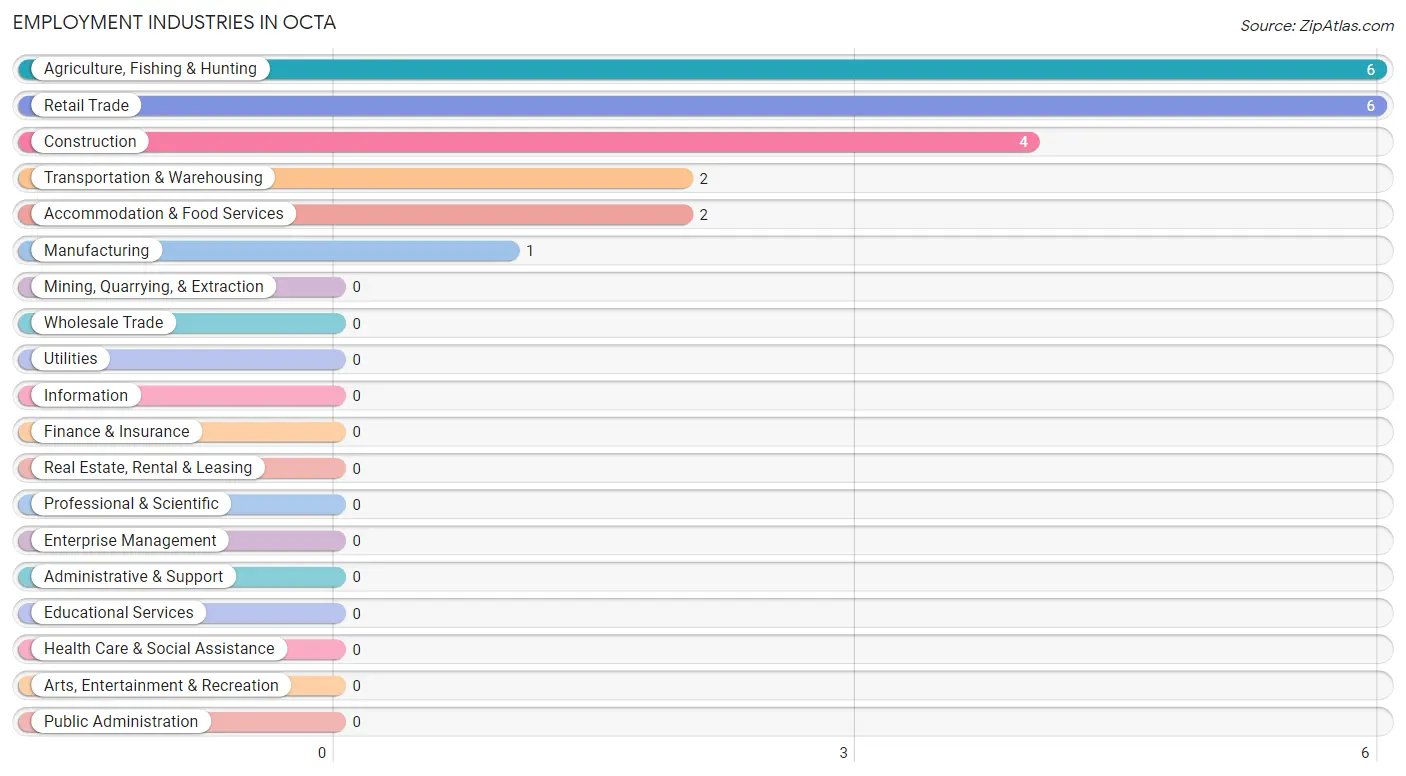
Employment Industries in Octa
The major employment industries in Octa include Agriculture, Fishing & Hunting (6 | 27.3%), Retail Trade (6 | 27.3%), Construction (4 | 18.2%), Transportation & Warehousing (2 | 9.1%), and Accommodation & Food Services (2 | 9.1%).
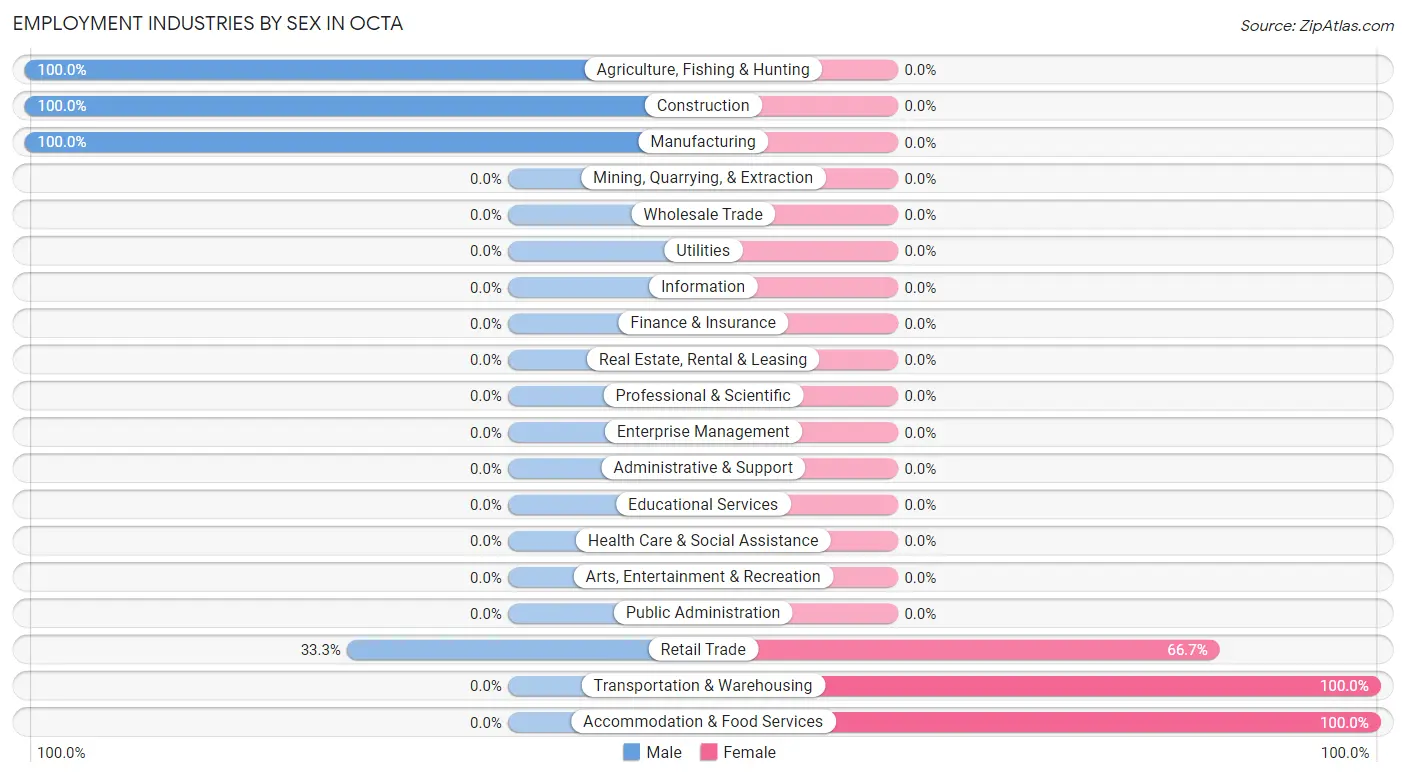
Employment Industries by Sex in Octa
The Octa industries that see more men than women are Agriculture, Fishing & Hunting (100.0%), Construction (100.0%), and Manufacturing (100.0%), whereas the industries that tend to have a higher number of women are Transportation & Warehousing (100.0%), Accommodation & Food Services (100.0%), and Retail Trade (66.7%).
| Industry | Male | Female |
| Agriculture, Fishing & Hunting | 6 (100.0%) | 0 (0.0%) |
| Mining, Quarrying, & Extraction | 0 (0.0%) | 0 (0.0%) |
| Construction | 4 (100.0%) | 0 (0.0%) |
| Manufacturing | 1 (100.0%) | 0 (0.0%) |
| Wholesale Trade | 0 (0.0%) | 0 (0.0%) |
| Retail Trade | 2 (33.3%) | 4 (66.7%) |
| Transportation & Warehousing | 0 (0.0%) | 2 (100.0%) |
| Utilities | 0 (0.0%) | 0 (0.0%) |
| Information | 0 (0.0%) | 0 (0.0%) |
| Finance & Insurance | 0 (0.0%) | 0 (0.0%) |
| Real Estate, Rental & Leasing | 0 (0.0%) | 0 (0.0%) |
| Professional & Scientific | 0 (0.0%) | 0 (0.0%) |
| Enterprise Management | 0 (0.0%) | 0 (0.0%) |
| Administrative & Support | 0 (0.0%) | 0 (0.0%) |
| Educational Services | 0 (0.0%) | 0 (0.0%) |
| Health Care & Social Assistance | 0 (0.0%) | 0 (0.0%) |
| Arts, Entertainment & Recreation | 0 (0.0%) | 0 (0.0%) |
| Accommodation & Food Services | 0 (0.0%) | 2 (100.0%) |
| Public Administration | 0 (0.0%) | 0 (0.0%) |
| Total | 13 (59.1%) | 9 (40.9%) |
Education in Octa
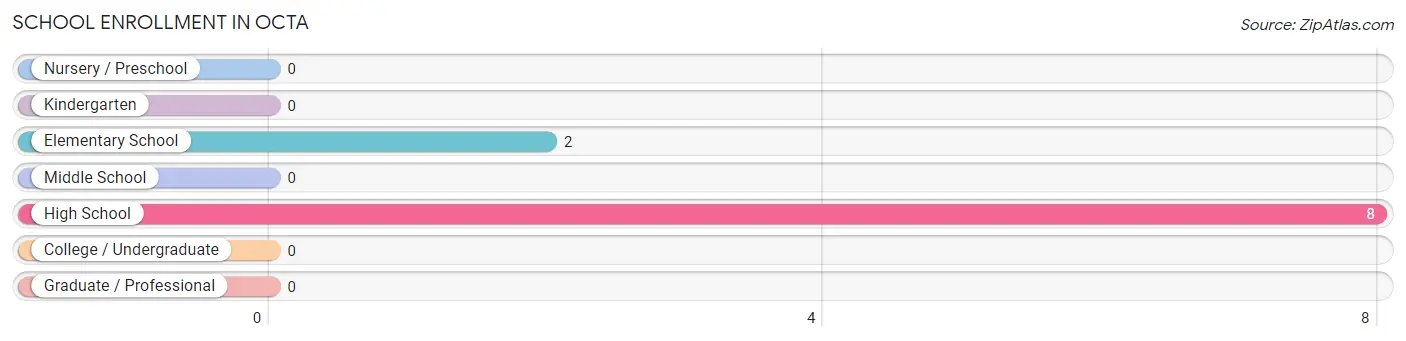
School Enrollment in Octa
The most common levels of schooling among the 10 students in Octa are high school (8 | 80.0%), and elementary school (2 | 20.0%).
| School Level | # Students | % Students |
| Nursery / Preschool | 0 | 0.0% |
| Kindergarten | 0 | 0.0% |
| Elementary School | 2 | 20.0% |
| Middle School | 0 | 0.0% |
| High School | 8 | 80.0% |
| College / Undergraduate | 0 | 0.0% |
| Graduate / Professional | 0 | 0.0% |
| Total | 10 | 100.0% |
School Enrollment by Age by Funding Source in Octa
Out of a total of 10 students who are enrolled in schools in Octa, 5 (50.0%) attend a private institution, while the remaining 5 (50.0%) are enrolled in public schools. The age group of 18 to 19 year olds has the highest likelihood of being enrolled in private schools, with 2 (100.0% in the age bracket) enrolled. Conversely, the age group of 5 to 9 year old has the lowest likelihood of being enrolled in a private school, with 2 (100.0% in the age bracket) attending a public institution.
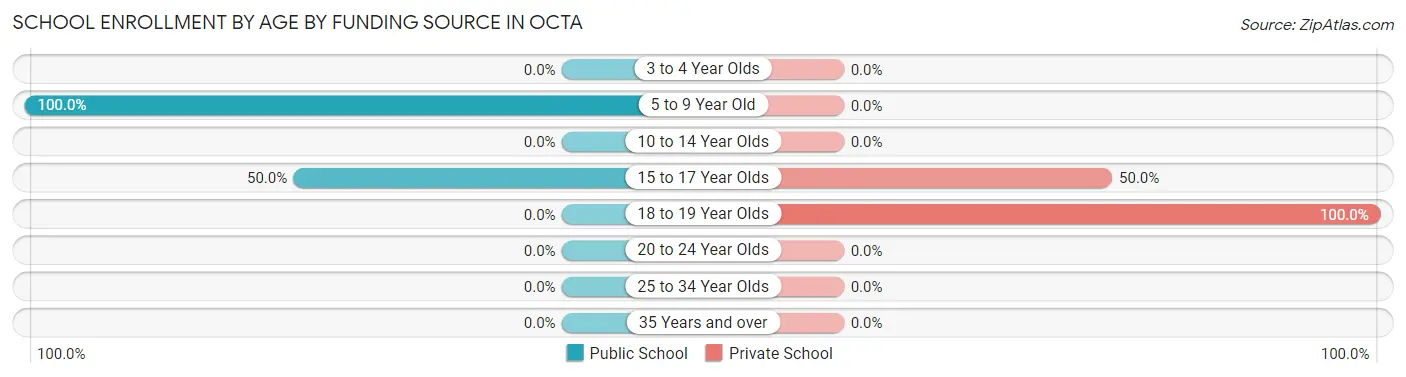
| Age Bracket | Public School | Private School |
| 3 to 4 Year Olds | 0 (0.0%) | 0 (0.0%) |
| 5 to 9 Year Old | 2 (100.0%) | 0 (0.0%) |
| 10 to 14 Year Olds | 0 (0.0%) | 0 (0.0%) |
| 15 to 17 Year Olds | 3 (50.0%) | 3 (50.0%) |
| 18 to 19 Year Olds | 0 (0.0%) | 2 (100.0%) |
| 20 to 24 Year Olds | 0 (0.0%) | 0 (0.0%) |
| 25 to 34 Year Olds | 0 (0.0%) | 0 (0.0%) |
| 35 Years and over | 0 (0.0%) | 0 (0.0%) |
| Total | 5 (50.0%) | 5 (50.0%) |
Educational Attainment by Field of Study in Octa
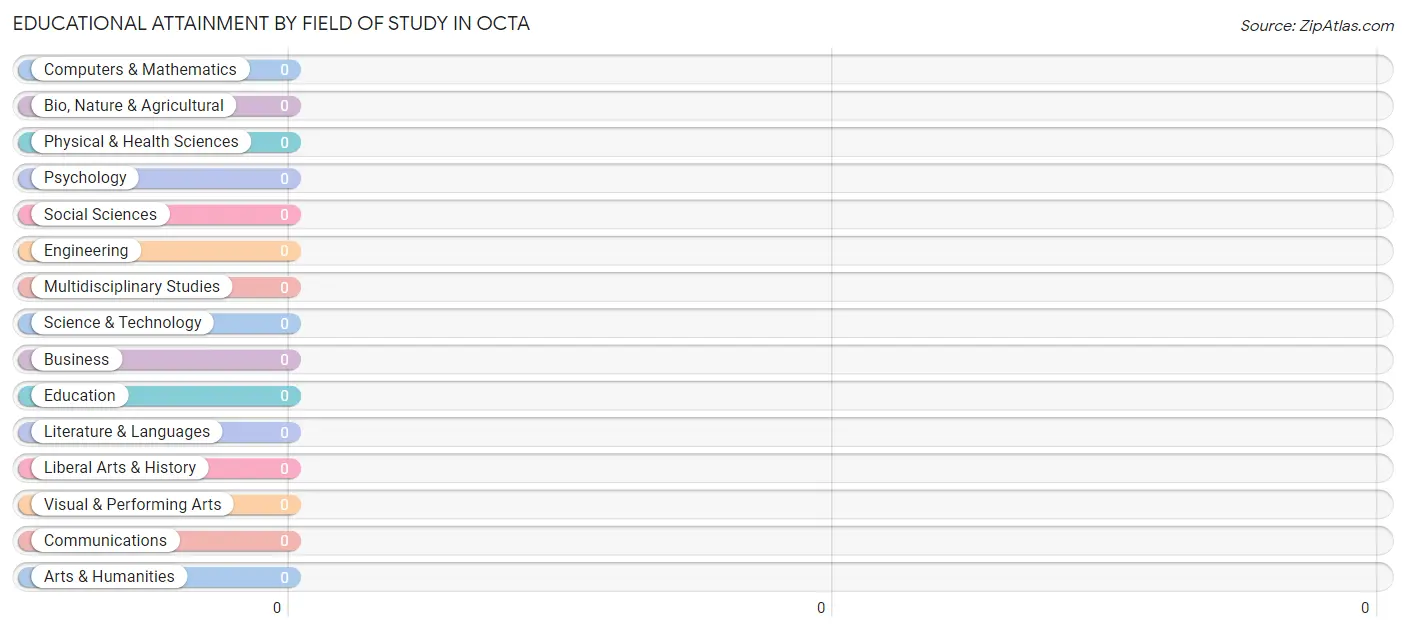
| Field of Study | # Graduates | % Graduates |
| Computers & Mathematics | 0 | 0.0% |
| Bio, Nature & Agricultural | 0 | 0.0% |
| Physical & Health Sciences | 0 | 0.0% |
| Psychology | 0 | 0.0% |
| Social Sciences | 0 | 0.0% |
| Engineering | 0 | 0.0% |
| Multidisciplinary Studies | 0 | 0.0% |
| Science & Technology | 0 | 0.0% |
| Business | 0 | 0.0% |
| Education | 0 | 0.0% |
| Literature & Languages | 0 | 0.0% |
| Liberal Arts & History | 0 | 0.0% |
| Visual & Performing Arts | 0 | 0.0% |
| Communications | 0 | 0.0% |
| Arts & Humanities | 0 | 0.0% |
| Total | 0 | 0.0% |
Transportation & Commute in Octa
Vehicle Availability by Sex in Octa
The most prevalent vehicle ownership categories in Octa are males with 2 vehicles (8, accounting for 72.7%) and females with 2 vehicles (5, making up 100.0%).
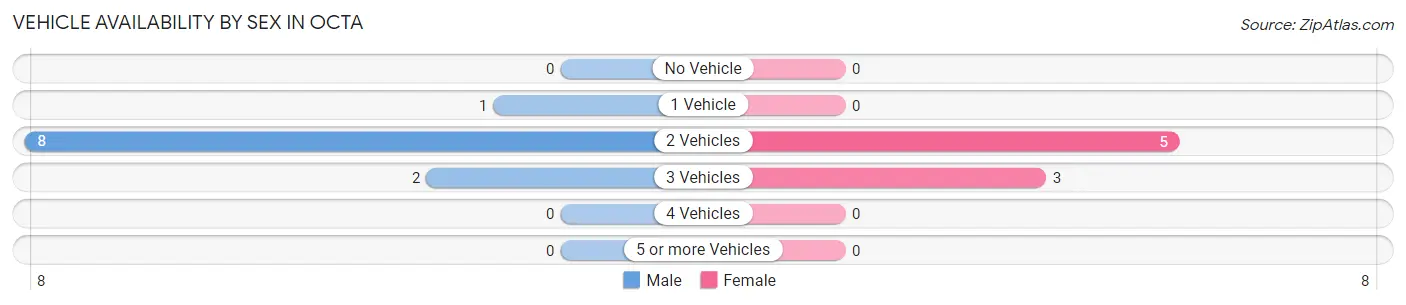
| Vehicles Available | Male | Female |
| No Vehicle | 0 (0.0%) | 0 (0.0%) |
| 1 Vehicle | 1 (9.1%) | 0 (0.0%) |
| 2 Vehicles | 8 (72.7%) | 5 (62.5%) |
| 3 Vehicles | 2 (18.2%) | 3 (37.5%) |
| 4 Vehicles | 0 (0.0%) | 0 (0.0%) |
| 5 or more Vehicles | 0 (0.0%) | 0 (0.0%) |
| Total | 11 (100.0%) | 8 (100.0%) |
Commute Time in Octa
The most frequently occuring commute durations in Octa are 20 to 24 minutes (8 commuters, 42.1%), 5 to 9 minutes (5 commuters, 26.3%), and 15 to 19 minutes (3 commuters, 15.8%).
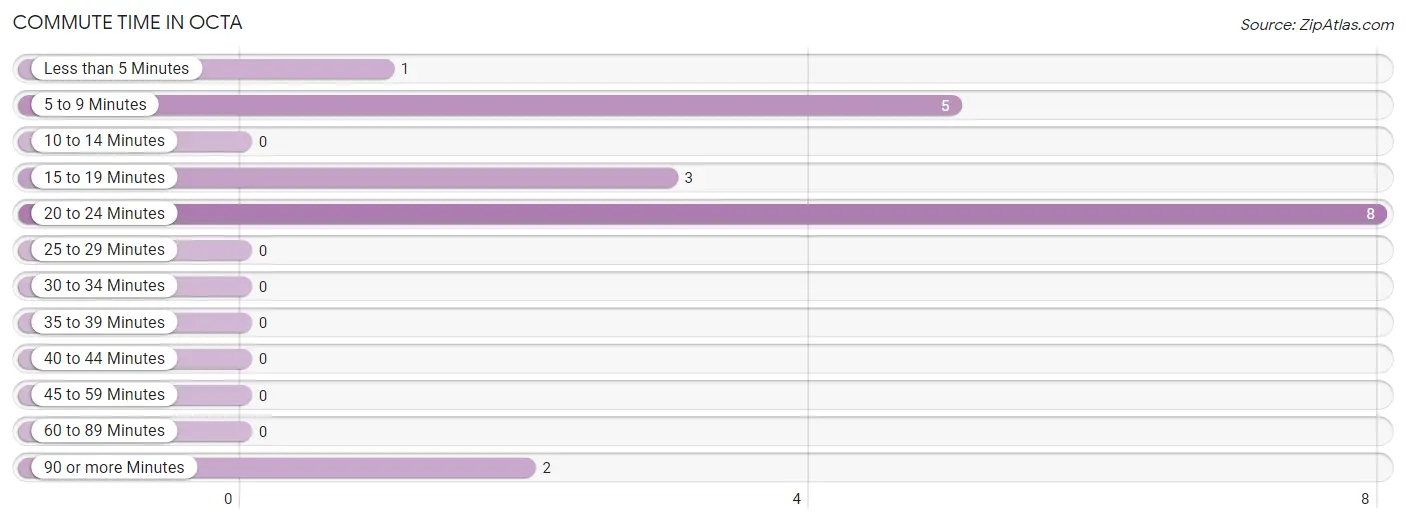
| Commute Time | # Commuters | % Commuters |
| Less than 5 Minutes | 1 | 5.3% |
| 5 to 9 Minutes | 5 | 26.3% |
| 10 to 14 Minutes | 0 | 0.0% |
| 15 to 19 Minutes | 3 | 15.8% |
| 20 to 24 Minutes | 8 | 42.1% |
| 25 to 29 Minutes | 0 | 0.0% |
| 30 to 34 Minutes | 0 | 0.0% |
| 35 to 39 Minutes | 0 | 0.0% |
| 40 to 44 Minutes | 0 | 0.0% |
| 45 to 59 Minutes | 0 | 0.0% |
| 60 to 89 Minutes | 0 | 0.0% |
| 90 or more Minutes | 2 | 10.5% |
Commute Time by Sex in Octa
The most common commute times in Octa are 20 to 24 minutes (8 commuters, 72.7%) for males and 5 to 9 minutes (5 commuters, 62.5%) for females.
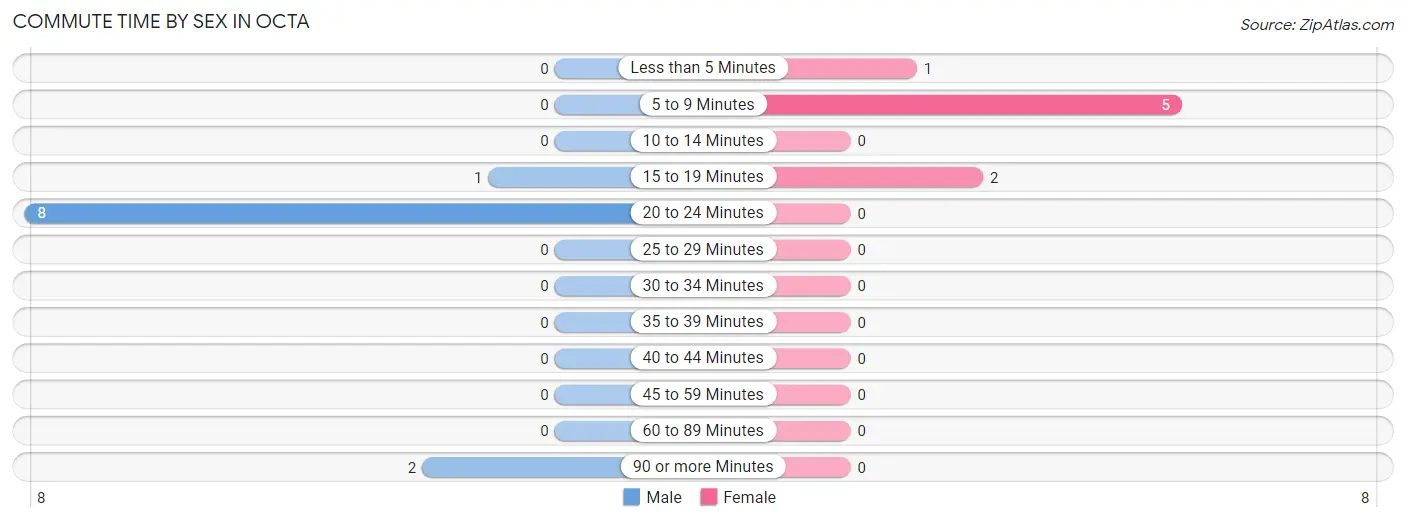
| Commute Time | Male | Female |
| Less than 5 Minutes | 0 (0.0%) | 1 (12.5%) |
| 5 to 9 Minutes | 0 (0.0%) | 5 (62.5%) |
| 10 to 14 Minutes | 0 (0.0%) | 0 (0.0%) |
| 15 to 19 Minutes | 1 (9.1%) | 2 (25.0%) |
| 20 to 24 Minutes | 8 (72.7%) | 0 (0.0%) |
| 25 to 29 Minutes | 0 (0.0%) | 0 (0.0%) |
| 30 to 34 Minutes | 0 (0.0%) | 0 (0.0%) |
| 35 to 39 Minutes | 0 (0.0%) | 0 (0.0%) |
| 40 to 44 Minutes | 0 (0.0%) | 0 (0.0%) |
| 45 to 59 Minutes | 0 (0.0%) | 0 (0.0%) |
| 60 to 89 Minutes | 0 (0.0%) | 0 (0.0%) |
| 90 or more Minutes | 2 (18.2%) | 0 (0.0%) |
Time of Departure to Work by Sex in Octa
The most frequent times of departure to work in Octa are 5:30 AM to 5:59 AM (4, 36.4%) for males and 12:00 AM to 4:59 AM (4, 50.0%) for females.
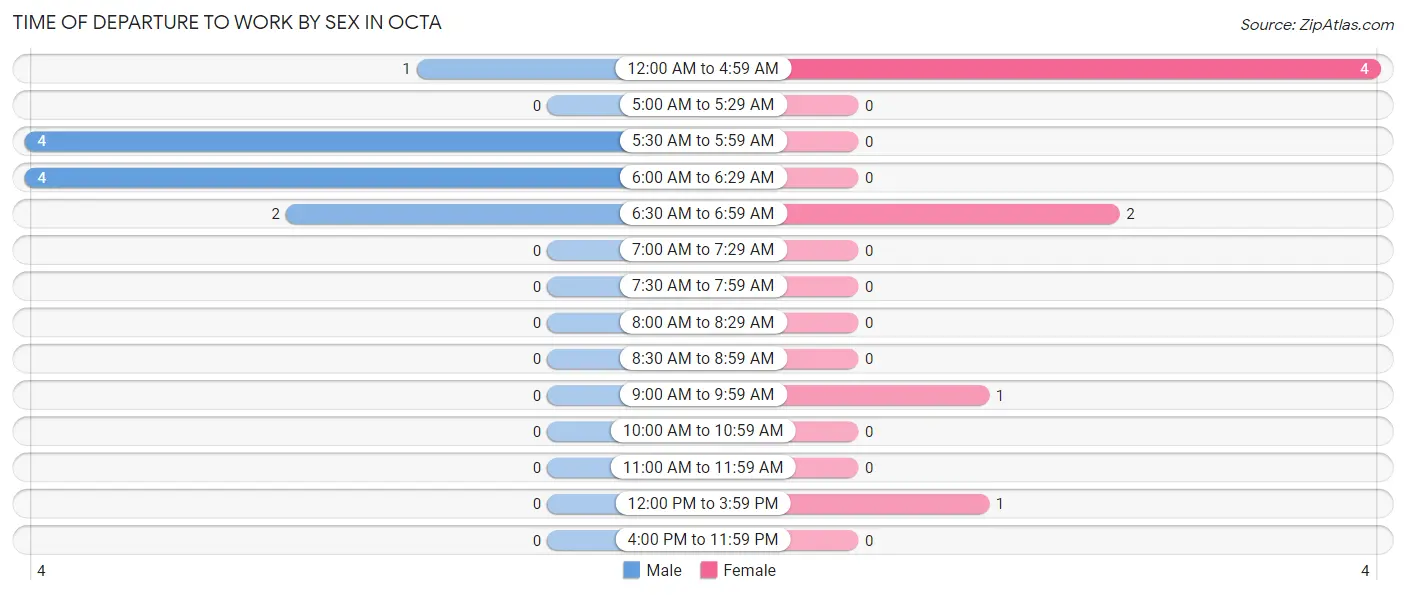
| Time of Departure | Male | Female |
| 12:00 AM to 4:59 AM | 1 (9.1%) | 4 (50.0%) |
| 5:00 AM to 5:29 AM | 0 (0.0%) | 0 (0.0%) |
| 5:30 AM to 5:59 AM | 4 (36.4%) | 0 (0.0%) |
| 6:00 AM to 6:29 AM | 4 (36.4%) | 0 (0.0%) |
| 6:30 AM to 6:59 AM | 2 (18.2%) | 2 (25.0%) |
| 7:00 AM to 7:29 AM | 0 (0.0%) | 0 (0.0%) |
| 7:30 AM to 7:59 AM | 0 (0.0%) | 0 (0.0%) |
| 8:00 AM to 8:29 AM | 0 (0.0%) | 0 (0.0%) |
| 8:30 AM to 8:59 AM | 0 (0.0%) | 0 (0.0%) |
| 9:00 AM to 9:59 AM | 0 (0.0%) | 1 (12.5%) |
| 10:00 AM to 10:59 AM | 0 (0.0%) | 0 (0.0%) |
| 11:00 AM to 11:59 AM | 0 (0.0%) | 0 (0.0%) |
| 12:00 PM to 3:59 PM | 0 (0.0%) | 1 (12.5%) |
| 4:00 PM to 11:59 PM | 0 (0.0%) | 0 (0.0%) |
| Total | 11 (100.0%) | 8 (100.0%) |
Housing Occupancy in Octa
Occupancy by Ownership in Octa
Of the total 27 dwellings in Octa, owner-occupied units account for 23 (85.2%), while renter-occupied units make up 4 (14.8%).
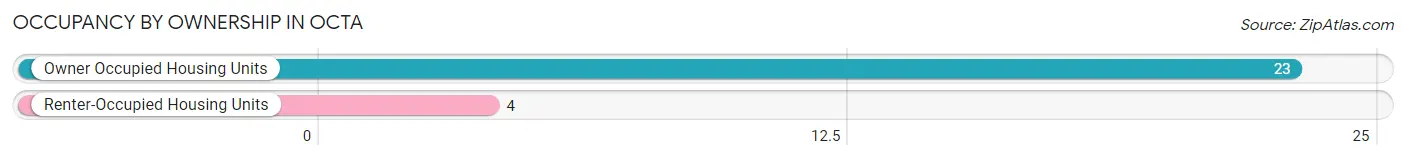
| Occupancy | # Housing Units | % Housing Units |
| Owner Occupied Housing Units | 23 | 85.2% |
| Renter-Occupied Housing Units | 4 | 14.8% |
| Total Occupied Housing Units | 27 | 100.0% |
Occupancy by Household Size in Octa
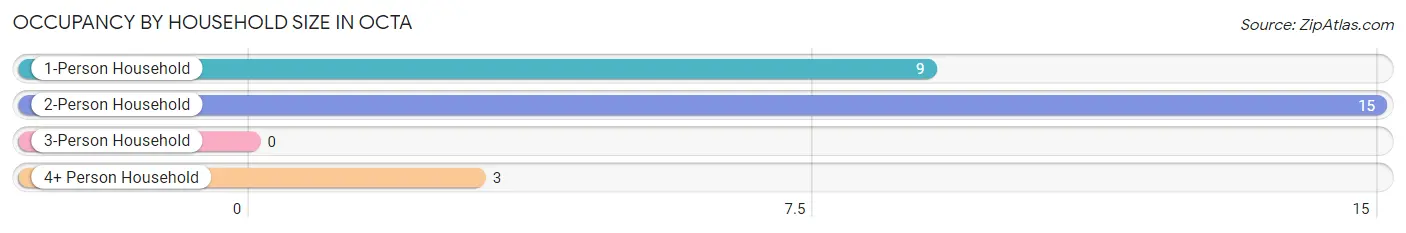
| Household Size | # Housing Units | % Housing Units |
| 1-Person Household | 9 | 33.3% |
| 2-Person Household | 15 | 55.6% |
| 3-Person Household | 0 | 0.0% |
| 4+ Person Household | 3 | 11.1% |
| Total Housing Units | 27 | 100.0% |
Occupancy by Ownership by Household Size in Octa
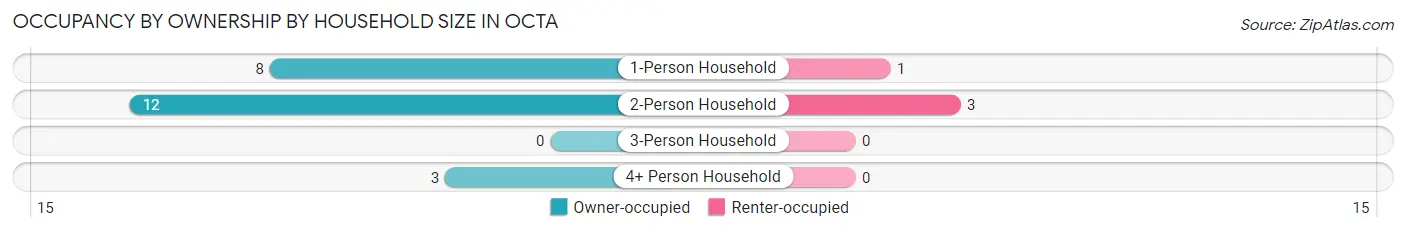
| Household Size | Owner-occupied | Renter-occupied |
| 1-Person Household | 8 (88.9%) | 1 (11.1%) |
| 2-Person Household | 12 (80.0%) | 3 (20.0%) |
| 3-Person Household | 0 (0.0%) | 0 (0.0%) |
| 4+ Person Household | 3 (100.0%) | 0 (0.0%) |
| Total Housing Units | 23 (85.2%) | 4 (14.8%) |
Occupancy by Educational Attainment in Octa
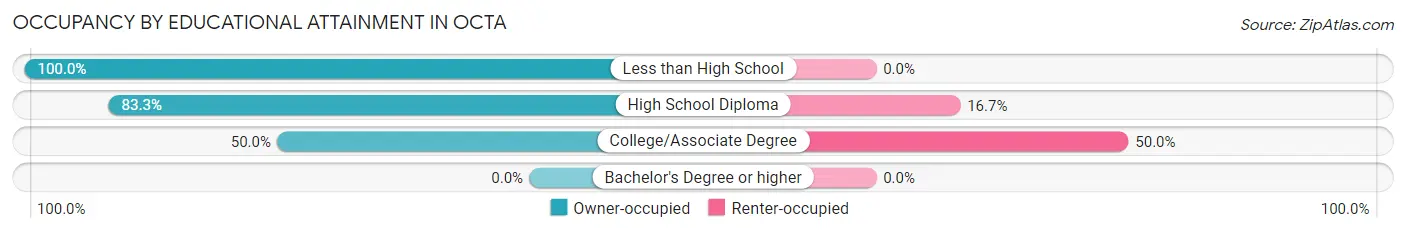
| Household Size | Owner-occupied | Renter-occupied |
| Less than High School | 11 (100.0%) | 0 (0.0%) |
| High School Diploma | 10 (83.3%) | 2 (16.7%) |
| College/Associate Degree | 2 (50.0%) | 2 (50.0%) |
| Bachelor's Degree or higher | 0 (0.0%) | 0 (0.0%) |
Occupancy by Age of Householder in Octa
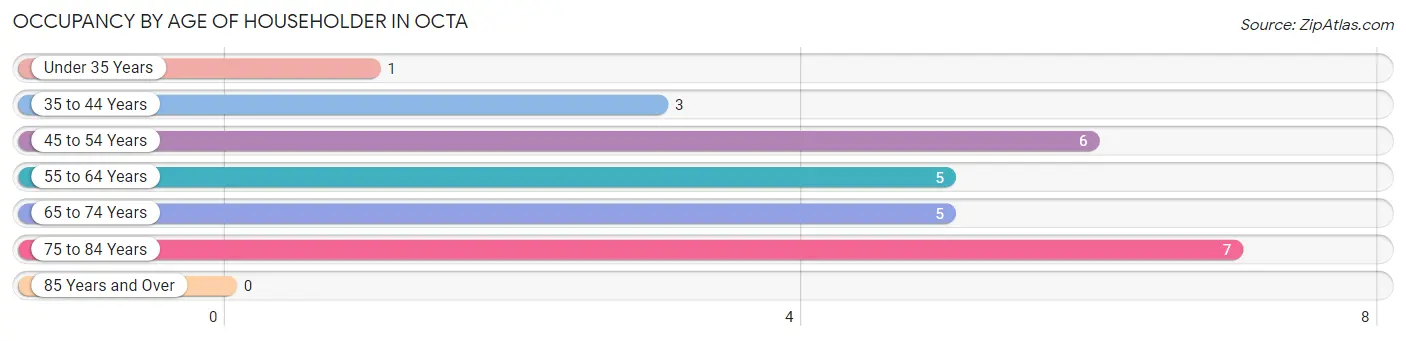
| Age Bracket | # Households | % Households |
| Under 35 Years | 1 | 3.7% |
| 35 to 44 Years | 3 | 11.1% |
| 45 to 54 Years | 6 | 22.2% |
| 55 to 64 Years | 5 | 18.5% |
| 65 to 74 Years | 5 | 18.5% |
| 75 to 84 Years | 7 | 25.9% |
| 85 Years and Over | 0 | 0.0% |
| Total | 27 | 100.0% |
Housing Finances in Octa
Median Income by Occupancy in Octa
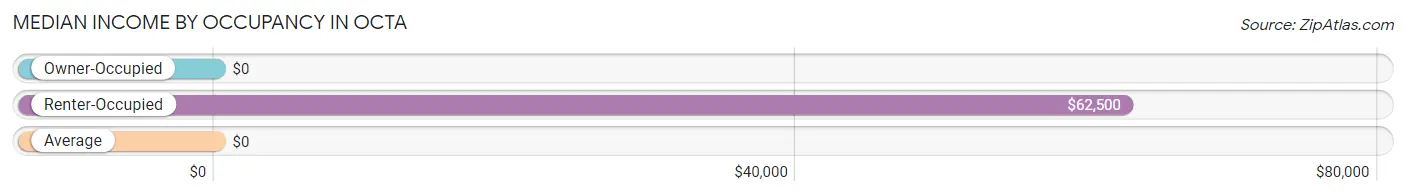
| Occupancy Type | # Households | Median Income |
| Owner-Occupied | 23 (85.2%) | $0 |
| Renter-Occupied | 4 (14.8%) | $62,500 |
| Average | 27 (100.0%) | $0 |
Occupancy by Householder Income Bracket in Octa
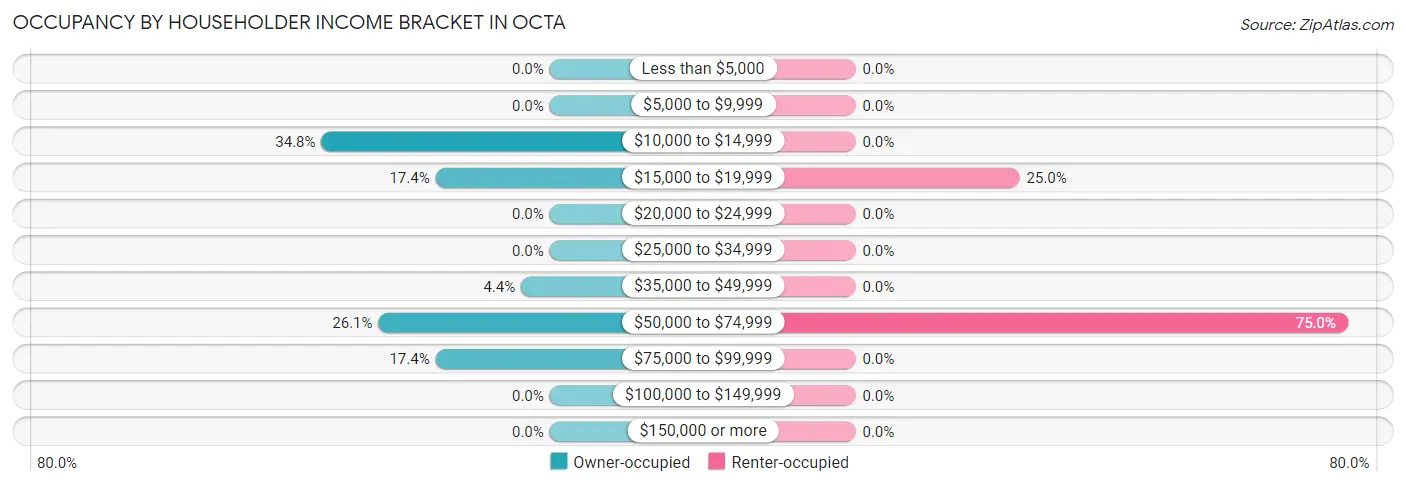
| Income Bracket | Owner-occupied | Renter-occupied |
| Less than $5,000 | 0 (0.0%) | 0 (0.0%) |
| $5,000 to $9,999 | 0 (0.0%) | 0 (0.0%) |
| $10,000 to $14,999 | 8 (34.8%) | 0 (0.0%) |
| $15,000 to $19,999 | 4 (17.4%) | 1 (25.0%) |
| $20,000 to $24,999 | 0 (0.0%) | 0 (0.0%) |
| $25,000 to $34,999 | 0 (0.0%) | 0 (0.0%) |
| $35,000 to $49,999 | 1 (4.3%) | 0 (0.0%) |
| $50,000 to $74,999 | 6 (26.1%) | 3 (75.0%) |
| $75,000 to $99,999 | 4 (17.4%) | 0 (0.0%) |
| $100,000 to $149,999 | 0 (0.0%) | 0 (0.0%) |
| $150,000 or more | 0 (0.0%) | 0 (0.0%) |
| Total | 23 (100.0%) | 4 (100.0%) |
Monthly Housing Cost Tiers in Octa
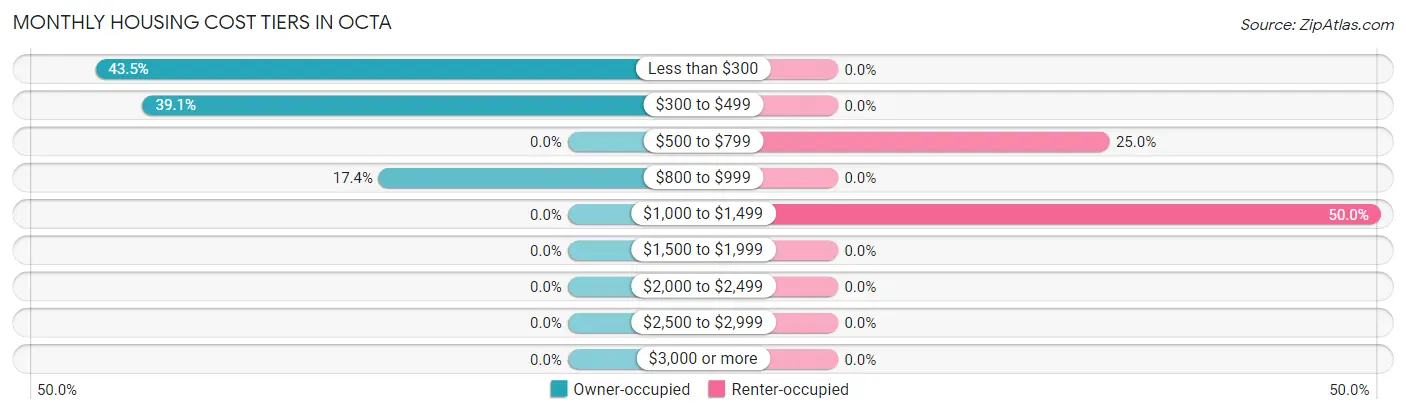
| Monthly Cost | Owner-occupied | Renter-occupied |
| Less than $300 | 10 (43.5%) | 0 (0.0%) |
| $300 to $499 | 9 (39.1%) | 0 (0.0%) |
| $500 to $799 | 0 (0.0%) | 1 (25.0%) |
| $800 to $999 | 4 (17.4%) | 0 (0.0%) |
| $1,000 to $1,499 | 0 (0.0%) | 2 (50.0%) |
| $1,500 to $1,999 | 0 (0.0%) | 0 (0.0%) |
| $2,000 to $2,499 | 0 (0.0%) | 0 (0.0%) |
| $2,500 to $2,999 | 0 (0.0%) | 0 (0.0%) |
| $3,000 or more | 0 (0.0%) | 0 (0.0%) |
| Total | 23 (100.0%) | 4 (100.0%) |
Physical Housing Characteristics in Octa
Housing Structures in Octa
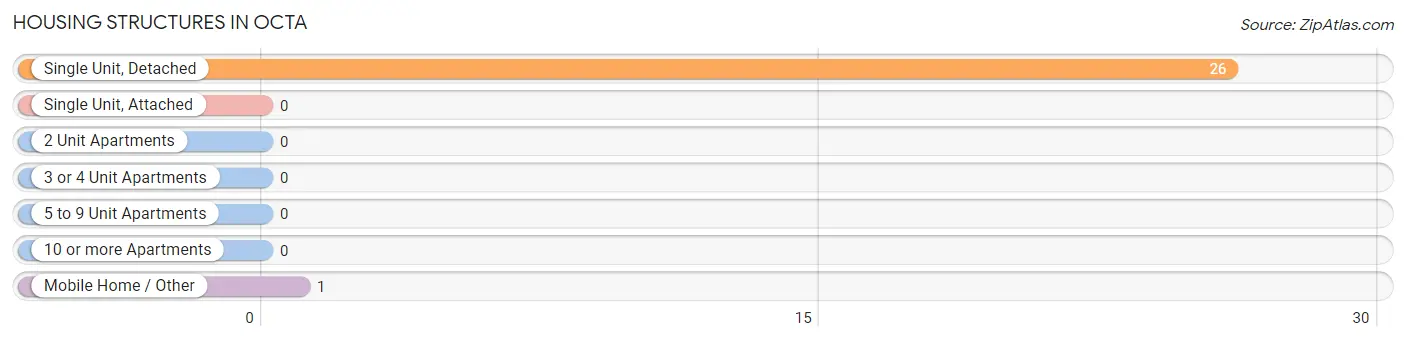
| Structure Type | # Housing Units | % Housing Units |
| Single Unit, Detached | 26 | 96.3% |
| Single Unit, Attached | 0 | 0.0% |
| 2 Unit Apartments | 0 | 0.0% |
| 3 or 4 Unit Apartments | 0 | 0.0% |
| 5 to 9 Unit Apartments | 0 | 0.0% |
| 10 or more Apartments | 0 | 0.0% |
| Mobile Home / Other | 1 | 3.7% |
| Total | 27 | 100.0% |
Housing Structures by Occupancy in Octa
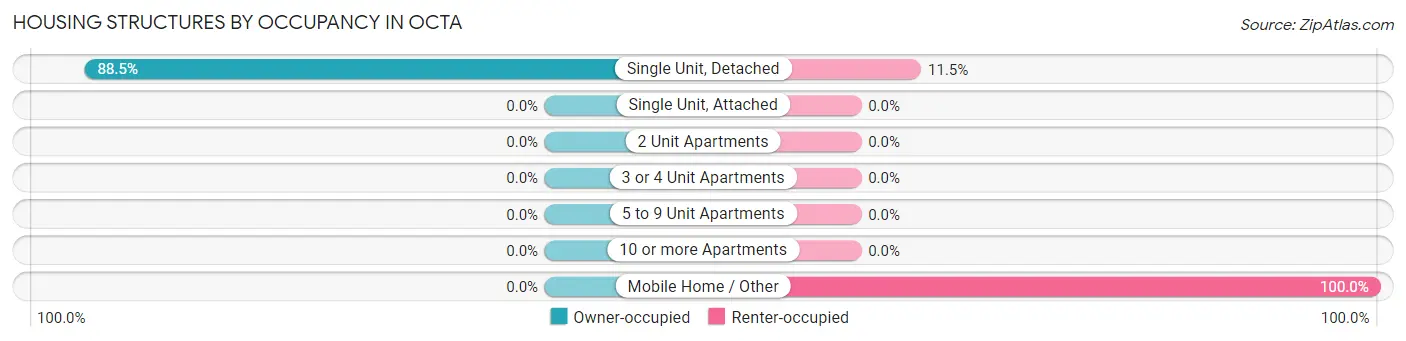
| Structure Type | Owner-occupied | Renter-occupied |
| Single Unit, Detached | 23 (88.5%) | 3 (11.5%) |
| Single Unit, Attached | 0 (0.0%) | 0 (0.0%) |
| 2 Unit Apartments | 0 (0.0%) | 0 (0.0%) |
| 3 or 4 Unit Apartments | 0 (0.0%) | 0 (0.0%) |
| 5 to 9 Unit Apartments | 0 (0.0%) | 0 (0.0%) |
| 10 or more Apartments | 0 (0.0%) | 0 (0.0%) |
| Mobile Home / Other | 0 (0.0%) | 1 (100.0%) |
| Total | 23 (85.2%) | 4 (14.8%) |
Housing Structures by Number of Rooms in Octa
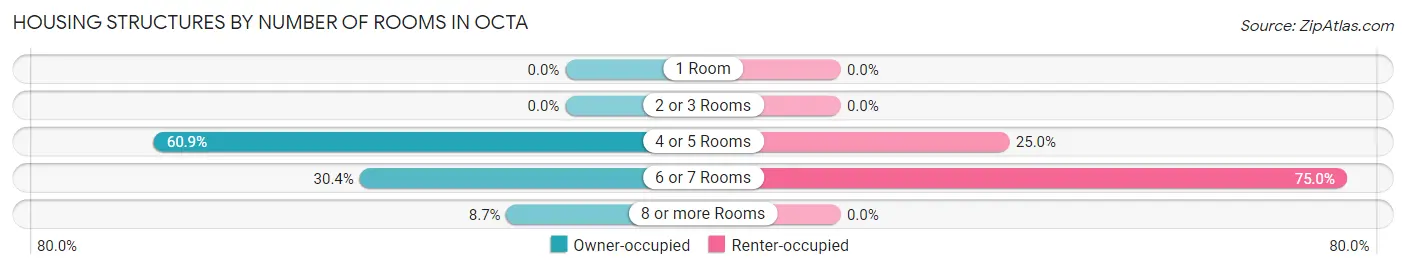
| Number of Rooms | Owner-occupied | Renter-occupied |
| 1 Room | 0 (0.0%) | 0 (0.0%) |
| 2 or 3 Rooms | 0 (0.0%) | 0 (0.0%) |
| 4 or 5 Rooms | 14 (60.9%) | 1 (25.0%) |
| 6 or 7 Rooms | 7 (30.4%) | 3 (75.0%) |
| 8 or more Rooms | 2 (8.7%) | 0 (0.0%) |
| Total | 23 (100.0%) | 4 (100.0%) |
Housing Structure by Heating Type in Octa
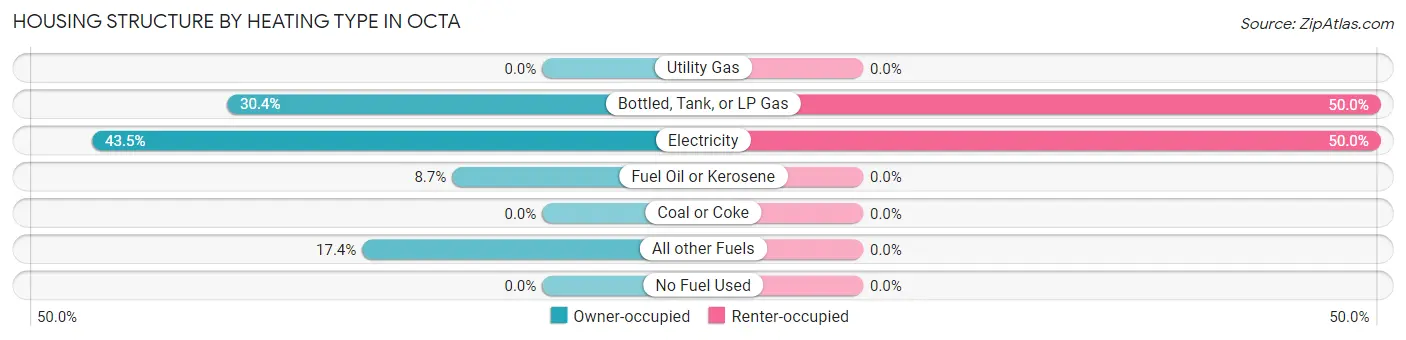
| Heating Type | Owner-occupied | Renter-occupied |
| Utility Gas | 0 (0.0%) | 0 (0.0%) |
| Bottled, Tank, or LP Gas | 7 (30.4%) | 2 (50.0%) |
| Electricity | 10 (43.5%) | 2 (50.0%) |
| Fuel Oil or Kerosene | 2 (8.7%) | 0 (0.0%) |
| Coal or Coke | 0 (0.0%) | 0 (0.0%) |
| All other Fuels | 4 (17.4%) | 0 (0.0%) |
| No Fuel Used | 0 (0.0%) | 0 (0.0%) |
| Total | 23 (100.0%) | 4 (100.0%) |
Household Vehicle Usage in Octa
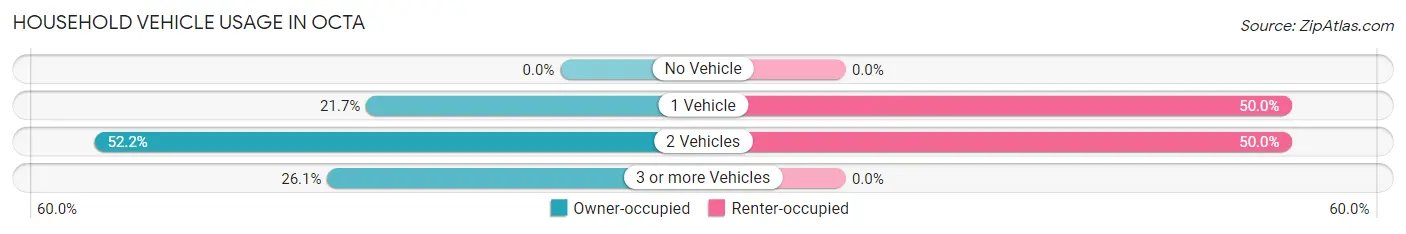
| Vehicles per Household | Owner-occupied | Renter-occupied |
| No Vehicle | 0 (0.0%) | 0 (0.0%) |
| 1 Vehicle | 5 (21.7%) | 2 (50.0%) |
| 2 Vehicles | 12 (52.2%) | 2 (50.0%) |
| 3 or more Vehicles | 6 (26.1%) | 0 (0.0%) |
| Total | 23 (100.0%) | 4 (100.0%) |
Real Estate & Mortgages in Octa
Real Estate and Mortgage Overview in Octa
| Characteristic | Without Mortgage | With Mortgage |
| Housing Units | 19 | 4 |
| Median Property Value | $73,600 | $0 |
| Median Household Income | - | - |
| Monthly Housing Costs | $275 | $0 |
| Real Estate Taxes | $525 | $0 |
Property Value by Mortgage Status in Octa
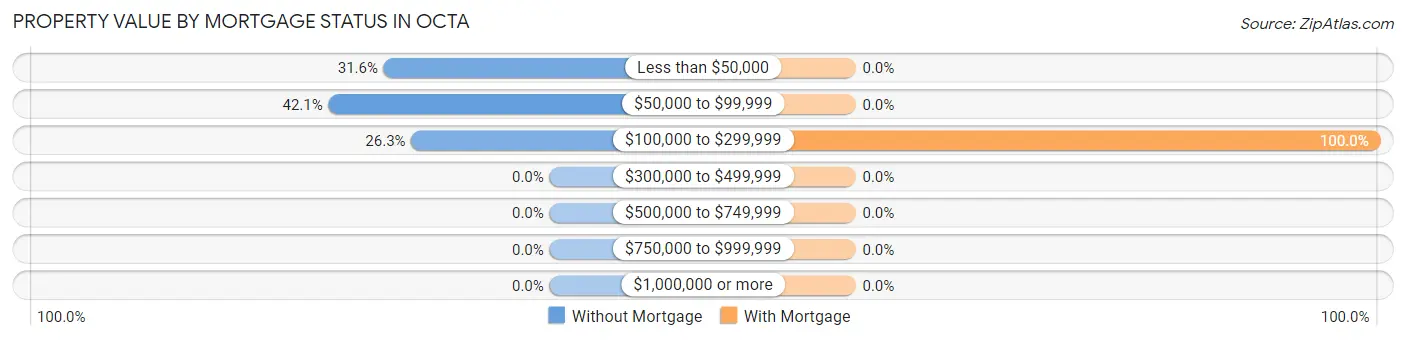
| Property Value | Without Mortgage | With Mortgage |
| Less than $50,000 | 6 (31.6%) | 0 (0.0%) |
| $50,000 to $99,999 | 8 (42.1%) | 0 (0.0%) |
| $100,000 to $299,999 | 5 (26.3%) | 4 (100.0%) |
| $300,000 to $499,999 | 0 (0.0%) | 0 (0.0%) |
| $500,000 to $749,999 | 0 (0.0%) | 0 (0.0%) |
| $750,000 to $999,999 | 0 (0.0%) | 0 (0.0%) |
| $1,000,000 or more | 0 (0.0%) | 0 (0.0%) |
| Total | 19 (100.0%) | 4 (100.0%) |
Household Income by Mortgage Status in Octa
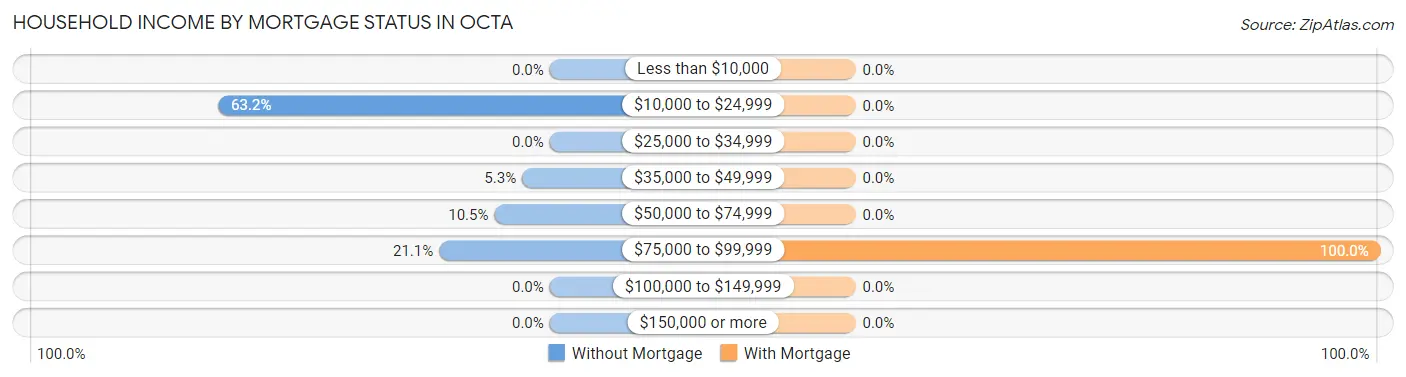
| Household Income | Without Mortgage | With Mortgage |
| Less than $10,000 | 0 (0.0%) | 0 (0.0%) |
| $10,000 to $24,999 | 12 (63.2%) | 0 (0.0%) |
| $25,000 to $34,999 | 0 (0.0%) | 0 (0.0%) |
| $35,000 to $49,999 | 1 (5.3%) | 0 (0.0%) |
| $50,000 to $74,999 | 2 (10.5%) | 0 (0.0%) |
| $75,000 to $99,999 | 4 (21.0%) | 4 (100.0%) |
| $100,000 to $149,999 | 0 (0.0%) | 0 (0.0%) |
| $150,000 or more | 0 (0.0%) | 0 (0.0%) |
| Total | 19 (100.0%) | 4 (100.0%) |
Property Value to Household Income Ratio in Octa
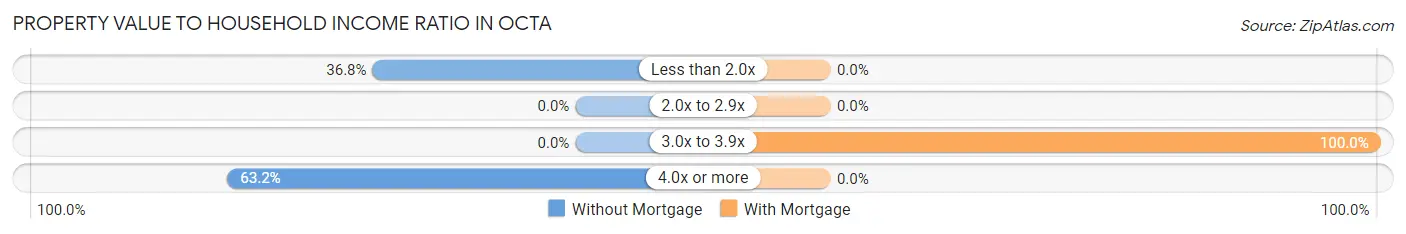
| Value-to-Income Ratio | Without Mortgage | With Mortgage |
| Less than 2.0x | 7 (36.8%) | 0 (0.0%) |
| 2.0x to 2.9x | 0 (0.0%) | 0 (0.0%) |
| 3.0x to 3.9x | 0 (0.0%) | 4 (100.0%) |
| 4.0x or more | 12 (63.2%) | 0 (0.0%) |
| Total | 19 (100.0%) | 4 (100.0%) |
Real Estate Taxes by Mortgage Status in Octa
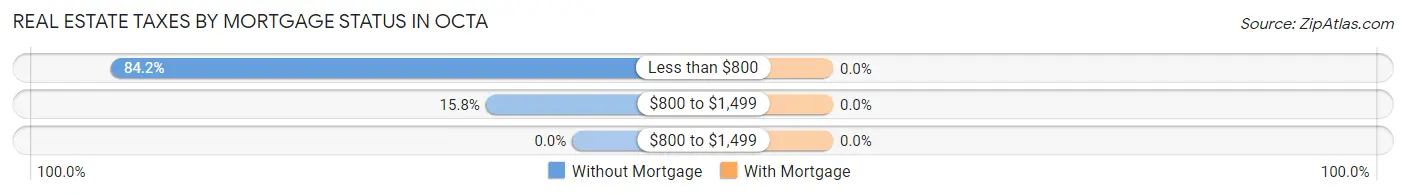
| Property Taxes | Without Mortgage | With Mortgage |
| Less than $800 | 16 (84.2%) | 0 (0.0%) |
| $800 to $1,499 | 3 (15.8%) | 0 (0.0%) |
| $800 to $1,499 | 0 (0.0%) | 0 (0.0%) |
| Total | 19 (100.0%) | 4 (100.0%) |
Health & Disability in Octa
Health Insurance Coverage by Age in Octa
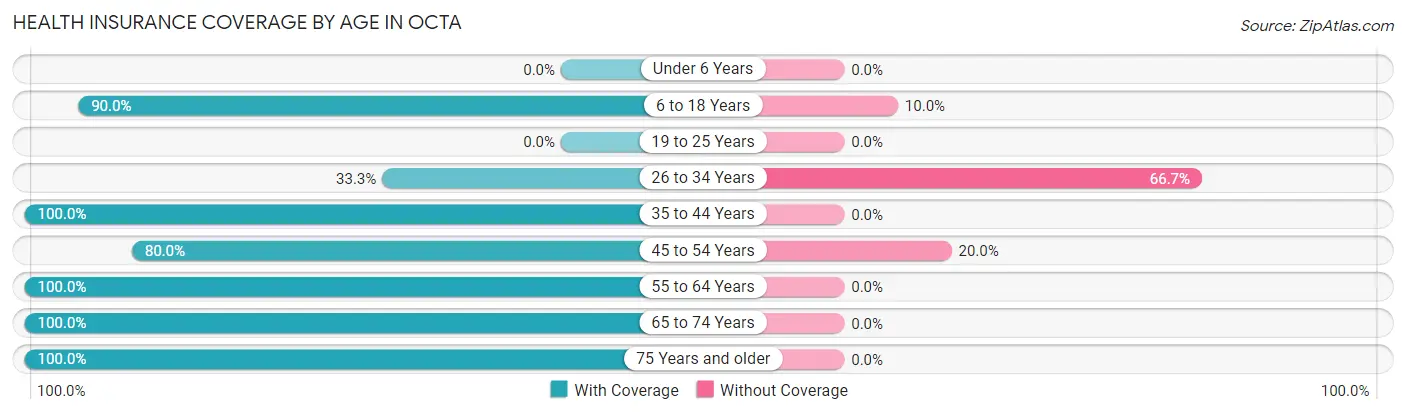
| Age Bracket | With Coverage | Without Coverage |
| Under 6 Years | 0 (0.0%) | 0 (0.0%) |
| 6 to 18 Years | 9 (90.0%) | 1 (10.0%) |
| 19 to 25 Years | 0 (0.0%) | 0 (0.0%) |
| 26 to 34 Years | 1 (33.3%) | 2 (66.7%) |
| 35 to 44 Years | 5 (100.0%) | 0 (0.0%) |
| 45 to 54 Years | 8 (80.0%) | 2 (20.0%) |
| 55 to 64 Years | 7 (100.0%) | 0 (0.0%) |
| 65 to 74 Years | 5 (100.0%) | 0 (0.0%) |
| 75 Years and older | 10 (100.0%) | 0 (0.0%) |
| Total | 45 (90.0%) | 5 (10.0%) |
Health Insurance Coverage by Citizenship Status in Octa
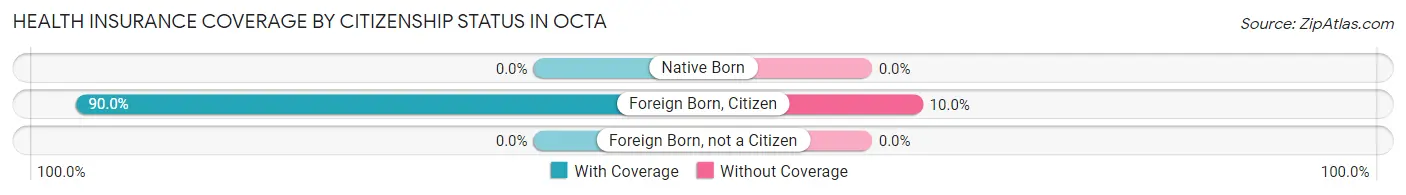
| Citizenship Status | With Coverage | Without Coverage |
| Native Born | 0 (0.0%) | 0 (0.0%) |
| Foreign Born, Citizen | 9 (90.0%) | 1 (10.0%) |
| Foreign Born, not a Citizen | 0 (0.0%) | 0 (0.0%) |
Health Insurance Coverage by Household Income in Octa
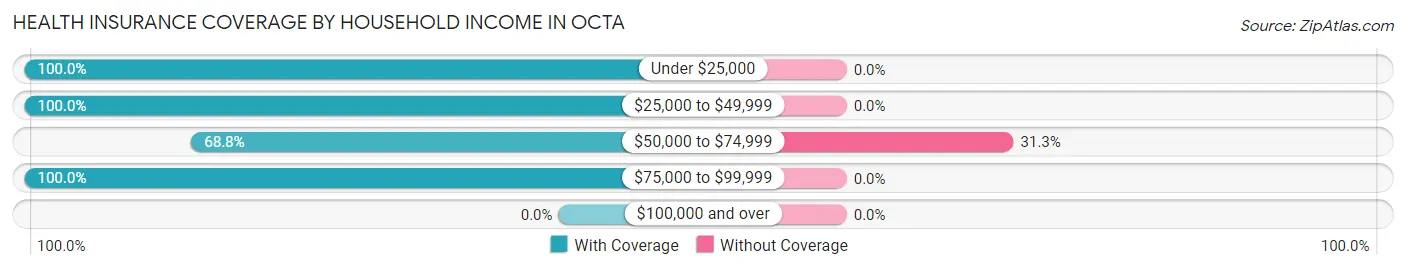
| Household Income | With Coverage | Without Coverage |
| Under $25,000 | 18 (100.0%) | 0 (0.0%) |
| $25,000 to $49,999 | 8 (100.0%) | 0 (0.0%) |
| $50,000 to $74,999 | 11 (68.8%) | 5 (31.2%) |
| $75,000 to $99,999 | 8 (100.0%) | 0 (0.0%) |
| $100,000 and over | 0 (0.0%) | 0 (0.0%) |
Public vs Private Health Insurance Coverage by Age in Octa
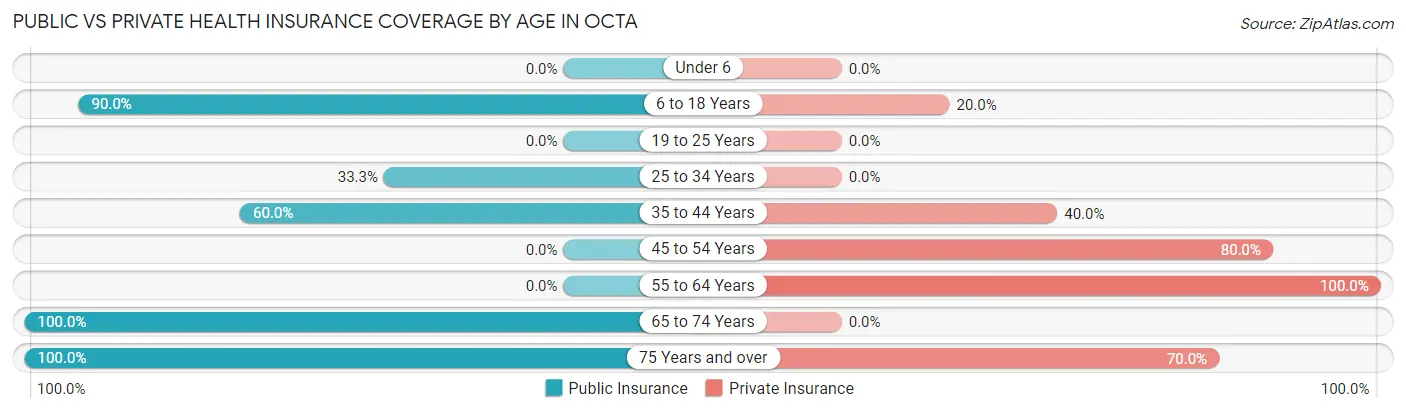
| Age Bracket | Public Insurance | Private Insurance |
| Under 6 | 0 (0.0%) | 0 (0.0%) |
| 6 to 18 Years | 9 (90.0%) | 2 (20.0%) |
| 19 to 25 Years | 0 (0.0%) | 0 (0.0%) |
| 25 to 34 Years | 1 (33.3%) | 0 (0.0%) |
| 35 to 44 Years | 3 (60.0%) | 2 (40.0%) |
| 45 to 54 Years | 0 (0.0%) | 8 (80.0%) |
| 55 to 64 Years | 0 (0.0%) | 7 (100.0%) |
| 65 to 74 Years | 5 (100.0%) | 0 (0.0%) |
| 75 Years and over | 10 (100.0%) | 7 (70.0%) |
| Total | 28 (56.0%) | 26 (52.0%) |
Disability Status by Sex by Age in Octa
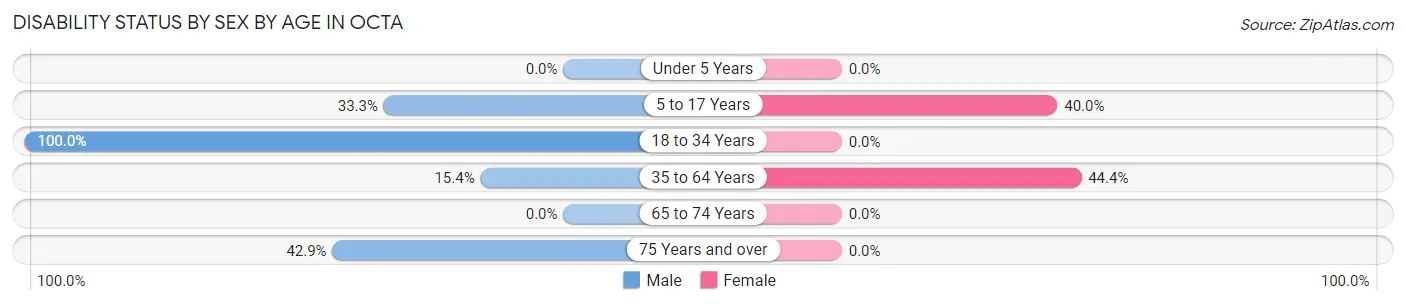
| Age Bracket | Male | Female |
| Under 5 Years | 0 (0.0%) | 0 (0.0%) |
| 5 to 17 Years | 1 (33.3%) | 2 (40.0%) |
| 18 to 34 Years | 4 (100.0%) | 0 (0.0%) |
| 35 to 64 Years | 2 (15.4%) | 4 (44.4%) |
| 65 to 74 Years | 0 (0.0%) | 0 (0.0%) |
| 75 Years and over | 3 (42.9%) | 0 (0.0%) |
Disability Class by Sex by Age in Octa
Disability Class: Hearing Difficulty
| Age Bracket | Male | Female |
| Under 5 Years | 0 (0.0%) | 0 (0.0%) |
| 5 to 17 Years | 0 (0.0%) | 0 (0.0%) |
| 18 to 34 Years | 0 (0.0%) | 0 (0.0%) |
| 35 to 64 Years | 0 (0.0%) | 0 (0.0%) |
| 65 to 74 Years | 0 (0.0%) | 0 (0.0%) |
| 75 Years and over | 0 (0.0%) | 0 (0.0%) |
Disability Class: Vision Difficulty
| Age Bracket | Male | Female |
| Under 5 Years | 0 (0.0%) | 0 (0.0%) |
| 5 to 17 Years | 0 (0.0%) | 0 (0.0%) |
| 18 to 34 Years | 0 (0.0%) | 0 (0.0%) |
| 35 to 64 Years | 0 (0.0%) | 0 (0.0%) |
| 65 to 74 Years | 0 (0.0%) | 0 (0.0%) |
| 75 Years and over | 0 (0.0%) | 0 (0.0%) |
Disability Class: Cognitive Difficulty
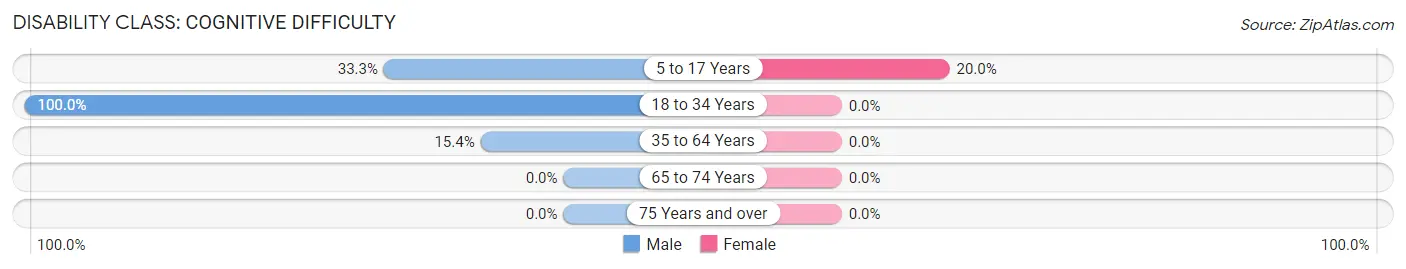
| Age Bracket | Male | Female |
| 5 to 17 Years | 1 (33.3%) | 1 (20.0%) |
| 18 to 34 Years | 4 (100.0%) | 0 (0.0%) |
| 35 to 64 Years | 2 (15.4%) | 0 (0.0%) |
| 65 to 74 Years | 0 (0.0%) | 0 (0.0%) |
| 75 Years and over | 0 (0.0%) | 0 (0.0%) |
Disability Class: Ambulatory Difficulty
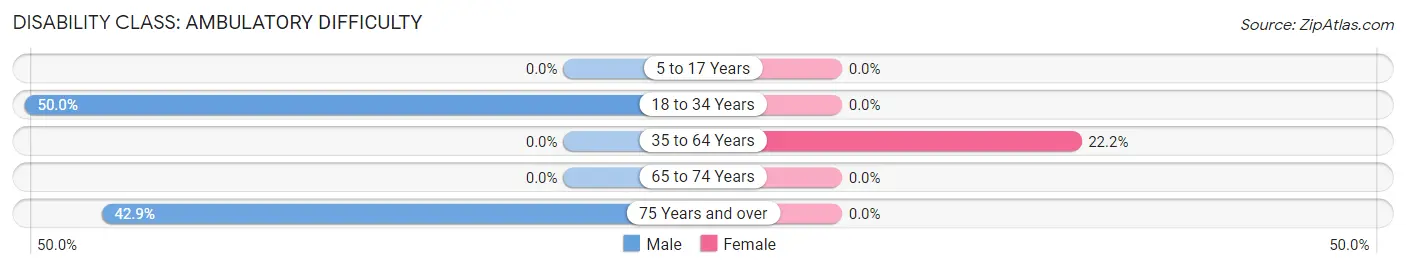
| Age Bracket | Male | Female |
| 5 to 17 Years | 0 (0.0%) | 0 (0.0%) |
| 18 to 34 Years | 2 (50.0%) | 0 (0.0%) |
| 35 to 64 Years | 0 (0.0%) | 2 (22.2%) |
| 65 to 74 Years | 0 (0.0%) | 0 (0.0%) |
| 75 Years and over | 3 (42.9%) | 0 (0.0%) |
Disability Class: Self-Care Difficulty
| Age Bracket | Male | Female |
| 5 to 17 Years | 0 (0.0%) | 0 (0.0%) |
| 18 to 34 Years | 0 (0.0%) | 0 (0.0%) |
| 35 to 64 Years | 0 (0.0%) | 0 (0.0%) |
| 65 to 74 Years | 0 (0.0%) | 0 (0.0%) |
| 75 Years and over | 0 (0.0%) | 0 (0.0%) |
Technology Access in Octa
Computing Device Access in Octa
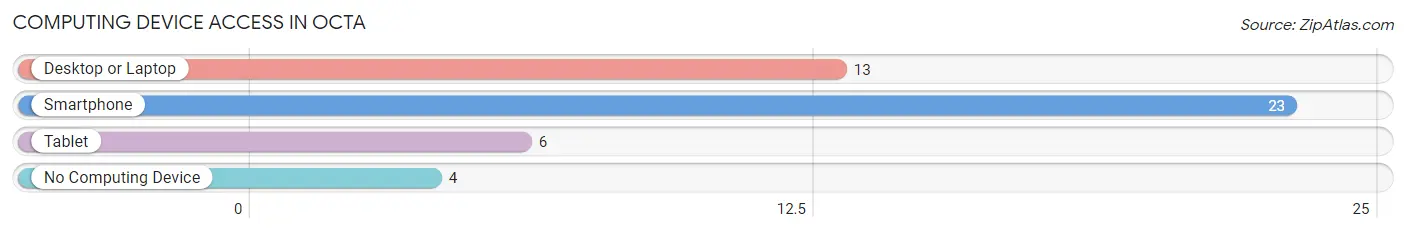
| Device Type | # Households | % Households |
| Desktop or Laptop | 13 | 48.1% |
| Smartphone | 23 | 85.2% |
| Tablet | 6 | 22.2% |
| No Computing Device | 4 | 14.8% |
| Total | 27 | 100.0% |
Internet Access in Octa
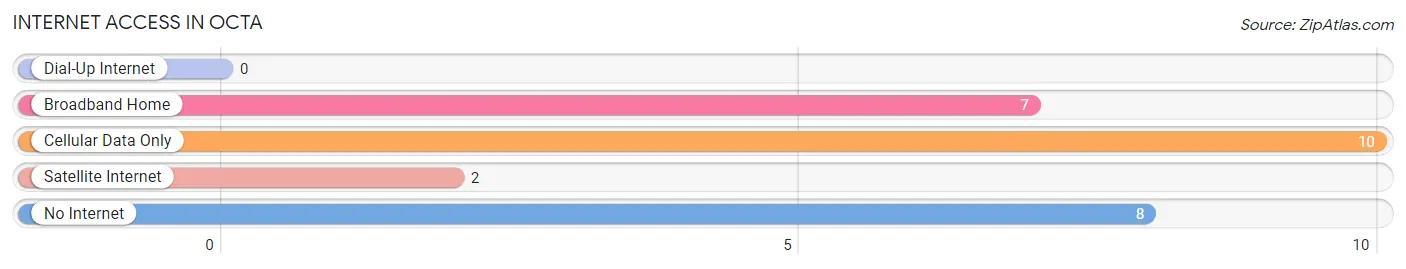
| Internet Type | # Households | % Households |
| Dial-Up Internet | 0 | 0.0% |
| Broadband Home | 7 | 25.9% |
| Cellular Data Only | 10 | 37.0% |
| Satellite Internet | 2 | 7.4% |
| No Internet | 8 | 29.6% |
| Total | 27 | 100.0% |
Octa Summary
OH History
Ohio is a state located in the Midwestern United States. It is the 34th largest state in the country and the 7th most populous. Ohio was the 17th state to join the Union on March 1, 1803. The state was named after the Ohio River, which was named by the Iroquois word for “great river”. Ohio was originally part of the Northwest Territory, which was created in 1787. The Northwest Territory was divided into smaller territories, and Ohio became its own territory in 1800.
Ohio has a rich history that dates back to the Native Americans who lived in the area. The first Europeans to explore the area were French fur traders in the late 1600s. The first permanent settlement in Ohio was Marietta, which was founded in 1788. Ohio was part of the Northwest Territory until it became its own state in 1803.
Ohio played an important role in the Civil War. It was the first state to send troops to the Union army and was the site of several major battles. After the war, Ohio became an important industrial center. The state was home to many of the nation’s leading industrialists, including John D. Rockefeller and Henry Ford.
Ohio was also an important part of the civil rights movement. The state was home to several important civil rights leaders, including Martin Luther King Jr. and Rosa Parks. Ohio was also the site of several important civil rights protests, including the Freedom Summer of 1964.
Geography
Ohio is located in the Midwestern United States. It is bordered by Michigan to the north, Pennsylvania to the east, West Virginia to the southeast, Kentucky to the southwest, and Indiana to the west. The state has a total area of 44,825 square miles, making it the 34th largest state in the country.
Ohio is divided into 88 counties. The state is divided into two distinct regions: the Appalachian Plateau in the east and the Central Lowlands in the west. The Appalachian Plateau is a rugged, hilly region that is home to many of Ohio’s major cities, including Cleveland, Akron, and Youngstown. The Central Lowlands are a flat, fertile region that is home to many of Ohio’s agricultural areas.
The Ohio River is the largest river in the state. It forms the border between Ohio and Kentucky and is an important source of water for the state. Other major rivers in Ohio include the Scioto, Muskingum, and Cuyahoga Rivers.
Economy
Ohio has a diverse economy that is driven by manufacturing, agriculture, and services. The state is home to many major corporations, including Procter & Gamble, Goodyear Tire & Rubber, and Marathon Petroleum.
Manufacturing is the largest sector of the Ohio economy. The state is home to many major manufacturing companies, including General Motors, Ford Motor Company, and Honda. Ohio is also home to many smaller manufacturing companies that produce a variety of products, including auto parts, medical equipment, and food products.
Agriculture is also an important part of the Ohio economy. The state is home to many large farms that produce a variety of crops, including corn, soybeans, wheat, and hay. Ohio is also home to many smaller farms that produce fruits, vegetables, and livestock.
Services are also an important part of the Ohio economy. The state is home to many financial institutions, including banks, insurance companies, and investment firms. Ohio is also home to many healthcare providers, including hospitals, clinics, and nursing homes.
Demographics
As of 2019, Ohio had an estimated population of 11.7 million people. The state has a population density of 282 people per square mile, making it the 7th most populous state in the country.
The largest racial group in Ohio is white, making up 81.2% of the population. The second largest racial group is African American, making up 12.3% of the population. Other racial groups include Asian (2.7%), Hispanic (2.3%), and Native American (0.4%).
The median household income in Ohio is $54,822, which is slightly lower than the national median of $61,937. The poverty rate in Ohio is 13.2%, which is slightly higher than the national rate of 11.8%. The largest industries in Ohio are manufacturing, healthcare, and retail trade.
Common Questions
What is Per Capita Income in Octa?
Per Capita income in Octa is $21,126.
What is the Median Family Income in Octa?
Median Family Income in Octa is $59,375.
What is Income or Wage Gap in Octa?
Income or Wage Gap in Octa is 50.9%.
Women in Octa earn 49.1 cents for every dollar earned by a man.
What is Inequality or Gini Index in Octa?
Inequality or Gini Index in Octa is 0.36.
What is the Total Population of Octa?
Total Population of Octa is 50.
What is the Total Male Population of Octa?
Total Male Population of Octa is 27.
What is the Total Female Population of Octa?
Total Female Population of Octa is 23.
What is the Ratio of Males per 100 Females in Octa?
There are 117.39 Males per 100 Females in Octa.
What is the Ratio of Females per 100 Males in Octa?
There are 85.19 Females per 100 Males in Octa.
What is the Median Population Age in Octa?
Median Population Age in Octa is 54.3 Years.
What is the Average Family Size in Octa
Average Family Size in Octa is 2.3 People.
What is the Average Household Size in Octa
Average Household Size in Octa is 1.9 People.
How Large is the Labor Force in Octa?
There are 22 People in the Labor Forcein in Octa.
What is the Percentage of People in the Labor Force in Octa?
48.9% of People are in the Labor Force in Octa.