Brownsville, OH Map & Demographics
Brownsville Map
Brownsville Overview
$16,443
PER CAPITA INCOME
0.37
INEQUALITY / GINI INDEX
378
TOTAL POPULATION
173
MALE POPULATION
205
FEMALE POPULATION
84.39
MALES / 100 FEMALES
118.50
FEMALES / 100 MALES
44.8
MEDIAN AGE
3.6
AVG FAMILY SIZE
2.8
AVG HOUSEHOLD SIZE
50
LABOR FORCE [ PEOPLE ]
16.8%
PERCENT IN LABOR FORCE
100.0%
UNEMPLOYMENT RATE
Brownsville Zip Codes
Income in Brownsville
Income Overview in Brownsville
| Characteristic | Number | Measure |
| Per Capita Income | 378 | $16,443 |
| Median Family Income | 79 | $0 |
| Mean Family Income | 79 | $40,705 |
| Median Household Income | 135 | $0 |
| Mean Household Income | 135 | $45,020 |
| Income Deficit | 79 | $0 |
| Wage / Income Gap (%) | 378 | 0.00% |
| Wage / Income Gap ($) | 378 | 100.00¢ per $1 |
| Gini / Inequality Index | 378 | 0.37 |
Earnings by Sex in Brownsville
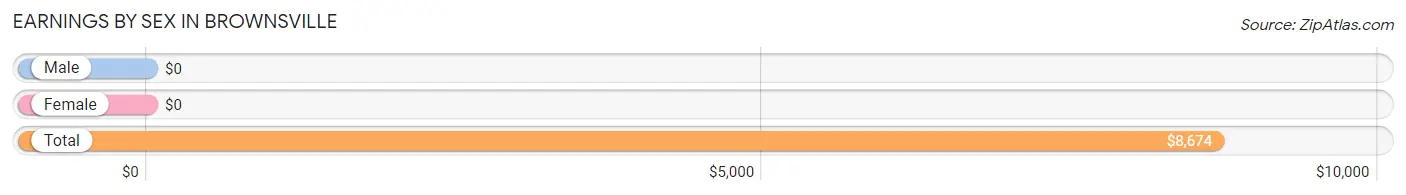
| Sex | Number | Average Earnings |
| Male | 24 (28.9%) | $0 |
| Female | 59 (71.1%) | $0 |
| Total | 83 (100.0%) | $8,674 |
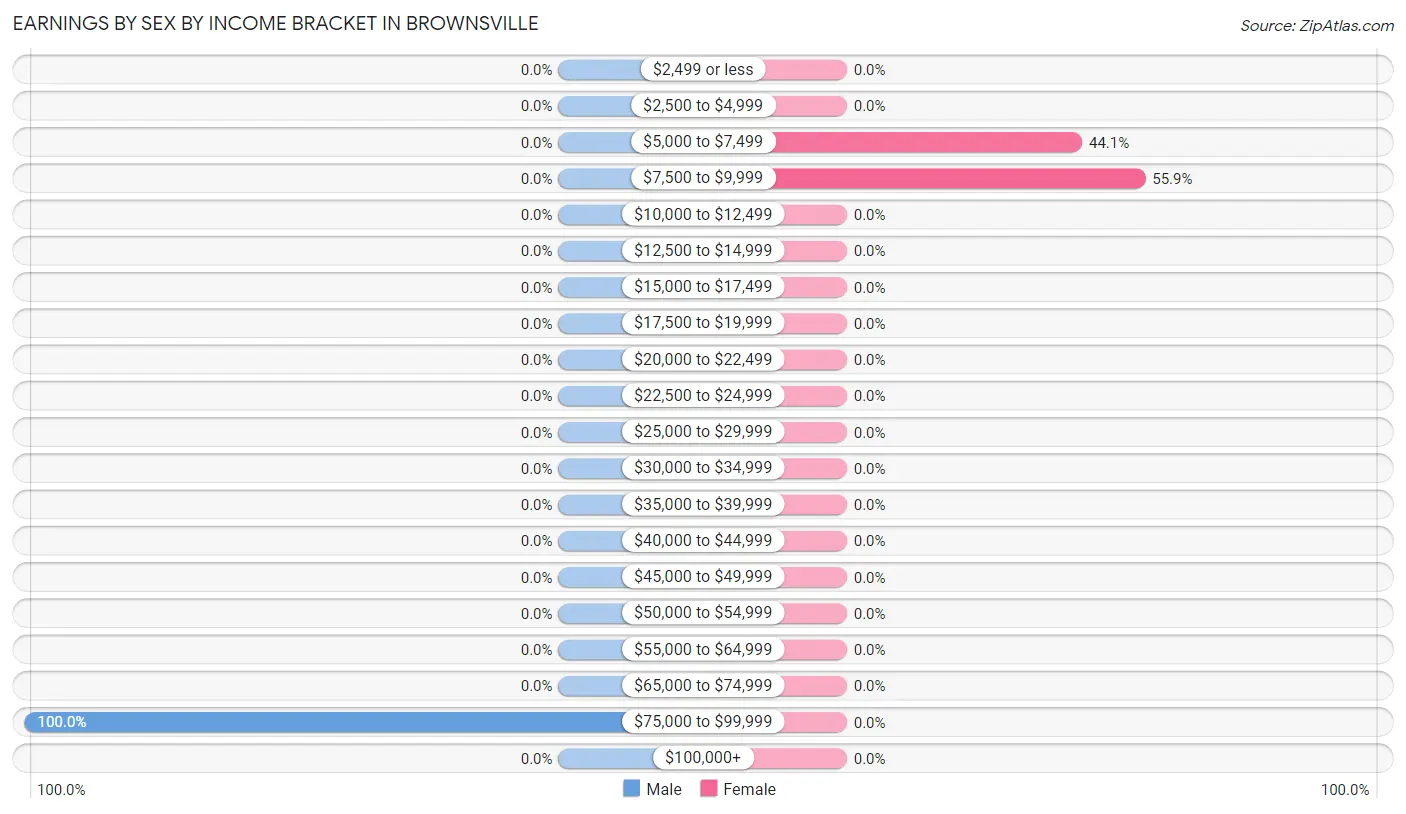
Earnings by Sex by Income Bracket in Brownsville
The most common earnings brackets in Brownsville are $75,000 to $99,999 for men (24 | 100.0%) and $7,500 to $9,999 for women (33 | 55.9%).
| Income | Male | Female |
| $2,499 or less | 0 (0.0%) | 0 (0.0%) |
| $2,500 to $4,999 | 0 (0.0%) | 0 (0.0%) |
| $5,000 to $7,499 | 0 (0.0%) | 26 (44.1%) |
| $7,500 to $9,999 | 0 (0.0%) | 33 (55.9%) |
| $10,000 to $12,499 | 0 (0.0%) | 0 (0.0%) |
| $12,500 to $14,999 | 0 (0.0%) | 0 (0.0%) |
| $15,000 to $17,499 | 0 (0.0%) | 0 (0.0%) |
| $17,500 to $19,999 | 0 (0.0%) | 0 (0.0%) |
| $20,000 to $22,499 | 0 (0.0%) | 0 (0.0%) |
| $22,500 to $24,999 | 0 (0.0%) | 0 (0.0%) |
| $25,000 to $29,999 | 0 (0.0%) | 0 (0.0%) |
| $30,000 to $34,999 | 0 (0.0%) | 0 (0.0%) |
| $35,000 to $39,999 | 0 (0.0%) | 0 (0.0%) |
| $40,000 to $44,999 | 0 (0.0%) | 0 (0.0%) |
| $45,000 to $49,999 | 0 (0.0%) | 0 (0.0%) |
| $50,000 to $54,999 | 0 (0.0%) | 0 (0.0%) |
| $55,000 to $64,999 | 0 (0.0%) | 0 (0.0%) |
| $65,000 to $74,999 | 0 (0.0%) | 0 (0.0%) |
| $75,000 to $99,999 | 24 (100.0%) | 0 (0.0%) |
| $100,000+ | 0 (0.0%) | 0 (0.0%) |
| Total | 24 (100.0%) | 59 (100.0%) |
Earnings by Sex by Educational Attainment in Brownsville
| Educational Attainment | Male Income | Female Income |
| Less than High School | - | - |
| High School Diploma | - | - |
| College or Associate's Degree | - | - |
| Bachelor's Degree | - | - |
| Graduate Degree | - | - |
| Total | - | - |
Family Income in Brownsville
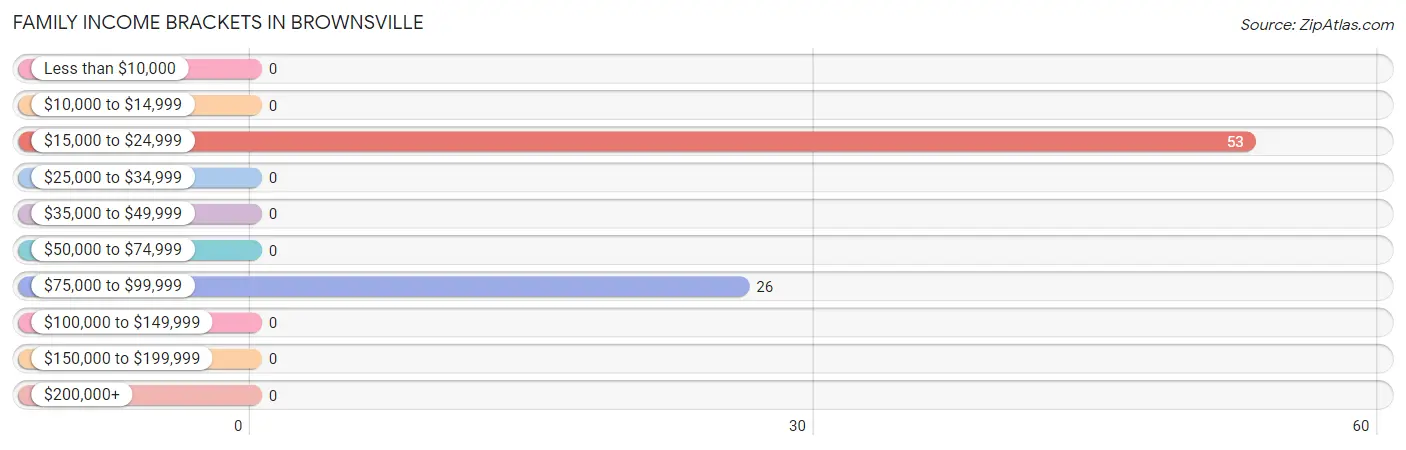
Family Income Brackets in Brownsville
According to the Brownsville family income data, there are 53 families falling into the $15,000 to $24,999 income range, which is the most common income bracket and makes up 67.1% of all families.
| Income Bracket | # Families | % Families |
| Less than $10,000 | 0 | 0.0% |
| $10,000 to $14,999 | 0 | 0.0% |
| $15,000 to $24,999 | 53 | 67.1% |
| $25,000 to $34,999 | 0 | 0.0% |
| $35,000 to $49,999 | 0 | 0.0% |
| $50,000 to $74,999 | 0 | 0.0% |
| $75,000 to $99,999 | 26 | 32.9% |
| $100,000 to $149,999 | 0 | 0.0% |
| $150,000 to $199,999 | 0 | 0.0% |
| $200,000+ | 0 | 0.0% |
Family Income by Famaliy Size in Brownsville
| Income Bracket | # Families | Median Income |
| 2-Person Families | 21 (26.6%) | $0 |
| 3-Person Families | 32 (40.5%) | $0 |
| 4-Person Families | 0 (0.0%) | $0 |
| 5-Person Families | 26 (32.9%) | $0 |
| 6-Person Families | 0 (0.0%) | $0 |
| 7+ Person Families | 0 (0.0%) | $0 |
| Total | 79 (100.0%) | $0 |
Family Income by Number of Earners in Brownsville
| Number of Earners | # Families | Median Income |
| No Earners | 53 (67.1%) | $0 |
| 1 Earner | 0 (0.0%) | $0 |
| 2 Earners | 0 (0.0%) | $0 |
| 3+ Earners | 26 (32.9%) | $0 |
| Total | 79 (100.0%) | $0 |
Household Income in Brownsville
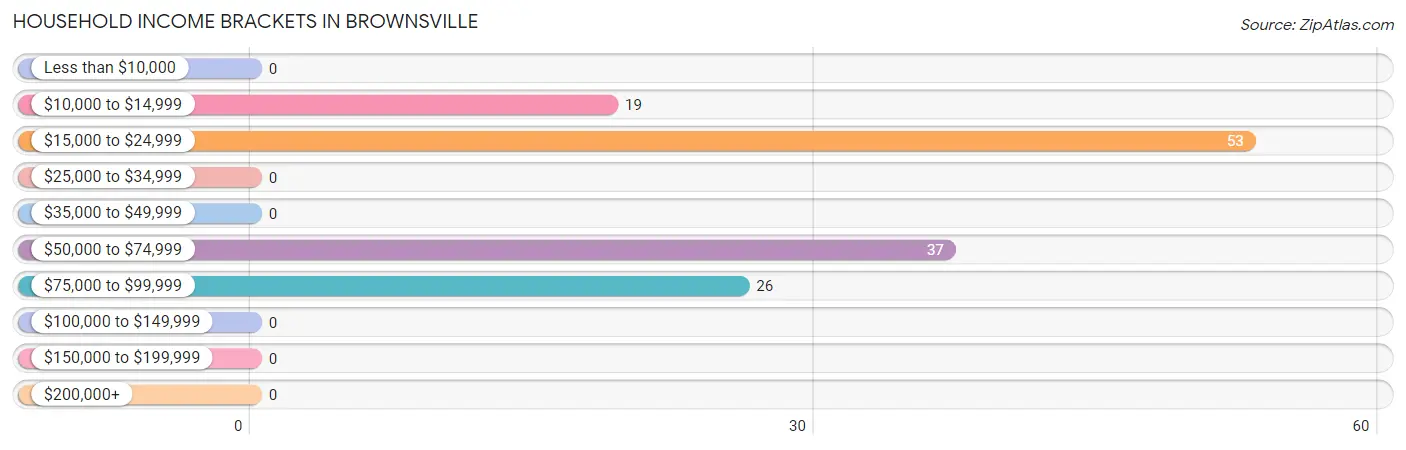
Household Income Brackets in Brownsville
With 53 households falling in the category, the $15,000 to $24,999 income range is the most frequent in Brownsville, accounting for 39.3% of all households.
| Income Bracket | # Households | % Households |
| Less than $10,000 | 0 | 0.0% |
| $10,000 to $14,999 | 19 | 14.1% |
| $15,000 to $24,999 | 53 | 39.3% |
| $25,000 to $34,999 | 0 | 0.0% |
| $35,000 to $49,999 | 0 | 0.0% |
| $50,000 to $74,999 | 37 | 27.4% |
| $75,000 to $99,999 | 26 | 19.3% |
| $100,000 to $149,999 | 0 | 0.0% |
| $150,000 to $199,999 | 0 | 0.0% |
| $200,000+ | 0 | 0.0% |
Household Income by Householder Age in Brownsville
| Income Bracket | # Households | Median Income |
| 15 to 24 Years | 0 (0.0%) | $0 |
| 25 to 44 Years | 26 (19.3%) | $0 |
| 45 to 64 Years | 32 (23.7%) | $0 |
| 65+ Years | 77 (57.0%) | $0 |
| Total | 135 (100.0%) | $0 |
Poverty in Brownsville
Income Below Poverty by Sex and Age in Brownsville
With 19.7% poverty level for males and 53.2% for females among the residents of Brownsville, 55 to 64 year old males and 6 to 11 year old females are the most vulnerable to poverty, with 34 males (100.0%) and 56 females (100.0%) in their respective age groups living below the poverty level.
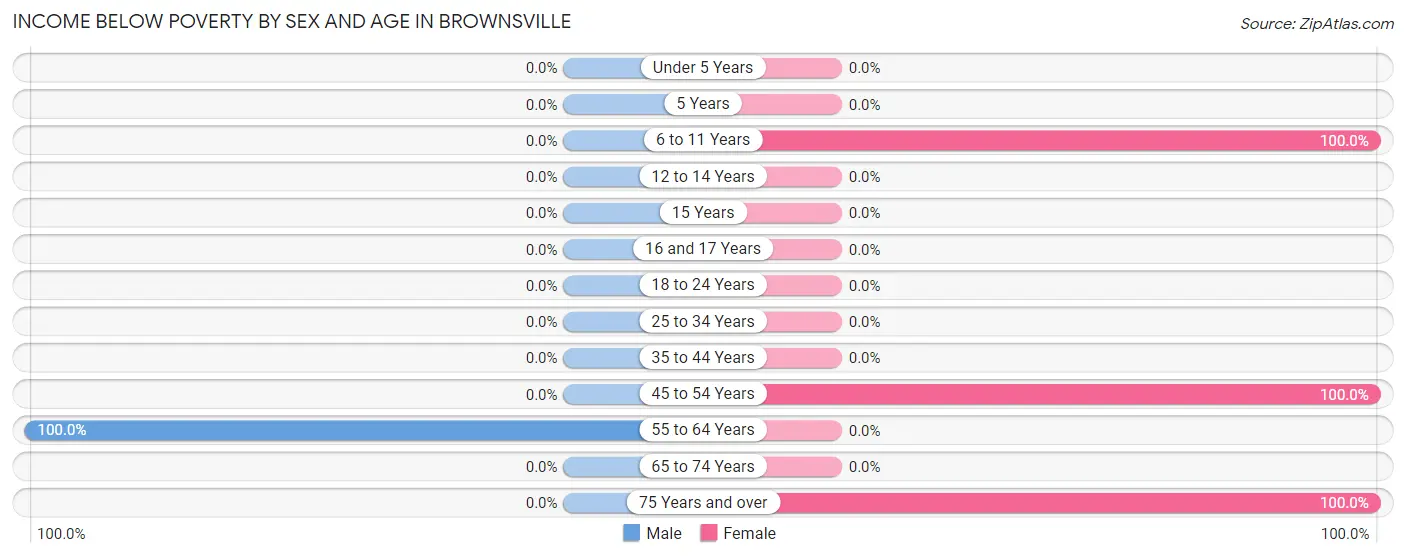
| Age Bracket | Male | Female |
| Under 5 Years | 0 (0.0%) | 0 (0.0%) |
| 5 Years | 0 (0.0%) | 0 (0.0%) |
| 6 to 11 Years | 0 (0.0%) | 56 (100.0%) |
| 12 to 14 Years | 0 (0.0%) | 0 (0.0%) |
| 15 Years | 0 (0.0%) | 0 (0.0%) |
| 16 and 17 Years | 0 (0.0%) | 0 (0.0%) |
| 18 to 24 Years | 0 (0.0%) | 0 (0.0%) |
| 25 to 34 Years | 0 (0.0%) | 0 (0.0%) |
| 35 to 44 Years | 0 (0.0%) | 0 (0.0%) |
| 45 to 54 Years | 0 (0.0%) | 32 (100.0%) |
| 55 to 64 Years | 34 (100.0%) | 0 (0.0%) |
| 65 to 74 Years | 0 (0.0%) | 0 (0.0%) |
| 75 Years and over | 0 (0.0%) | 21 (100.0%) |
| Total | 34 (19.7%) | 109 (53.2%) |
Income Above Poverty by Sex and Age in Brownsville
According to the poverty statistics in Brownsville, males aged 12 to 14 years and females aged 18 to 24 years are the age groups that are most secure financially, with 100.0% of males and 100.0% of females in these age groups living above the poverty line.
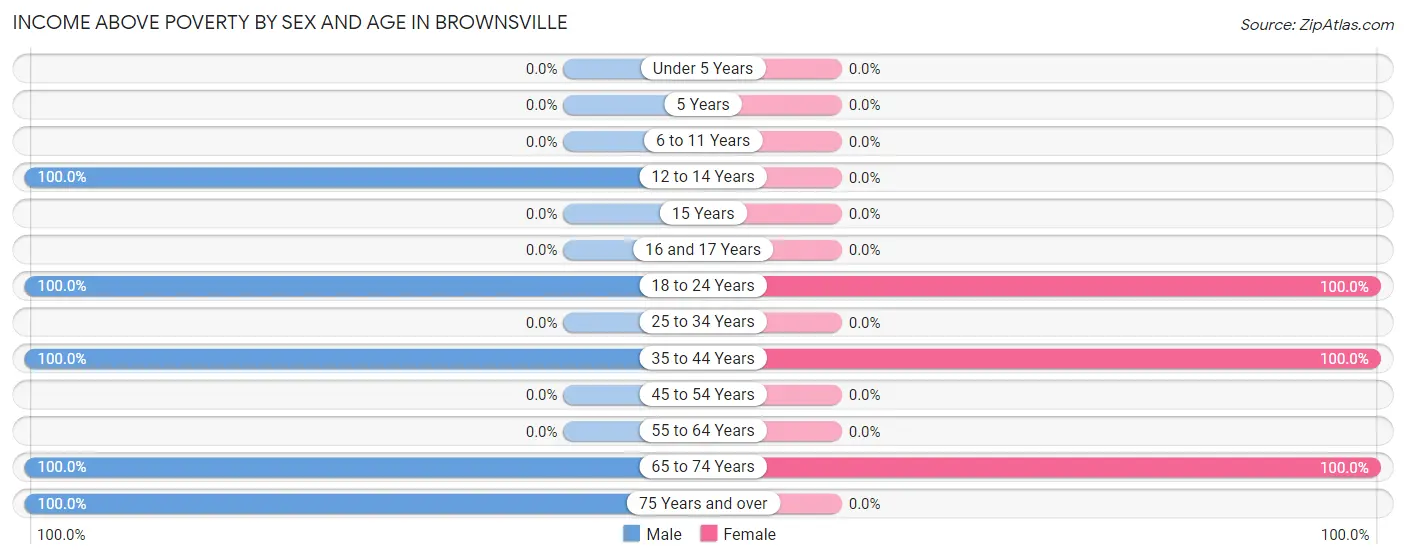
| Age Bracket | Male | Female |
| Under 5 Years | 0 (0.0%) | 0 (0.0%) |
| 5 Years | 0 (0.0%) | 0 (0.0%) |
| 6 to 11 Years | 0 (0.0%) | 0 (0.0%) |
| 12 to 14 Years | 25 (100.0%) | 0 (0.0%) |
| 15 Years | 0 (0.0%) | 0 (0.0%) |
| 16 and 17 Years | 0 (0.0%) | 0 (0.0%) |
| 18 to 24 Years | 30 (100.0%) | 33 (100.0%) |
| 25 to 34 Years | 0 (0.0%) | 0 (0.0%) |
| 35 to 44 Years | 24 (100.0%) | 26 (100.0%) |
| 45 to 54 Years | 0 (0.0%) | 0 (0.0%) |
| 55 to 64 Years | 0 (0.0%) | 0 (0.0%) |
| 65 to 74 Years | 19 (100.0%) | 37 (100.0%) |
| 75 Years and over | 41 (100.0%) | 0 (0.0%) |
| Total | 139 (80.3%) | 96 (46.8%) |
Income Below Poverty Among Married-Couple Families in Brownsville
The poverty statistics for married-couple families in Brownsville show that 55.2% or 32 of the total 58 families live below the poverty line. Families with 1 or 2 children have the highest poverty rate of 55.2%, comprising of 32 families. On the other hand, families with 1 or 2 children have the lowest poverty rate of 55.2%, which includes 32 families.
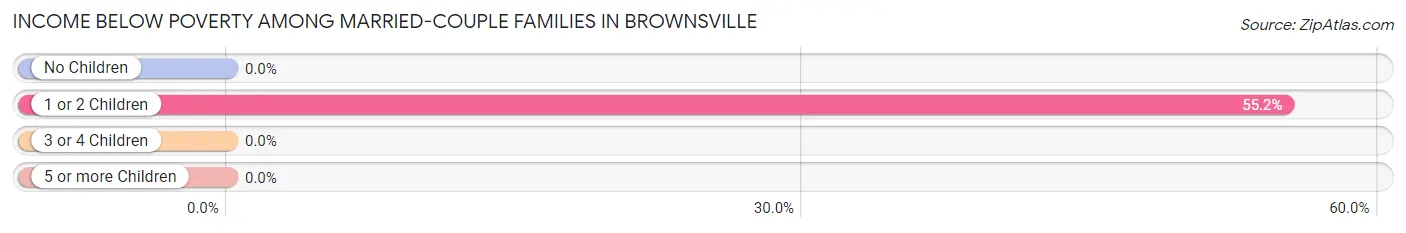
| Children | Above Poverty | Below Poverty |
| No Children | 0 (0.0%) | 0 (0.0%) |
| 1 or 2 Children | 26 (44.8%) | 32 (55.2%) |
| 3 or 4 Children | 0 (0.0%) | 0 (0.0%) |
| 5 or more Children | 0 (0.0%) | 0 (0.0%) |
| Total | 26 (44.8%) | 32 (55.2%) |
Income Below Poverty Among Single-Parent Households in Brownsville
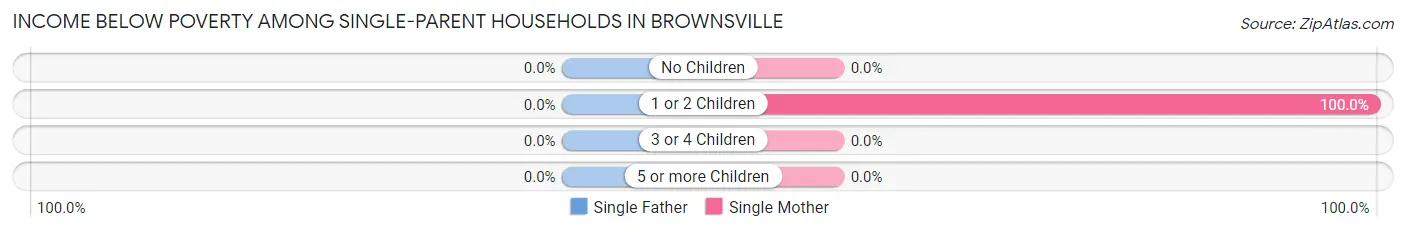
| Children | Single Father | Single Mother |
| No Children | 0 (0.0%) | 0 (0.0%) |
| 1 or 2 Children | 0 (0.0%) | 21 (100.0%) |
| 3 or 4 Children | 0 (0.0%) | 0 (0.0%) |
| 5 or more Children | 0 (0.0%) | 0 (0.0%) |
| Total | 0 (0.0%) | 21 (100.0%) |
Income Below Poverty Among Married-Couple vs Single-Parent Households in Brownsville
The poverty data for Brownsville shows that 32 of the married-couple family households (55.2%) and 21 of the single-parent households (100.0%) are living below the poverty level. Within the married-couple family households, those with 1 or 2 children have the highest poverty rate, with 32 households (55.2%) falling below the poverty line. Among the single-parent households, those with 1 or 2 children have the highest poverty rate, with 21 household (100.0%) living below poverty.
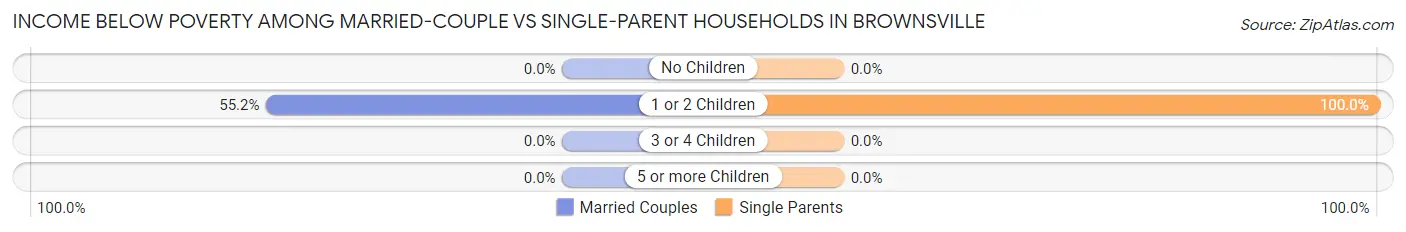
| Children | Married-Couple Families | Single-Parent Households |
| No Children | 0 (0.0%) | 0 (0.0%) |
| 1 or 2 Children | 32 (55.2%) | 21 (100.0%) |
| 3 or 4 Children | 0 (0.0%) | 0 (0.0%) |
| 5 or more Children | 0 (0.0%) | 0 (0.0%) |
| Total | 32 (55.2%) | 21 (100.0%) |
Race in Brownsville
The most populous races in Brownsville are White / Caucasian (359 | 95.0%), and Two or more Races (19 | 5.0%).
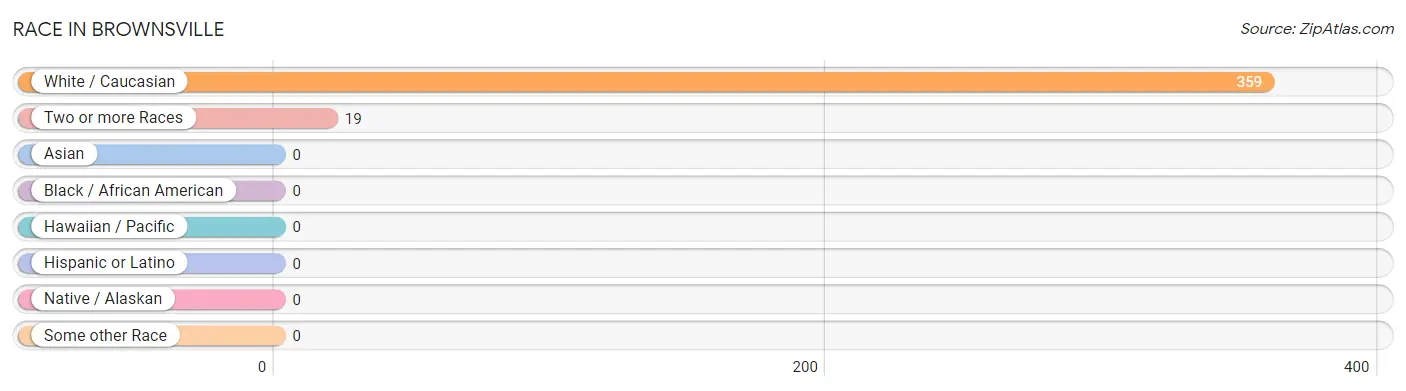
| Race | # Population | % Population |
| Asian | 0 | 0.0% |
| Black / African American | 0 | 0.0% |
| Hawaiian / Pacific | 0 | 0.0% |
| Hispanic or Latino | 0 | 0.0% |
| Native / Alaskan | 0 | 0.0% |
| White / Caucasian | 359 | 95.0% |
| Two or more Races | 19 | 5.0% |
| Some other Race | 0 | 0.0% |
| Total | 378 | 100.0% |
Ancestry in Brownsville
The most populous ancestries reported in Brownsville are , and German (37 | 9.8%), together accounting for 9.8% of all Brownsville residents.

| Ancestry | # Population | % Population |
| German | 37 | 9.8% | View All 1 Rows |
Immigrants in Brownsville

| Immigration Origin | # Population | % Population | View All 0 Rows |
Sex and Age in Brownsville
Sex and Age in Brownsville
The most populous age groups in Brownsville are 85 Years and over (41 | 23.7%) for men and 10 to 14 Years (56 | 27.3%) for women.
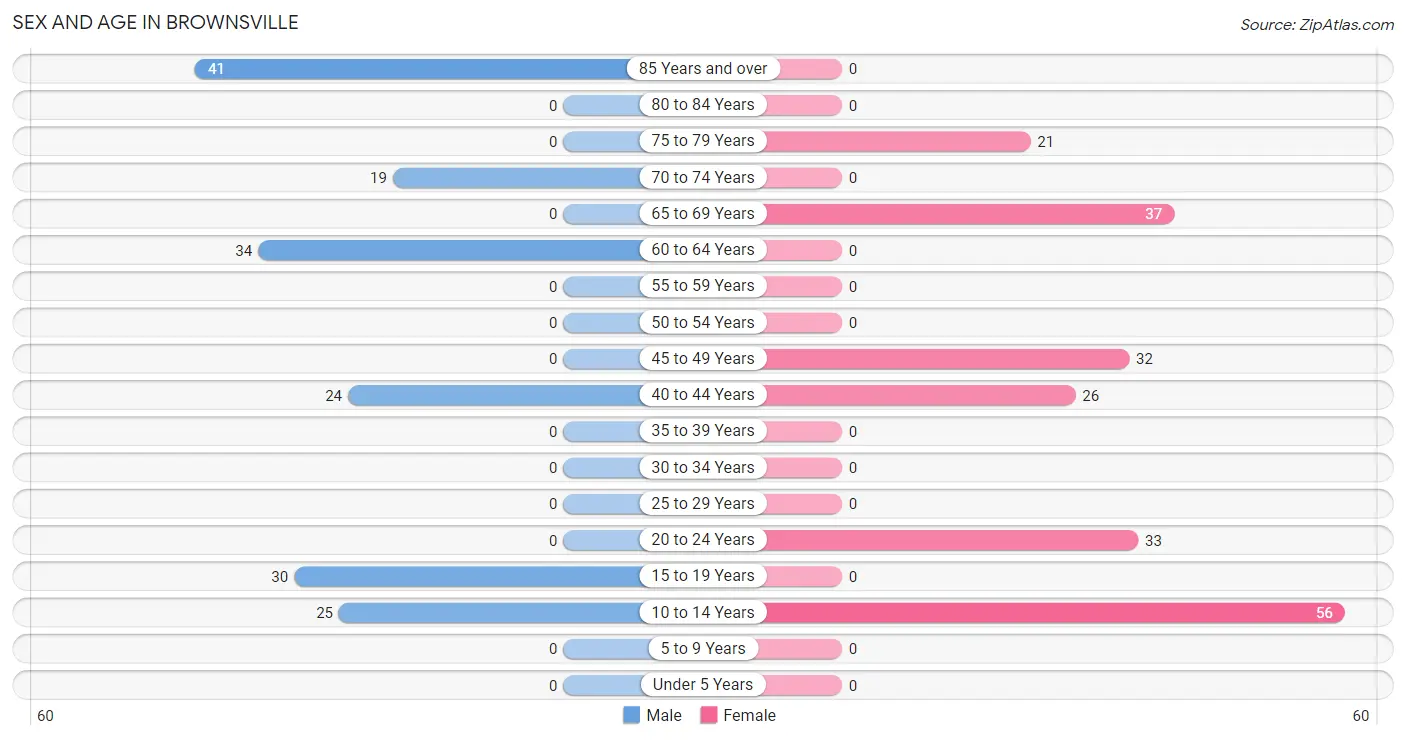
| Age Bracket | Male | Female |
| Under 5 Years | 0 (0.0%) | 0 (0.0%) |
| 5 to 9 Years | 0 (0.0%) | 0 (0.0%) |
| 10 to 14 Years | 25 (14.4%) | 56 (27.3%) |
| 15 to 19 Years | 30 (17.3%) | 0 (0.0%) |
| 20 to 24 Years | 0 (0.0%) | 33 (16.1%) |
| 25 to 29 Years | 0 (0.0%) | 0 (0.0%) |
| 30 to 34 Years | 0 (0.0%) | 0 (0.0%) |
| 35 to 39 Years | 0 (0.0%) | 0 (0.0%) |
| 40 to 44 Years | 24 (13.9%) | 26 (12.7%) |
| 45 to 49 Years | 0 (0.0%) | 32 (15.6%) |
| 50 to 54 Years | 0 (0.0%) | 0 (0.0%) |
| 55 to 59 Years | 0 (0.0%) | 0 (0.0%) |
| 60 to 64 Years | 34 (19.7%) | 0 (0.0%) |
| 65 to 69 Years | 0 (0.0%) | 37 (18.0%) |
| 70 to 74 Years | 19 (11.0%) | 0 (0.0%) |
| 75 to 79 Years | 0 (0.0%) | 21 (10.2%) |
| 80 to 84 Years | 0 (0.0%) | 0 (0.0%) |
| 85 Years and over | 41 (23.7%) | 0 (0.0%) |
| Total | 173 (100.0%) | 205 (100.0%) |
Families and Households in Brownsville
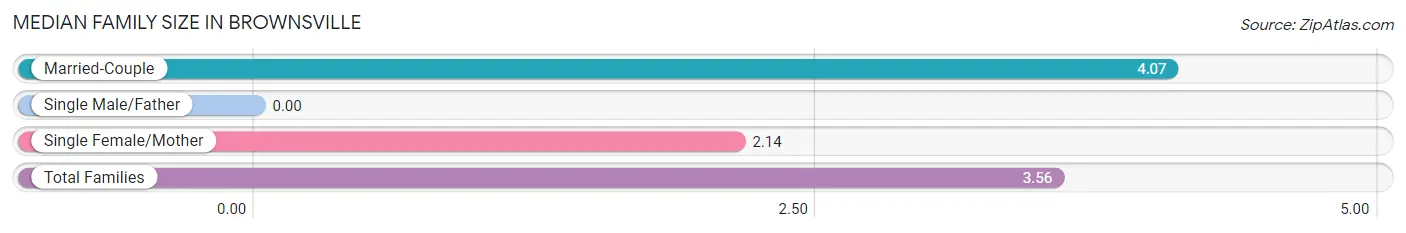
Median Family Size in Brownsville
| Family Type | # Families | Family Size |
| Married-Couple | 58 (73.4%) | 4.07 |
| Single Male/Father | 0 (0.0%) | - |
| Single Female/Mother | 21 (26.6%) | 2.14 |
| Total Families | 79 (100.0%) | 3.56 |
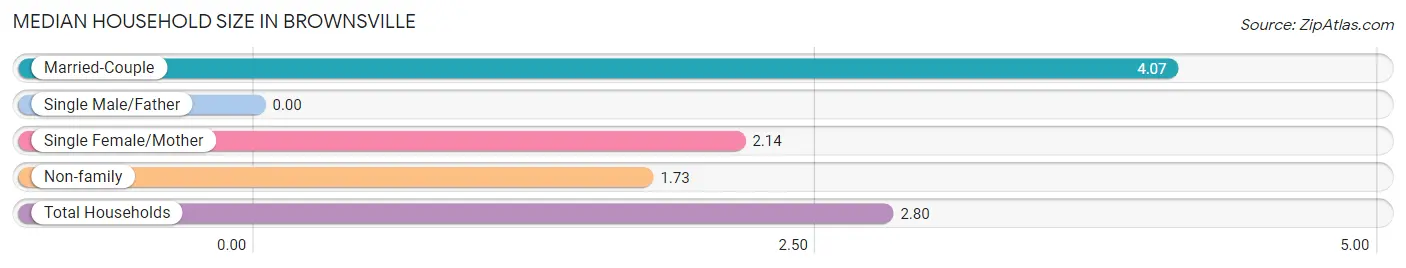
Median Household Size in Brownsville
| Household Type | # Households | Household Size |
| Married-Couple | 58 (43.0%) | 4.07 |
| Single Male/Father | 0 (0.0%) | - |
| Single Female/Mother | 21 (15.6%) | 2.14 |
| Non-family | 56 (41.5%) | 1.73 |
| Total Households | 135 (100.0%) | 2.80 |
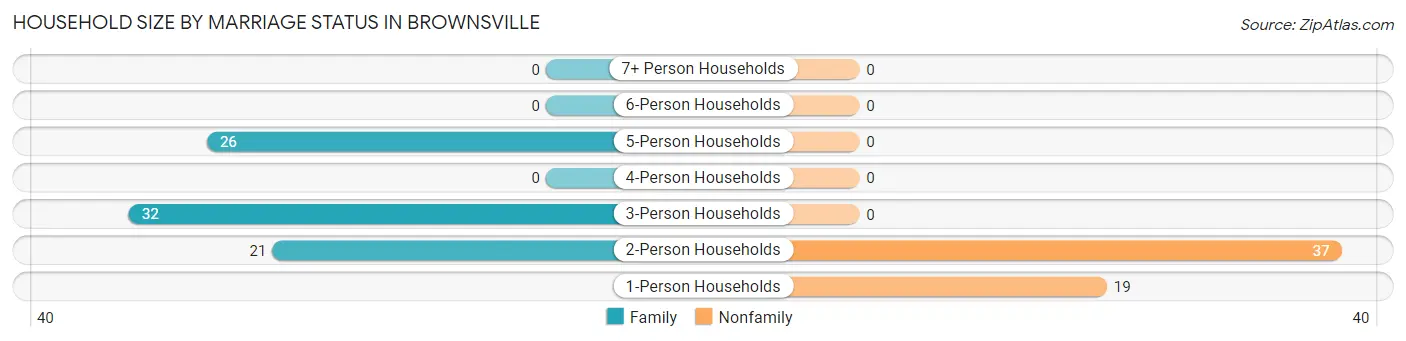
Household Size by Marriage Status in Brownsville
Out of a total of 135 households in Brownsville, 79 (58.5%) are family households, while 56 (41.5%) are nonfamily households. The most numerous type of family households are 3-person households, comprising 32, and the most common type of nonfamily households are 2-person households, comprising 37.
| Household Size | Family Households | Nonfamily Households |
| 1-Person Households | - | 19 (14.1%) |
| 2-Person Households | 21 (15.6%) | 37 (27.4%) |
| 3-Person Households | 32 (23.7%) | 0 (0.0%) |
| 4-Person Households | 0 (0.0%) | 0 (0.0%) |
| 5-Person Households | 26 (19.3%) | 0 (0.0%) |
| 6-Person Households | 0 (0.0%) | 0 (0.0%) |
| 7+ Person Households | 0 (0.0%) | 0 (0.0%) |
| Total | 79 (58.5%) | 56 (41.5%) |
Female Fertility in Brownsville
Fertility by Age in Brownsville
| Age Bracket | Women with Births | Births / 1,000 Women |
| 15 to 19 years | 0 (0.0%) | 0.0 |
| 20 to 34 years | 0 (0.0%) | 0.0 |
| 35 to 50 years | 0 (0.0%) | 0.0 |
| Total | 0 (0.0%) | 0.0 |
Fertility by Age by Marriage Status in Brownsville
| Age Bracket | Married | Unmarried |
| 15 to 19 years | 0 (0.0%) | 0 (0.0%) |
| 20 to 34 years | 0 (0.0%) | 0 (0.0%) |
| 35 to 50 years | 0 (0.0%) | 0 (0.0%) |
| Total | 0 (0.0%) | 0 (0.0%) |
Fertility by Education in Brownsville
| Educational Attainment | Women with Births | Births / 1,000 Women |
| Less than High School | 0 (0.0%) | 0.0 |
| High School Diploma | 0 (0.0%) | 0.0 |
| College or Associate's Degree | 0 (0.0%) | 0.0 |
| Bachelor's Degree | 0 (0.0%) | 0.0 |
| Graduate Degree | 0 (0.0%) | 0.0 |
| Total | 0 (0.0%) | 0.0 |
Fertility by Education by Marriage Status in Brownsville
| Educational Attainment | Married | Unmarried |
| Less than High School | 0 (0.0%) | 0 (0.0%) |
| High School Diploma | 0 (0.0%) | 0 (0.0%) |
| College or Associate's Degree | 0 (0.0%) | 0 (0.0%) |
| Bachelor's Degree | 0 (0.0%) | 0 (0.0%) |
| Graduate Degree | 0 (0.0%) | 0 (0.0%) |
| Total | 0 (0.0%) | 0 (0.0%) |
Employment Characteristics in Brownsville
Employment by Class of Employer in Brownsville
| Employer Class | # Employees | % Employees |
| Private Company Employees | 0 | 0.0% |
| Self-Employed (Incorporated) | 0 | 0.0% |
| Self-Employed (Not Incorporated) | 0 | 0.0% |
| Not-for-profit Organizations | 0 | 0.0% |
| Local Government Employees | 0 | 0.0% |
| State Government Employees | 0 | 0.0% |
| Federal Government Employees | 0 | 0.0% |
| Unpaid Family Workers | 0 | 0.0% |
| Total | 0 | 0.0% |
Employment Status by Age in Brownsville
According to the labor force statistics for Brownsville, out of the total population over 16 years of age (297), 16.8% or 50 individuals are in the labor force, with 100.0% or 50 of them unemployed. The age group with the highest labor force participation rate is 35 to 44 years, with 100.0% or 50 individuals in the labor force. Within the labor force, the 35 to 44 years age range has the highest percentage of unemployed individuals, with 100.0% or 50 of them being unemployed.
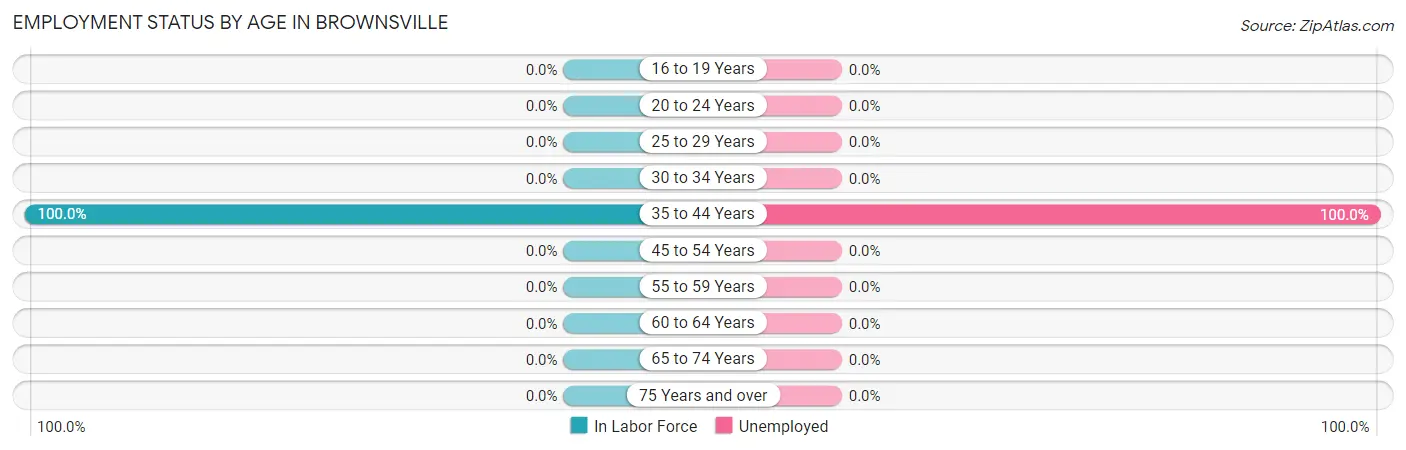
| Age Bracket | In Labor Force | Unemployed |
| 16 to 19 Years | 0 (0.0%) | 0 (0.0%) |
| 20 to 24 Years | 0 (0.0%) | 0 (0.0%) |
| 25 to 29 Years | 0 (0.0%) | 0 (0.0%) |
| 30 to 34 Years | 0 (0.0%) | 0 (0.0%) |
| 35 to 44 Years | 50 (100.0%) | 50 (100.0%) |
| 45 to 54 Years | 0 (0.0%) | 0 (0.0%) |
| 55 to 59 Years | 0 (0.0%) | 0 (0.0%) |
| 60 to 64 Years | 0 (0.0%) | 0 (0.0%) |
| 65 to 74 Years | 0 (0.0%) | 0 (0.0%) |
| 75 Years and over | 0 (0.0%) | 0 (0.0%) |
| Total | 50 (16.8%) | 50 (100.0%) |
Employment Status by Educational Attainment in Brownsville
According to labor force statistics for Brownsville, 43.1% of individuals (50) out of the total population between 25 and 64 years of age (116) are in the labor force, with 100.0% or 50 of them being unemployed. The group with the highest labor force participation rate are those with the educational attainment of high school diploma, with 100.0% or 50 individuals in the labor force. Within the labor force, individuals with high school diploma education have the highest percentage of unemployment, with 100.0% or 50 of them being unemployed.
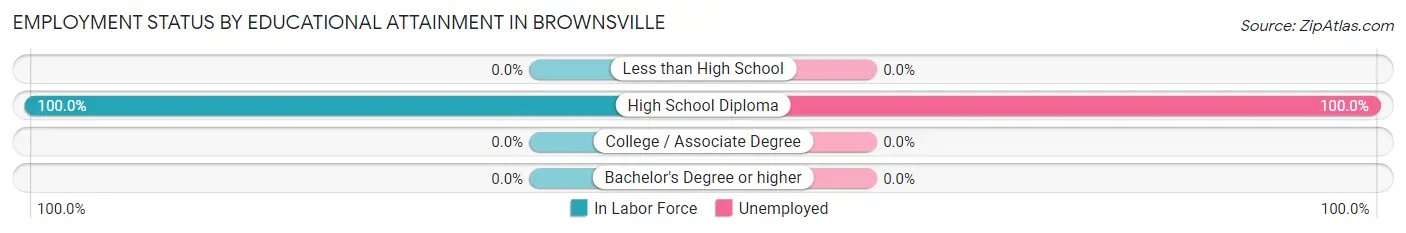
| Educational Attainment | In Labor Force | Unemployed |
| Less than High School | 0 (0.0%) | 0 (0.0%) |
| High School Diploma | 50 (100.0%) | 50 (100.0%) |
| College / Associate Degree | 0 (0.0%) | 0 (0.0%) |
| Bachelor's Degree or higher | 0 (0.0%) | 0 (0.0%) |
| Total | 50 (43.1%) | 116 (100.0%) |
Employment Occupations by Sex in Brownsville
Management, Business, Science and Arts Occupations
Management, Business, Science and Arts Occupations by Sex
| Occupation | Male | Female |
| Management | 0 (0.0%) | 0 (0.0%) |
| Business & Financial | 0 (0.0%) | 0 (0.0%) |
| Computers, Engineering & Science | 0 (0.0%) | 0 (0.0%) |
| Computers & Mathematics | 0 (0.0%) | 0 (0.0%) |
| Architecture & Engineering | 0 (0.0%) | 0 (0.0%) |
| Life, Physical & Social Science | 0 (0.0%) | 0 (0.0%) |
| Community & Social Service | 0 (0.0%) | 0 (0.0%) |
| Education, Arts & Media | 0 (0.0%) | 0 (0.0%) |
| Legal Services & Support | 0 (0.0%) | 0 (0.0%) |
| Education Instruction & Library | 0 (0.0%) | 0 (0.0%) |
| Arts, Media & Entertainment | 0 (0.0%) | 0 (0.0%) |
| Health Diagnosing & Treating | 0 (0.0%) | 0 (0.0%) |
| Health Technologists | 0 (0.0%) | 0 (0.0%) |
| Total (Category) | 0 (0.0%) | 0 (0.0%) |
| Total (Overall) | 0 (0.0%) | 0 (0.0%) |
Services Occupations
Services Occupations by Sex
| Occupation | Male | Female |
| Healthcare Support | 0 (0.0%) | 0 (0.0%) |
| Security & Protection | 0 (0.0%) | 0 (0.0%) |
| Firefighting & Prevention | 0 (0.0%) | 0 (0.0%) |
| Law Enforcement | 0 (0.0%) | 0 (0.0%) |
| Food Preparation & Serving | 0 (0.0%) | 0 (0.0%) |
| Cleaning & Maintenance | 0 (0.0%) | 0 (0.0%) |
| Personal Care & Service | 0 (0.0%) | 0 (0.0%) |
| Total (Category) | 0 (0.0%) | 0 (0.0%) |
| Total (Overall) | 0 (0.0%) | 0 (0.0%) |
Sales and Office Occupations
Sales and Office Occupations by Sex
| Occupation | Male | Female |
| Sales & Related | 0 (0.0%) | 0 (0.0%) |
| Office & Administration | 0 (0.0%) | 0 (0.0%) |
| Total (Category) | 0 (0.0%) | 0 (0.0%) |
| Total (Overall) | 0 (0.0%) | 0 (0.0%) |
Natural Resources, Construction and Maintenance Occupations
Natural Resources, Construction and Maintenance Occupations by Sex
| Occupation | Male | Female |
| Farming, Fishing & Forestry | 0 (0.0%) | 0 (0.0%) |
| Construction & Extraction | 0 (0.0%) | 0 (0.0%) |
| Installation, Maintenance & Repair | 0 (0.0%) | 0 (0.0%) |
| Total (Category) | 0 (0.0%) | 0 (0.0%) |
| Total (Overall) | 0 (0.0%) | 0 (0.0%) |
Production, Transportation and Moving Occupations
Production, Transportation and Moving Occupations by Sex
| Occupation | Male | Female |
| Production | 0 (0.0%) | 0 (0.0%) |
| Transportation | 0 (0.0%) | 0 (0.0%) |
| Material Moving | 0 (0.0%) | 0 (0.0%) |
| Total (Category) | 0 (0.0%) | 0 (0.0%) |
| Total (Overall) | 0 (0.0%) | 0 (0.0%) |
Employment Industries by Sex in Brownsville
Employment Industries in Brownsville
Employment Industries by Sex in Brownsville
| Industry | Male | Female |
| Agriculture, Fishing & Hunting | 0 (0.0%) | 0 (0.0%) |
| Mining, Quarrying, & Extraction | 0 (0.0%) | 0 (0.0%) |
| Construction | 0 (0.0%) | 0 (0.0%) |
| Manufacturing | 0 (0.0%) | 0 (0.0%) |
| Wholesale Trade | 0 (0.0%) | 0 (0.0%) |
| Retail Trade | 0 (0.0%) | 0 (0.0%) |
| Transportation & Warehousing | 0 (0.0%) | 0 (0.0%) |
| Utilities | 0 (0.0%) | 0 (0.0%) |
| Information | 0 (0.0%) | 0 (0.0%) |
| Finance & Insurance | 0 (0.0%) | 0 (0.0%) |
| Real Estate, Rental & Leasing | 0 (0.0%) | 0 (0.0%) |
| Professional & Scientific | 0 (0.0%) | 0 (0.0%) |
| Enterprise Management | 0 (0.0%) | 0 (0.0%) |
| Administrative & Support | 0 (0.0%) | 0 (0.0%) |
| Educational Services | 0 (0.0%) | 0 (0.0%) |
| Health Care & Social Assistance | 0 (0.0%) | 0 (0.0%) |
| Arts, Entertainment & Recreation | 0 (0.0%) | 0 (0.0%) |
| Accommodation & Food Services | 0 (0.0%) | 0 (0.0%) |
| Public Administration | 0 (0.0%) | 0 (0.0%) |
| Total | 0 (0.0%) | 0 (0.0%) |
Education in Brownsville
School Enrollment in Brownsville
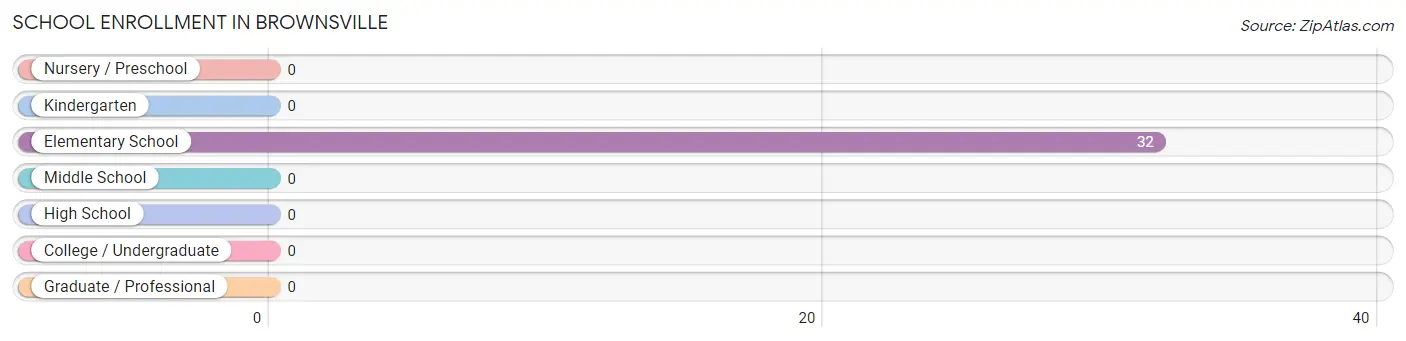
| School Level | # Students | % Students |
| Nursery / Preschool | 0 | 0.0% |
| Kindergarten | 0 | 0.0% |
| Elementary School | 32 | 100.0% |
| Middle School | 0 | 0.0% |
| High School | 0 | 0.0% |
| College / Undergraduate | 0 | 0.0% |
| Graduate / Professional | 0 | 0.0% |
| Total | 32 | 100.0% |
School Enrollment by Age by Funding Source in Brownsville
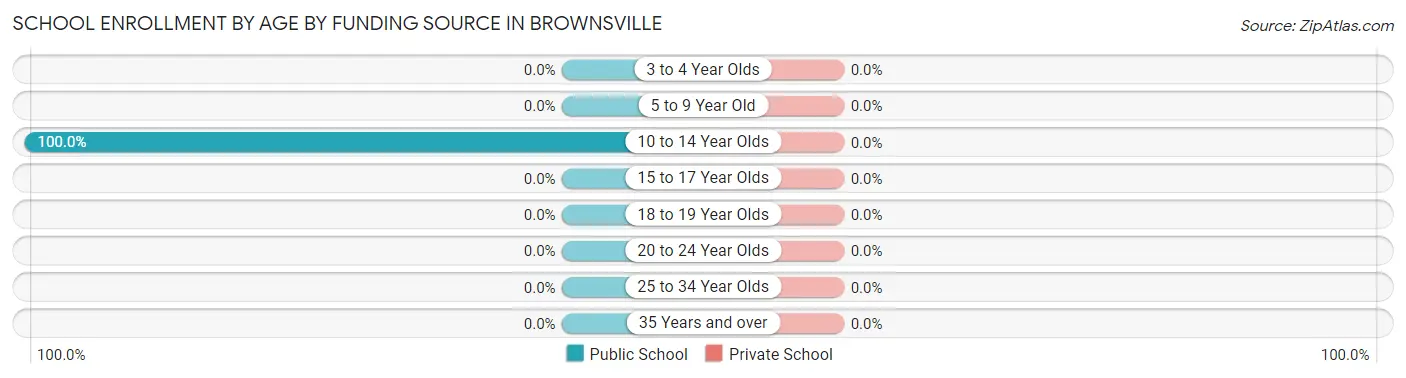
| Age Bracket | Public School | Private School |
| 3 to 4 Year Olds | 0 (0.0%) | 0 (0.0%) |
| 5 to 9 Year Old | 0 (0.0%) | 0 (0.0%) |
| 10 to 14 Year Olds | 32 (100.0%) | 0 (0.0%) |
| 15 to 17 Year Olds | 0 (0.0%) | 0 (0.0%) |
| 18 to 19 Year Olds | 0 (0.0%) | 0 (0.0%) |
| 20 to 24 Year Olds | 0 (0.0%) | 0 (0.0%) |
| 25 to 34 Year Olds | 0 (0.0%) | 0 (0.0%) |
| 35 Years and over | 0 (0.0%) | 0 (0.0%) |
| Total | 32 (100.0%) | 0 (0.0%) |
Educational Attainment by Field of Study in Brownsville
| Field of Study | # Graduates | % Graduates |
| Computers & Mathematics | 0 | 0.0% |
| Bio, Nature & Agricultural | 0 | 0.0% |
| Physical & Health Sciences | 0 | 0.0% |
| Psychology | 0 | 0.0% |
| Social Sciences | 0 | 0.0% |
| Engineering | 0 | 0.0% |
| Multidisciplinary Studies | 0 | 0.0% |
| Science & Technology | 0 | 0.0% |
| Business | 0 | 0.0% |
| Education | 0 | 0.0% |
| Literature & Languages | 0 | 0.0% |
| Liberal Arts & History | 0 | 0.0% |
| Visual & Performing Arts | 0 | 0.0% |
| Communications | 0 | 0.0% |
| Arts & Humanities | 0 | 0.0% |
| Total | 0 | 0.0% |
Transportation & Commute in Brownsville
Vehicle Availability by Sex in Brownsville
| Vehicles Available | Male | Female |
| No Vehicle | 0 (0.0%) | 0 (0.0%) |
| 1 Vehicle | 0 (0.0%) | 0 (0.0%) |
| 2 Vehicles | 0 (0.0%) | 0 (0.0%) |
| 3 Vehicles | 0 (0.0%) | 0 (0.0%) |
| 4 Vehicles | 0 (0.0%) | 0 (0.0%) |
| 5 or more Vehicles | 0 (0.0%) | 0 (0.0%) |
| Total | 0 (0.0%) | 0 (0.0%) |
Commute Time in Brownsville
| Commute Time | # Commuters | % Commuters |
| Less than 5 Minutes | 0 | 0.0% |
| 5 to 9 Minutes | 0 | 0.0% |
| 10 to 14 Minutes | 0 | 0.0% |
| 15 to 19 Minutes | 0 | 0.0% |
| 20 to 24 Minutes | 0 | 0.0% |
| 25 to 29 Minutes | 0 | 0.0% |
| 30 to 34 Minutes | 0 | 0.0% |
| 35 to 39 Minutes | 0 | 0.0% |
| 40 to 44 Minutes | 0 | 0.0% |
| 45 to 59 Minutes | 0 | 0.0% |
| 60 to 89 Minutes | 0 | 0.0% |
| 90 or more Minutes | 0 | 0.0% |
Commute Time by Sex in Brownsville
| Commute Time | Male | Female |
| Less than 5 Minutes | 0 (0.0%) | 0 (0.0%) |
| 5 to 9 Minutes | 0 (0.0%) | 0 (0.0%) |
| 10 to 14 Minutes | 0 (0.0%) | 0 (0.0%) |
| 15 to 19 Minutes | 0 (0.0%) | 0 (0.0%) |
| 20 to 24 Minutes | 0 (0.0%) | 0 (0.0%) |
| 25 to 29 Minutes | 0 (0.0%) | 0 (0.0%) |
| 30 to 34 Minutes | 0 (0.0%) | 0 (0.0%) |
| 35 to 39 Minutes | 0 (0.0%) | 0 (0.0%) |
| 40 to 44 Minutes | 0 (0.0%) | 0 (0.0%) |
| 45 to 59 Minutes | 0 (0.0%) | 0 (0.0%) |
| 60 to 89 Minutes | 0 (0.0%) | 0 (0.0%) |
| 90 or more Minutes | 0 (0.0%) | 0 (0.0%) |
Time of Departure to Work by Sex in Brownsville
| Time of Departure | Male | Female |
| 12:00 AM to 4:59 AM | 0 (0.0%) | 0 (0.0%) |
| 5:00 AM to 5:29 AM | 0 (0.0%) | 0 (0.0%) |
| 5:30 AM to 5:59 AM | 0 (0.0%) | 0 (0.0%) |
| 6:00 AM to 6:29 AM | 0 (0.0%) | 0 (0.0%) |
| 6:30 AM to 6:59 AM | 0 (0.0%) | 0 (0.0%) |
| 7:00 AM to 7:29 AM | 0 (0.0%) | 0 (0.0%) |
| 7:30 AM to 7:59 AM | 0 (0.0%) | 0 (0.0%) |
| 8:00 AM to 8:29 AM | 0 (0.0%) | 0 (0.0%) |
| 8:30 AM to 8:59 AM | 0 (0.0%) | 0 (0.0%) |
| 9:00 AM to 9:59 AM | 0 (0.0%) | 0 (0.0%) |
| 10:00 AM to 10:59 AM | 0 (0.0%) | 0 (0.0%) |
| 11:00 AM to 11:59 AM | 0 (0.0%) | 0 (0.0%) |
| 12:00 PM to 3:59 PM | 0 (0.0%) | 0 (0.0%) |
| 4:00 PM to 11:59 PM | 0 (0.0%) | 0 (0.0%) |
| Total | 0 (0.0%) | 0 (0.0%) |
Housing Occupancy in Brownsville
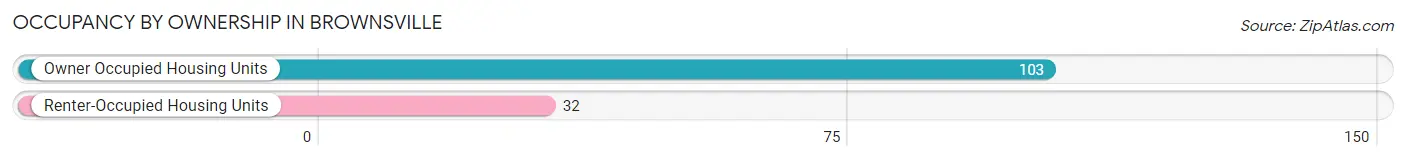
Occupancy by Ownership in Brownsville
Of the total 135 dwellings in Brownsville, owner-occupied units account for 103 (76.3%), while renter-occupied units make up 32 (23.7%).
| Occupancy | # Housing Units | % Housing Units |
| Owner Occupied Housing Units | 103 | 76.3% |
| Renter-Occupied Housing Units | 32 | 23.7% |
| Total Occupied Housing Units | 135 | 100.0% |
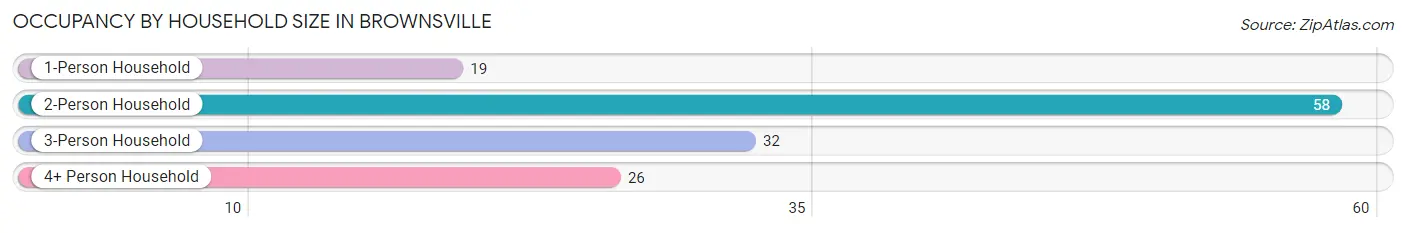
Occupancy by Household Size in Brownsville
| Household Size | # Housing Units | % Housing Units |
| 1-Person Household | 19 | 14.1% |
| 2-Person Household | 58 | 43.0% |
| 3-Person Household | 32 | 23.7% |
| 4+ Person Household | 26 | 19.3% |
| Total Housing Units | 135 | 100.0% |
Occupancy by Ownership by Household Size in Brownsville
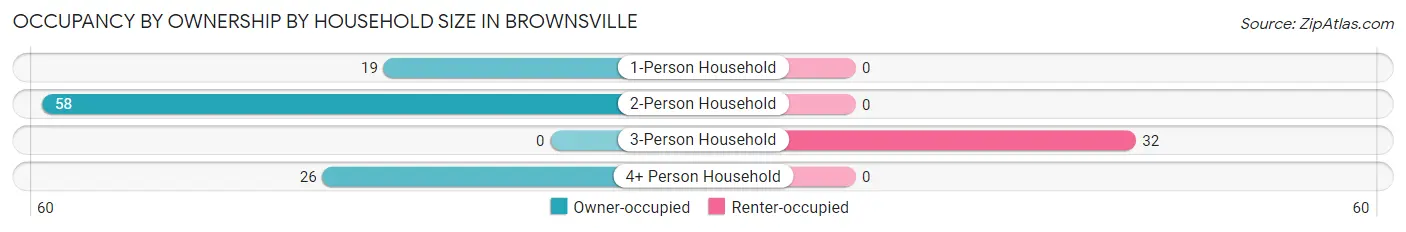
| Household Size | Owner-occupied | Renter-occupied |
| 1-Person Household | 19 (100.0%) | 0 (0.0%) |
| 2-Person Household | 58 (100.0%) | 0 (0.0%) |
| 3-Person Household | 0 (0.0%) | 32 (100.0%) |
| 4+ Person Household | 26 (100.0%) | 0 (0.0%) |
| Total Housing Units | 103 (76.3%) | 32 (23.7%) |
Occupancy by Educational Attainment in Brownsville
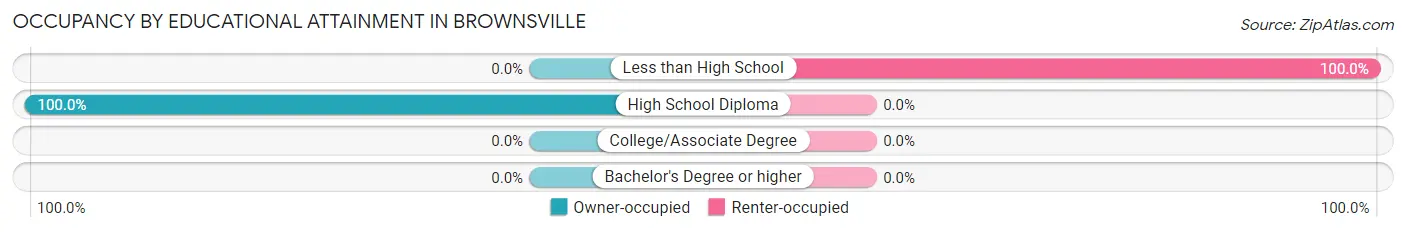
| Household Size | Owner-occupied | Renter-occupied |
| Less than High School | 0 (0.0%) | 32 (100.0%) |
| High School Diploma | 103 (100.0%) | 0 (0.0%) |
| College/Associate Degree | 0 (0.0%) | 0 (0.0%) |
| Bachelor's Degree or higher | 0 (0.0%) | 0 (0.0%) |
Occupancy by Age of Householder in Brownsville
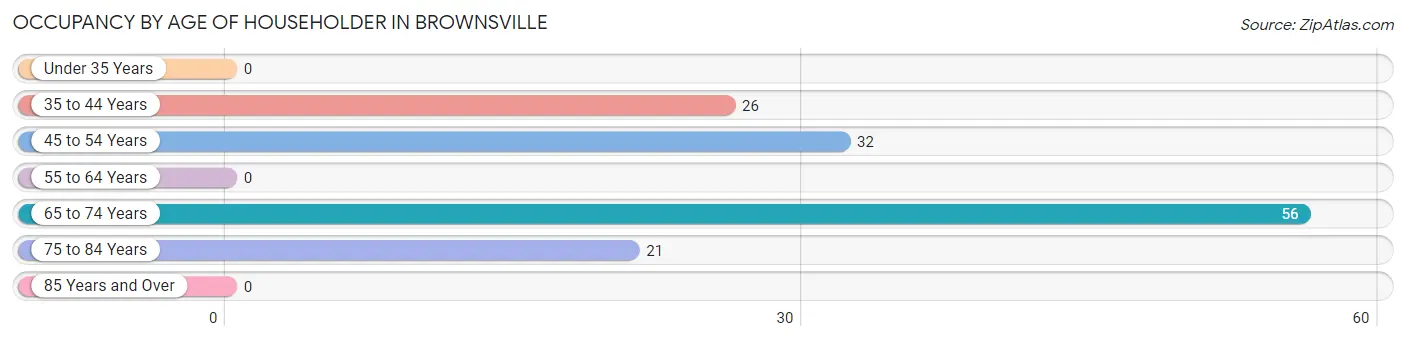
| Age Bracket | # Households | % Households |
| Under 35 Years | 0 | 0.0% |
| 35 to 44 Years | 26 | 19.3% |
| 45 to 54 Years | 32 | 23.7% |
| 55 to 64 Years | 0 | 0.0% |
| 65 to 74 Years | 56 | 41.5% |
| 75 to 84 Years | 21 | 15.6% |
| 85 Years and Over | 0 | 0.0% |
| Total | 135 | 100.0% |
Housing Finances in Brownsville
Median Income by Occupancy in Brownsville
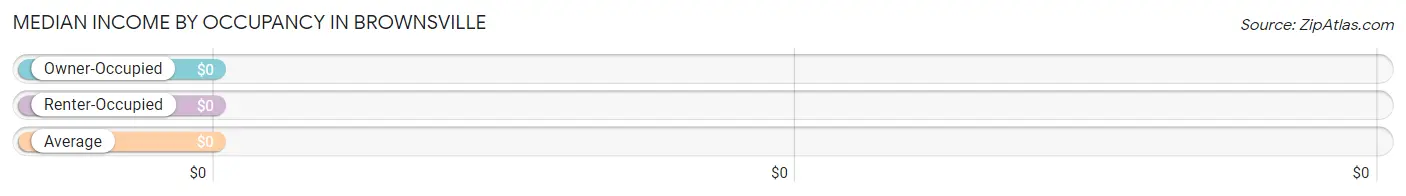
| Occupancy Type | # Households | Median Income |
| Owner-Occupied | 103 (76.3%) | $0 |
| Renter-Occupied | 32 (23.7%) | $0 |
| Average | 135 (100.0%) | $0 |
Occupancy by Householder Income Bracket in Brownsville
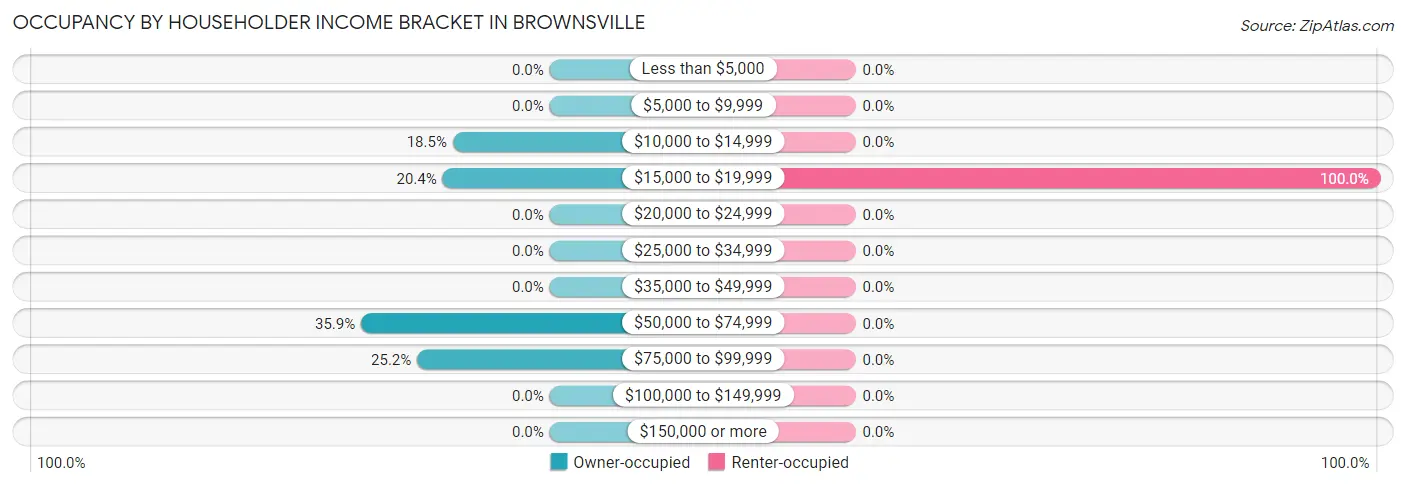
| Income Bracket | Owner-occupied | Renter-occupied |
| Less than $5,000 | 0 (0.0%) | 0 (0.0%) |
| $5,000 to $9,999 | 0 (0.0%) | 0 (0.0%) |
| $10,000 to $14,999 | 19 (18.4%) | 0 (0.0%) |
| $15,000 to $19,999 | 21 (20.4%) | 32 (100.0%) |
| $20,000 to $24,999 | 0 (0.0%) | 0 (0.0%) |
| $25,000 to $34,999 | 0 (0.0%) | 0 (0.0%) |
| $35,000 to $49,999 | 0 (0.0%) | 0 (0.0%) |
| $50,000 to $74,999 | 37 (35.9%) | 0 (0.0%) |
| $75,000 to $99,999 | 26 (25.2%) | 0 (0.0%) |
| $100,000 to $149,999 | 0 (0.0%) | 0 (0.0%) |
| $150,000 or more | 0 (0.0%) | 0 (0.0%) |
| Total | 103 (100.0%) | 32 (100.0%) |
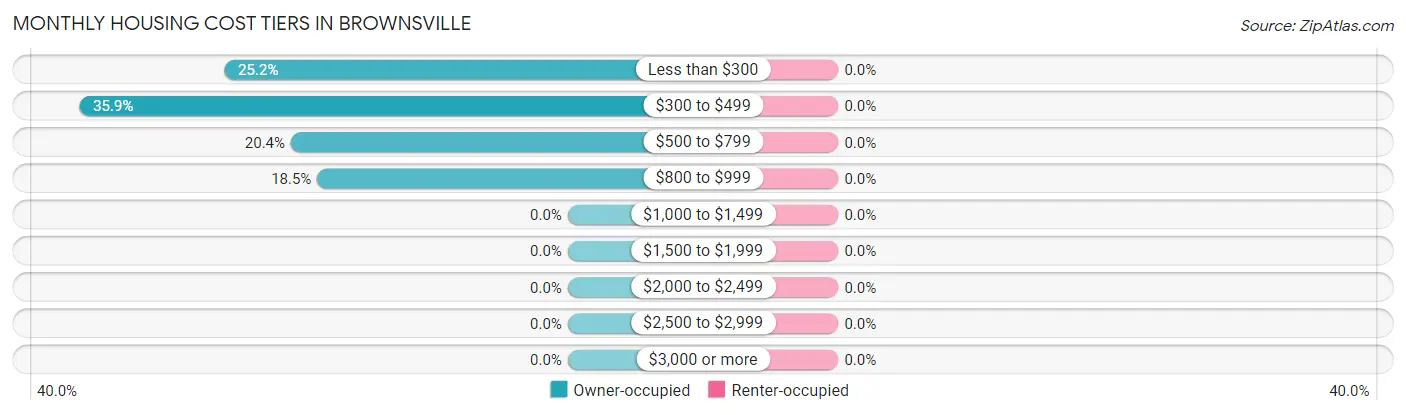
Monthly Housing Cost Tiers in Brownsville
| Monthly Cost | Owner-occupied | Renter-occupied |
| Less than $300 | 26 (25.2%) | 0 (0.0%) |
| $300 to $499 | 37 (35.9%) | 0 (0.0%) |
| $500 to $799 | 21 (20.4%) | 0 (0.0%) |
| $800 to $999 | 19 (18.4%) | 0 (0.0%) |
| $1,000 to $1,499 | 0 (0.0%) | 0 (0.0%) |
| $1,500 to $1,999 | 0 (0.0%) | 0 (0.0%) |
| $2,000 to $2,499 | 0 (0.0%) | 0 (0.0%) |
| $2,500 to $2,999 | 0 (0.0%) | 0 (0.0%) |
| $3,000 or more | 0 (0.0%) | 0 (0.0%) |
| Total | 103 (100.0%) | 32 (100.0%) |
Physical Housing Characteristics in Brownsville
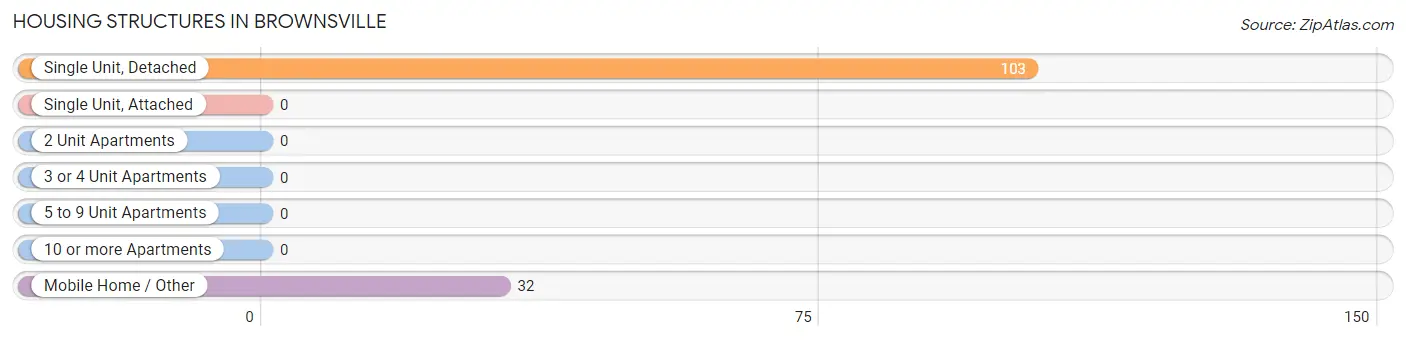
Housing Structures in Brownsville
| Structure Type | # Housing Units | % Housing Units |
| Single Unit, Detached | 103 | 76.3% |
| Single Unit, Attached | 0 | 0.0% |
| 2 Unit Apartments | 0 | 0.0% |
| 3 or 4 Unit Apartments | 0 | 0.0% |
| 5 to 9 Unit Apartments | 0 | 0.0% |
| 10 or more Apartments | 0 | 0.0% |
| Mobile Home / Other | 32 | 23.7% |
| Total | 135 | 100.0% |
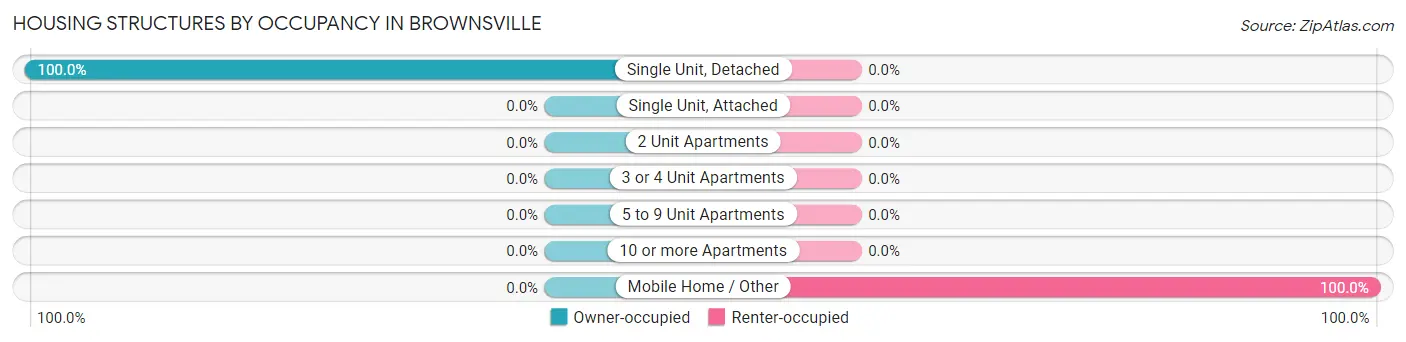
Housing Structures by Occupancy in Brownsville
| Structure Type | Owner-occupied | Renter-occupied |
| Single Unit, Detached | 103 (100.0%) | 0 (0.0%) |
| Single Unit, Attached | 0 (0.0%) | 0 (0.0%) |
| 2 Unit Apartments | 0 (0.0%) | 0 (0.0%) |
| 3 or 4 Unit Apartments | 0 (0.0%) | 0 (0.0%) |
| 5 to 9 Unit Apartments | 0 (0.0%) | 0 (0.0%) |
| 10 or more Apartments | 0 (0.0%) | 0 (0.0%) |
| Mobile Home / Other | 0 (0.0%) | 32 (100.0%) |
| Total | 103 (76.3%) | 32 (23.7%) |
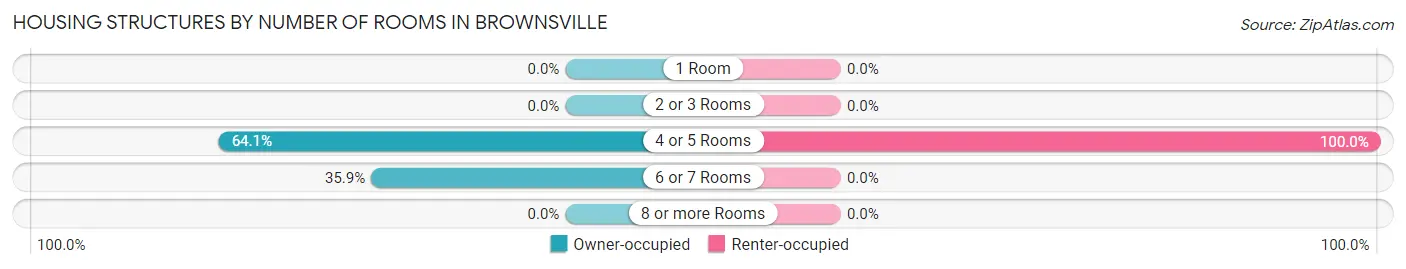
Housing Structures by Number of Rooms in Brownsville
| Number of Rooms | Owner-occupied | Renter-occupied |
| 1 Room | 0 (0.0%) | 0 (0.0%) |
| 2 or 3 Rooms | 0 (0.0%) | 0 (0.0%) |
| 4 or 5 Rooms | 66 (64.1%) | 32 (100.0%) |
| 6 or 7 Rooms | 37 (35.9%) | 0 (0.0%) |
| 8 or more Rooms | 0 (0.0%) | 0 (0.0%) |
| Total | 103 (100.0%) | 32 (100.0%) |
Housing Structure by Heating Type in Brownsville
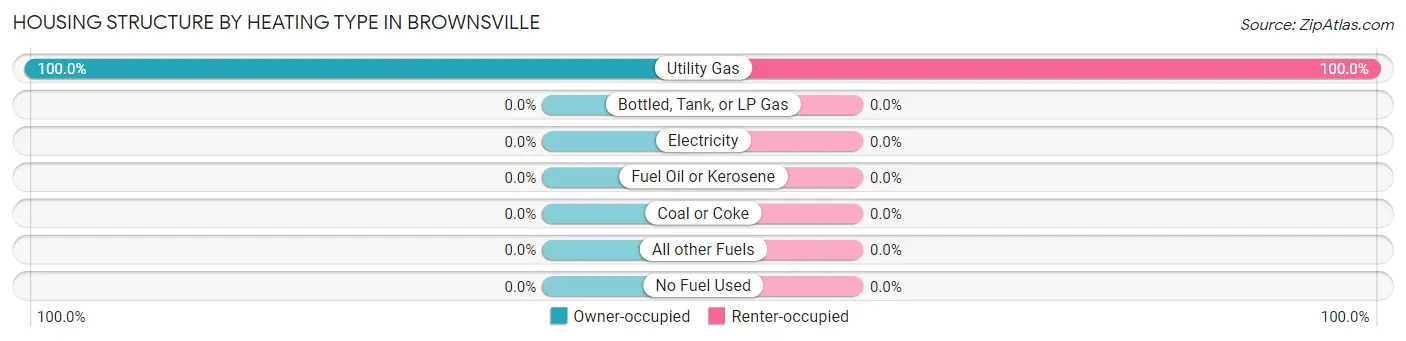
| Heating Type | Owner-occupied | Renter-occupied |
| Utility Gas | 103 (100.0%) | 32 (100.0%) |
| Bottled, Tank, or LP Gas | 0 (0.0%) | 0 (0.0%) |
| Electricity | 0 (0.0%) | 0 (0.0%) |
| Fuel Oil or Kerosene | 0 (0.0%) | 0 (0.0%) |
| Coal or Coke | 0 (0.0%) | 0 (0.0%) |
| All other Fuels | 0 (0.0%) | 0 (0.0%) |
| No Fuel Used | 0 (0.0%) | 0 (0.0%) |
| Total | 103 (100.0%) | 32 (100.0%) |
Household Vehicle Usage in Brownsville
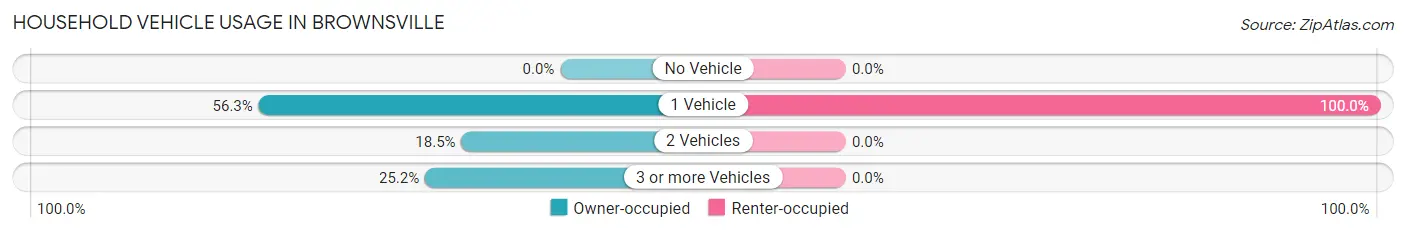
| Vehicles per Household | Owner-occupied | Renter-occupied |
| No Vehicle | 0 (0.0%) | 0 (0.0%) |
| 1 Vehicle | 58 (56.3%) | 32 (100.0%) |
| 2 Vehicles | 19 (18.4%) | 0 (0.0%) |
| 3 or more Vehicles | 26 (25.2%) | 0 (0.0%) |
| Total | 103 (100.0%) | 32 (100.0%) |
Real Estate & Mortgages in Brownsville
Real Estate and Mortgage Overview in Brownsville
| Characteristic | Without Mortgage | With Mortgage |
| Housing Units | 63 | 40 |
| Median Property Value | - | - |
| Median Household Income | - | - |
| Monthly Housing Costs | - | - |
| Real Estate Taxes | - | - |
Property Value by Mortgage Status in Brownsville
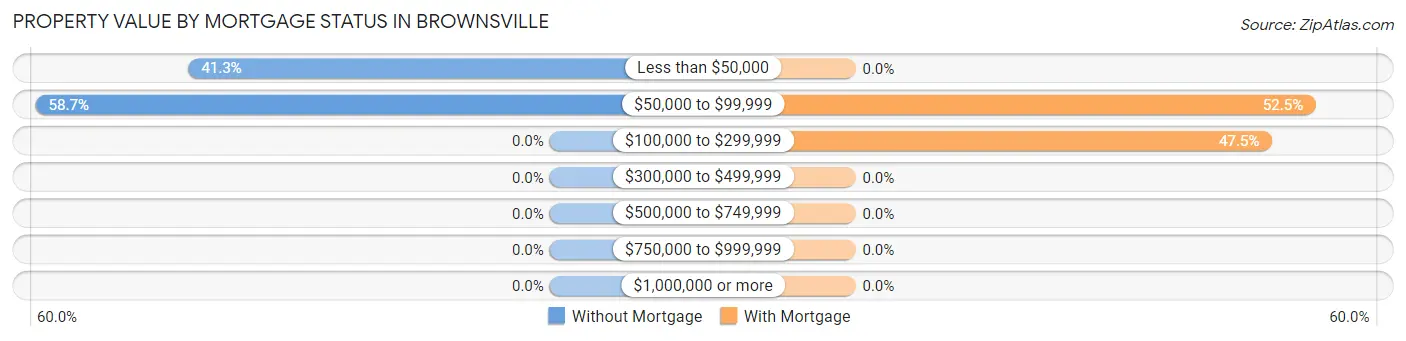
| Property Value | Without Mortgage | With Mortgage |
| Less than $50,000 | 26 (41.3%) | 0 (0.0%) |
| $50,000 to $99,999 | 37 (58.7%) | 21 (52.5%) |
| $100,000 to $299,999 | 0 (0.0%) | 19 (47.5%) |
| $300,000 to $499,999 | 0 (0.0%) | 0 (0.0%) |
| $500,000 to $749,999 | 0 (0.0%) | 0 (0.0%) |
| $750,000 to $999,999 | 0 (0.0%) | 0 (0.0%) |
| $1,000,000 or more | 0 (0.0%) | 0 (0.0%) |
| Total | 63 (100.0%) | 40 (100.0%) |
Household Income by Mortgage Status in Brownsville
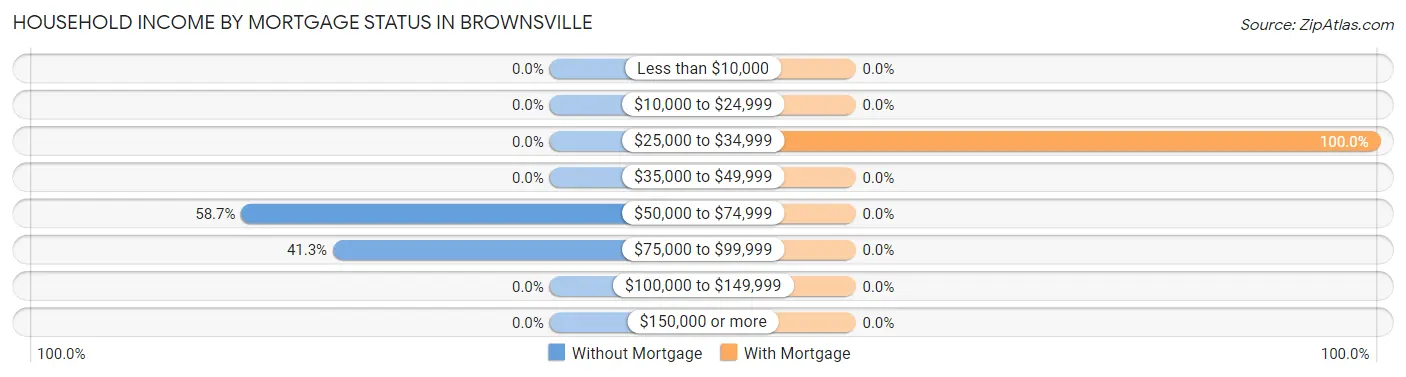
| Household Income | Without Mortgage | With Mortgage |
| Less than $10,000 | 0 (0.0%) | 0 (0.0%) |
| $10,000 to $24,999 | 0 (0.0%) | 0 (0.0%) |
| $25,000 to $34,999 | 0 (0.0%) | 40 (100.0%) |
| $35,000 to $49,999 | 0 (0.0%) | 0 (0.0%) |
| $50,000 to $74,999 | 37 (58.7%) | 0 (0.0%) |
| $75,000 to $99,999 | 26 (41.3%) | 0 (0.0%) |
| $100,000 to $149,999 | 0 (0.0%) | 0 (0.0%) |
| $150,000 or more | 0 (0.0%) | 0 (0.0%) |
| Total | 63 (100.0%) | 40 (100.0%) |
Property Value to Household Income Ratio in Brownsville
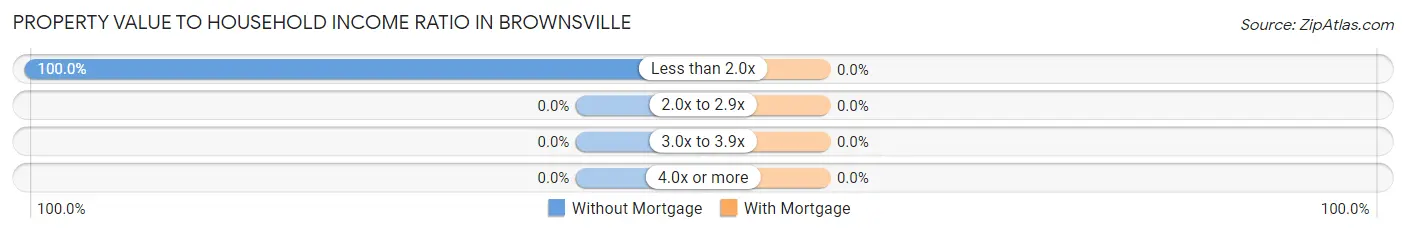
| Value-to-Income Ratio | Without Mortgage | With Mortgage |
| Less than 2.0x | 63 (100.0%) | 0 (0.0%) |
| 2.0x to 2.9x | 0 (0.0%) | 0 (0.0%) |
| 3.0x to 3.9x | 0 (0.0%) | 0 (0.0%) |
| 4.0x or more | 0 (0.0%) | 0 (0.0%) |
| Total | 63 (100.0%) | 40 (100.0%) |
Real Estate Taxes by Mortgage Status in Brownsville
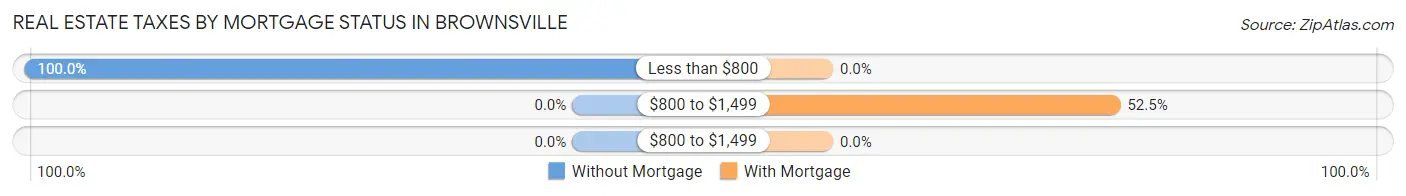
| Property Taxes | Without Mortgage | With Mortgage |
| Less than $800 | 63 (100.0%) | 0 (0.0%) |
| $800 to $1,499 | 0 (0.0%) | 21 (52.5%) |
| $800 to $1,499 | 0 (0.0%) | 0 (0.0%) |
| Total | 63 (100.0%) | 40 (100.0%) |
Health & Disability in Brownsville
Health Insurance Coverage by Age in Brownsville
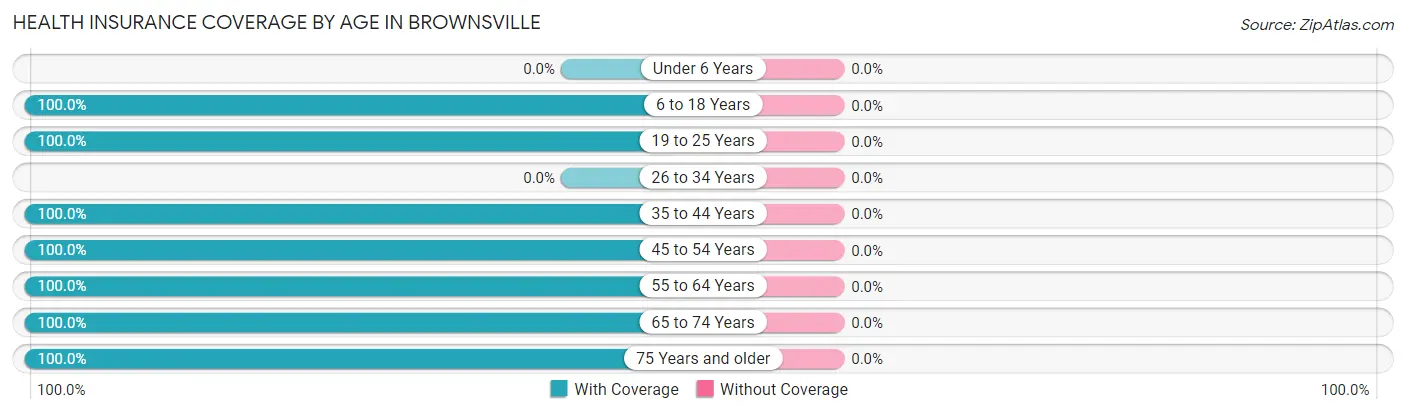
| Age Bracket | With Coverage | Without Coverage |
| Under 6 Years | 0 (0.0%) | 0 (0.0%) |
| 6 to 18 Years | 81 (100.0%) | 0 (0.0%) |
| 19 to 25 Years | 63 (100.0%) | 0 (0.0%) |
| 26 to 34 Years | 0 (0.0%) | 0 (0.0%) |
| 35 to 44 Years | 50 (100.0%) | 0 (0.0%) |
| 45 to 54 Years | 32 (100.0%) | 0 (0.0%) |
| 55 to 64 Years | 34 (100.0%) | 0 (0.0%) |
| 65 to 74 Years | 56 (100.0%) | 0 (0.0%) |
| 75 Years and older | 62 (100.0%) | 0 (0.0%) |
| Total | 378 (100.0%) | 0 (0.0%) |
Health Insurance Coverage by Citizenship Status in Brownsville
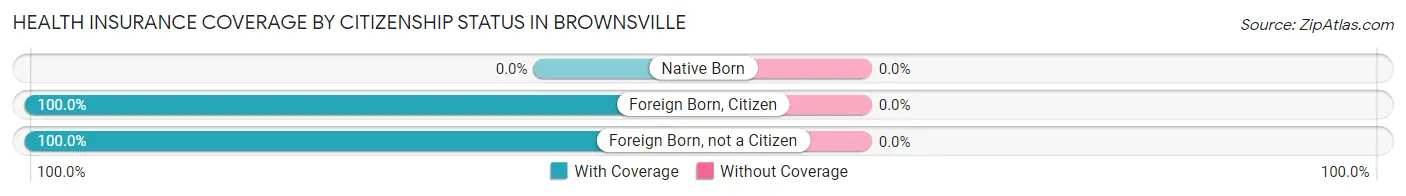
| Citizenship Status | With Coverage | Without Coverage |
| Native Born | 0 (0.0%) | 0 (0.0%) |
| Foreign Born, Citizen | 81 (100.0%) | 0 (0.0%) |
| Foreign Born, not a Citizen | 63 (100.0%) | 0 (0.0%) |
Health Insurance Coverage by Household Income in Brownsville
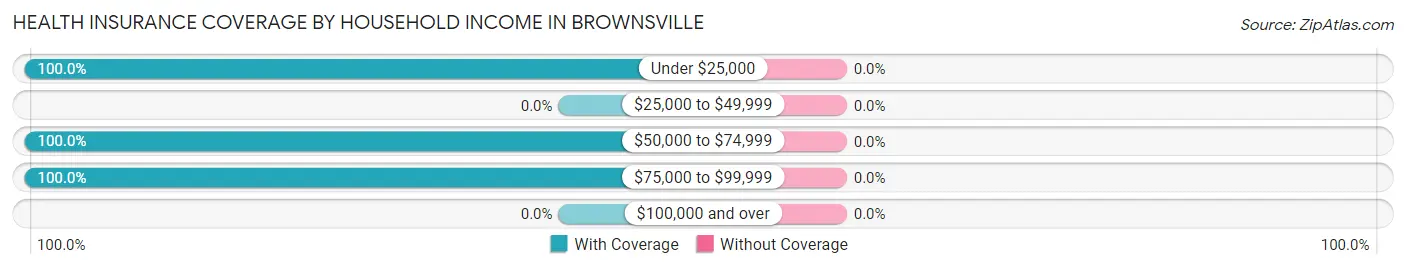
| Household Income | With Coverage | Without Coverage |
| Under $25,000 | 162 (100.0%) | 0 (0.0%) |
| $25,000 to $49,999 | 0 (0.0%) | 0 (0.0%) |
| $50,000 to $74,999 | 78 (100.0%) | 0 (0.0%) |
| $75,000 to $99,999 | 138 (100.0%) | 0 (0.0%) |
| $100,000 and over | 0 (0.0%) | 0 (0.0%) |
Public vs Private Health Insurance Coverage by Age in Brownsville
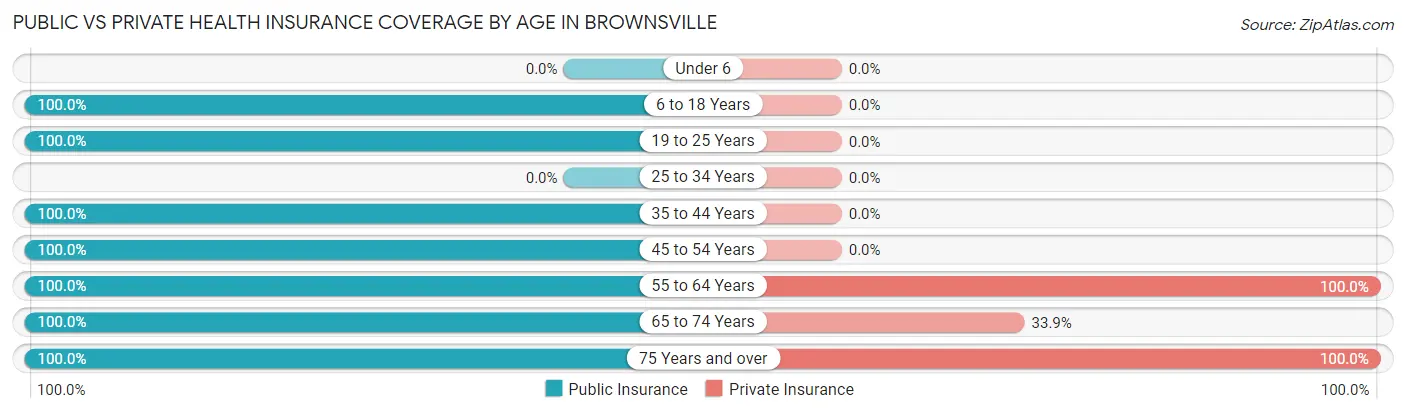
| Age Bracket | Public Insurance | Private Insurance |
| Under 6 | 0 (0.0%) | 0 (0.0%) |
| 6 to 18 Years | 81 (100.0%) | 0 (0.0%) |
| 19 to 25 Years | 63 (100.0%) | 0 (0.0%) |
| 25 to 34 Years | 0 (0.0%) | 0 (0.0%) |
| 35 to 44 Years | 50 (100.0%) | 0 (0.0%) |
| 45 to 54 Years | 32 (100.0%) | 0 (0.0%) |
| 55 to 64 Years | 34 (100.0%) | 34 (100.0%) |
| 65 to 74 Years | 56 (100.0%) | 19 (33.9%) |
| 75 Years and over | 62 (100.0%) | 62 (100.0%) |
| Total | 378 (100.0%) | 115 (30.4%) |
Disability Status by Sex by Age in Brownsville
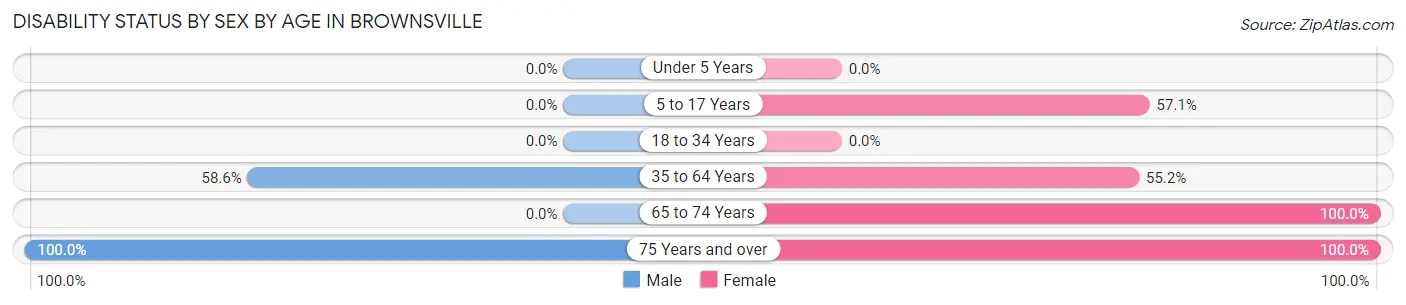
| Age Bracket | Male | Female |
| Under 5 Years | 0 (0.0%) | 0 (0.0%) |
| 5 to 17 Years | 0 (0.0%) | 32 (57.1%) |
| 18 to 34 Years | 0 (0.0%) | 0 (0.0%) |
| 35 to 64 Years | 34 (58.6%) | 32 (55.2%) |
| 65 to 74 Years | 0 (0.0%) | 37 (100.0%) |
| 75 Years and over | 41 (100.0%) | 21 (100.0%) |
Disability Class by Sex by Age in Brownsville
Disability Class: Hearing Difficulty
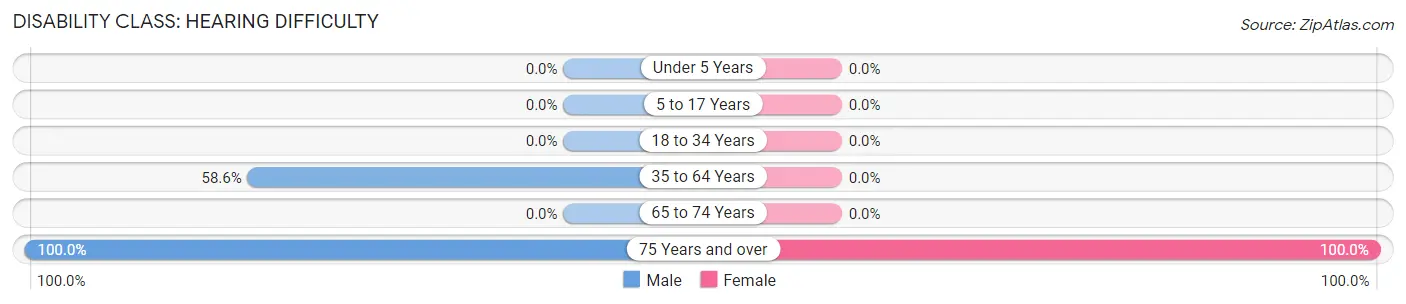
| Age Bracket | Male | Female |
| Under 5 Years | 0 (0.0%) | 0 (0.0%) |
| 5 to 17 Years | 0 (0.0%) | 0 (0.0%) |
| 18 to 34 Years | 0 (0.0%) | 0 (0.0%) |
| 35 to 64 Years | 34 (58.6%) | 0 (0.0%) |
| 65 to 74 Years | 0 (0.0%) | 0 (0.0%) |
| 75 Years and over | 41 (100.0%) | 21 (100.0%) |
Disability Class: Vision Difficulty
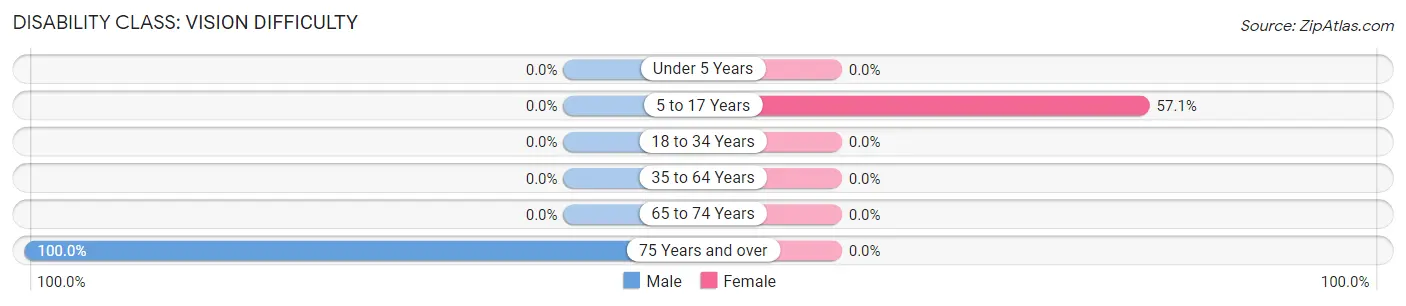
| Age Bracket | Male | Female |
| Under 5 Years | 0 (0.0%) | 0 (0.0%) |
| 5 to 17 Years | 0 (0.0%) | 32 (57.1%) |
| 18 to 34 Years | 0 (0.0%) | 0 (0.0%) |
| 35 to 64 Years | 0 (0.0%) | 0 (0.0%) |
| 65 to 74 Years | 0 (0.0%) | 0 (0.0%) |
| 75 Years and over | 41 (100.0%) | 0 (0.0%) |
Disability Class: Cognitive Difficulty
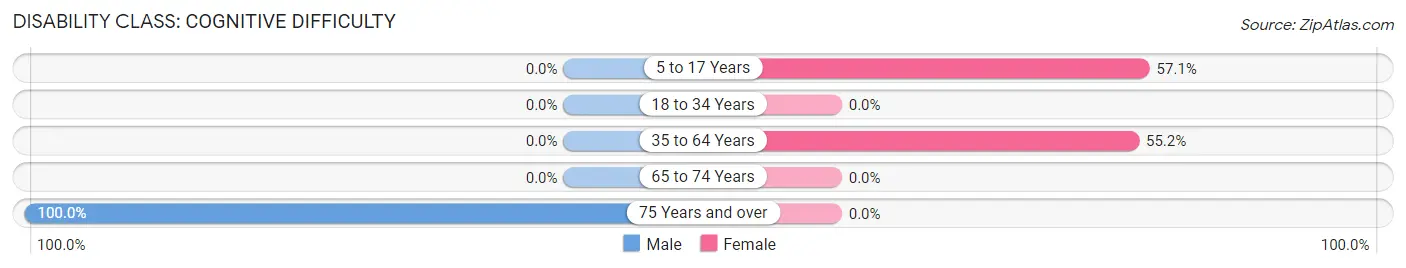
| Age Bracket | Male | Female |
| 5 to 17 Years | 0 (0.0%) | 32 (57.1%) |
| 18 to 34 Years | 0 (0.0%) | 0 (0.0%) |
| 35 to 64 Years | 0 (0.0%) | 32 (55.2%) |
| 65 to 74 Years | 0 (0.0%) | 0 (0.0%) |
| 75 Years and over | 41 (100.0%) | 0 (0.0%) |
Disability Class: Ambulatory Difficulty
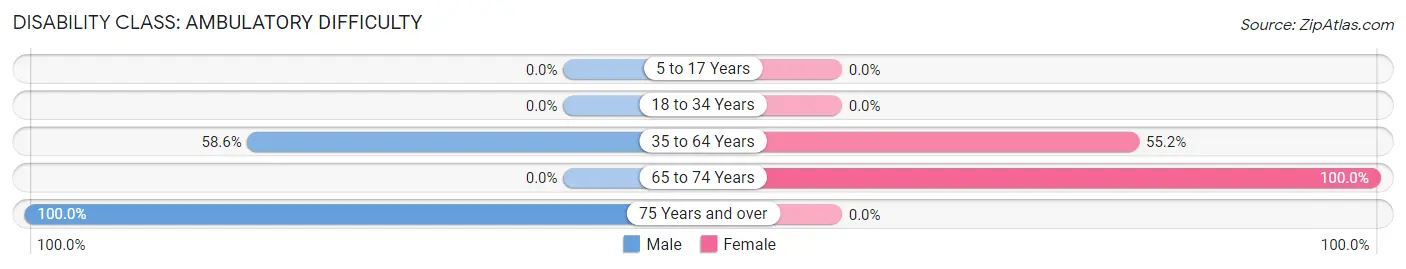
| Age Bracket | Male | Female |
| 5 to 17 Years | 0 (0.0%) | 0 (0.0%) |
| 18 to 34 Years | 0 (0.0%) | 0 (0.0%) |
| 35 to 64 Years | 34 (58.6%) | 32 (55.2%) |
| 65 to 74 Years | 0 (0.0%) | 37 (100.0%) |
| 75 Years and over | 41 (100.0%) | 0 (0.0%) |
Disability Class: Self-Care Difficulty
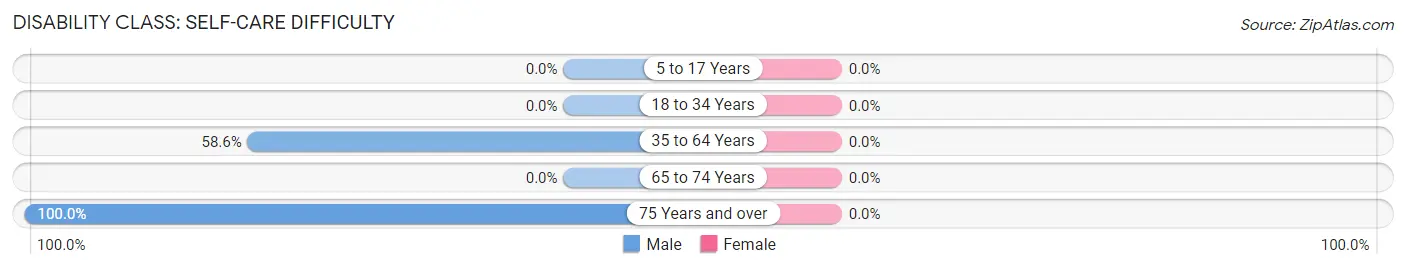
| Age Bracket | Male | Female |
| 5 to 17 Years | 0 (0.0%) | 0 (0.0%) |
| 18 to 34 Years | 0 (0.0%) | 0 (0.0%) |
| 35 to 64 Years | 34 (58.6%) | 0 (0.0%) |
| 65 to 74 Years | 0 (0.0%) | 0 (0.0%) |
| 75 Years and over | 41 (100.0%) | 0 (0.0%) |
Technology Access in Brownsville
Computing Device Access in Brownsville
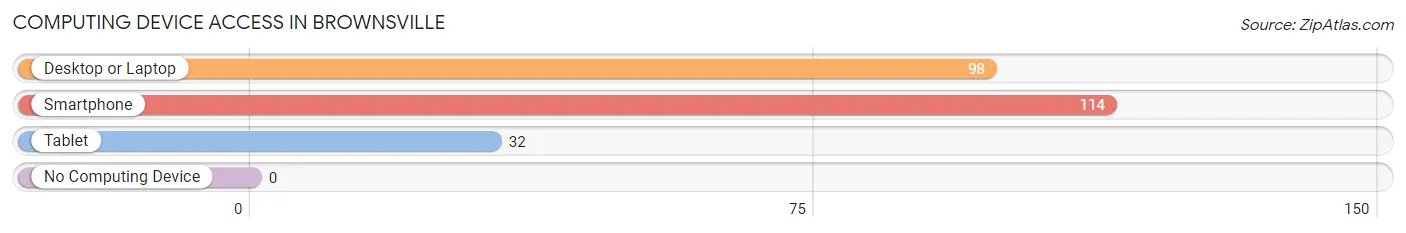
| Device Type | # Households | % Households |
| Desktop or Laptop | 98 | 72.6% |
| Smartphone | 114 | 84.4% |
| Tablet | 32 | 23.7% |
| No Computing Device | 0 | 0.0% |
| Total | 135 | 100.0% |
Internet Access in Brownsville
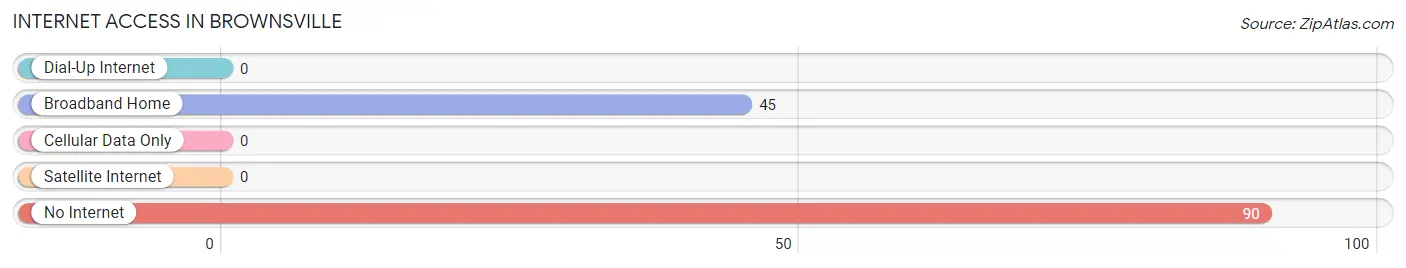
| Internet Type | # Households | % Households |
| Dial-Up Internet | 0 | 0.0% |
| Broadband Home | 45 | 33.3% |
| Cellular Data Only | 0 | 0.0% |
| Satellite Internet | 0 | 0.0% |
| No Internet | 90 | 66.7% |
| Total | 135 | 100.0% |
Brownsville Summary
Brownsville, Ohio is a small village located in the southeastern corner of Jefferson County, Ohio. It is situated on the banks of the Ohio River, approximately 30 miles east of Steubenville and 40 miles west of Pittsburgh, Pennsylvania. The village has a population of approximately 1,000 people and covers an area of 0.6 square miles.
History
The area that is now Brownsville was first settled in 1796 by a group of settlers from Pennsylvania. The village was originally known as “Brown’s Settlement” after the first settler, John Brown. The village was officially incorporated in 1817 and was renamed Brownsville.
The village was an important stop on the Underground Railroad, with many runaway slaves passing through the area on their way to freedom. The village was also a major stop on the Ohio and Erie Canal, which was completed in 1832. The canal was an important transportation route for goods and people, and it helped to spur the growth of the village.
In the late 19th century, Brownsville was a major center for the coal and steel industries. The village was home to several coal mines and steel mills, which provided employment for many of the residents. The village also had several other industries, including a brickyard, a flour mill, and a sawmill.
Geography
Brownsville is located in the southeastern corner of Jefferson County, Ohio. It is situated on the banks of the Ohio River, approximately 30 miles east of Steubenville and 40 miles west of Pittsburgh, Pennsylvania. The village has a total area of 0.6 square miles, all of which is land.
The village is located in a hilly region of the Appalachian Plateau. The terrain is mostly wooded, with some open fields and pastures. The village is located in a humid continental climate zone, with hot summers and cold winters.
Economy
The economy of Brownsville is largely based on agriculture and tourism. The village is home to several farms, which produce a variety of crops, including corn, soybeans, and hay. The village also has several wineries and breweries, which attract tourists from all over the region.
The village also has several small businesses, including a grocery store, a hardware store, and a few restaurants. The village is also home to a few manufacturing companies, which produce a variety of products, including furniture, clothing, and automotive parts.
Demographics
As of the 2010 census, the population of Brownsville was 1,000 people. The racial makeup of the village was 97.2% White, 0.7% African American, 0.3% Native American, 0.3% Asian, and 1.5% from other races. The median household income was $37,500, and the median family income was $45,000.
The village has a large elderly population, with nearly 20% of the population over the age of 65. The village also has a large number of children, with nearly 30% of the population under the age of 18. The village has a low unemployment rate, with only 4.2% of the population unemployed.
Common Questions
What is Per Capita Income in Brownsville?
Per Capita income in Brownsville is $16,443.
What is Inequality or Gini Index in Brownsville?
Inequality or Gini Index in Brownsville is 0.37.
What is the Total Population of Brownsville?
Total Population of Brownsville is 378.
What is the Total Male Population of Brownsville?
Total Male Population of Brownsville is 173.
What is the Total Female Population of Brownsville?
Total Female Population of Brownsville is 205.
What is the Ratio of Males per 100 Females in Brownsville?
There are 84.39 Males per 100 Females in Brownsville.
What is the Ratio of Females per 100 Males in Brownsville?
There are 118.50 Females per 100 Males in Brownsville.
What is the Median Population Age in Brownsville?
Median Population Age in Brownsville is 44.8 Years.
What is the Average Family Size in Brownsville
Average Family Size in Brownsville is 3.6 People.
What is the Average Household Size in Brownsville
Average Household Size in Brownsville is 2.8 People.
How Large is the Labor Force in Brownsville?
There are 50 People in the Labor Forcein in Brownsville.
What is the Percentage of People in the Labor Force in Brownsville?
16.8% of People are in the Labor Force in Brownsville.
What is the Unemployment Rate in Brownsville?
Unemployment Rate in Brownsville is 100.0%.