Cities with the Largest German Community in South Dakota
RELATED REPORTS & OPTIONS
German
South Dakota
Compare Cities
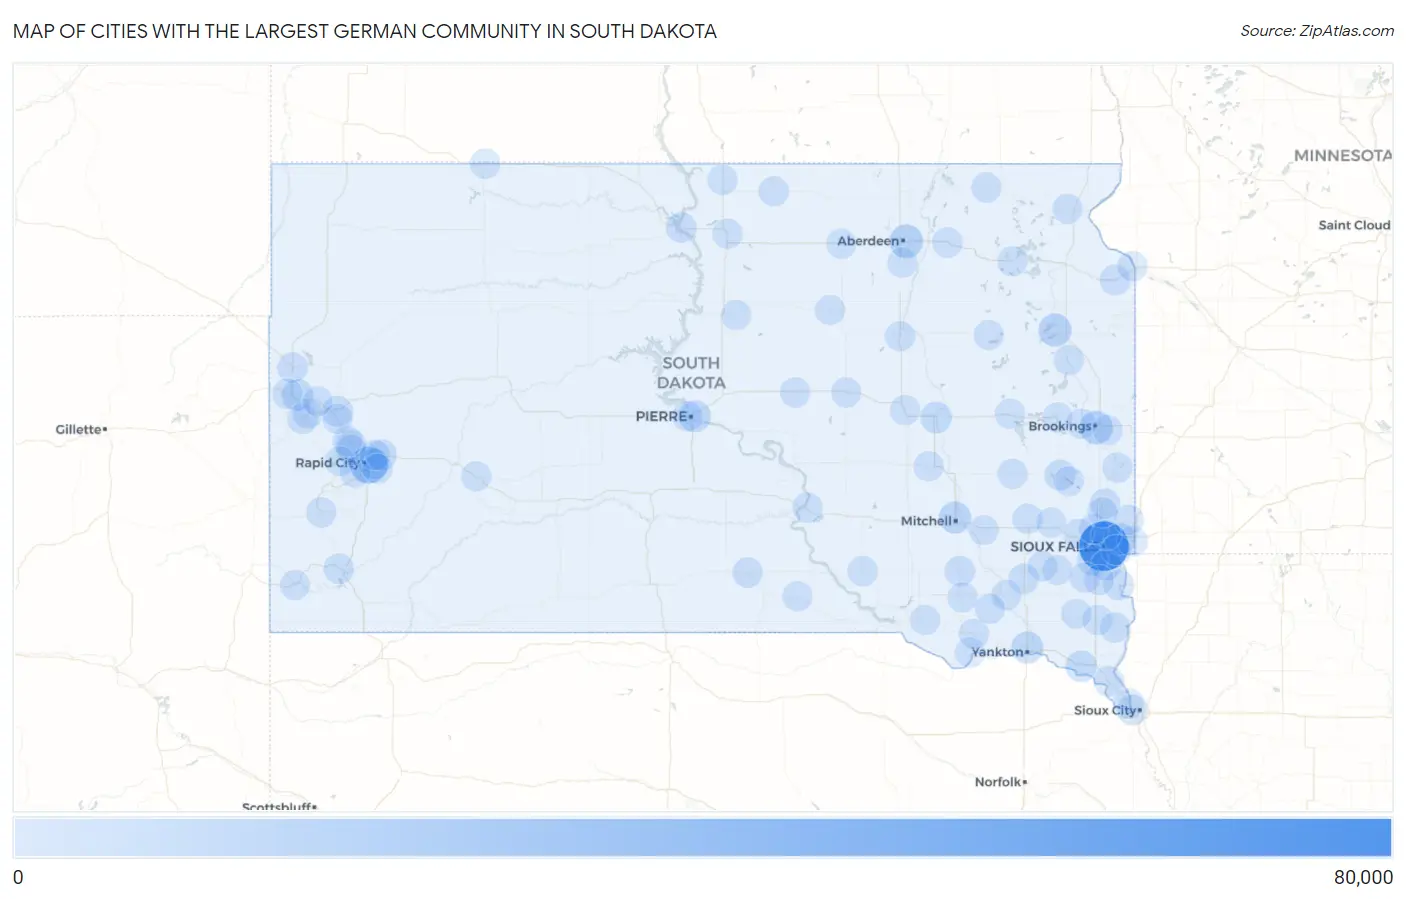
Map of Cities with the Largest German Community in South Dakota
0
80,000
Cities with the Largest German Community in South Dakota
| City | German | vs State | vs National | |
| 1. | Sioux Falls | 63,378 | 303,478(20.88%)#1 | 41,919,607(0.15%)#30 |
| 2. | Rapid City | 21,183 | 303,478(6.98%)#2 | 41,919,607(0.05%)#135 |
| 3. | Aberdeen | 10,920 | 303,478(3.60%)#3 | 41,919,607(0.03%)#381 |
| 4. | Brookings | 9,558 | 303,478(3.15%)#4 | 41,919,607(0.02%)#476 |
| 5. | Watertown | 9,004 | 303,478(2.97%)#5 | 41,919,607(0.02%)#510 |
| 6. | Mitchell | 6,092 | 303,478(2.01%)#6 | 41,919,607(0.01%)#876 |
| 7. | Yankton | 6,040 | 303,478(1.99%)#7 | 41,919,607(0.01%)#889 |
| 8. | Pierre | 5,144 | 303,478(1.70%)#8 | 41,919,607(0.01%)#1,084 |
| 9. | Huron | 4,555 | 303,478(1.50%)#9 | 41,919,607(0.01%)#1,237 |
| 10. | Brandon | 4,489 | 303,478(1.48%)#10 | 41,919,607(0.01%)#1,262 |
| 11. | Vermillion | 4,237 | 303,478(1.40%)#11 | 41,919,607(0.01%)#1,348 |
| 12. | Spearfish | 4,068 | 303,478(1.34%)#12 | 41,919,607(0.01%)#1,404 |
| 13. | Box Elder | 2,957 | 303,478(0.97%)#13 | 41,919,607(0.01%)#1,998 |
| 14. | Tea | 2,385 | 303,478(0.79%)#14 | 41,919,607(0.01%)#2,470 |
| 15. | Rapid Valley | 2,363 | 303,478(0.78%)#15 | 41,919,607(0.01%)#2,489 |
| 16. | Harrisburg | 2,348 | 303,478(0.77%)#16 | 41,919,607(0.01%)#2,509 |
| 17. | Sturgis | 2,342 | 303,478(0.77%)#17 | 41,919,607(0.01%)#2,523 |
| 18. | Madison | 2,341 | 303,478(0.77%)#18 | 41,919,607(0.01%)#2,524 |
| 19. | Milbank | 1,626 | 303,478(0.54%)#19 | 41,919,607(0.00%)#3,555 |
| 20. | Mobridge | 1,441 | 303,478(0.47%)#20 | 41,919,607(0.00%)#3,944 |
| 21. | Belle Fourche | 1,398 | 303,478(0.46%)#21 | 41,919,607(0.00%)#4,050 |
| 22. | Dell Rapids | 1,378 | 303,478(0.45%)#22 | 41,919,607(0.00%)#4,101 |
| 23. | Summerset | 1,255 | 303,478(0.41%)#23 | 41,919,607(0.00%)#4,407 |
| 24. | Winner | 1,157 | 303,478(0.38%)#24 | 41,919,607(0.00%)#4,666 |
| 25. | Parkston | 1,092 | 303,478(0.36%)#25 | 41,919,607(0.00%)#4,888 |
| 26. | Fort Pierre | 1,038 | 303,478(0.34%)#26 | 41,919,607(0.00%)#5,086 |
| 27. | Dakota Dunes | 1,031 | 303,478(0.34%)#27 | 41,919,607(0.00%)#5,112 |
| 28. | Lennox | 1,003 | 303,478(0.33%)#28 | 41,919,607(0.00%)#5,210 |
| 29. | Canton | 998 | 303,478(0.33%)#29 | 41,919,607(0.00%)#5,230 |
| 30. | Colonial Pine Hills | 981 | 303,478(0.32%)#30 | 41,919,607(0.00%)#5,292 |
| 31. | Blackhawk | 931 | 303,478(0.31%)#31 | 41,919,607(0.00%)#5,512 |
| 32. | Hot Springs | 925 | 303,478(0.30%)#32 | 41,919,607(0.00%)#5,531 |
| 33. | North Spearfish | 913 | 303,478(0.30%)#33 | 41,919,607(0.00%)#5,579 |
| 34. | Hartford | 907 | 303,478(0.30%)#34 | 41,919,607(0.00%)#5,601 |
| 35. | Lead | 855 | 303,478(0.28%)#35 | 41,919,607(0.00%)#5,850 |
| 36. | Freeman | 832 | 303,478(0.27%)#36 | 41,919,607(0.00%)#5,950 |
| 37. | Volga | 793 | 303,478(0.26%)#37 | 41,919,607(0.00%)#6,140 |
| 38. | Aurora | 780 | 303,478(0.26%)#38 | 41,919,607(0.00%)#6,211 |
| 39. | Groton | 763 | 303,478(0.25%)#39 | 41,919,607(0.00%)#6,308 |
| 40. | Webster | 759 | 303,478(0.25%)#40 | 41,919,607(0.00%)#6,327 |
| 41. | Elk Point | 731 | 303,478(0.24%)#41 | 41,919,607(0.00%)#6,482 |
| 42. | Redfield | 702 | 303,478(0.23%)#42 | 41,919,607(0.00%)#6,659 |
| 43. | Custer | 696 | 303,478(0.23%)#43 | 41,919,607(0.00%)#6,705 |
| 44. | Beresford | 685 | 303,478(0.23%)#44 | 41,919,607(0.00%)#6,775 |
| 45. | Gettysburg | 660 | 303,478(0.22%)#45 | 41,919,607(0.00%)#6,947 |
| 46. | Miller | 639 | 303,478(0.21%)#46 | 41,919,607(0.00%)#7,107 |
| 47. | Crooks | 627 | 303,478(0.21%)#47 | 41,919,607(0.00%)#7,215 |
| 48. | Ipswich | 617 | 303,478(0.20%)#48 | 41,919,607(0.00%)#7,278 |
| 49. | Springfield | 614 | 303,478(0.20%)#49 | 41,919,607(0.00%)#7,298 |
| 50. | North Sioux City | 596 | 303,478(0.20%)#50 | 41,919,607(0.00%)#7,437 |
| 51. | Menno | 556 | 303,478(0.18%)#51 | 41,919,607(0.00%)#7,772 |
| 52. | Valley Springs | 554 | 303,478(0.18%)#52 | 41,919,607(0.00%)#7,791 |
| 53. | Clark | 551 | 303,478(0.18%)#53 | 41,919,607(0.00%)#7,822 |
| 54. | Gregory | 550 | 303,478(0.18%)#54 | 41,919,607(0.00%)#7,829 |
| 55. | Flandreau | 547 | 303,478(0.18%)#55 | 41,919,607(0.00%)#7,857 |
| 56. | Chamberlain | 534 | 303,478(0.18%)#56 | 41,919,607(0.00%)#7,982 |
| 57. | Eureka | 519 | 303,478(0.17%)#57 | 41,919,607(0.00%)#8,132 |
| 58. | Salem | 512 | 303,478(0.17%)#58 | 41,919,607(0.00%)#8,194 |
| 59. | Baltic | 507 | 303,478(0.17%)#59 | 41,919,607(0.00%)#8,245 |
| 60. | Britton | 496 | 303,478(0.16%)#60 | 41,919,607(0.00%)#8,349 |
| 61. | Platte | 489 | 303,478(0.16%)#61 | 41,919,607(0.00%)#8,421 |
| 62. | Lemmon | 487 | 303,478(0.16%)#62 | 41,919,607(0.00%)#8,444 |
| 63. | Piedmont | 481 | 303,478(0.16%)#63 | 41,919,607(0.00%)#8,526 |
| 64. | Big Stone City | 470 | 303,478(0.15%)#64 | 41,919,607(0.00%)#8,650 |
| 65. | Herreid | 468 | 303,478(0.15%)#65 | 41,919,607(0.00%)#8,676 |
| 66. | Parker | 464 | 303,478(0.15%)#66 | 41,919,607(0.00%)#8,724 |
| 67. | Alcester | 460 | 303,478(0.15%)#67 | 41,919,607(0.00%)#8,781 |
| 68. | Deadwood | 455 | 303,478(0.15%)#68 | 41,919,607(0.00%)#8,844 |
| 69. | Sisseton | 446 | 303,478(0.15%)#69 | 41,919,607(0.00%)#8,939 |
| 70. | Tyndall | 438 | 303,478(0.14%)#70 | 41,919,607(0.00%)#9,044 |
| 71. | Arlington | 421 | 303,478(0.14%)#71 | 41,919,607(0.00%)#9,238 |
| 72. | Garretson | 399 | 303,478(0.13%)#72 | 41,919,607(0.00%)#9,530 |
| 73. | De Smet | 386 | 303,478(0.13%)#73 | 41,919,607(0.00%)#9,709 |
| 74. | Marion | 386 | 303,478(0.13%)#74 | 41,919,607(0.00%)#9,711 |
| 75. | Ashland Heights | 374 | 303,478(0.12%)#75 | 41,919,607(0.00%)#9,881 |
| 76. | Wolsey | 370 | 303,478(0.12%)#76 | 41,919,607(0.00%)#9,935 |
| 77. | Worthing | 356 | 303,478(0.12%)#77 | 41,919,607(0.00%)#10,149 |
| 78. | Alexandria | 354 | 303,478(0.12%)#78 | 41,919,607(0.00%)#10,175 |
| 79. | Scotland | 352 | 303,478(0.12%)#79 | 41,919,607(0.00%)#10,208 |
| 80. | Selby | 351 | 303,478(0.12%)#80 | 41,919,607(0.00%)#10,230 |
| 81. | Green Valley | 345 | 303,478(0.11%)#81 | 41,919,607(0.00%)#10,338 |
| 82. | Lake Madison | 332 | 303,478(0.11%)#82 | 41,919,607(0.00%)#10,553 |
| 83. | Faulkton | 330 | 303,478(0.11%)#83 | 41,919,607(0.00%)#10,582 |
| 84. | Highmore | 328 | 303,478(0.11%)#84 | 41,919,607(0.00%)#10,626 |
| 85. | Johnson Siding | 325 | 303,478(0.11%)#85 | 41,919,607(0.00%)#10,675 |
| 86. | Wagner | 322 | 303,478(0.11%)#86 | 41,919,607(0.00%)#10,726 |
| 87. | Howard | 322 | 303,478(0.11%)#87 | 41,919,607(0.00%)#10,731 |
| 88. | Meadow View Addition | 320 | 303,478(0.11%)#88 | 41,919,607(0.00%)#10,769 |
| 89. | Centerville | 318 | 303,478(0.10%)#89 | 41,919,607(0.00%)#10,807 |
| 90. | Blucksberg Mountain | 316 | 303,478(0.10%)#90 | 41,919,607(0.00%)#10,852 |
| 91. | Mina | 315 | 303,478(0.10%)#91 | 41,919,607(0.00%)#10,865 |
| 92. | Castlewood | 311 | 303,478(0.10%)#92 | 41,919,607(0.00%)#10,931 |
| 93. | Edgemont | 303 | 303,478(0.10%)#93 | 41,919,607(0.00%)#11,071 |
| 94. | Woonsocket | 302 | 303,478(0.10%)#94 | 41,919,607(0.00%)#11,089 |
| 95. | Montrose | 299 | 303,478(0.10%)#95 | 41,919,607(0.00%)#11,146 |
| 96. | Warner | 288 | 303,478(0.09%)#96 | 41,919,607(0.00%)#11,342 |
| 97. | Anderson | 283 | 303,478(0.09%)#97 | 41,919,607(0.00%)#11,455 |
| 98. | Whitewood | 280 | 303,478(0.09%)#98 | 41,919,607(0.00%)#11,518 |
| 99. | Tripp | 275 | 303,478(0.09%)#99 | 41,919,607(0.00%)#11,653 |
| 100. | Wall | 273 | 303,478(0.09%)#100 | 41,919,607(0.00%)#11,684 |
Common Questions
What are the Top 10 Cities with the Largest German Community in South Dakota?
Top 10 Cities with the Largest German Community in South Dakota are:
#1
63,378
#2
21,183
#3
10,920
#4
9,558
#5
9,004
#6
6,092
#7
6,040
#8
5,144
#9
4,555
#10
4,489
What city has the Largest German Community in South Dakota?
Sioux Falls has the Largest German Community in South Dakota with 63,378.
What is the Total German Population in the State of South Dakota?
Total German Population in South Dakota is 303,478.
What is the Total German Population in the United States?
Total German Population in the United States is 41,919,607.