Zip Codes with the Highest Percentage of Population Employed in Education Instruction & Library in Boston, MA

RELATED REPORTS & OPTIONS

Education Instruction & Library
Population
Families and Households
Female Fertility
Female Fertility (Unmarried)
Race (Community Size)
Race (Percentage)
Ancestry (Community Size)
AfghanAfricanAlaska NativeAlbanianAmericanArabArgentineanArmenianAustralianAustrianBarbadianBelgianBermudanBhutaneseBlackfeetBolivianBrazilianBritishBulgarianBurmeseCanadianCape VerdeanCelticCentral AmericanCentral American IndianCherokeeChileanChippewaChoctawColombianCosta RicanCroatianCubanCypriotCzechDanishDominicanDutchEastern EuropeanEcuadorianEgyptianEnglishEstonianEthiopianEuropeanFilipinoFinnishFrenchFrench CanadianGermanGhanaianGreekGuatemalanGuyaneseHaitianHonduranHungarianIcelanderIndian (Asian)IndonesianIranianIraqiIrishIsraeliItalianJamaicanJapaneseJordanianKenyanKoreanLaotianLatvianLebaneseLithuanianMacedonianMalaysianMalteseMexicanMexican American IndianMongolianMoroccanNative HawaiianNavajoNew ZealanderNicaraguanNigerianNorthern EuropeanNorwegianOkinawanPakistaniPalestinianPanamanianPeruvianPolishPortuguesePuerto RicanRomanianRussianSalvadoranScandinavianScotch-IrishScottishSerbianSlavicSlovakSloveneSouth AfricanSouth AmericanSouth American IndianSpaniardSpanishSri LankanSubsaharan AfricanSudaneseSwedishSwissSyrianThaiTrinidadian and TobagonianTurkishUgandanUkrainianVenezuelanVietnameseWelshWest IndianYugoslavianZimbabwean
Ancestry (Percentage)
AfghanAfricanAlaska NativeAlbanianAmericanArabArgentineanArmenianAustralianAustrianBarbadianBelgianBermudanBhutaneseBlackfeetBolivianBrazilianBritishBulgarianBurmeseCanadianCape VerdeanCelticCentral AmericanCentral American IndianCherokeeChileanChippewaChoctawColombianCosta RicanCroatianCubanCypriotCzechDanishDominicanDutchEastern EuropeanEcuadorianEgyptianEnglishEstonianEthiopianEuropeanFilipinoFinnishFrenchFrench CanadianGermanGhanaianGreekGuatemalanGuyaneseHaitianHonduranHungarianIcelanderIndian (Asian)IndonesianIranianIraqiIrishIsraeliItalianJamaicanJapaneseJordanianKenyanKoreanLaotianLatvianLebaneseLithuanianMacedonianMalaysianMalteseMexicanMexican American IndianMongolianMoroccanNative HawaiianNavajoNew ZealanderNicaraguanNigerianNorthern EuropeanNorwegianOkinawanPakistaniPalestinianPanamanianPeruvianPolishPortuguesePuerto RicanRomanianRussianSalvadoranScandinavianScotch-IrishScottishSerbianSlavicSlovakSloveneSouth AfricanSouth AmericanSouth American IndianSpaniardSpanishSri LankanSubsaharan AfricanSudaneseSwedishSwissSyrianThaiTrinidadian and TobagonianTurkishUgandanUkrainianVenezuelanVietnameseWelshWest IndianYugoslavianZimbabwean
Immigrant Origin (Total)
AfricaAlbaniaArgentinaAsiaAustraliaBangladeshBarbadosBelarusBelgiumBosnia and HerzegovinaBrazilBulgariaBurma / MyanmarCabo VerdeCambodiaCanadaCaribbeanCentral AmericaChileChinaColombiaCosta RicaCroatiaCubaCzechoslovakiaDenmarkDominican RepublicEastern AfricaEastern AsiaEastern EuropeEcuadorEgyptEl SalvadorEnglandEritreaEthiopiaEuropeFranceGermanyGhanaGreeceGuatemalaGuyanaHaitiHondurasHong KongHungaryIndiaIndonesiaIranIraqIrelandIsraelItalyJamaicaJapanJordanKazakhstanKenyaKoreaKuwaitLaosLatin AmericaLebanonLiberiaLithuaniaMalaysiaMexicoMoldovaMoroccoNepalNetherlandsNicaraguaNigeriaNorthern AfricaNorthern EuropeNorwayOceaniaPakistanPanamaPeruPhilippinesPolandPortugalRomaniaRussiaSaudi ArabiaScotlandSerbiaSingaporeSouth AfricaSouth AmericaSouth Central AsiaSouth Eastern AsiaSouthern EuropeSpainSri LankaSudanSwedenSwitzerlandTaiwanThailandTrinidad and TobagoTurkeyUgandaUkraineUzbekistanVenezuelaVietnamWest IndiesWestern AfricaWestern AsiaWestern EuropeZimbabwe
Immigrant Origin (Percentage)
AfricaAlbaniaArgentinaAsiaAustraliaBangladeshBarbadosBelarusBelgiumBosnia and HerzegovinaBrazilBulgariaBurma / MyanmarCabo VerdeCambodiaCanadaCaribbeanCentral AmericaChileChinaColombiaCosta RicaCroatiaCubaCzechoslovakiaDenmarkDominican RepublicEastern AfricaEastern AsiaEastern EuropeEcuadorEgyptEl SalvadorEnglandEritreaEthiopiaEuropeFranceGermanyGhanaGreeceGuatemalaGuyanaHaitiHondurasHong KongHungaryIndiaIndonesiaIranIraqIrelandIsraelItalyJamaicaJapanJordanKazakhstanKenyaKoreaKuwaitLaosLatin AmericaLebanonLiberiaLithuaniaMalaysiaMexicoMoldovaMoroccoNepalNetherlandsNicaraguaNigeriaNorthern AfricaNorthern EuropeNorwayOceaniaPakistanPanamaPeruPhilippinesPolandPortugalRomaniaRussiaSaudi ArabiaScotlandSerbiaSingaporeSouth AfricaSouth AmericaSouth Central AsiaSouth Eastern AsiaSouthern EuropeSpainSri LankaSudanSwedenSwitzerlandTaiwanThailandTrinidad and TobagoTurkeyUgandaUkraineUzbekistanVenezuelaVietnamWest IndiesWestern AfricaWestern AsiaWestern EuropeZimbabwe
Income
Income (Families)
Income (Households)
Poverty
Poverty (Families)
Unemployment
Employment Occupations
Employment Industries
Employer Class
Commute Time
Commute Means
School Enrollment
Education by Degree Field
Occupancy
Finances
Physical Characteristics
Boston
Compare Zip Codes
Comparison Subject

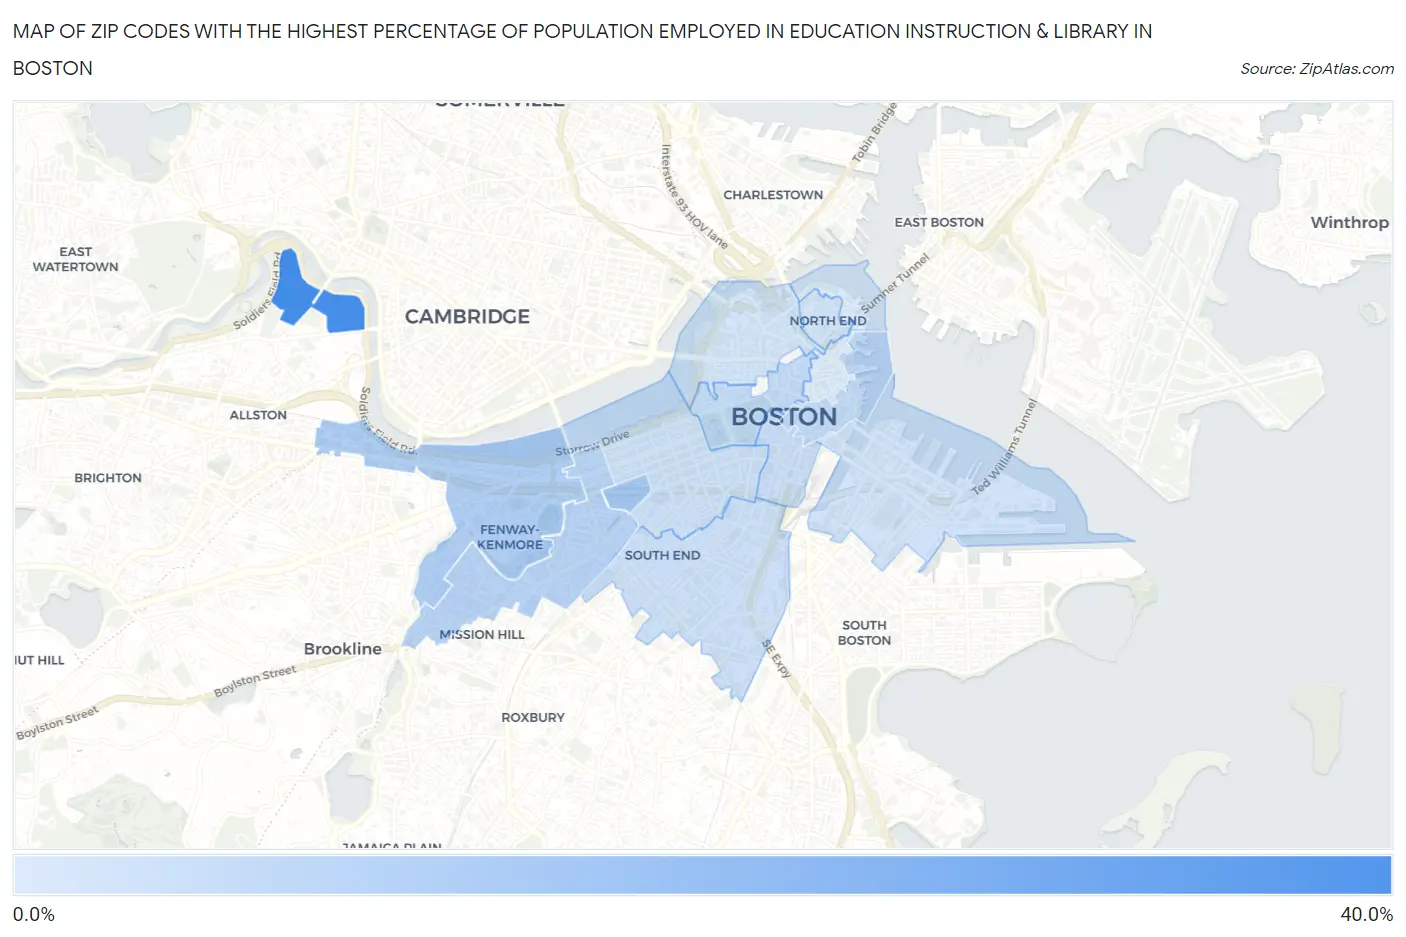
Map of Zip Codes with the Highest Percentage of Population Employed in Education Instruction & Library in Boston

0.0%
40.0%
Zip Codes with the Highest Percentage of Population Employed in Education Instruction & Library in Boston Map

Zip Codes with the Highest Percentage of Population Employed in Education Instruction & Library in Boston, MA

Zip Code % Employed vs State vs National
1.0216333.9%7.5%(+26.3)#56.2%(+27.7)#200
2.0219913.0%7.5%(+5.44)#456.2%(+6.78)#1,912
3.0221511.3%7.5%(+3.74)#676.2%(+5.09)#2,874
4.021159.6%7.5%(+2.02)#1346.2%(+3.37)#4,466
5.021108.0%7.5%(+0.495)#2116.2%(+1.84)#7,103
6.021087.2%7.5%(-0.376)#2636.2%(+0.970)#9,414
7.021116.4%7.5%(-1.17)#3176.2%(+0.180)#12,115
8.021165.9%7.5%(-1.59)#3436.2%(-0.240)#13,724
9.021185.6%7.5%(-1.94)#3696.2%(-0.592)#15,184
10.022104.9%7.5%(-2.64)#4186.2%(-1.30)#18,134
11.021144.3%7.5%(-3.24)#4466.2%(-1.89)#20,536
12.021134.3%7.5%(-3.25)#4476.2%(-1.90)#20,587
13.021092.8%7.5%(-4.76)#4916.2%(-3.42)#25,395

Common Questions

What are the Top 10 Zip Codes with the Highest Percentage of Population Employed in Education Instruction & Library in Boston, MA?
Top 10 Zip Codes with the Highest Percentage of Population Employed in Education Instruction & Library in Boston, MA are:
#1
33.9%
#2
13.0%
#3
11.3%
#4
9.6%
#5
8.0%
#6
7.2%
#7
6.4%
#8
5.9%
#9
5.6%
#10
4.9%
What zip code has the Highest Percentage of Population Employed in Education Instruction & Library in Boston, MA?
02163 has the Highest Percentage of Population Employed in Education Instruction & Library in Boston, MA with 33.9%.
What is the Percentage of Population Employed in Education Instruction & Library in Boston, MA?
Percentage of Population Employed in Education Instruction & Library in Boston is 7.6%.
What is the Percentage of Population Employed in Education Instruction & Library in Massachusetts?
Percentage of Population Employed in Education Instruction & Library in Massachusetts is 7.5%.
What is the Percentage of Population Employed in Education Instruction & Library in the United States?
Percentage of Population Employed in Education Instruction & Library in the United States is 6.2%.