Zip Codes with the Highest Percentage of Population Employed in Community & Social Service in Springfield, MA

RELATED REPORTS & OPTIONS

Community & Social Service
Population
Families and Households
Female Fertility
Female Fertility (Unmarried)
Race (Community Size)
Race (Percentage)
Ancestry (Community Size)
AfricanAmericanArabArgentineanArmenianAustralianAustrianBarbadianBhutaneseBlackfeetBrazilianBritishBritish West IndianBurmeseCanadianCape VerdeanCentral AmericanCentral American IndianCherokeeColombianCosta RicanCubanCzechCzechoslovakianDanishDominicanDutchEastern EuropeanEcuadorianEgyptianEnglishEuropeanFinnishFrenchFrench CanadianGermanGhanaianGreekGuatemalanGuyaneseHaitianHonduranHungarianIndian (Asian)IranianIraqiIrishItalianJamaicanJapaneseJordanianKoreanLebaneseLithuanianMalaysianMexicanMexican American IndianMoroccanNative HawaiianNicaraguanNigerianNorthern EuropeanNorwegianPanamanianPeruvianPolishPortuguesePuerto RicanRomanianRussianSalvadoranSamoanScandinavianScotch-IrishScottishSlavicSomaliSouth AmericanSpaniardSpanishSri LankanSubsaharan AfricanSwedishSwissThaiTrinidadian and TobagonianTurkishU.S. Virgin IslanderUkrainianWelshWest Indian
Ancestry (Percentage)
AfricanAmericanArabArgentineanArmenianAustralianAustrianBarbadianBhutaneseBlackfeetBrazilianBritishBritish West IndianBurmeseCanadianCape VerdeanCentral AmericanCentral American IndianCherokeeColombianCosta RicanCubanCzechCzechoslovakianDanishDominicanDutchEastern EuropeanEcuadorianEgyptianEnglishEuropeanFinnishFrenchFrench CanadianGermanGhanaianGreekGuatemalanGuyaneseHaitianHonduranHungarianIndian (Asian)IranianIraqiIrishItalianJamaicanJapaneseJordanianKoreanLebaneseLithuanianMalaysianMexicanMexican American IndianMoroccanNative HawaiianNicaraguanNigerianNorthern EuropeanNorwegianPanamanianPeruvianPolishPortuguesePuerto RicanRomanianRussianSalvadoranSamoanScandinavianScotch-IrishScottishSlavicSomaliSouth AmericanSpaniardSpanishSri LankanSubsaharan AfricanSwedishSwissThaiTrinidadian and TobagonianTurkishU.S. Virgin IslanderUkrainianWelshWest Indian
Immigrant Origin (Total)
Immigrant Origin (Percentage)
Income
Income (Families)
Income (Households)
Poverty
Poverty (Families)
Unemployment
Employment Occupations
Employment Industries
Employer Class
Commute Time
Commute Means
School Enrollment
Education by Degree Field
Occupancy
Finances
Physical Characteristics
Springfield
Compare Zip Codes
Comparison Subject

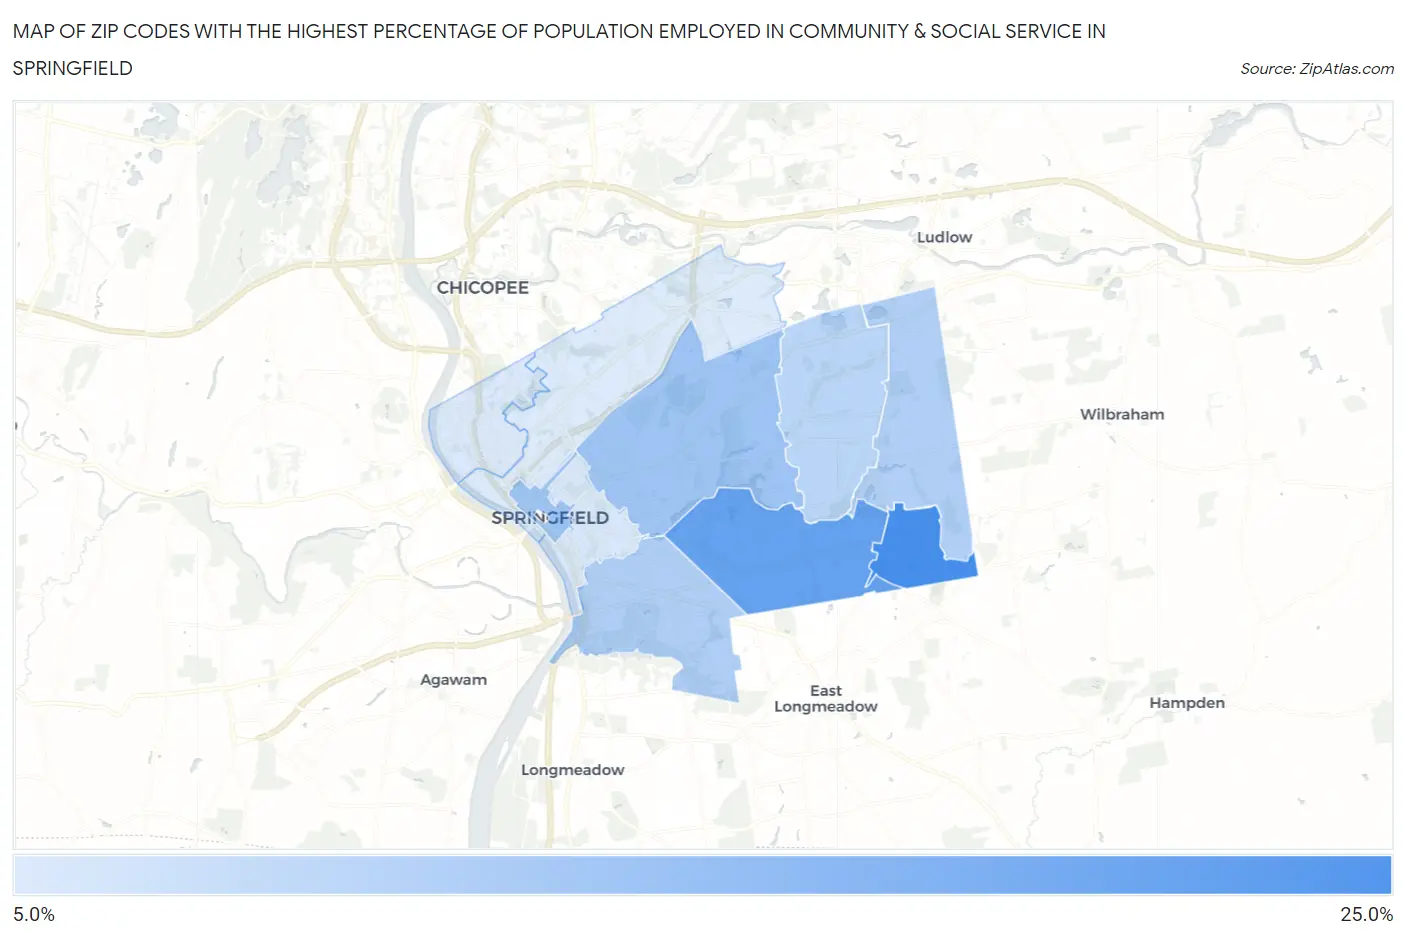
Map of Zip Codes with the Highest Percentage of Population Employed in Community & Social Service in Springfield

0.0%
25.0%
Zip Codes with the Highest Percentage of Population Employed in Community & Social Service  in Springfield Map

Zip Codes with the Highest Percentage of Population Employed in Community & Social Service in Springfield, MA

Zip Code % Employed vs State vs National
1.0112824.0%13.5%(+10.5)#3011.2%(+12.8)#1,111
2.0111820.8%13.5%(+7.33)#5311.2%(+9.62)#1,761
3.0110914.9%13.5%(+1.39)#19411.2%(+3.68)#5,058
4.0110314.9%13.5%(+1.35)#19611.2%(+3.65)#5,101
5.0110813.2%13.5%(-0.268)#26311.2%(+2.03)#7,169
6.0112913.1%13.5%(-0.455)#27311.2%(+1.84)#7,469
7.0111912.1%13.5%(-1.40)#31211.2%(+0.898)#9,129
8.011059.4%13.5%(-4.12)#42911.2%(-1.83)#15,721
9.011079.1%13.5%(-4.39)#43711.2%(-2.09)#16,480
10.011048.9%13.5%(-4.64)#44611.2%(-2.34)#17,169

Common Questions

What are the Top 5 Zip Codes with the Highest Percentage of Population Employed in Community & Social Service in Springfield, MA?
Top 5 Zip Codes with the Highest Percentage of Population Employed in Community & Social Service in Springfield, MA are:
#1
24.0%
#2
20.8%
#3
14.9%
#4
14.9%
#5
13.2%
What zip code has the Highest Percentage of Population Employed in Community & Social Service in Springfield, MA?
01128 has the Highest Percentage of Population Employed in Community & Social Service in Springfield, MA with 24.0%.
What is the Percentage of Population Employed in Community & Social Service in Springfield, MA?
Percentage of Population Employed in Community & Social Service in Springfield is 13.0%.
What is the Percentage of Population Employed in Community & Social Service in Massachusetts?
Percentage of Population Employed in Community & Social Service in Massachusetts is 13.5%.
What is the Percentage of Population Employed in Community & Social Service in the United States?
Percentage of Population Employed in Community & Social Service in the United States is 11.2%.