Zip Codes with the Highest Percentage of Population Employed in Community & Social Service in North Easton, MA
RELATED REPORTS & OPTIONS
Community & Social Service
North Easton
Compare Zip Codes
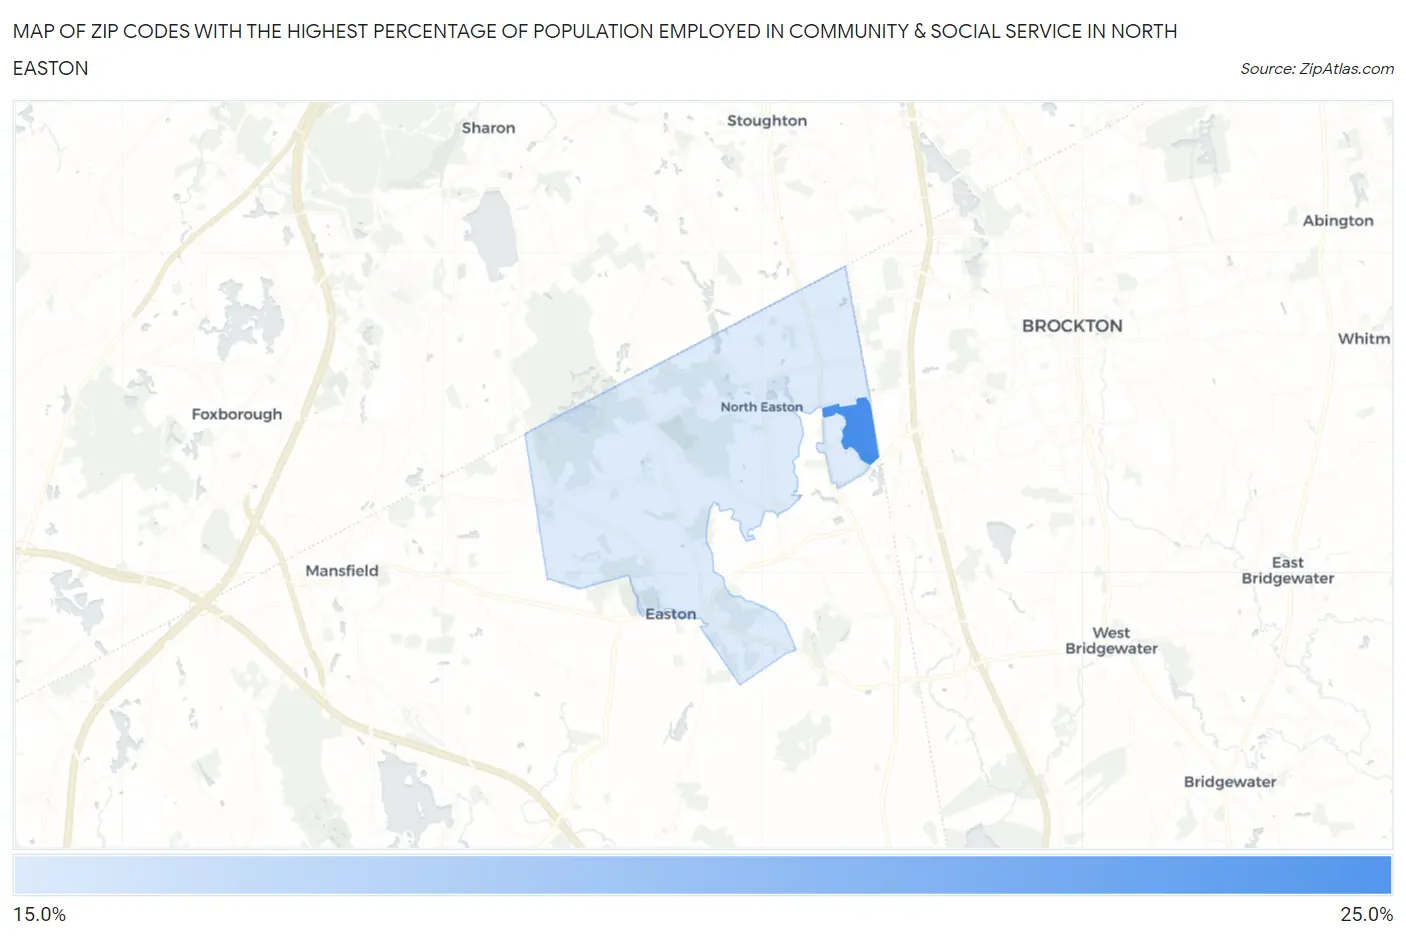
Map of Zip Codes with the Highest Percentage of Population Employed in Community & Social Service in North Easton
17.3%
20.5%
Zip Codes with the Highest Percentage of Population Employed in Community & Social Service in North Easton, MA
| Zip Code | % Employed | vs State | vs National | |
| 1. | 02357 | 20.5% | 13.5%(+7.00)#57 | 11.2%(+9.29)#1,865 |
| 2. | 02356 | 17.3% | 13.5%(+3.82)#124 | 11.2%(+6.12)#3,168 |
1
Common Questions
What are the Top Zip Codes with the Highest Percentage of Population Employed in Community & Social Service in North Easton, MA?
Top Zip Codes with the Highest Percentage of Population Employed in Community & Social Service in North Easton, MA are:
What zip code has the Highest Percentage of Population Employed in Community & Social Service in North Easton, MA?
02357 has the Highest Percentage of Population Employed in Community & Social Service in North Easton, MA with 20.5%.
What is the Percentage of Population Employed in Community & Social Service in Massachusetts?
Percentage of Population Employed in Community & Social Service in Massachusetts is 13.5%.
What is the Percentage of Population Employed in Community & Social Service in the United States?
Percentage of Population Employed in Community & Social Service in the United States is 11.2%.