Zip Codes with the Highest Percentage of Population Employed in Community & Social Service in Lowell, MA

RELATED REPORTS & OPTIONS

Community & Social Service
Population
Families and Households
Female Fertility
Female Fertility (Unmarried)
Race (Community Size)
Race (Percentage)
Ancestry (Community Size)
AfricanAmericanArabArmenianAustrianBelgianBhutaneseBrazilianBritishBurmeseCanadianCape VerdeanCentral AmericanCentral American IndianCherokeeChileanChoctawColombianCubanDanishDominicanDutchEastern EuropeanEcuadorianEgyptianEnglishEuropeanFilipinoFinnishFrenchFrench CanadianGermanGhanaianGreekGuatemalanHaitianHonduranHungarianIndian (Asian)IndonesianIranianIraqiIrishIsraeliItalianJamaicanJapaneseKenyanKoreanLaotianLebaneseLiberianLithuanianMalaysianMexicanMoroccanNative HawaiianNigerianNorthern EuropeanNorwegianPakistaniPanamanianPeruvianPolishPortuguesePuerto RicanRomanianRussianSalvadoranSamoanScandinavianScotch-IrishScottishSierra LeoneanSouth AmericanSouth American IndianSpaniardSpanishSri LankanSubsaharan AfricanSwedishSwissSyrianThaiTrinidadian and TobagonianTurkishUgandanUkrainianVenezuelanVietnameseWelshWest IndianZimbabwean
Ancestry (Percentage)
AfricanAmericanArabArmenianAustrianBelgianBhutaneseBrazilianBritishBurmeseCanadianCape VerdeanCentral AmericanCentral American IndianCherokeeChileanChoctawColombianCubanDanishDominicanDutchEastern EuropeanEcuadorianEgyptianEnglishEuropeanFilipinoFinnishFrenchFrench CanadianGermanGhanaianGreekGuatemalanHaitianHonduranHungarianIndian (Asian)IndonesianIranianIraqiIrishIsraeliItalianJamaicanJapaneseKenyanKoreanLaotianLebaneseLiberianLithuanianMalaysianMexicanMoroccanNative HawaiianNigerianNorthern EuropeanNorwegianPakistaniPanamanianPeruvianPolishPortuguesePuerto RicanRomanianRussianSalvadoranSamoanScandinavianScotch-IrishScottishSierra LeoneanSouth AmericanSouth American IndianSpaniardSpanishSri LankanSubsaharan AfricanSwedishSwissSyrianThaiTrinidadian and TobagonianTurkishUgandanUkrainianVenezuelanVietnameseWelshWest IndianZimbabwean
Immigrant Origin (Total)
Immigrant Origin (Percentage)
Income
Income (Families)
Income (Households)
Poverty
Poverty (Families)
Unemployment
Employment Occupations
Employment Industries
Employer Class
Commute Time
Commute Means
School Enrollment
Education by Degree Field
Occupancy
Finances
Physical Characteristics
Lowell
Compare Zip Codes
Comparison Subject

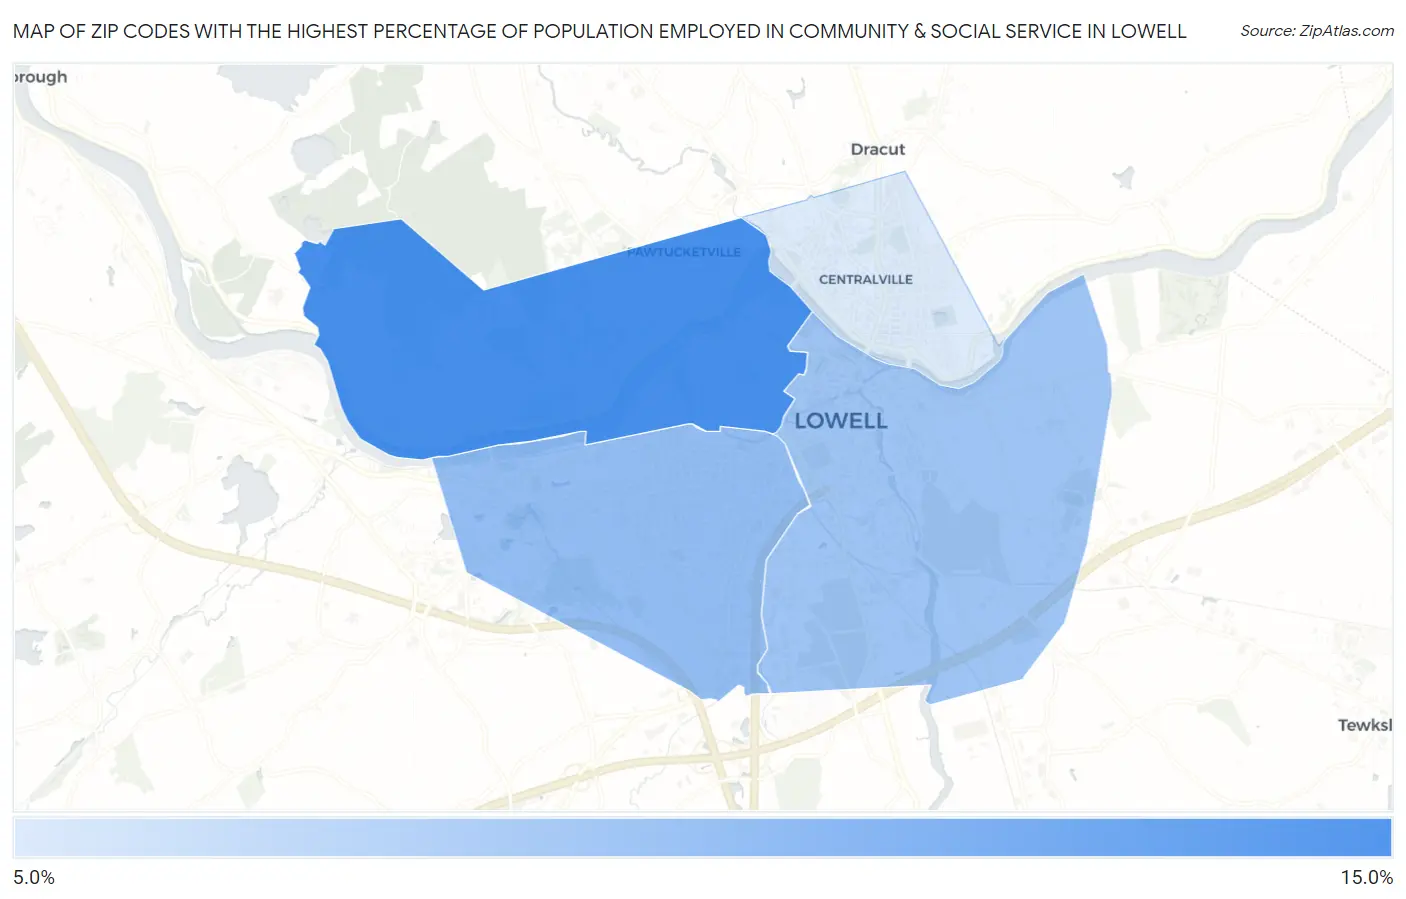
Map of Zip Codes with the Highest Percentage of Population Employed in Community & Social Service in Lowell

0.0%
15.0%
Zip Codes with the Highest Percentage of Population Employed in Community & Social Service  in Lowell Map

Zip Codes with the Highest Percentage of Population Employed in Community & Social Service in Lowell, MA

Zip Code % Employed vs State vs National
1.0185412.0%13.5%(-1.52)#31811.2%(+0.780)#9,389
2.0185111.1%13.5%(-2.45)#35911.2%(-0.156)#11,492
3.0185210.9%13.5%(-2.58)#36411.2%(-0.289)#11,830
4.0185010.2%13.5%(-3.34)#39411.2%(-1.05)#13,696

Common Questions

What are the Top 3 Zip Codes with the Highest Percentage of Population Employed in Community & Social Service in Lowell, MA?
Top 3 Zip Codes with the Highest Percentage of Population Employed in Community & Social Service in Lowell, MA are:
#1
12.0%
#2
11.1%
#3
10.9%
What zip code has the Highest Percentage of Population Employed in Community & Social Service in Lowell, MA?
01854 has the Highest Percentage of Population Employed in Community & Social Service in Lowell, MA with 12.0%.
What is the Percentage of Population Employed in Community & Social Service in Lowell, MA?
Percentage of Population Employed in Community & Social Service in Lowell is 11.1%.
What is the Percentage of Population Employed in Community & Social Service in Massachusetts?
Percentage of Population Employed in Community & Social Service in Massachusetts is 13.5%.
What is the Percentage of Population Employed in Community & Social Service in the United States?
Percentage of Population Employed in Community & Social Service in the United States is 11.2%.