Cities with the Most Immigrants from Philippines in Alabama
RELATED REPORTS & OPTIONS
Philippines
Alabama
Compare Cities
Map of Cities with the Most Immigrants from Philippines in Alabama
0
500
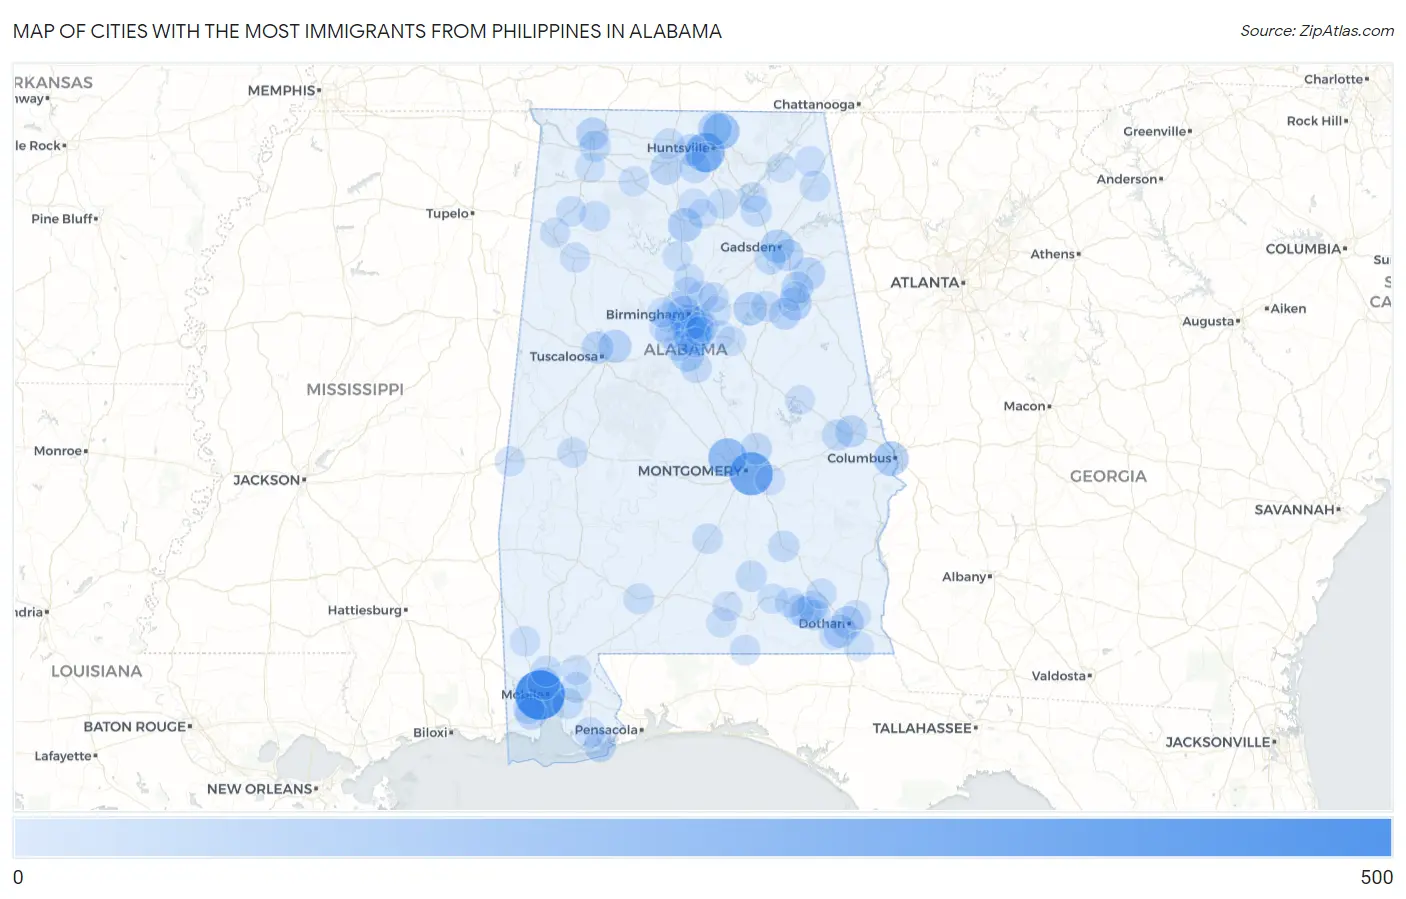
Cities with the Most Immigrants from Philippines in Alabama
| City | Philippines | vs State | vs National | |
| 1. | Mobile | 417 | 5,154(8.09%)#1 | 1,985,710(0.02%)#647 |
| 2. | Montgomery | 276 | 5,154(5.36%)#2 | 1,985,710(0.01%)#891 |
| 3. | Huntsville | 197 | 5,154(3.82%)#3 | 1,985,710(0.01%)#1,178 |
| 4. | Prattville | 177 | 5,154(3.43%)#4 | 1,985,710(0.01%)#1,288 |
| 5. | Hoover | 156 | 5,154(3.03%)#5 | 1,985,710(0.01%)#1,403 |
| 6. | Moores Mill | 131 | 5,154(2.54%)#6 | 1,985,710(0.01%)#1,606 |
| 7. | Homewood | 120 | 5,154(2.33%)#7 | 1,985,710(0.01%)#1,708 |
| 8. | Phenix City | 96 | 5,154(1.86%)#8 | 1,985,710(0.00%)#1,967 |
| 9. | Cullman | 82 | 5,154(1.59%)#9 | 1,985,710(0.00%)#2,177 |
| 10. | Meridianville | 78 | 5,154(1.51%)#10 | 1,985,710(0.00%)#2,257 |
| 11. | Gadsden | 73 | 5,154(1.42%)#11 | 1,985,710(0.00%)#2,332 |
| 12. | Pell City | 72 | 5,154(1.40%)#12 | 1,985,710(0.00%)#2,371 |
| 13. | Vestavia Hills | 71 | 5,154(1.38%)#13 | 1,985,710(0.00%)#2,388 |
| 14. | Taylor | 64 | 5,154(1.24%)#14 | 1,985,710(0.00%)#2,537 |
| 15. | Oxford | 63 | 5,154(1.22%)#15 | 1,985,710(0.00%)#2,547 |
| 16. | Tuscaloosa | 62 | 5,154(1.20%)#16 | 1,985,710(0.00%)#2,562 |
| 17. | Alabaster | 60 | 5,154(1.16%)#17 | 1,985,710(0.00%)#2,606 |
| 18. | Jacksonville | 56 | 5,154(1.09%)#18 | 1,985,710(0.00%)#2,709 |
| 19. | Dothan | 55 | 5,154(1.07%)#19 | 1,985,710(0.00%)#2,721 |
| 20. | Florence | 54 | 5,154(1.05%)#20 | 1,985,710(0.00%)#2,751 |
| 21. | Birmingham | 53 | 5,154(1.03%)#21 | 1,985,710(0.00%)#2,779 |
| 22. | Chickasaw | 53 | 5,154(1.03%)#22 | 1,985,710(0.00%)#2,811 |
| 23. | Northport | 47 | 5,154(0.91%)#23 | 1,985,710(0.00%)#2,969 |
| 24. | Madison | 45 | 5,154(0.87%)#24 | 1,985,710(0.00%)#3,024 |
| 25. | Decatur | 44 | 5,154(0.85%)#25 | 1,985,710(0.00%)#3,060 |
| 26. | Opelika | 43 | 5,154(0.83%)#26 | 1,985,710(0.00%)#3,103 |
| 27. | Level Plains | 43 | 5,154(0.83%)#27 | 1,985,710(0.00%)#3,138 |
| 28. | Munford | 41 | 5,154(0.80%)#28 | 1,985,710(0.00%)#3,226 |
| 29. | Saks | 40 | 5,154(0.78%)#29 | 1,985,710(0.00%)#3,249 |
| 30. | Glencoe | 40 | 5,154(0.78%)#30 | 1,985,710(0.00%)#3,261 |
| 31. | Theodore | 40 | 5,154(0.78%)#31 | 1,985,710(0.00%)#3,262 |
| 32. | Orange Beach | 39 | 5,154(0.76%)#32 | 1,985,710(0.00%)#3,297 |
| 33. | Wetumpka | 35 | 5,154(0.68%)#33 | 1,985,710(0.00%)#3,489 |
| 34. | Troy | 30 | 5,154(0.58%)#34 | 1,985,710(0.00%)#3,727 |
| 35. | Triana | 30 | 5,154(0.58%)#35 | 1,985,710(0.00%)#3,765 |
| 36. | Muscle Shoals | 29 | 5,154(0.56%)#36 | 1,985,710(0.00%)#3,797 |
| 37. | Auburn | 28 | 5,154(0.54%)#37 | 1,985,710(0.00%)#3,840 |
| 38. | Rainbow City | 28 | 5,154(0.54%)#38 | 1,985,710(0.00%)#3,866 |
| 39. | Calera | 26 | 5,154(0.50%)#39 | 1,985,710(0.00%)#3,986 |
| 40. | Brantley | 26 | 5,154(0.50%)#40 | 1,985,710(0.00%)#4,037 |
| 41. | Albertville | 25 | 5,154(0.49%)#41 | 1,985,710(0.00%)#4,043 |
| 42. | Tillmans Corner | 24 | 5,154(0.47%)#42 | 1,985,710(0.00%)#4,109 |
| 43. | Brook Highland | 24 | 5,154(0.47%)#43 | 1,985,710(0.00%)#4,129 |
| 44. | Satsuma | 24 | 5,154(0.47%)#44 | 1,985,710(0.00%)#4,133 |
| 45. | Fort Rucker | 24 | 5,154(0.47%)#45 | 1,985,710(0.00%)#4,135 |
| 46. | Fort Payne | 22 | 5,154(0.43%)#46 | 1,985,710(0.00%)#4,233 |
| 47. | Hueytown | 21 | 5,154(0.41%)#47 | 1,985,710(0.00%)#4,305 |
| 48. | Daphne | 20 | 5,154(0.39%)#48 | 1,985,710(0.00%)#4,373 |
| 49. | Daleville | 20 | 5,154(0.39%)#49 | 1,985,710(0.00%)#4,414 |
| 50. | Stapleton | 19 | 5,154(0.37%)#50 | 1,985,710(0.00%)#4,508 |
| 51. | Enterprise | 17 | 5,154(0.33%)#51 | 1,985,710(0.00%)#4,611 |
| 52. | Center Point | 17 | 5,154(0.33%)#52 | 1,985,710(0.00%)#4,621 |
| 53. | Gardendale | 17 | 5,154(0.33%)#53 | 1,985,710(0.00%)#4,622 |
| 54. | Haleyville | 17 | 5,154(0.33%)#54 | 1,985,710(0.00%)#4,664 |
| 55. | Athens | 16 | 5,154(0.31%)#55 | 1,985,710(0.00%)#4,710 |
| 56. | Repton | 15 | 5,154(0.29%)#56 | 1,985,710(0.00%)#4,903 |
| 57. | Greenville | 14 | 5,154(0.27%)#57 | 1,985,710(0.00%)#4,947 |
| 58. | Guntersville | 13 | 5,154(0.25%)#58 | 1,985,710(0.00%)#5,071 |
| 59. | Lincoln | 13 | 5,154(0.25%)#59 | 1,985,710(0.00%)#5,086 |
| 60. | Foley | 12 | 5,154(0.23%)#60 | 1,985,710(0.00%)#5,169 |
| 61. | Ozark | 12 | 5,154(0.23%)#61 | 1,985,710(0.00%)#5,183 |
| 62. | Arab | 11 | 5,154(0.21%)#62 | 1,985,710(0.00%)#5,338 |
| 63. | Hackleburg | 11 | 5,154(0.21%)#63 | 1,985,710(0.00%)#5,413 |
| 64. | Leeds | 10 | 5,154(0.19%)#64 | 1,985,710(0.00%)#5,468 |
| 65. | Citronelle | 10 | 5,154(0.19%)#65 | 1,985,710(0.00%)#5,518 |
| 66. | Moulton | 10 | 5,154(0.19%)#66 | 1,985,710(0.00%)#5,524 |
| 67. | Florala | 10 | 5,154(0.19%)#67 | 1,985,710(0.00%)#5,558 |
| 68. | Pleasant Grove | 9 | 5,154(0.17%)#68 | 1,985,710(0.00%)#5,626 |
| 69. | Demopolis | 9 | 5,154(0.17%)#69 | 1,985,710(0.00%)#5,640 |
| 70. | Henagar | 9 | 5,154(0.17%)#70 | 1,985,710(0.00%)#5,692 |
| 71. | Redstone Arsenal | 9 | 5,154(0.17%)#71 | 1,985,710(0.00%)#5,740 |
| 72. | Helena | 8 | 5,154(0.16%)#72 | 1,985,710(0.00%)#5,775 |
| 73. | Winfield | 8 | 5,154(0.16%)#73 | 1,985,710(0.00%)#5,826 |
| 74. | Eva | 8 | 5,154(0.16%)#74 | 1,985,710(0.00%)#5,911 |
| 75. | Pike Road | 7 | 5,154(0.14%)#75 | 1,985,710(0.00%)#5,952 |
| 76. | Elba | 7 | 5,154(0.14%)#76 | 1,985,710(0.00%)#5,992 |
| 77. | Hamilton | 6 | 5,154(0.12%)#77 | 1,985,710(0.00%)#6,151 |
| 78. | Kimberly | 6 | 5,154(0.12%)#78 | 1,985,710(0.00%)#6,172 |
| 79. | New Brockton | 6 | 5,154(0.12%)#79 | 1,985,710(0.00%)#6,247 |
| 80. | Colony | 6 | 5,154(0.12%)#80 | 1,985,710(0.00%)#6,303 |
| 81. | Bessemer | 5 | 5,154(0.10%)#81 | 1,985,710(0.00%)#6,319 |
| 82. | Trussville | 5 | 5,154(0.10%)#82 | 1,985,710(0.00%)#6,320 |
| 83. | Forestdale | 5 | 5,154(0.10%)#83 | 1,985,710(0.00%)#6,342 |
| 84. | Cuba | 5 | 5,154(0.10%)#84 | 1,985,710(0.00%)#6,508 |
| 85. | Pelham | 4 | 5,154(0.08%)#85 | 1,985,710(0.00%)#6,525 |
| 86. | Meadowbrook | 3 | 5,154(0.06%)#86 | 1,985,710(0.00%)#6,774 |
| 87. | Westover | 3 | 5,154(0.06%)#87 | 1,985,710(0.00%)#6,823 |
| 88. | Cottonwood | 3 | 5,154(0.06%)#88 | 1,985,710(0.00%)#6,902 |
| 89. | Littleville | 3 | 5,154(0.06%)#89 | 1,985,710(0.00%)#6,940 |
| 90. | Carolina | 3 | 5,154(0.06%)#90 | 1,985,710(0.00%)#7,006 |
| 91. | Heath | 3 | 5,154(0.06%)#91 | 1,985,710(0.00%)#7,009 |
| 92. | Bay Minette | 2 | 5,154(0.04%)#92 | 1,985,710(0.00%)#7,046 |
| 93. | West End Cobb Town | 2 | 5,154(0.04%)#93 | 1,985,710(0.00%)#7,068 |
| 94. | Kinsey | 2 | 5,154(0.04%)#94 | 1,985,710(0.00%)#7,087 |
| 95. | Malvern | 2 | 5,154(0.04%)#95 | 1,985,710(0.00%)#7,102 |
| 96. | Harpersville | 2 | 5,154(0.04%)#96 | 1,985,710(0.00%)#7,123 |
| 97. | Sylvan Springs | 2 | 5,154(0.04%)#97 | 1,985,710(0.00%)#7,135 |
| 98. | Section | 2 | 5,154(0.04%)#98 | 1,985,710(0.00%)#7,184 |
| 99. | Fairview | 2 | 5,154(0.04%)#99 | 1,985,710(0.00%)#7,218 |
| 100. | Jacksons Gap | 2 | 5,154(0.04%)#100 | 1,985,710(0.00%)#7,231 |
Common Questions
What are the Top 10 Cities with the Most Immigrants from Philippines in Alabama?
Top 10 Cities with the Most Immigrants from Philippines in Alabama are:
#1
417
#2
276
#3
197
#4
177
#5
156
#6
131
#7
120
#8
96
#9
82
#10
78
What city has the Most Immigrants from Philippines in Alabama?
Mobile has the Most Immigrants from Philippines in Alabama with 417.
What is the Total Immigrants from Philippines in the State of Alabama?
Total Immigrants from Philippines in Alabama is 5,154.
What is the Total Immigrants from Philippines in the United States?
Total Immigrants from Philippines in the United States is 1,985,710.