Cities with the Most Immigrants from Philippines in Kentucky
RELATED REPORTS & OPTIONS
Philippines
Kentucky
Compare Cities
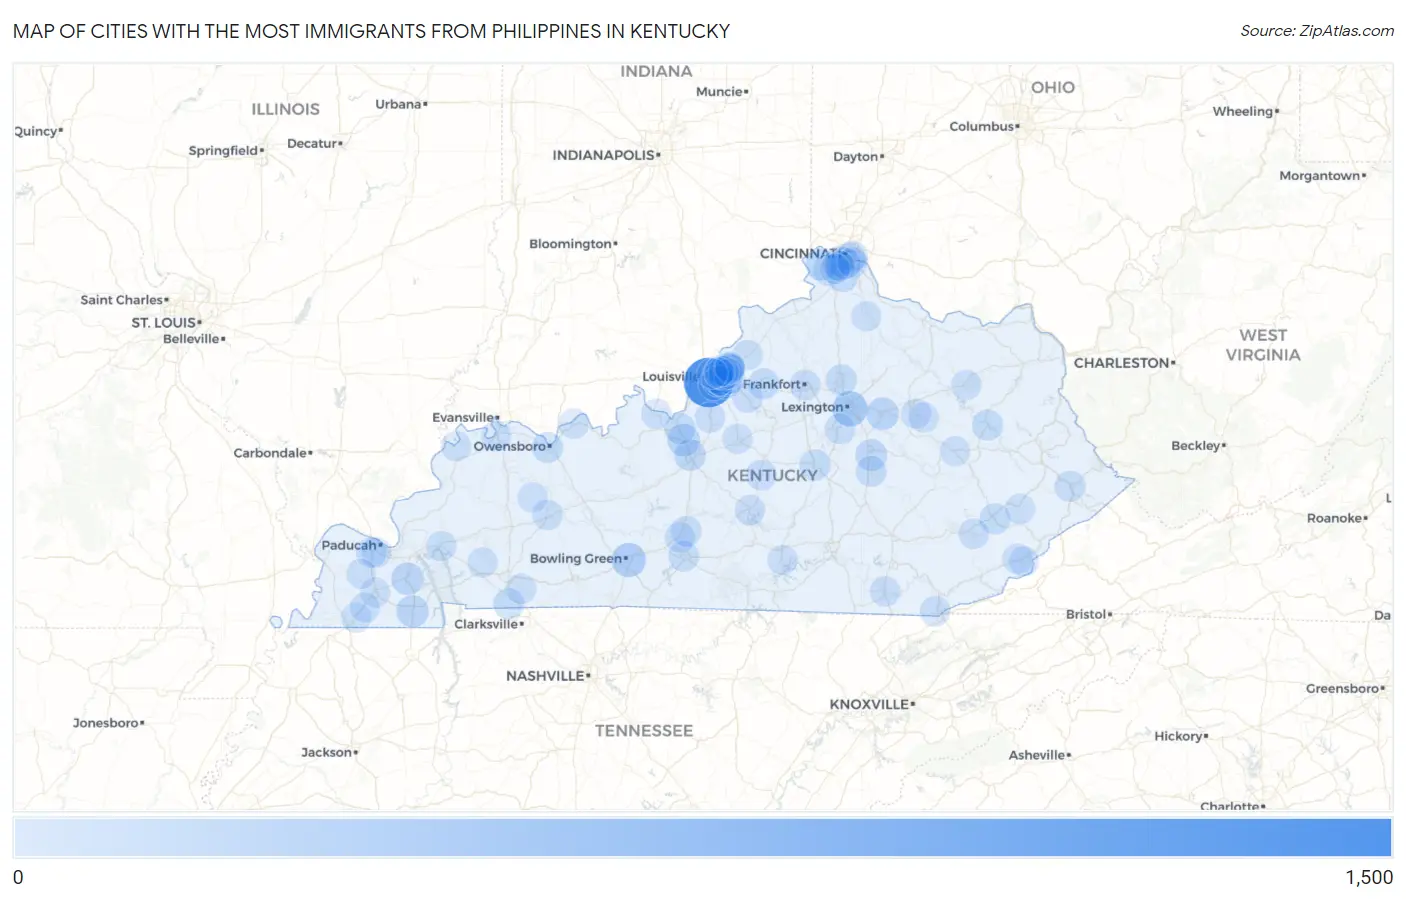
Map of Cities with the Most Immigrants from Philippines in Kentucky
0
1,500
Cities with the Most Immigrants from Philippines in Kentucky
| City | Philippines | vs State | vs National | |
| 1. | Louisville | 1,414 | 6,109(23.15%)#1 | 1,985,710(0.07%)#206 |
| 2. | Lexington | 351 | 6,109(5.75%)#2 | 1,985,710(0.02%)#731 |
| 3. | Bowling Green | 282 | 6,109(4.62%)#3 | 1,985,710(0.01%)#869 |
| 4. | Meadow Vale | 247 | 6,109(4.04%)#4 | 1,985,710(0.01%)#974 |
| 5. | Radcliff | 171 | 6,109(2.80%)#5 | 1,985,710(0.01%)#1,318 |
| 6. | Winchester | 165 | 6,109(2.70%)#6 | 1,985,710(0.01%)#1,350 |
| 7. | Benton | 164 | 6,109(2.68%)#7 | 1,985,710(0.01%)#1,364 |
| 8. | Jeffersontown | 155 | 6,109(2.54%)#8 | 1,985,710(0.01%)#1,414 |
| 9. | Murray | 147 | 6,109(2.41%)#9 | 1,985,710(0.01%)#1,467 |
| 10. | Richmond | 111 | 6,109(1.82%)#10 | 1,985,710(0.01%)#1,781 |
| 11. | St Matthews | 111 | 6,109(1.82%)#11 | 1,985,710(0.01%)#1,786 |
| 12. | Elizabethtown | 108 | 6,109(1.77%)#12 | 1,985,710(0.01%)#1,809 |
| 13. | Florence | 103 | 6,109(1.69%)#13 | 1,985,710(0.01%)#1,870 |
| 14. | Independence | 94 | 6,109(1.54%)#14 | 1,985,710(0.00%)#1,994 |
| 15. | Georgetown | 80 | 6,109(1.31%)#15 | 1,985,710(0.00%)#2,207 |
| 16. | Burlington | 77 | 6,109(1.26%)#16 | 1,985,710(0.00%)#2,269 |
| 17. | Danville | 75 | 6,109(1.23%)#17 | 1,985,710(0.00%)#2,309 |
| 18. | Shelbyville | 72 | 6,109(1.18%)#18 | 1,985,710(0.00%)#2,367 |
| 19. | West Liberty | 72 | 6,109(1.18%)#19 | 1,985,710(0.00%)#2,380 |
| 20. | Covington | 65 | 6,109(1.06%)#20 | 1,985,710(0.00%)#2,494 |
| 21. | Hazard | 64 | 6,109(1.05%)#21 | 1,985,710(0.00%)#2,533 |
| 22. | Fort Campbell North | 63 | 6,109(1.03%)#22 | 1,985,710(0.00%)#2,550 |
| 23. | Fort Knox | 63 | 6,109(1.03%)#23 | 1,985,710(0.00%)#2,553 |
| 24. | Owensboro | 61 | 6,109(1.00%)#24 | 1,985,710(0.00%)#2,587 |
| 25. | Pikeville | 57 | 6,109(0.93%)#25 | 1,985,710(0.00%)#2,694 |
| 26. | Berea | 51 | 6,109(0.83%)#26 | 1,985,710(0.00%)#2,851 |
| 27. | Nicholasville | 40 | 6,109(0.65%)#27 | 1,985,710(0.00%)#3,235 |
| 28. | Glasgow | 40 | 6,109(0.65%)#28 | 1,985,710(0.00%)#3,245 |
| 29. | Southgate | 40 | 6,109(0.65%)#29 | 1,985,710(0.00%)#3,268 |
| 30. | Lebanon | 35 | 6,109(0.57%)#30 | 1,985,710(0.00%)#3,494 |
| 31. | Horse Cave | 35 | 6,109(0.57%)#31 | 1,985,710(0.00%)#3,507 |
| 32. | Fort Thomas | 33 | 6,109(0.54%)#32 | 1,985,710(0.00%)#3,567 |
| 33. | Frankfort | 29 | 6,109(0.47%)#33 | 1,985,710(0.00%)#3,782 |
| 34. | Fort Mitchell | 29 | 6,109(0.47%)#34 | 1,985,710(0.00%)#3,810 |
| 35. | Williamsburg | 29 | 6,109(0.47%)#35 | 1,985,710(0.00%)#3,820 |
| 36. | Central City | 27 | 6,109(0.44%)#36 | 1,985,710(0.00%)#3,947 |
| 37. | Erlanger | 26 | 6,109(0.43%)#37 | 1,985,710(0.00%)#3,983 |
| 38. | Elk Creek | 26 | 6,109(0.43%)#38 | 1,985,710(0.00%)#4,030 |
| 39. | La Grange | 25 | 6,109(0.41%)#39 | 1,985,710(0.00%)#4,056 |
| 40. | Cave City | 25 | 6,109(0.41%)#40 | 1,985,710(0.00%)#4,077 |
| 41. | Campbellsville | 24 | 6,109(0.39%)#41 | 1,985,710(0.00%)#4,118 |
| 42. | Hyden | 24 | 6,109(0.39%)#42 | 1,985,710(0.00%)#4,155 |
| 43. | Middlesborough | 23 | 6,109(0.38%)#43 | 1,985,710(0.00%)#4,177 |
| 44. | Highland Heights | 21 | 6,109(0.34%)#44 | 1,985,710(0.00%)#4,335 |
| 45. | Barbourmeade | 20 | 6,109(0.33%)#45 | 1,985,710(0.00%)#4,437 |
| 46. | Edgewood | 19 | 6,109(0.31%)#46 | 1,985,710(0.00%)#4,476 |
| 47. | Shepherdsville | 16 | 6,109(0.26%)#47 | 1,985,710(0.00%)#4,723 |
| 48. | Fincastle | 16 | 6,109(0.26%)#48 | 1,985,710(0.00%)#4,807 |
| 49. | Hendron | 15 | 6,109(0.25%)#49 | 1,985,710(0.00%)#4,858 |
| 50. | Henderson | 14 | 6,109(0.23%)#50 | 1,985,710(0.00%)#4,910 |
| 51. | West Buechel | 14 | 6,109(0.23%)#51 | 1,985,710(0.00%)#5,000 |
| 52. | Massac | 13 | 6,109(0.21%)#52 | 1,985,710(0.00%)#5,106 |
| 53. | Middletown | 12 | 6,109(0.20%)#53 | 1,985,710(0.00%)#5,198 |
| 54. | Elsmere | 12 | 6,109(0.20%)#54 | 1,985,710(0.00%)#5,200 |
| 55. | Eddyville | 12 | 6,109(0.20%)#55 | 1,985,710(0.00%)#5,252 |
| 56. | Meadowview Estates | 12 | 6,109(0.20%)#56 | 1,985,710(0.00%)#5,301 |
| 57. | Hurstbourne Acres | 10 | 6,109(0.16%)#57 | 1,985,710(0.00%)#5,554 |
| 58. | Bardstown | 9 | 6,109(0.15%)#58 | 1,985,710(0.00%)#5,614 |
| 59. | Brandenburg | 8 | 6,109(0.13%)#59 | 1,985,710(0.00%)#5,847 |
| 60. | Lyndon | 7 | 6,109(0.11%)#60 | 1,985,710(0.00%)#5,945 |
| 61. | Mayfield | 7 | 6,109(0.11%)#61 | 1,985,710(0.00%)#5,949 |
| 62. | Morehead | 7 | 6,109(0.11%)#62 | 1,985,710(0.00%)#5,966 |
| 63. | Pembroke | 7 | 6,109(0.11%)#63 | 1,985,710(0.00%)#6,072 |
| 64. | Lowes | 7 | 6,109(0.11%)#64 | 1,985,710(0.00%)#6,101 |
| 65. | Water Valley | 7 | 6,109(0.11%)#65 | 1,985,710(0.00%)#6,107 |
| 66. | St Regis Park | 6 | 6,109(0.10%)#66 | 1,985,710(0.00%)#6,227 |
| 67. | Cerulean | 6 | 6,109(0.10%)#67 | 1,985,710(0.00%)#6,292 |
| 68. | Graymoor Devondale | 5 | 6,109(0.08%)#68 | 1,985,710(0.00%)#6,384 |
| 69. | Campton | 5 | 6,109(0.08%)#69 | 1,985,710(0.00%)#6,511 |
| 70. | Cumberland | 4 | 6,109(0.07%)#70 | 1,985,710(0.00%)#6,588 |
| 71. | Jamestown | 4 | 6,109(0.07%)#71 | 1,985,710(0.00%)#6,589 |
| 72. | Orchard Grass Hills | 4 | 6,109(0.07%)#72 | 1,985,710(0.00%)#6,602 |
| 73. | Coldstream | 4 | 6,109(0.07%)#73 | 1,985,710(0.00%)#6,634 |
| 74. | Hindman | 4 | 6,109(0.07%)#74 | 1,985,710(0.00%)#6,709 |
| 75. | Benham | 4 | 6,109(0.07%)#75 | 1,985,710(0.00%)#6,714 |
| 76. | Old Brownsboro Place | 4 | 6,109(0.07%)#76 | 1,985,710(0.00%)#6,734 |
| 77. | Anchorage | 3 | 6,109(0.05%)#77 | 1,985,710(0.00%)#6,821 |
| 78. | Worthington Hills | 3 | 6,109(0.05%)#78 | 1,985,710(0.00%)#6,842 |
| 79. | Jeffersonville | 3 | 6,109(0.05%)#79 | 1,985,710(0.00%)#6,858 |
| 80. | Camargo | 3 | 6,109(0.05%)#80 | 1,985,710(0.00%)#6,921 |
| 81. | Wingo | 3 | 6,109(0.05%)#81 | 1,985,710(0.00%)#6,950 |
| 82. | Falmouth | 2 | 6,109(0.03%)#82 | 1,985,710(0.00%)#7,080 |
| 83. | Lewisport | 2 | 6,109(0.03%)#83 | 1,985,710(0.00%)#7,090 |
| 84. | Uniontown | 2 | 6,109(0.03%)#84 | 1,985,710(0.00%)#7,201 |
| 85. | Murray Hill | 2 | 6,109(0.03%)#85 | 1,985,710(0.00%)#7,225 |
| 86. | Sacramento | 1 | 6,109(0.02%)#86 | 1,985,710(0.00%)#7,484 |
| 87. | Crossgate | 1 | 6,109(0.02%)#87 | 1,985,710(0.00%)#7,534 |
| 88. | Mockingbird Valley | 1 | 6,109(0.02%)#88 | 1,985,710(0.00%)#7,543 |
Common Questions
What are the Top 10 Cities with the Most Immigrants from Philippines in Kentucky?
Top 10 Cities with the Most Immigrants from Philippines in Kentucky are:
#1
1,414
#2
351
#3
282
#4
247
#5
171
#6
165
#7
164
#8
155
#9
147
#10
111
What city has the Most Immigrants from Philippines in Kentucky?
Louisville has the Most Immigrants from Philippines in Kentucky with 1,414.
What is the Total Immigrants from Philippines in the State of Kentucky?
Total Immigrants from Philippines in Kentucky is 6,109.
What is the Total Immigrants from Philippines in the United States?
Total Immigrants from Philippines in the United States is 1,985,710.