Zip Codes with the Highest Percentage of Population with a Degree in Psychology in Cleveland, OH

RELATED REPORTS & OPTIONS

Psychology
Population
Families and Households
Female Fertility
Female Fertility (Unmarried)
Race (Community Size)
Race (Percentage)
Ancestry (Community Size)
AfghanAfricanAlbanianAlsatianAmericanApacheArabArgentineanArmenianAustralianAustrianBahamianBangladeshiBarbadianBelgianBelizeanBhutaneseBlackfeetBrazilianBritishBritish West IndianBulgarianBurmeseCajunCambodianCanadianCape VerdeanCarpatho RusynCelticCentral AmericanCentral American IndianCherokeeChickasawChileanChippewaChoctawColombianComancheCosta RicanCreekCroatianCubanCzechCzechoslovakianDanishDelawareDominicanDutchDutch West IndianEastern EuropeanEcuadorianEgyptianEnglishEstonianEthiopianEuropeanFilipinoFinnishFrenchFrench American IndianFrench CanadianGermanGhanaianGreekGuamanian / ChamorroGuatemalanGuyaneseHaitianHonduranHungarianIcelanderIndian (Asian)IndonesianIranianIraqiIrishIroquoisIsraeliItalianJamaicanJapaneseJordanianKoreanLaotianLatvianLebaneseLiberianLithuanianLumbeeLuxembourgerMacedonianMalaysianMexicanMexican American IndianMongolianMoroccanNative HawaiianNavajoNicaraguanNigerianNorthern EuropeanNorwegianPakistaniPalestinianPanamanianParaguayanPennsylvania GermanPeruvianPolishPortuguesePuebloPuerto RicanRomanianRussianSalvadoranSamoanScandinavianScotch-IrishScottishSeminoleSerbianSierra LeoneanSiouxSlavicSlovakSloveneSomaliSouth AfricanSouth AmericanSouth American IndianSpaniardSpanishSri LankanSubsaharan AfricanSudaneseSwedishSwissSyrianThaiTrinidadian and TobagonianTurkishU.S. Virgin IslanderUgandanUkrainianUruguayanVenezuelanVietnameseWelshWest IndianYaquiYugoslavianZimbabwean
Ancestry (Percentage)
AfghanAfricanAlbanianAlsatianAmericanApacheArabArgentineanArmenianAustralianAustrianBahamianBangladeshiBarbadianBelgianBelizeanBhutaneseBlackfeetBrazilianBritishBritish West IndianBulgarianBurmeseCajunCambodianCanadianCape VerdeanCarpatho RusynCelticCentral AmericanCentral American IndianCherokeeChickasawChileanChippewaChoctawColombianComancheCosta RicanCreekCroatianCubanCzechCzechoslovakianDanishDelawareDominicanDutchDutch West IndianEastern EuropeanEcuadorianEgyptianEnglishEstonianEthiopianEuropeanFilipinoFinnishFrenchFrench American IndianFrench CanadianGermanGhanaianGreekGuamanian / ChamorroGuatemalanGuyaneseHaitianHonduranHungarianIcelanderIndian (Asian)IndonesianIranianIraqiIrishIroquoisIsraeliItalianJamaicanJapaneseJordanianKoreanLaotianLatvianLebaneseLiberianLithuanianLumbeeLuxembourgerMacedonianMalaysianMexicanMexican American IndianMongolianMoroccanNative HawaiianNavajoNicaraguanNigerianNorthern EuropeanNorwegianPakistaniPalestinianPanamanianParaguayanPennsylvania GermanPeruvianPolishPortuguesePuebloPuerto RicanRomanianRussianSalvadoranSamoanScandinavianScotch-IrishScottishSeminoleSerbianSierra LeoneanSiouxSlavicSlovakSloveneSomaliSouth AfricanSouth AmericanSouth American IndianSpaniardSpanishSri LankanSubsaharan AfricanSudaneseSwedishSwissSyrianThaiTrinidadian and TobagonianTurkishU.S. Virgin IslanderUgandanUkrainianUruguayanVenezuelanVietnameseWelshWest IndianYaquiYugoslavianZimbabwean
Immigrant Origin (Total)
AfghanistanAfricaAlbaniaArgentinaAsiaAustraliaAustriaBangladeshBarbadosBelarusBelgiumBelizeBosnia and HerzegovinaBrazilBulgariaBurma / MyanmarCambodiaCanadaCaribbeanCentral AmericaChileChinaColombiaCongoCosta RicaCroatiaCubaCzechoslovakiaDominican RepublicEastern AfricaEastern AsiaEastern EuropeEcuadorEgyptEl SalvadorEnglandEthiopiaEuropeFranceGermanyGhanaGreeceGuatemalaGuyanaHaitiHondurasHong KongHungaryIndiaIndonesiaIranIraqIrelandIsraelItalyJamaicaJapanJordanKazakhstanKenyaKoreaKuwaitLaosLatin AmericaLatviaLebanonLiberiaLithuaniaMalaysiaMexicoMiddle AfricaMoldovaMoroccoNepalNetherlandsNicaraguaNigeriaNorthern AfricaNorthern EuropeOceaniaPakistanPanamaPeruPhilippinesPolandRomaniaRussiaSaudi ArabiaScotlandSerbiaSierra LeoneSingaporeSomaliaSouth AfricaSouth AmericaSouth Central AsiaSouth Eastern AsiaSouthern EuropeSpainSri LankaSudanSwedenSyriaTaiwanThailandTrinidad and TobagoTurkeyUgandaUkraineUruguayUzbekistanVenezuelaVietnamWest IndiesWestern AfricaWestern AsiaWestern EuropeZaireZimbabwe
Immigrant Origin (Percentage)
AfghanistanAfricaAlbaniaArgentinaAsiaAustraliaAustriaBangladeshBarbadosBelarusBelgiumBelizeBosnia and HerzegovinaBrazilBulgariaBurma / MyanmarCambodiaCanadaCaribbeanCentral AmericaChileChinaColombiaCongoCosta RicaCroatiaCubaCzechoslovakiaDominican RepublicEastern AfricaEastern AsiaEastern EuropeEcuadorEgyptEl SalvadorEnglandEthiopiaEuropeFranceGermanyGhanaGreeceGuatemalaGuyanaHaitiHondurasHong KongHungaryIndiaIndonesiaIranIraqIrelandIsraelItalyJamaicaJapanJordanKazakhstanKenyaKoreaKuwaitLaosLatin AmericaLatviaLebanonLiberiaLithuaniaMalaysiaMexicoMiddle AfricaMoldovaMoroccoNepalNetherlandsNicaraguaNigeriaNorthern AfricaNorthern EuropeOceaniaPakistanPanamaPeruPhilippinesPolandRomaniaRussiaSaudi ArabiaScotlandSerbiaSierra LeoneSingaporeSomaliaSouth AfricaSouth AmericaSouth Central AsiaSouth Eastern AsiaSouthern EuropeSpainSri LankaSudanSwedenSyriaTaiwanThailandTrinidad and TobagoTurkeyUgandaUkraineUruguayUzbekistanVenezuelaVietnamWest IndiesWestern AfricaWestern AsiaWestern EuropeZaireZimbabwe
Income
Income (Families)
Income (Households)
Poverty
Poverty (Families)
Unemployment
Employment Occupations
Employment Industries
Employer Class
Commute Time
Commute Means
School Enrollment
Education by Degree Field
Occupancy
Finances
Physical Characteristics
Cleveland
Compare Zip Codes
Comparison Subject

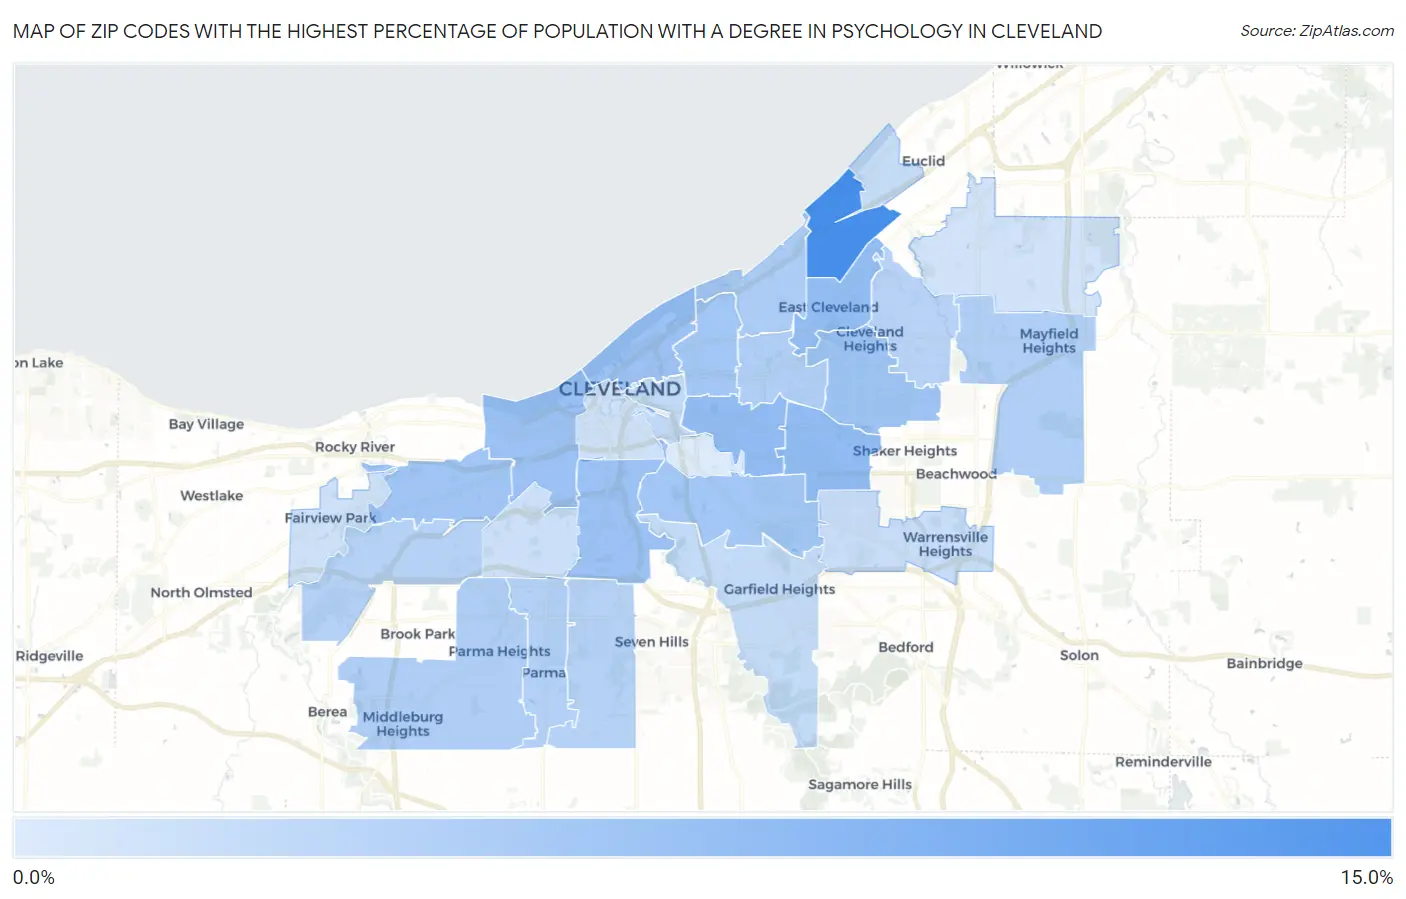
Map of Zip Codes with the Highest Percentage of Population with a Degree in Psychology in Cleveland

0.0%
15.0%
Zip Codes with the Highest Percentage of Population with a Degree in Psychology in Cleveland Map

Zip Codes with the Highest Percentage of Population with a Degree in Psychology in Cleveland, OH

Zip Code % Graduates vs State vs National
1.4411012.4%4.4%(+8.03)#455.1%(+7.39)#1,618
2.441047.3%4.4%(+2.86)#1435.1%(+2.22)#5,171
3.441207.3%4.4%(+2.84)#1455.1%(+2.20)#5,211
4.441127.1%4.4%(+2.74)#1495.1%(+2.10)#5,366
5.441096.6%4.4%(+2.18)#1765.1%(+1.54)#6,455
6.441146.5%4.4%(+2.12)#1815.1%(+1.48)#6,589
7.441026.5%4.4%(+2.11)#1835.1%(+1.47)#6,613
8.441186.3%4.4%(+1.88)#2015.1%(+1.24)#7,152
9.441116.1%4.4%(+1.72)#2105.1%(+1.08)#7,568
10.441036.0%4.4%(+1.63)#2165.1%(+0.986)#7,845
11.441055.9%4.4%(+1.51)#2265.1%(+0.869)#8,197
12.441085.4%4.4%(+0.955)#2785.1%(+0.315)#9,952
13.441305.2%4.4%(+0.823)#2915.1%(+0.183)#10,411
14.441065.1%4.4%(+0.661)#3075.1%(+0.021)#11,000
15.441245.0%4.4%(+0.588)#3195.1%(-0.052)#11,286
16.441294.8%4.4%(+0.436)#3405.1%(-0.204)#11,788
17.441344.8%4.4%(+0.386)#3425.1%(-0.253)#11,956
18.441354.7%4.4%(+0.338)#3515.1%(-0.302)#12,134
19.441214.7%4.4%(+0.261)#3695.1%(-0.379)#12,430
20.441154.0%4.4%(-0.371)#4495.1%(-1.01)#14,781
21.441253.8%4.4%(-0.580)#4745.1%(-1.22)#15,511
22.441193.7%4.4%(-0.692)#4905.1%(-1.33)#15,893
23.441283.5%4.4%(-0.912)#5165.1%(-1.55)#16,698
24.441443.2%4.4%(-1.20)#5635.1%(-1.84)#17,589
25.441133.1%4.4%(-1.32)#5905.1%(-1.96)#17,951
26.441263.0%4.4%(-1.37)#5995.1%(-2.01)#18,107
27.441432.8%4.4%(-1.57)#6315.1%(-2.21)#18,688
28.441272.2%4.4%(-2.26)#7125.1%(-2.90)#20,486

Common Questions

What are the Top 10 Zip Codes with the Highest Percentage of Population with a Degree in Psychology in Cleveland, OH?
Top 10 Zip Codes with the Highest Percentage of Population with a Degree in Psychology in Cleveland, OH are:
#1
12.4%
#2
7.3%
#3
7.3%
#4
7.1%
#5
6.6%
#6
6.5%
#7
6.5%
#8
6.3%
#9
6.1%
#10
6.0%
What zip code has the Highest Percentage of Population with a Degree in Psychology in Cleveland, OH?
44110 has the Highest Percentage of Population with a Degree in Psychology in Cleveland, OH with 12.4%.
What is the Percentage of Population with a Degree in Psychology in Cleveland, OH?
Percentage of Population with a Degree in Psychology in Cleveland is 5.9%.
What is the Percentage of Population with a Degree in Psychology in Ohio?
Percentage of Population with a Degree in Psychology in Ohio is 4.4%.
What is the Percentage of Population with a Degree in Psychology in the United States?
Percentage of Population with a Degree in Psychology in the United States is 5.1%.