Zip Codes with the Highest Percentage of Population with a Degree in Psychology in Canton, OH
RELATED REPORTS & OPTIONS
Psychology
Canton
Compare Zip Codes
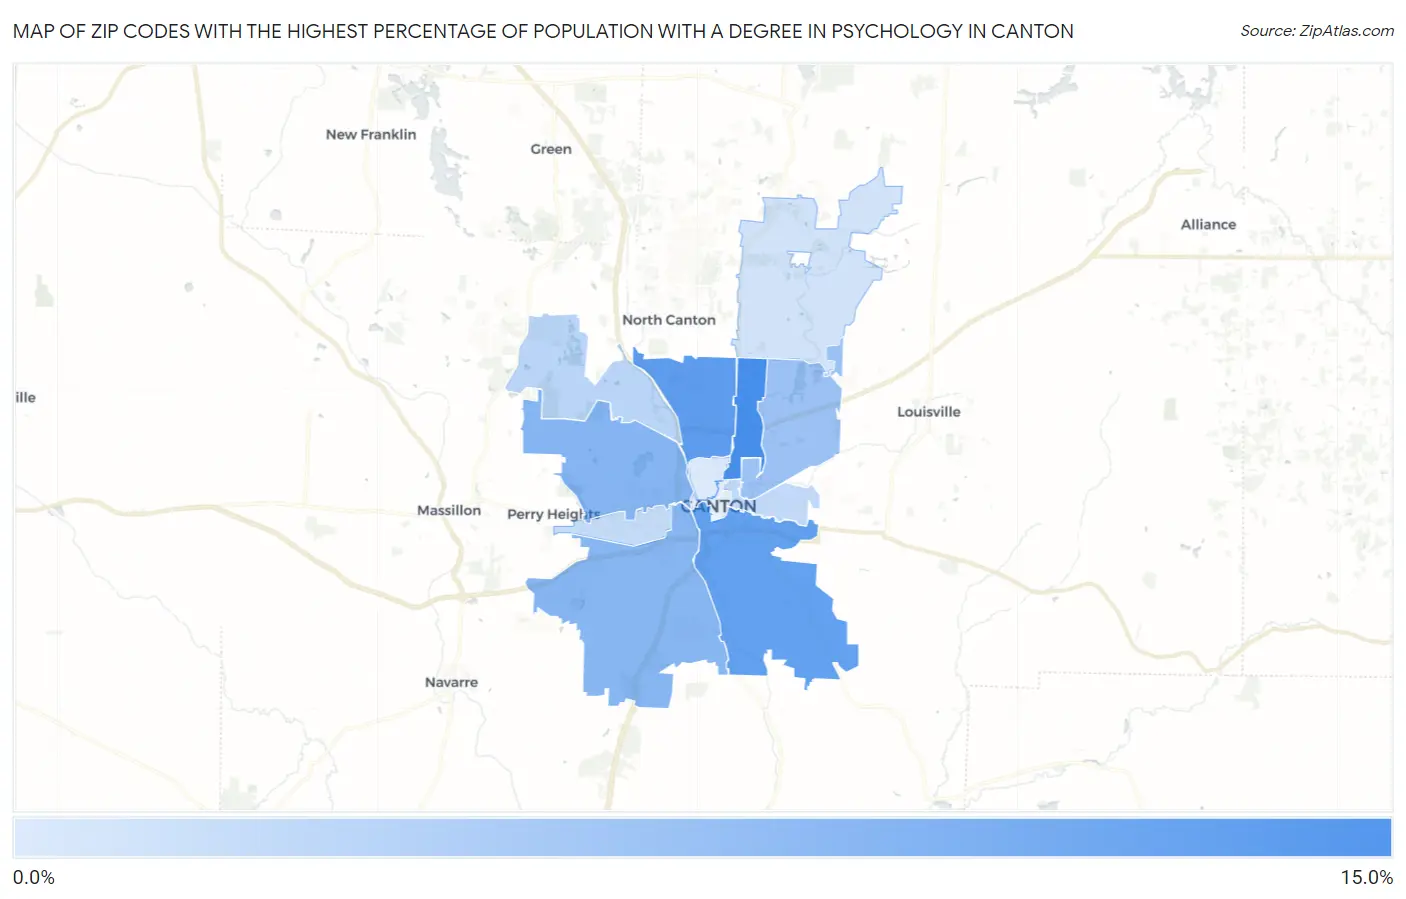
Map of Zip Codes with the Highest Percentage of Population with a Degree in Psychology in Canton
1.9%
10.3%
Zip Codes with the Highest Percentage of Population with a Degree in Psychology in Canton, OH
| Zip Code | % Graduates | vs State | vs National | |
| 1. | 44714 | 10.3% | 4.4%(+5.87)#66 | 5.1%(+5.23)#2,351 |
| 2. | 44709 | 8.9% | 4.4%(+4.51)#85 | 5.1%(+3.87)#3,205 |
| 3. | 44707 | 8.7% | 4.4%(+4.29)#93 | 5.1%(+3.65)#3,393 |
| 4. | 44708 | 6.7% | 4.4%(+2.32)#169 | 5.1%(+1.68)#6,165 |
| 5. | 44706 | 6.6% | 4.4%(+2.18)#177 | 5.1%(+1.54)#6,476 |
| 6. | 44705 | 5.5% | 4.4%(+1.12)#264 | 5.1%(+0.479)#9,421 |
| 7. | 44718 | 3.8% | 4.4%(-0.628)#484 | 5.1%(-1.27)#15,682 |
| 8. | 44704 | 3.4% | 4.4%(-1.02)#530 | 5.1%(-1.66)#17,032 |
| 9. | 44710 | 3.1% | 4.4%(-1.28)#584 | 5.1%(-1.92)#17,858 |
| 10. | 44721 | 2.5% | 4.4%(-1.89)#668 | 5.1%(-2.53)#19,540 |
| 11. | 44703 | 1.9% | 4.4%(-2.54)#745 | 5.1%(-3.18)#21,079 |
1
Common Questions
What are the Top 10 Zip Codes with the Highest Percentage of Population with a Degree in Psychology in Canton, OH?
Top 10 Zip Codes with the Highest Percentage of Population with a Degree in Psychology in Canton, OH are:
What zip code has the Highest Percentage of Population with a Degree in Psychology in Canton, OH?
44714 has the Highest Percentage of Population with a Degree in Psychology in Canton, OH with 10.3%.
What is the Percentage of Population with a Degree in Psychology in Canton, OH?
Percentage of Population with a Degree in Psychology in Canton is 7.0%.
What is the Percentage of Population with a Degree in Psychology in Ohio?
Percentage of Population with a Degree in Psychology in Ohio is 4.4%.
What is the Percentage of Population with a Degree in Psychology in the United States?
Percentage of Population with a Degree in Psychology in the United States is 5.1%.