Bolindale, OH Map & Demographics
Bolindale Map
Bolindale Overview
$26,838
PER CAPITA INCOME
$56,198
AVG FAMILY INCOME
$56,653
AVG HOUSEHOLD INCOME
42.8%
WAGE / INCOME GAP [ % ]
57.2¢/ $1
WAGE / INCOME GAP [ $ ]
0.40
INEQUALITY / GINI INDEX
2,008
TOTAL POPULATION
995
MALE POPULATION
1,013
FEMALE POPULATION
98.22
MALES / 100 FEMALES
101.81
FEMALES / 100 MALES
42.5
MEDIAN AGE
3.0
AVG FAMILY SIZE
2.5
AVG HOUSEHOLD SIZE
840
LABOR FORCE [ PEOPLE ]
50.7%
PERCENT IN LABOR FORCE
1.9%
UNEMPLOYMENT RATE
Income in Bolindale
Income Overview in Bolindale
Per Capita Income in Bolindale is $26,838, while median incomes of families and households are $56,198 and $56,653 respectively.
| Characteristic | Number | Measure |
| Per Capita Income | 2,008 | $26,838 |
| Median Family Income | 509 | $56,198 |
| Mean Family Income | 509 | $59,627 |
| Median Household Income | 793 | $56,653 |
| Mean Household Income | 793 | $63,079 |
| Income Deficit | 509 | $0 |
| Wage / Income Gap (%) | 2,008 | 42.75% |
| Wage / Income Gap ($) | 2,008 | 57.25¢ per $1 |
| Gini / Inequality Index | 2,008 | 0.40 |
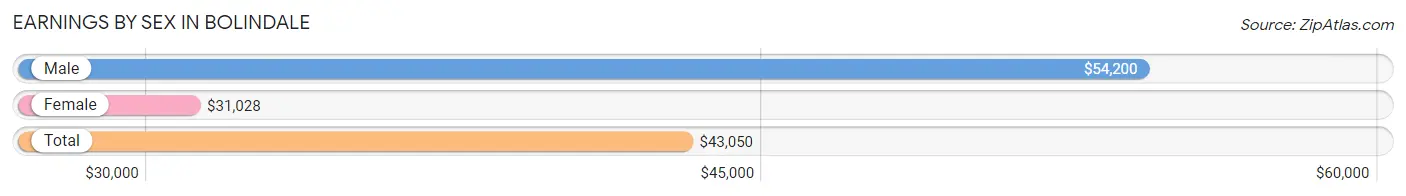
Earnings by Sex in Bolindale
Average Earnings in Bolindale are $43,050, $54,200 for men and $31,028 for women, a difference of 42.7%.
| Sex | Number | Average Earnings |
| Male | 544 (64.1%) | $54,200 |
| Female | 305 (35.9%) | $31,028 |
| Total | 849 (100.0%) | $43,050 |
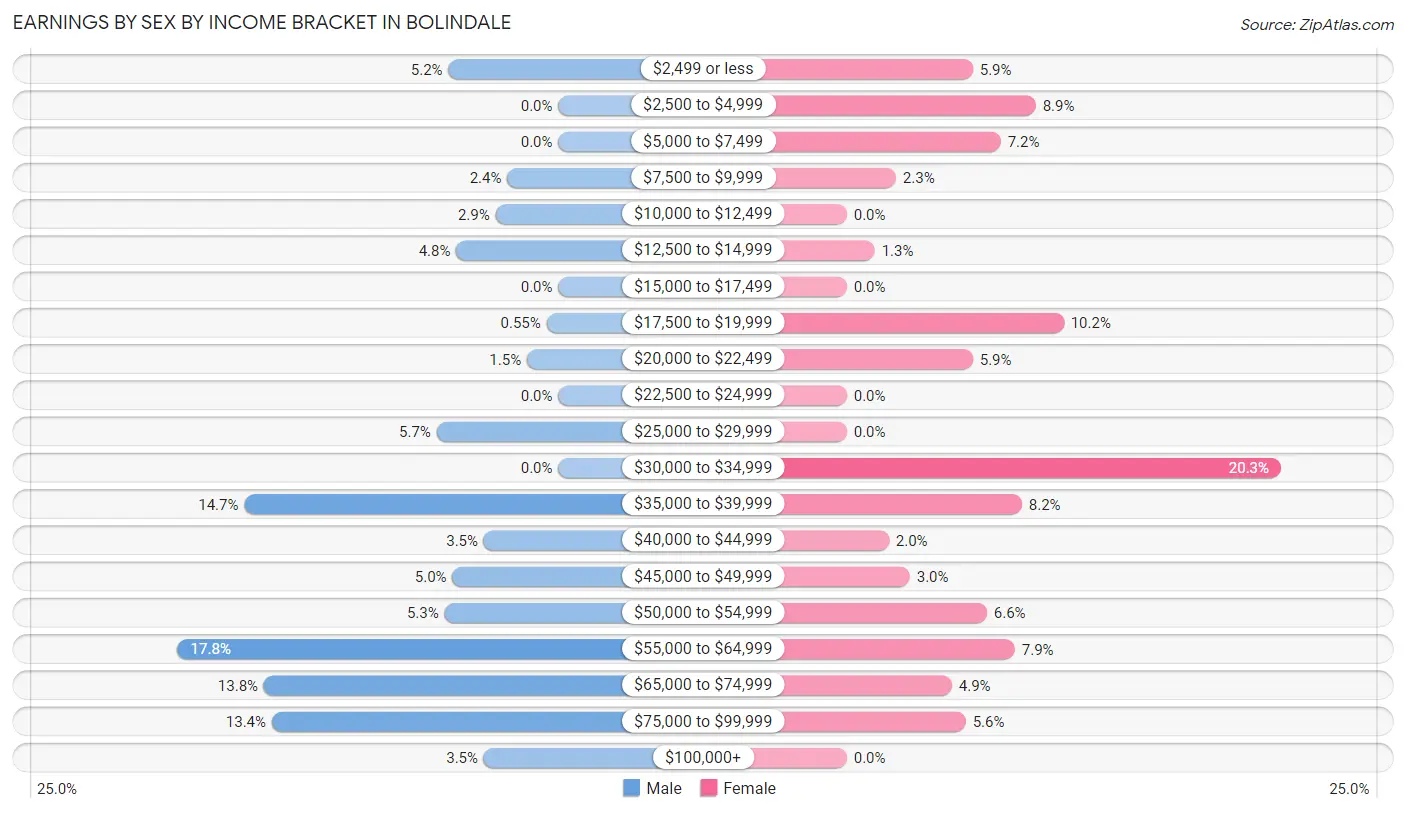
Earnings by Sex by Income Bracket in Bolindale
The most common earnings brackets in Bolindale are $55,000 to $64,999 for men (97 | 17.8%) and $30,000 to $34,999 for women (62 | 20.3%).
| Income | Male | Female |
| $2,499 or less | 28 (5.1%) | 18 (5.9%) |
| $2,500 to $4,999 | 0 (0.0%) | 27 (8.8%) |
| $5,000 to $7,499 | 0 (0.0%) | 22 (7.2%) |
| $7,500 to $9,999 | 13 (2.4%) | 7 (2.3%) |
| $10,000 to $12,499 | 16 (2.9%) | 0 (0.0%) |
| $12,500 to $14,999 | 26 (4.8%) | 4 (1.3%) |
| $15,000 to $17,499 | 0 (0.0%) | 0 (0.0%) |
| $17,500 to $19,999 | 3 (0.5%) | 31 (10.2%) |
| $20,000 to $22,499 | 8 (1.5%) | 18 (5.9%) |
| $22,500 to $24,999 | 0 (0.0%) | 0 (0.0%) |
| $25,000 to $29,999 | 31 (5.7%) | 0 (0.0%) |
| $30,000 to $34,999 | 0 (0.0%) | 62 (20.3%) |
| $35,000 to $39,999 | 80 (14.7%) | 25 (8.2%) |
| $40,000 to $44,999 | 19 (3.5%) | 6 (2.0%) |
| $45,000 to $49,999 | 27 (5.0%) | 9 (2.9%) |
| $50,000 to $54,999 | 29 (5.3%) | 20 (6.6%) |
| $55,000 to $64,999 | 97 (17.8%) | 24 (7.9%) |
| $65,000 to $74,999 | 75 (13.8%) | 15 (4.9%) |
| $75,000 to $99,999 | 73 (13.4%) | 17 (5.6%) |
| $100,000+ | 19 (3.5%) | 0 (0.0%) |
| Total | 544 (100.0%) | 305 (100.0%) |
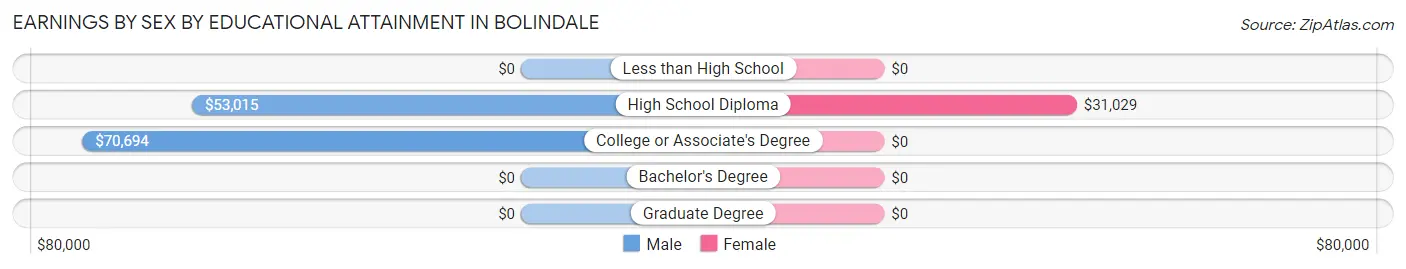
Earnings by Sex by Educational Attainment in Bolindale
Average earnings in Bolindale are $56,552 for men and $31,250 for women, a difference of 44.7%. Men with an educational attainment of college or associate's degree enjoy the highest average annual earnings of $70,694, while those with high school diploma education earn the least with $53,015. Women with an educational attainment of high school diploma earn the most with the average annual earnings of $31,029, while those with high school diploma education have the smallest earnings of $31,029.
| Educational Attainment | Male Income | Female Income |
| Less than High School | - | - |
| High School Diploma | $53,015 | $31,029 |
| College or Associate's Degree | $70,694 | $0 |
| Bachelor's Degree | - | - |
| Graduate Degree | - | - |
| Total | $56,552 | $31,250 |
Family Income in Bolindale
Family Income Brackets in Bolindale
According to the Bolindale family income data, there are 123 families falling into the $50,000 to $74,999 income range, which is the most common income bracket and makes up 24.2% of all families.
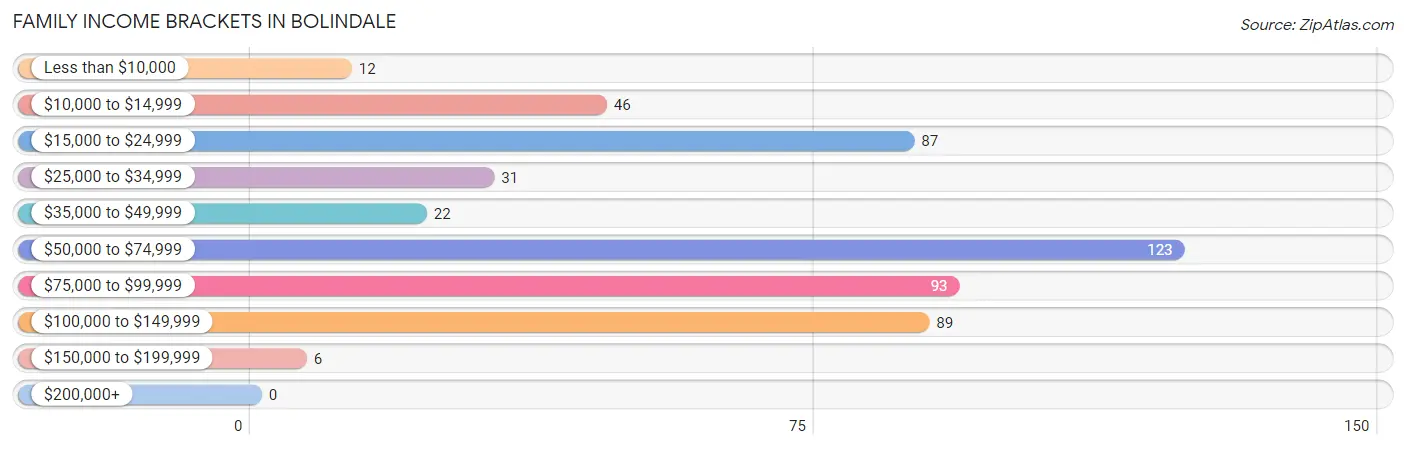
| Income Bracket | # Families | % Families |
| Less than $10,000 | 12 | 2.4% |
| $10,000 to $14,999 | 46 | 9.0% |
| $15,000 to $24,999 | 87 | 17.1% |
| $25,000 to $34,999 | 31 | 6.1% |
| $35,000 to $49,999 | 22 | 4.3% |
| $50,000 to $74,999 | 123 | 24.2% |
| $75,000 to $99,999 | 93 | 18.3% |
| $100,000 to $149,999 | 89 | 17.5% |
| $150,000 to $199,999 | 6 | 1.2% |
| $200,000+ | 0 | 0.0% |
Family Income by Famaliy Size in Bolindale
4-person families (91 | 17.9%) account for the highest median family income in Bolindale with $111,473 per family, while 4-person families (91 | 17.9%) have the highest median income of $27,868 per family member.
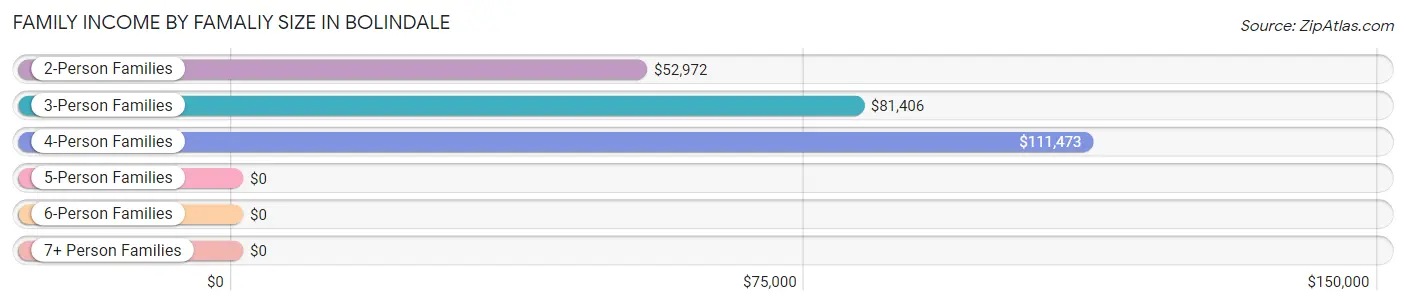
| Income Bracket | # Families | Median Income |
| 2-Person Families | 329 (64.6%) | $52,972 |
| 3-Person Families | 45 (8.8%) | $81,406 |
| 4-Person Families | 91 (17.9%) | $111,473 |
| 5-Person Families | 24 (4.7%) | $0 |
| 6-Person Families | 7 (1.4%) | $0 |
| 7+ Person Families | 13 (2.5%) | $0 |
| Total | 509 (100.0%) | $56,198 |
Family Income by Number of Earners in Bolindale
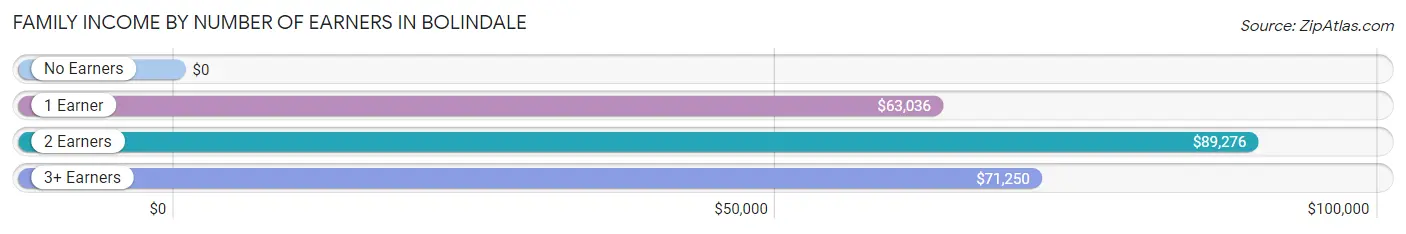
| Number of Earners | # Families | Median Income |
| No Earners | 202 (39.7%) | $0 |
| 1 Earner | 148 (29.1%) | $63,036 |
| 2 Earners | 139 (27.3%) | $89,276 |
| 3+ Earners | 20 (3.9%) | $71,250 |
| Total | 509 (100.0%) | $56,198 |
Household Income in Bolindale
Household Income Brackets in Bolindale
With 242 households falling in the category, the $50,000 to $74,999 income range is the most frequent in Bolindale, accounting for 30.5% of all households. In contrast, only 19 households (2.4%) fall into the less than $10,000 income bracket, making it the least populous group.
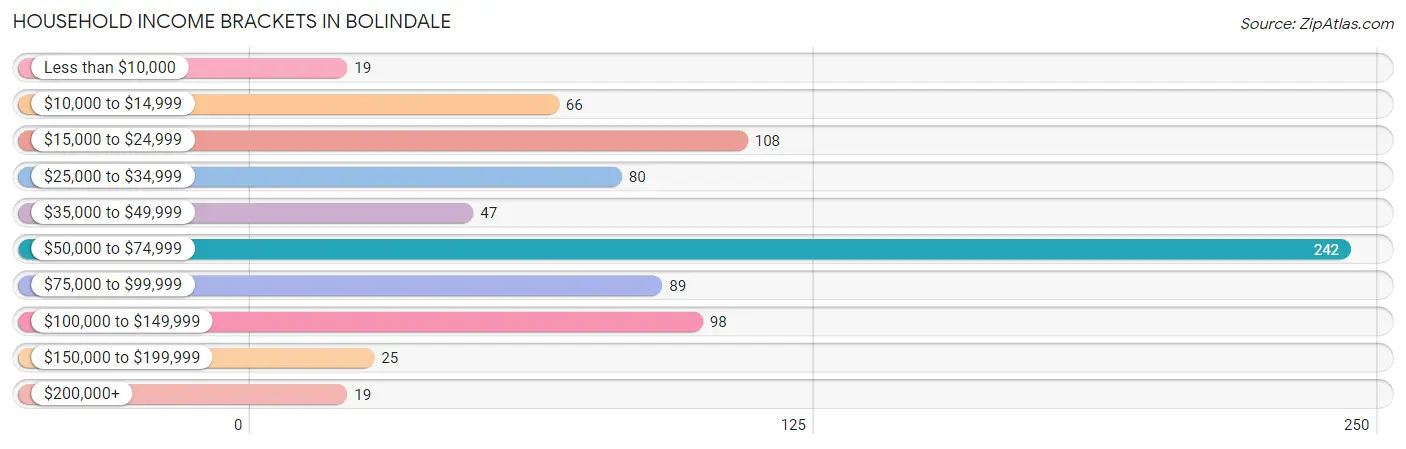
| Income Bracket | # Households | % Households |
| Less than $10,000 | 19 | 2.4% |
| $10,000 to $14,999 | 66 | 8.3% |
| $15,000 to $24,999 | 108 | 13.6% |
| $25,000 to $34,999 | 80 | 10.1% |
| $35,000 to $49,999 | 47 | 5.9% |
| $50,000 to $74,999 | 242 | 30.5% |
| $75,000 to $99,999 | 89 | 11.2% |
| $100,000 to $149,999 | 98 | 12.4% |
| $150,000 to $199,999 | 25 | 3.2% |
| $200,000+ | 19 | 2.4% |
Household Income by Householder Age in Bolindale
The median household income in Bolindale is $56,653, with the highest median household income of $72,500 found in the 45 to 64 years age bracket for the primary householder. A total of 304 households (38.3%) fall into this category. Meanwhile, the 15 to 24 years age bracket for the primary householder has the lowest median household income of $0, with 8 households (1.0%) in this group.
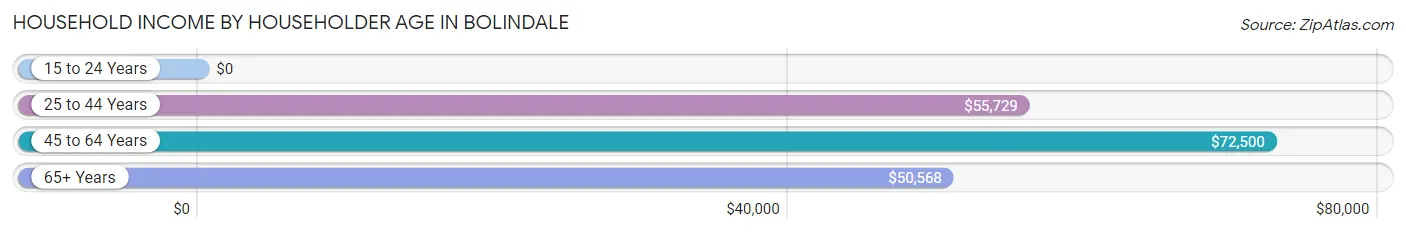
| Income Bracket | # Households | Median Income |
| 15 to 24 Years | 8 (1.0%) | $0 |
| 25 to 44 Years | 222 (28.0%) | $55,729 |
| 45 to 64 Years | 304 (38.3%) | $72,500 |
| 65+ Years | 259 (32.7%) | $50,568 |
| Total | 793 (100.0%) | $56,653 |
Poverty in Bolindale
Income Below Poverty by Sex and Age in Bolindale
With 13.0% poverty level for males and 27.3% for females among the residents of Bolindale, under 5 year old males and 6 to 11 year old females are the most vulnerable to poverty, with 25 males (59.5%) and 90 females (74.4%) in their respective age groups living below the poverty level.
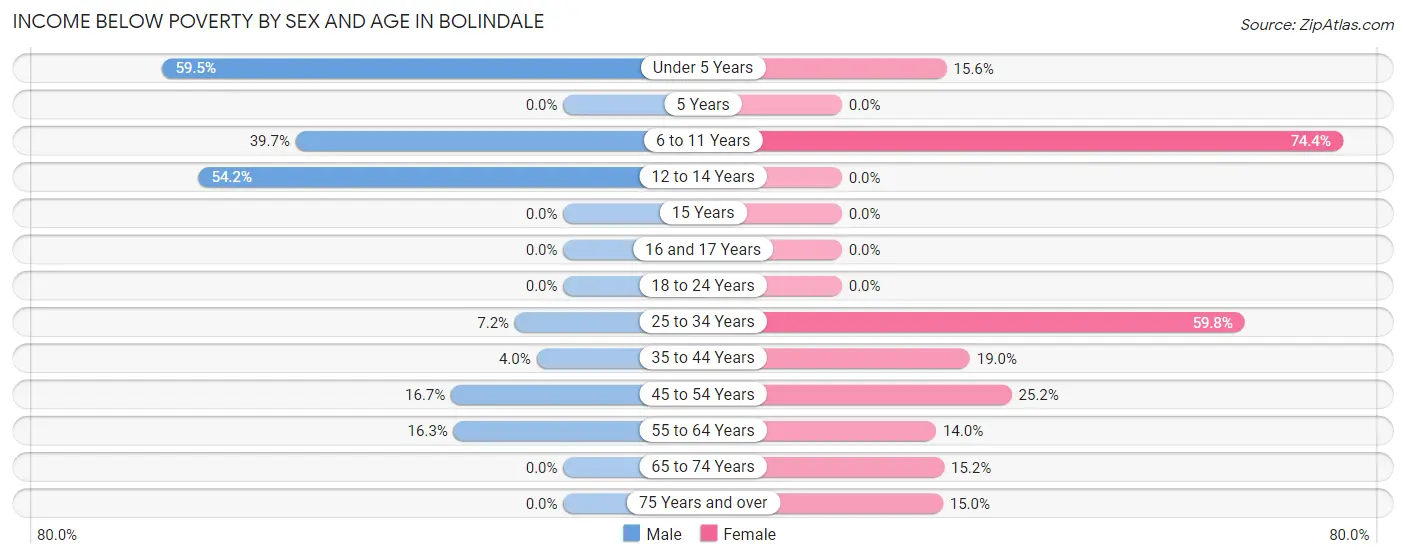
| Age Bracket | Male | Female |
| Under 5 Years | 25 (59.5%) | 7 (15.6%) |
| 5 Years | 0 (0.0%) | 0 (0.0%) |
| 6 to 11 Years | 31 (39.7%) | 90 (74.4%) |
| 12 to 14 Years | 13 (54.2%) | 0 (0.0%) |
| 15 Years | 0 (0.0%) | 0 (0.0%) |
| 16 and 17 Years | 0 (0.0%) | 0 (0.0%) |
| 18 to 24 Years | 0 (0.0%) | 0 (0.0%) |
| 25 to 34 Years | 11 (7.2%) | 70 (59.8%) |
| 35 to 44 Years | 7 (4.0%) | 23 (19.0%) |
| 45 to 54 Years | 13 (16.7%) | 29 (25.2%) |
| 55 to 64 Years | 29 (16.3%) | 20 (14.0%) |
| 65 to 74 Years | 0 (0.0%) | 29 (15.2%) |
| 75 Years and over | 0 (0.0%) | 9 (15.0%) |
| Total | 129 (13.0%) | 277 (27.3%) |
Income Above Poverty by Sex and Age in Bolindale
According to the poverty statistics in Bolindale, males aged 16 and 17 years and females aged 12 to 14 years are the age groups that are most secure financially, with 100.0% of males and 100.0% of females in these age groups living above the poverty line.
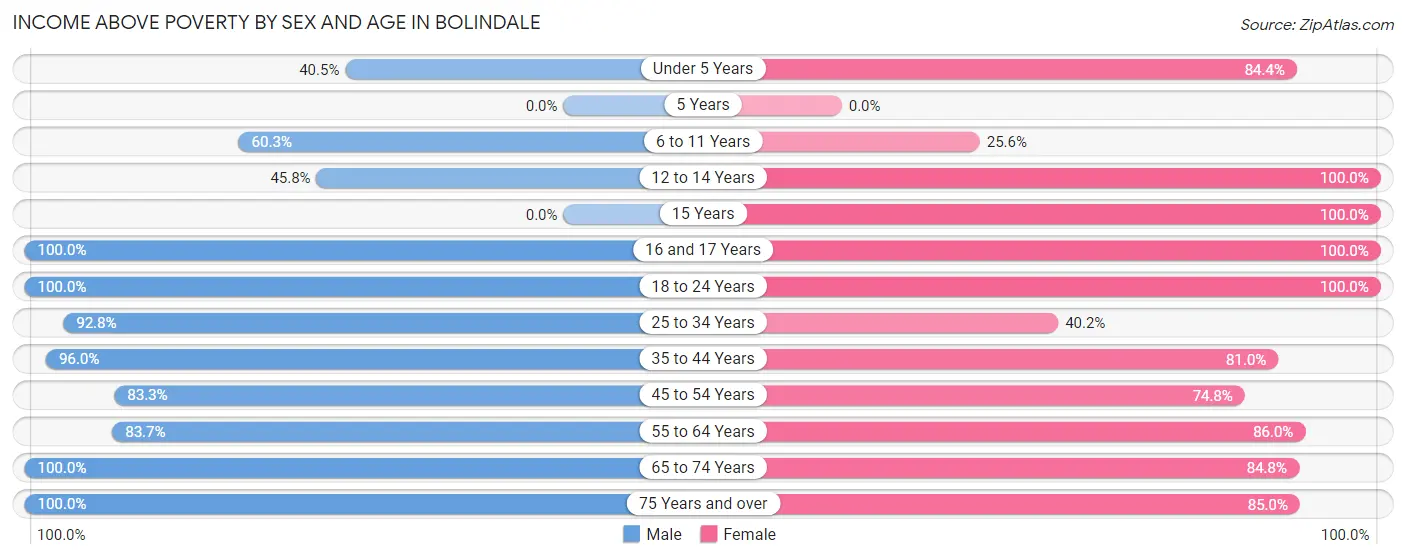
| Age Bracket | Male | Female |
| Under 5 Years | 17 (40.5%) | 38 (84.4%) |
| 5 Years | 0 (0.0%) | 0 (0.0%) |
| 6 to 11 Years | 47 (60.3%) | 31 (25.6%) |
| 12 to 14 Years | 11 (45.8%) | 30 (100.0%) |
| 15 Years | 0 (0.0%) | 11 (100.0%) |
| 16 and 17 Years | 35 (100.0%) | 11 (100.0%) |
| 18 to 24 Years | 36 (100.0%) | 48 (100.0%) |
| 25 to 34 Years | 142 (92.8%) | 47 (40.2%) |
| 35 to 44 Years | 169 (96.0%) | 98 (81.0%) |
| 45 to 54 Years | 65 (83.3%) | 86 (74.8%) |
| 55 to 64 Years | 149 (83.7%) | 123 (86.0%) |
| 65 to 74 Years | 157 (100.0%) | 162 (84.8%) |
| 75 Years and over | 38 (100.0%) | 51 (85.0%) |
| Total | 866 (87.0%) | 736 (72.7%) |
Income Below Poverty Among Married-Couple Families in Bolindale
The poverty statistics for married-couple families in Bolindale show that 12.3% or 37 of the total 301 families live below the poverty line. Families with no children have the highest poverty rate of 13.0%, comprising of 29 families. On the other hand, families with 3 or 4 children have the lowest poverty rate of 0.0%, which includes 0 families.
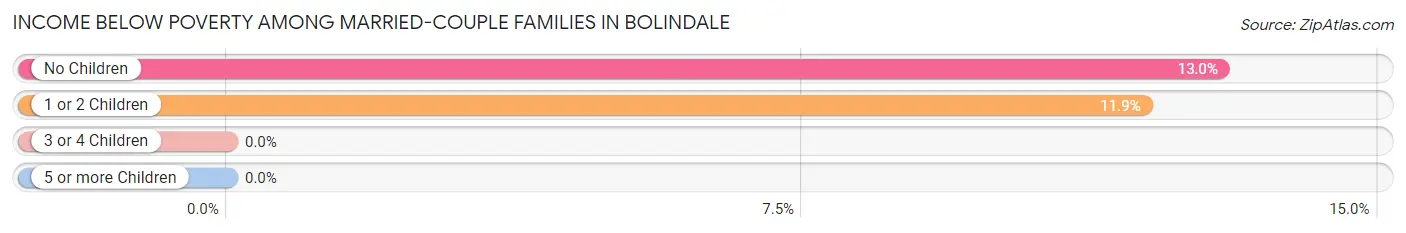
| Children | Above Poverty | Below Poverty |
| No Children | 195 (87.1%) | 29 (13.0%) |
| 1 or 2 Children | 59 (88.1%) | 8 (11.9%) |
| 3 or 4 Children | 10 (100.0%) | 0 (0.0%) |
| 5 or more Children | 0 (0.0%) | 0 (0.0%) |
| Total | 264 (87.7%) | 37 (12.3%) |
Income Below Poverty Among Single-Parent Households in Bolindale
According to the poverty data in Bolindale, 31.7% or 13 single-father households and 50.9% or 85 single-mother households are living below the poverty line. Among single-father households, those with 1 or 2 children have the highest poverty rate, with 13 households (100.0%) experiencing poverty. Likewise, among single-mother households, those with 1 or 2 children have the highest poverty rate, with 73 households (84.9%) falling below the poverty line.
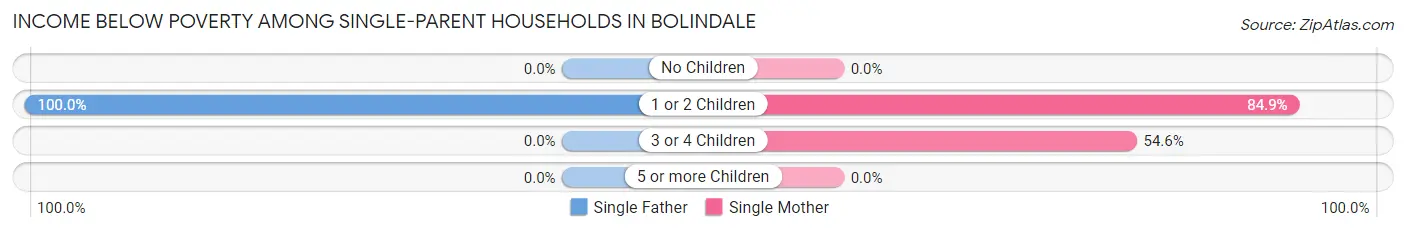
| Children | Single Father | Single Mother |
| No Children | 0 (0.0%) | 0 (0.0%) |
| 1 or 2 Children | 13 (100.0%) | 73 (84.9%) |
| 3 or 4 Children | 0 (0.0%) | 12 (54.5%) |
| 5 or more Children | 0 (0.0%) | 0 (0.0%) |
| Total | 13 (31.7%) | 85 (50.9%) |
Income Below Poverty Among Married-Couple vs Single-Parent Households in Bolindale
The poverty data for Bolindale shows that 37 of the married-couple family households (12.3%) and 98 of the single-parent households (47.1%) are living below the poverty level. Within the married-couple family households, those with no children have the highest poverty rate, with 29 households (13.0%) falling below the poverty line. Among the single-parent households, those with 1 or 2 children have the highest poverty rate, with 86 household (86.9%) living below poverty.
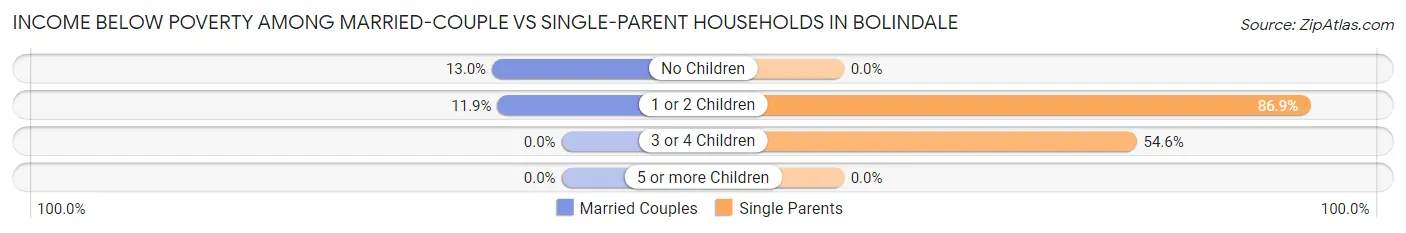
| Children | Married-Couple Families | Single-Parent Households |
| No Children | 29 (13.0%) | 0 (0.0%) |
| 1 or 2 Children | 8 (11.9%) | 86 (86.9%) |
| 3 or 4 Children | 0 (0.0%) | 12 (54.5%) |
| 5 or more Children | 0 (0.0%) | 0 (0.0%) |
| Total | 37 (12.3%) | 98 (47.1%) |
Race in Bolindale
The most populous races in Bolindale are White / Caucasian (1,838 | 91.5%), Black / African American (112 | 5.6%), and Two or more Races (58 | 2.9%).
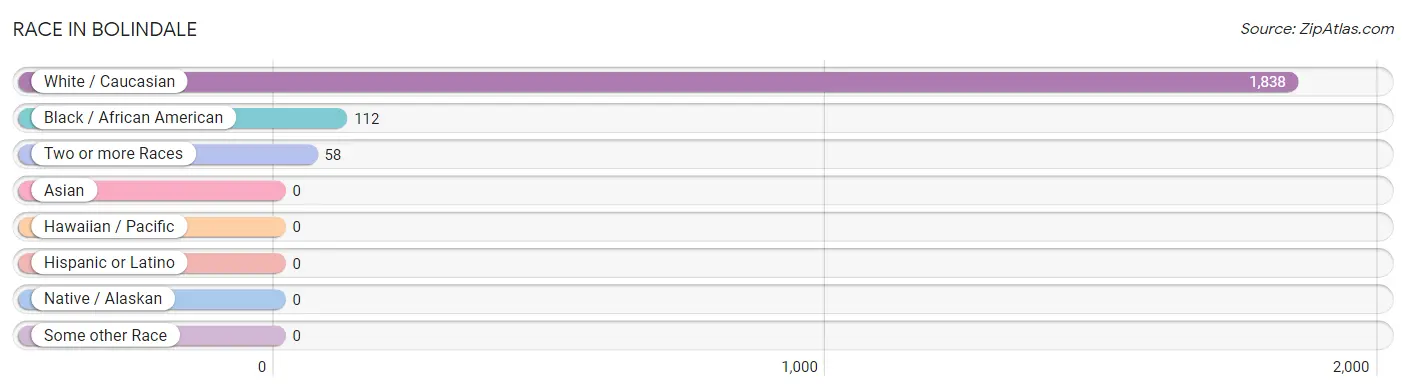
| Race | # Population | % Population |
| Asian | 0 | 0.0% |
| Black / African American | 112 | 5.6% |
| Hawaiian / Pacific | 0 | 0.0% |
| Hispanic or Latino | 0 | 0.0% |
| Native / Alaskan | 0 | 0.0% |
| White / Caucasian | 1,838 | 91.5% |
| Two or more Races | 58 | 2.9% |
| Some other Race | 0 | 0.0% |
| Total | 2,008 | 100.0% |
Ancestry in Bolindale
The most populous ancestries reported in Bolindale are German (454 | 22.6%), American (358 | 17.8%), English (305 | 15.2%), Irish (153 | 7.6%), and Italian (146 | 7.3%), together accounting for 70.5% of all Bolindale residents.
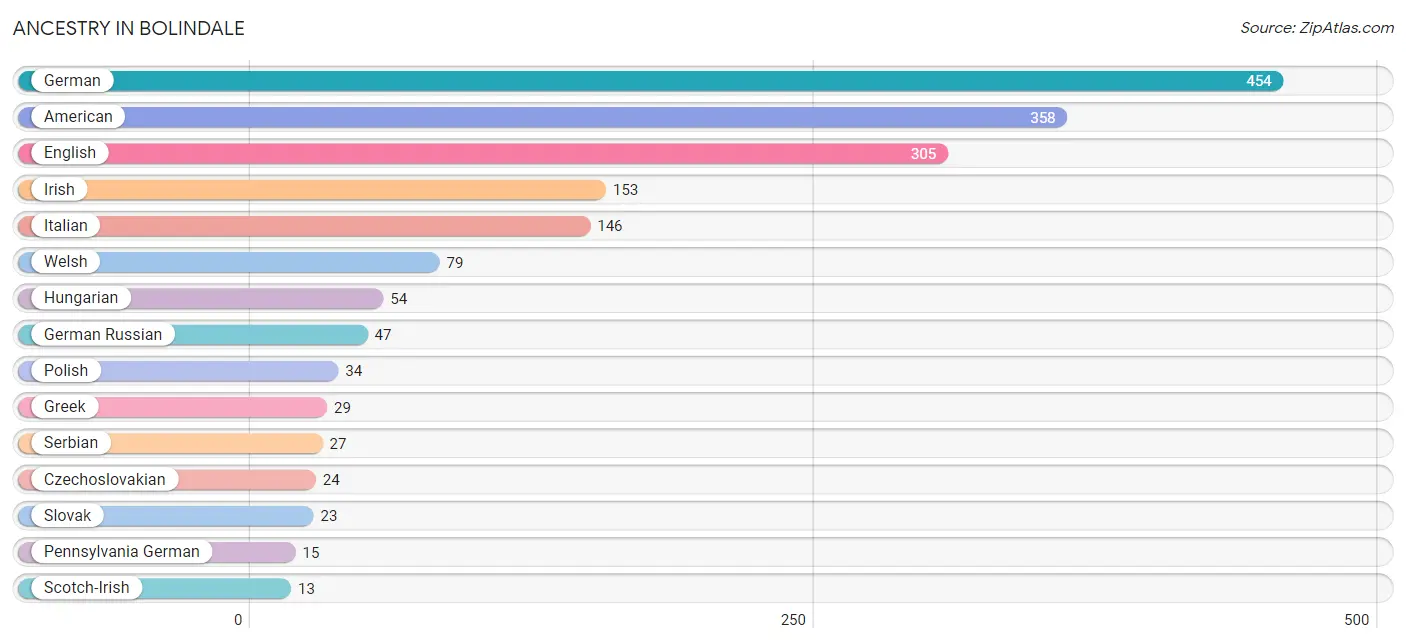
| Ancestry | # Population | % Population |
| American | 358 | 17.8% |
| Blackfeet | 1 | 0.1% |
| Croatian | 8 | 0.4% |
| Czech | 4 | 0.2% |
| Czechoslovakian | 24 | 1.2% |
| English | 305 | 15.2% |
| European | 8 | 0.4% |
| Finnish | 10 | 0.5% |
| German | 454 | 22.6% |
| German Russian | 47 | 2.3% |
| Greek | 29 | 1.4% |
| Hungarian | 54 | 2.7% |
| Irish | 153 | 7.6% |
| Italian | 146 | 7.3% |
| Pennsylvania German | 15 | 0.7% |
| Polish | 34 | 1.7% |
| Portuguese | 3 | 0.2% |
| Romanian | 8 | 0.4% |
| Scotch-Irish | 13 | 0.6% |
| Serbian | 27 | 1.3% |
| Slavic | 4 | 0.2% |
| Slovak | 23 | 1.1% |
| Ukrainian | 3 | 0.2% |
| Welsh | 79 | 3.9% |
| Yugoslavian | 4 | 0.2% | View All 25 Rows |
Immigrants in Bolindale
The most numerous immigrant groups reported in Bolindale came from Europe (31 | 1.5%), Southern Europe (31 | 1.5%), Italy (17 | 0.9%), Greece (14 | 0.7%), and Canada (7 | 0.4%), together accounting for 5.0% of all Bolindale residents.
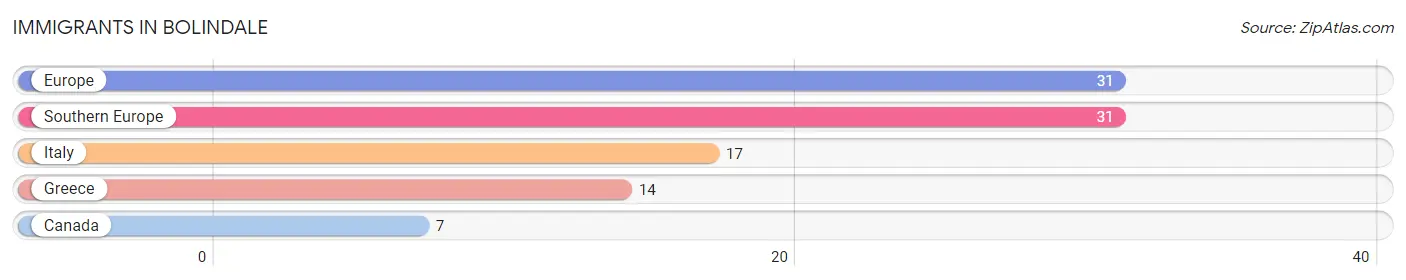
| Immigration Origin | # Population | % Population |
| Canada | 7 | 0.4% |
| Europe | 31 | 1.5% |
| Greece | 14 | 0.7% |
| Italy | 17 | 0.9% |
| Southern Europe | 31 | 1.5% | View All 5 Rows |
Sex and Age in Bolindale
Sex and Age in Bolindale
The most populous age groups in Bolindale are 35 to 39 Years (157 | 15.8%) for men and 65 to 69 Years (140 | 13.8%) for women.
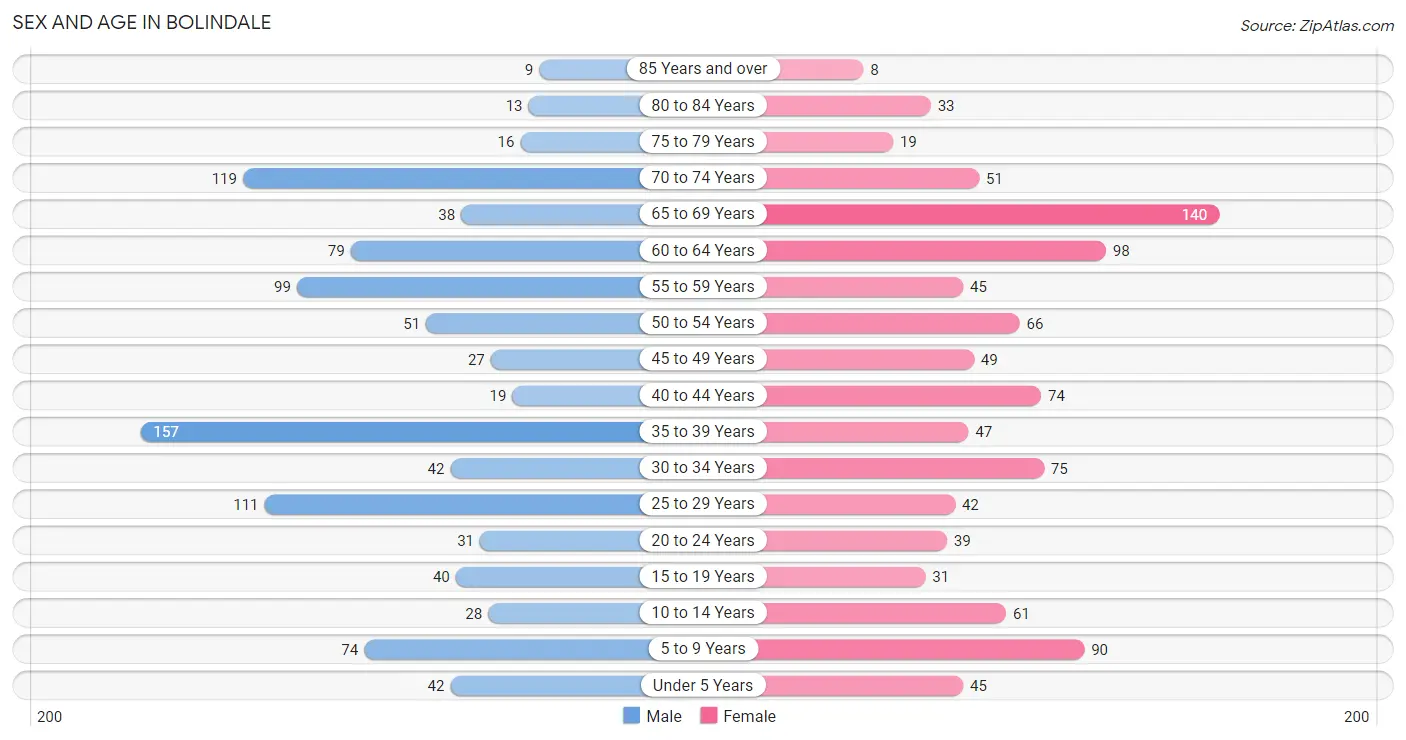
| Age Bracket | Male | Female |
| Under 5 Years | 42 (4.2%) | 45 (4.4%) |
| 5 to 9 Years | 74 (7.4%) | 90 (8.9%) |
| 10 to 14 Years | 28 (2.8%) | 61 (6.0%) |
| 15 to 19 Years | 40 (4.0%) | 31 (3.1%) |
| 20 to 24 Years | 31 (3.1%) | 39 (3.8%) |
| 25 to 29 Years | 111 (11.2%) | 42 (4.2%) |
| 30 to 34 Years | 42 (4.2%) | 75 (7.4%) |
| 35 to 39 Years | 157 (15.8%) | 47 (4.6%) |
| 40 to 44 Years | 19 (1.9%) | 74 (7.3%) |
| 45 to 49 Years | 27 (2.7%) | 49 (4.8%) |
| 50 to 54 Years | 51 (5.1%) | 66 (6.5%) |
| 55 to 59 Years | 99 (10.0%) | 45 (4.4%) |
| 60 to 64 Years | 79 (7.9%) | 98 (9.7%) |
| 65 to 69 Years | 38 (3.8%) | 140 (13.8%) |
| 70 to 74 Years | 119 (12.0%) | 51 (5.0%) |
| 75 to 79 Years | 16 (1.6%) | 19 (1.9%) |
| 80 to 84 Years | 13 (1.3%) | 33 (3.3%) |
| 85 Years and over | 9 (0.9%) | 8 (0.8%) |
| Total | 995 (100.0%) | 1,013 (100.0%) |
Families and Households in Bolindale
Median Family Size in Bolindale
The median family size in Bolindale is 3.03 persons per family, with single female/mother families (167 | 32.8%) accounting for the largest median family size of 3.65 persons per family. On the other hand, single male/father families (41 | 8.1%) represent the smallest median family size with 2.15 persons per family.
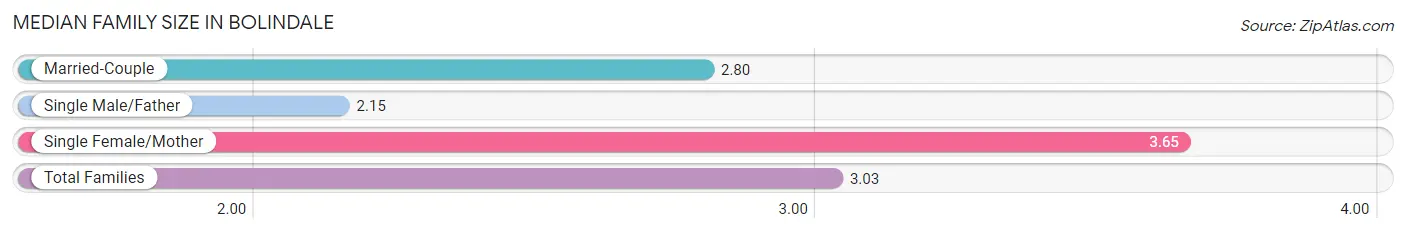
| Family Type | # Families | Family Size |
| Married-Couple | 301 (59.1%) | 2.80 |
| Single Male/Father | 41 (8.1%) | 2.15 |
| Single Female/Mother | 167 (32.8%) | 3.65 |
| Total Families | 509 (100.0%) | 3.03 |
Median Household Size in Bolindale
The median household size in Bolindale is 2.53 persons per household, with single female/mother households (167 | 21.1%) accounting for the largest median household size of 4.04 persons per household. non-family households (284 | 35.8%) represent the smallest median household size with 1.28 persons per household.
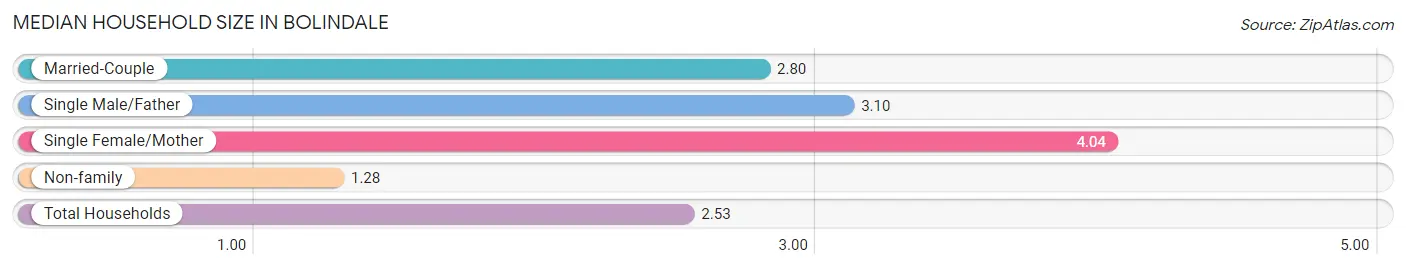
| Household Type | # Households | Household Size |
| Married-Couple | 301 (38.0%) | 2.80 |
| Single Male/Father | 41 (5.2%) | 3.10 |
| Single Female/Mother | 167 (21.1%) | 4.04 |
| Non-family | 284 (35.8%) | 1.28 |
| Total Households | 793 (100.0%) | 2.53 |
Household Size by Marriage Status in Bolindale
Out of a total of 793 households in Bolindale, 509 (64.2%) are family households, while 284 (35.8%) are nonfamily households. The most numerous type of family households are 2-person households, comprising 298, and the most common type of nonfamily households are 1-person households, comprising 208.
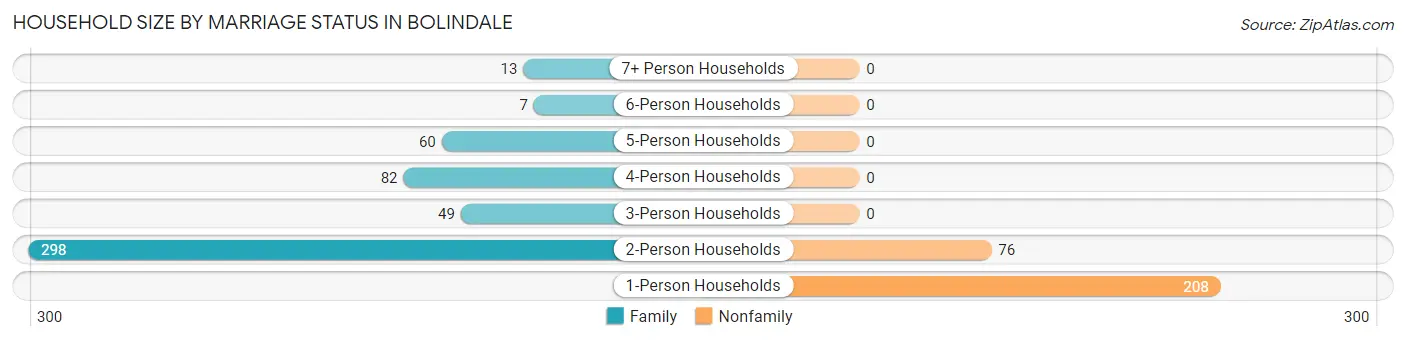
| Household Size | Family Households | Nonfamily Households |
| 1-Person Households | - | 208 (26.2%) |
| 2-Person Households | 298 (37.6%) | 76 (9.6%) |
| 3-Person Households | 49 (6.2%) | 0 (0.0%) |
| 4-Person Households | 82 (10.3%) | 0 (0.0%) |
| 5-Person Households | 60 (7.6%) | 0 (0.0%) |
| 6-Person Households | 7 (0.9%) | 0 (0.0%) |
| 7+ Person Households | 13 (1.6%) | 0 (0.0%) |
| Total | 509 (64.2%) | 284 (35.8%) |
Female Fertility in Bolindale
Fertility by Age in Bolindale
Average fertility rate in Bolindale is 118.0 births per 1,000 women. Women in the age bracket of 20 to 34 years have the highest fertility rate with 269.0 births per 1,000 women. Women in the age bracket of 20 to 34 years acount for 91.3% of all women with births.
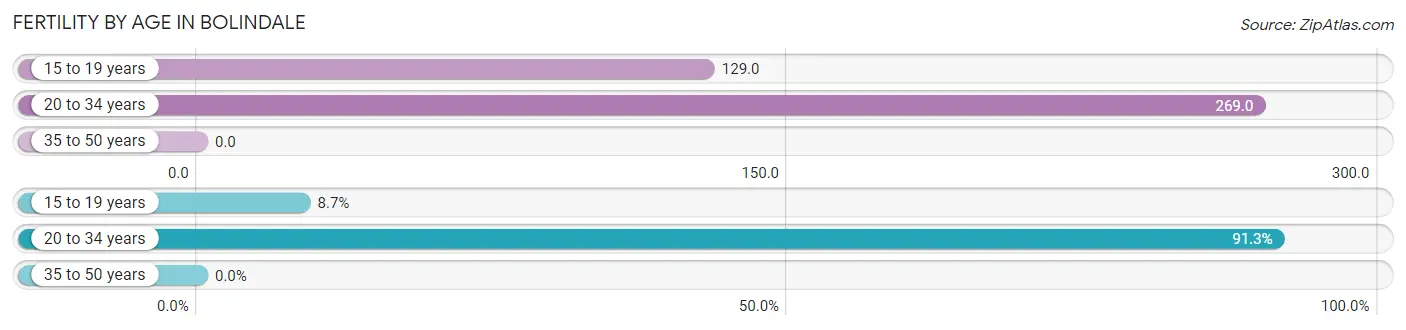
| Age Bracket | Women with Births | Births / 1,000 Women |
| 15 to 19 years | 4 (8.7%) | 129.0 |
| 20 to 34 years | 42 (91.3%) | 269.0 |
| 35 to 50 years | 0 (0.0%) | 0.0 |
| Total | 46 (100.0%) | 118.0 |
Fertility by Age by Marriage Status in Bolindale
67.4% of women with births (46) in Bolindale are married. The highest percentage of unmarried women with births falls into 15 to 19 years age bracket with 100.0% of them unmarried at the time of birth, while the lowest percentage of unmarried women with births belong to 20 to 34 years age bracket with 26.2% of them unmarried.
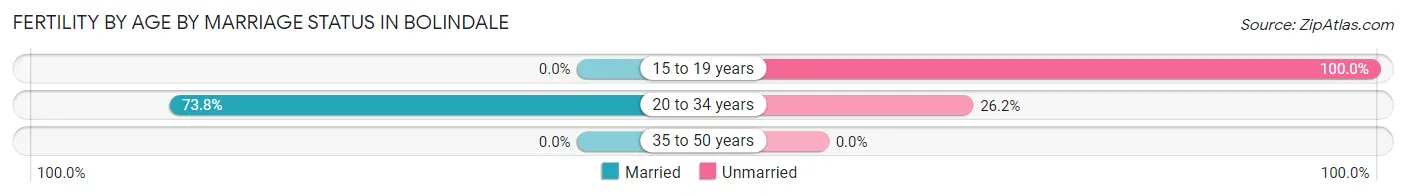
| Age Bracket | Married | Unmarried |
| 15 to 19 years | 0 (0.0%) | 4 (100.0%) |
| 20 to 34 years | 31 (73.8%) | 11 (26.2%) |
| 35 to 50 years | 0 (0.0%) | 0 (0.0%) |
| Total | 31 (67.4%) | 15 (32.6%) |
Fertility by Education in Bolindale
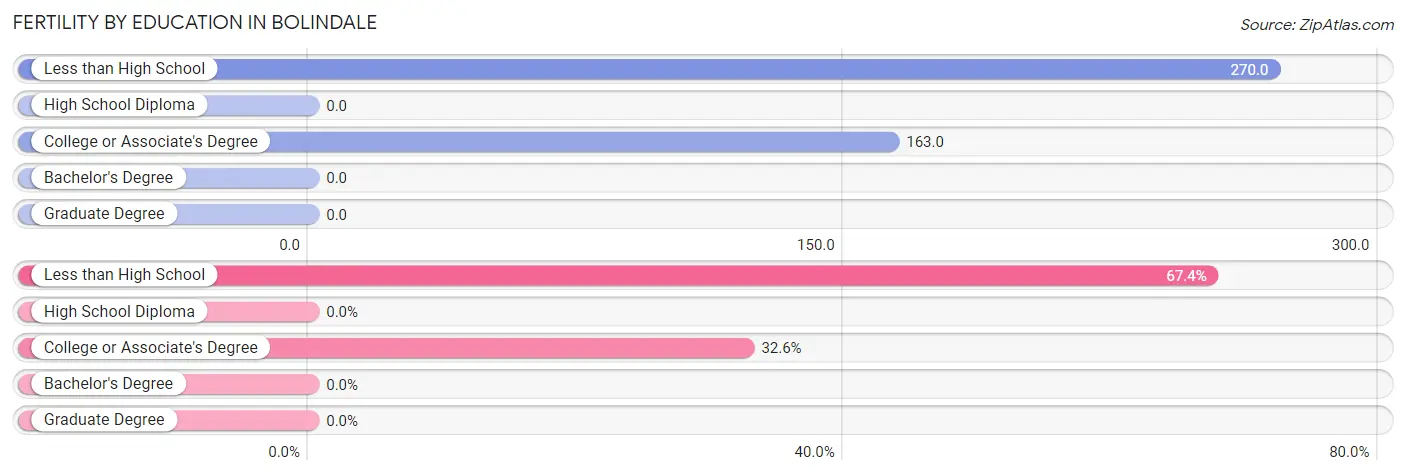
| Educational Attainment | Women with Births | Births / 1,000 Women |
| Less than High School | 31 (67.4%) | 270.0 |
| High School Diploma | 0 (0.0%) | 0.0 |
| College or Associate's Degree | 15 (32.6%) | 163.0 |
| Bachelor's Degree | 0 (0.0%) | 0.0 |
| Graduate Degree | 0 (0.0%) | 0.0 |
| Total | 46 (100.0%) | 118.0 |
Fertility by Education by Marriage Status in Bolindale
32.6% of women with births in Bolindale are unmarried. Women with the educational attainment of less than high school are most likely to be married with 100.0% of them married at childbirth, while women with the educational attainment of college or associate's degree are least likely to be married with 100.0% of them unmarried at childbirth.
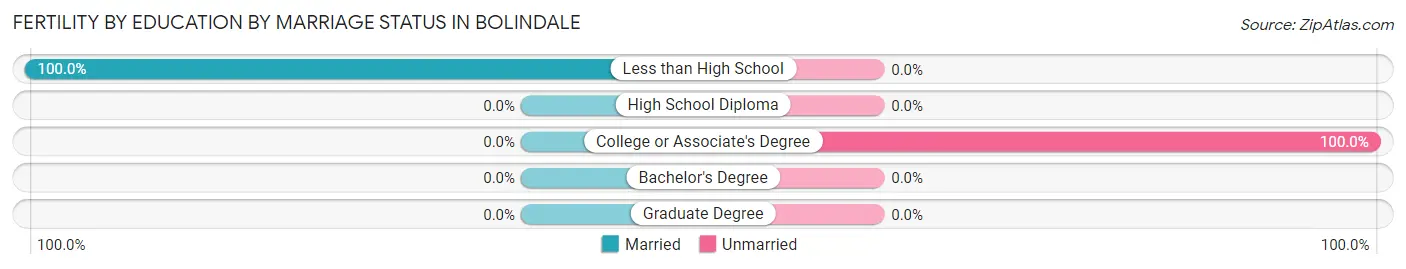
| Educational Attainment | Married | Unmarried |
| Less than High School | 31 (100.0%) | 0 (0.0%) |
| High School Diploma | 0 (0.0%) | 0 (0.0%) |
| College or Associate's Degree | 0 (0.0%) | 15 (100.0%) |
| Bachelor's Degree | 0 (0.0%) | 0 (0.0%) |
| Graduate Degree | 0 (0.0%) | 0 (0.0%) |
| Total | 31 (67.4%) | 15 (32.6%) |
Employment Characteristics in Bolindale
Employment by Class of Employer in Bolindale
Among the 718 employed individuals in Bolindale, private company employees (598 | 83.3%), federal government employees (52 | 7.2%), and local government employees (51 | 7.1%) make up the most common classes of employment.
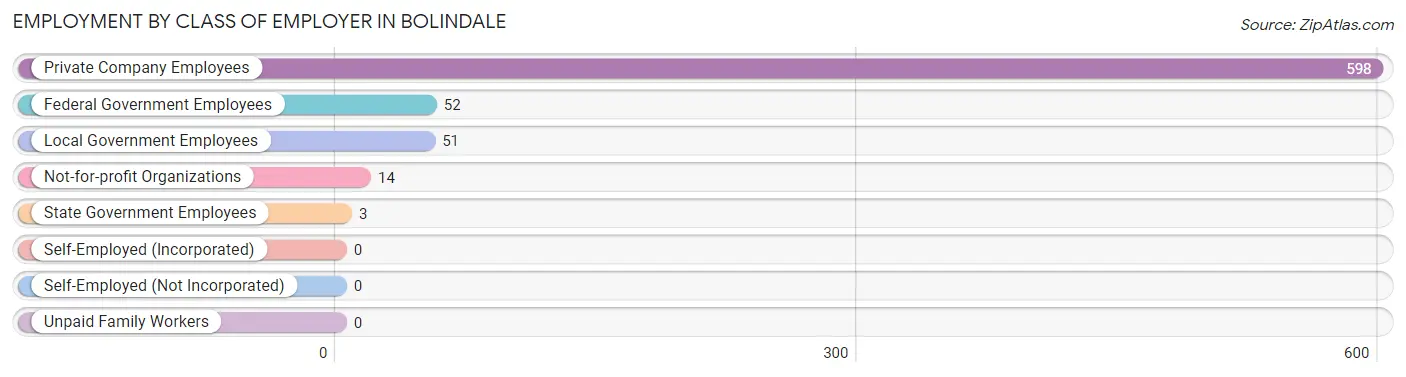
| Employer Class | # Employees | % Employees |
| Private Company Employees | 598 | 83.3% |
| Self-Employed (Incorporated) | 0 | 0.0% |
| Self-Employed (Not Incorporated) | 0 | 0.0% |
| Not-for-profit Organizations | 14 | 1.9% |
| Local Government Employees | 51 | 7.1% |
| State Government Employees | 3 | 0.4% |
| Federal Government Employees | 52 | 7.2% |
| Unpaid Family Workers | 0 | 0.0% |
| Total | 718 | 100.0% |
Employment Status by Age in Bolindale
According to the labor force statistics for Bolindale, out of the total population over 16 years of age (1,657), 50.7% or 840 individuals are in the labor force, with 1.9% or 16 of them unemployed. The age group with the highest labor force participation rate is 60 to 64 years, with 72.3% or 128 individuals in the labor force. Within the labor force, the 16 to 19 years age range has the highest percentage of unemployed individuals, with 27.0% or 10 of them being unemployed.
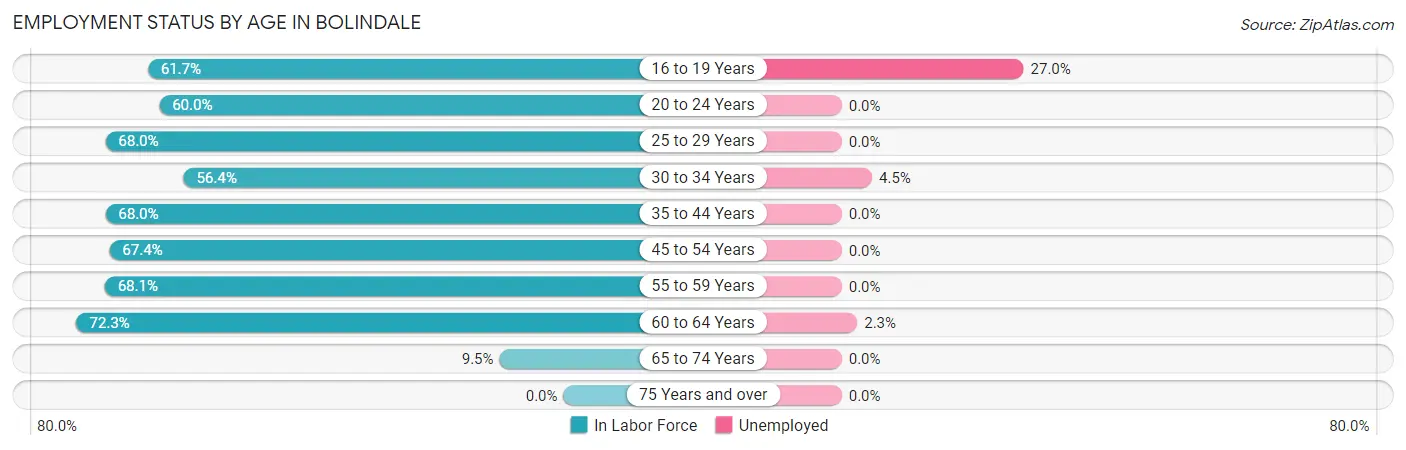
| Age Bracket | In Labor Force | Unemployed |
| 16 to 19 Years | 37 (61.7%) | 10 (27.0%) |
| 20 to 24 Years | 42 (60.0%) | 0 (0.0%) |
| 25 to 29 Years | 104 (68.0%) | 0 (0.0%) |
| 30 to 34 Years | 66 (56.4%) | 3 (4.5%) |
| 35 to 44 Years | 202 (68.0%) | 0 (0.0%) |
| 45 to 54 Years | 130 (67.4%) | 0 (0.0%) |
| 55 to 59 Years | 98 (68.1%) | 0 (0.0%) |
| 60 to 64 Years | 128 (72.3%) | 3 (2.3%) |
| 65 to 74 Years | 33 (9.5%) | 0 (0.0%) |
| 75 Years and over | 0 (0.0%) | 0 (0.0%) |
| Total | 840 (50.7%) | 16 (1.9%) |
Employment Status by Educational Attainment in Bolindale
According to labor force statistics for Bolindale, 67.3% of individuals (728) out of the total population between 25 and 64 years of age (1,081) are in the labor force, with 0.8% or 6 of them being unemployed. The group with the highest labor force participation rate are those with the educational attainment of college / associate degree, with 82.2% or 250 individuals in the labor force. Within the labor force, individuals with college / associate degree education have the highest percentage of unemployment, with 1.2% or 3 of them being unemployed.
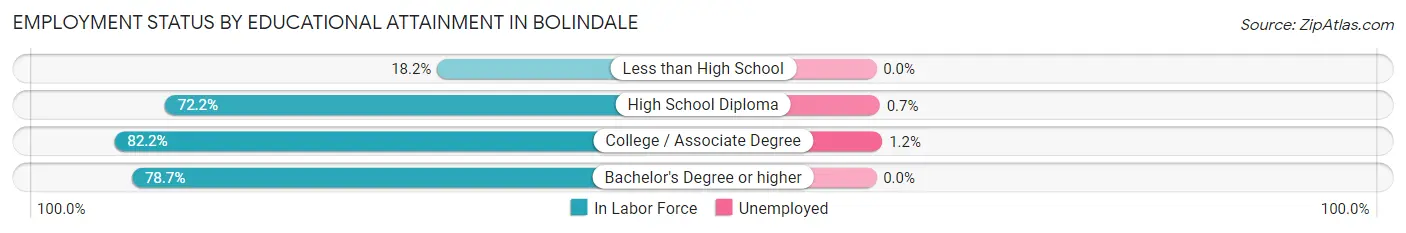
| Educational Attainment | In Labor Force | Unemployed |
| Less than High School | 29 (18.2%) | 0 (0.0%) |
| High School Diploma | 412 (72.2%) | 4 (0.7%) |
| College / Associate Degree | 250 (82.2%) | 4 (1.2%) |
| Bachelor's Degree or higher | 37 (78.7%) | 0 (0.0%) |
| Total | 728 (67.3%) | 9 (0.8%) |
Employment Occupations by Sex in Bolindale
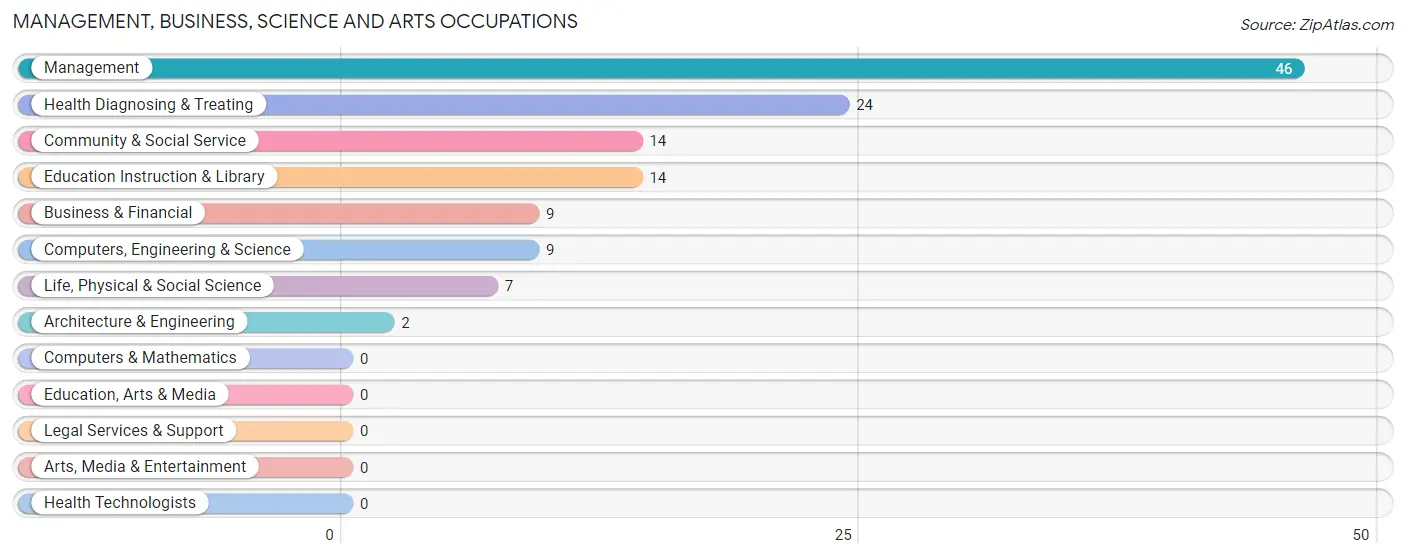
Management, Business, Science and Arts Occupations
The most common Management, Business, Science and Arts occupations in Bolindale are Management (46 | 5.6%), Health Diagnosing & Treating (24 | 2.9%), Community & Social Service (14 | 1.7%), Education Instruction & Library (14 | 1.7%), and Business & Financial (9 | 1.1%).
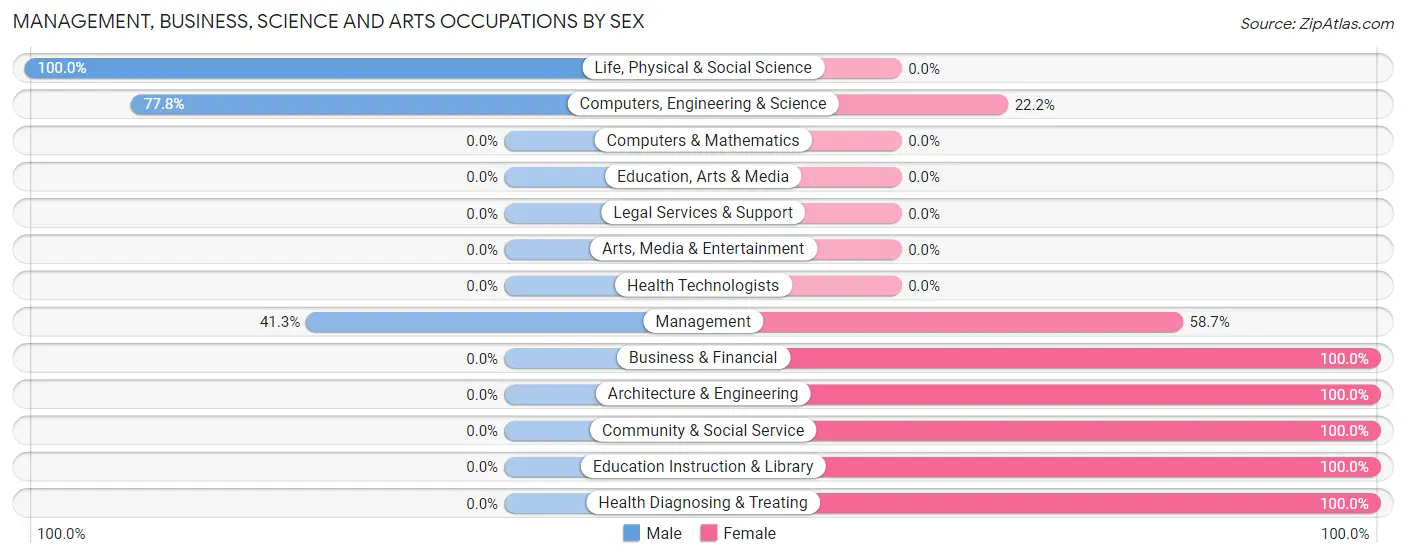
Management, Business, Science and Arts Occupations by Sex
Within the Management, Business, Science and Arts occupations in Bolindale, the most male-oriented occupations are Life, Physical & Social Science (100.0%), Computers, Engineering & Science (77.8%), and Management (41.3%), while the most female-oriented occupations are Business & Financial (100.0%), Architecture & Engineering (100.0%), and Community & Social Service (100.0%).
| Occupation | Male | Female |
| Management | 19 (41.3%) | 27 (58.7%) |
| Business & Financial | 0 (0.0%) | 9 (100.0%) |
| Computers, Engineering & Science | 7 (77.8%) | 2 (22.2%) |
| Computers & Mathematics | 0 (0.0%) | 0 (0.0%) |
| Architecture & Engineering | 0 (0.0%) | 2 (100.0%) |
| Life, Physical & Social Science | 7 (100.0%) | 0 (0.0%) |
| Community & Social Service | 0 (0.0%) | 14 (100.0%) |
| Education, Arts & Media | 0 (0.0%) | 0 (0.0%) |
| Legal Services & Support | 0 (0.0%) | 0 (0.0%) |
| Education Instruction & Library | 0 (0.0%) | 14 (100.0%) |
| Arts, Media & Entertainment | 0 (0.0%) | 0 (0.0%) |
| Health Diagnosing & Treating | 0 (0.0%) | 24 (100.0%) |
| Health Technologists | 0 (0.0%) | 0 (0.0%) |
| Total (Category) | 26 (25.5%) | 76 (74.5%) |
| Total (Overall) | 539 (65.4%) | 285 (34.6%) |
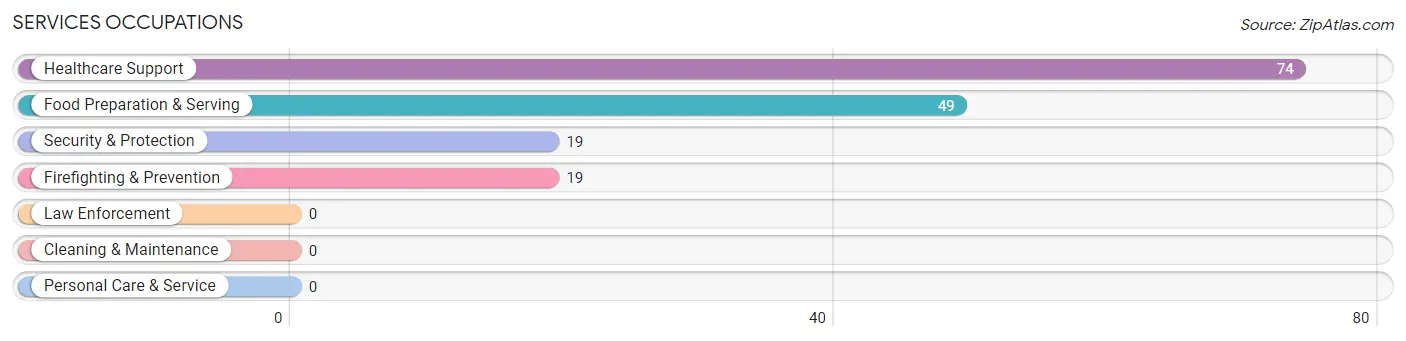
Services Occupations
The most common Services occupations in Bolindale are Healthcare Support (74 | 9.0%), Food Preparation & Serving (49 | 5.9%), Security & Protection (19 | 2.3%), and Firefighting & Prevention (19 | 2.3%).
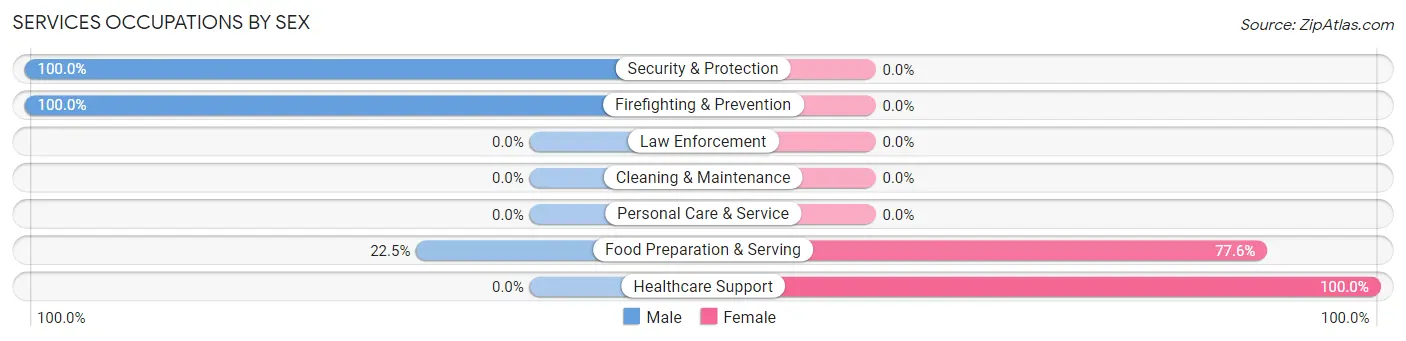
Services Occupations by Sex
Within the Services occupations in Bolindale, the most male-oriented occupations are Security & Protection (100.0%), Firefighting & Prevention (100.0%), and Food Preparation & Serving (22.5%), while the most female-oriented occupations are Healthcare Support (100.0%), and Food Preparation & Serving (77.5%).
| Occupation | Male | Female |
| Healthcare Support | 0 (0.0%) | 74 (100.0%) |
| Security & Protection | 19 (100.0%) | 0 (0.0%) |
| Firefighting & Prevention | 19 (100.0%) | 0 (0.0%) |
| Law Enforcement | 0 (0.0%) | 0 (0.0%) |
| Food Preparation & Serving | 11 (22.5%) | 38 (77.5%) |
| Cleaning & Maintenance | 0 (0.0%) | 0 (0.0%) |
| Personal Care & Service | 0 (0.0%) | 0 (0.0%) |
| Total (Category) | 30 (21.1%) | 112 (78.9%) |
| Total (Overall) | 539 (65.4%) | 285 (34.6%) |
Sales and Office Occupations
The most common Sales and Office occupations in Bolindale are Sales & Related (135 | 16.4%), and Office & Administration (126 | 15.3%).
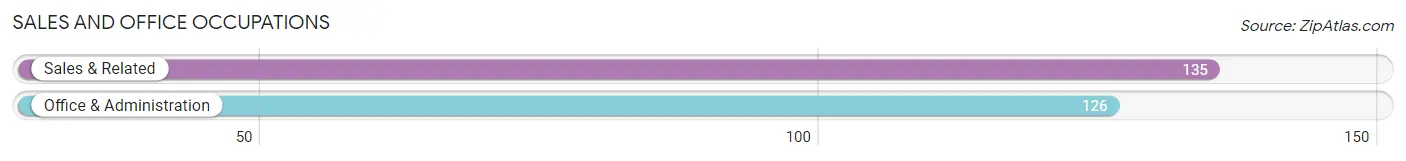
Sales and Office Occupations by Sex
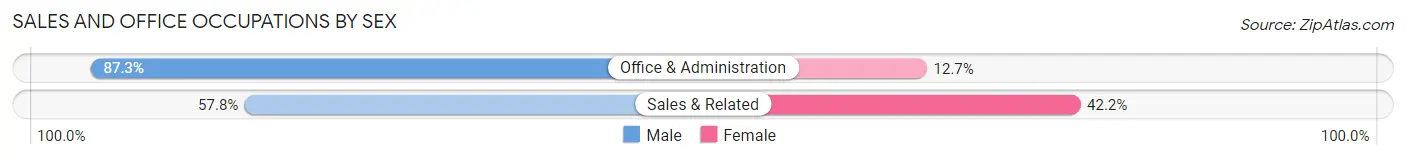
| Occupation | Male | Female |
| Sales & Related | 78 (57.8%) | 57 (42.2%) |
| Office & Administration | 110 (87.3%) | 16 (12.7%) |
| Total (Category) | 188 (72.0%) | 73 (28.0%) |
| Total (Overall) | 539 (65.4%) | 285 (34.6%) |
Natural Resources, Construction and Maintenance Occupations
The most common Natural Resources, Construction and Maintenance occupations in Bolindale are Construction & Extraction (45 | 5.5%), and Installation, Maintenance & Repair (5 | 0.6%).
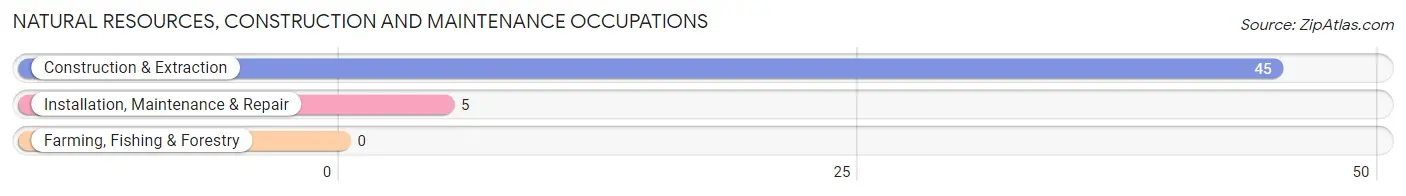
Natural Resources, Construction and Maintenance Occupations by Sex
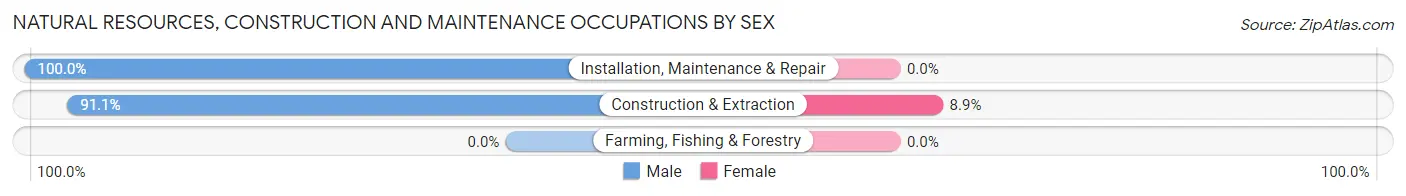
| Occupation | Male | Female |
| Farming, Fishing & Forestry | 0 (0.0%) | 0 (0.0%) |
| Construction & Extraction | 41 (91.1%) | 4 (8.9%) |
| Installation, Maintenance & Repair | 5 (100.0%) | 0 (0.0%) |
| Total (Category) | 46 (92.0%) | 4 (8.0%) |
| Total (Overall) | 539 (65.4%) | 285 (34.6%) |
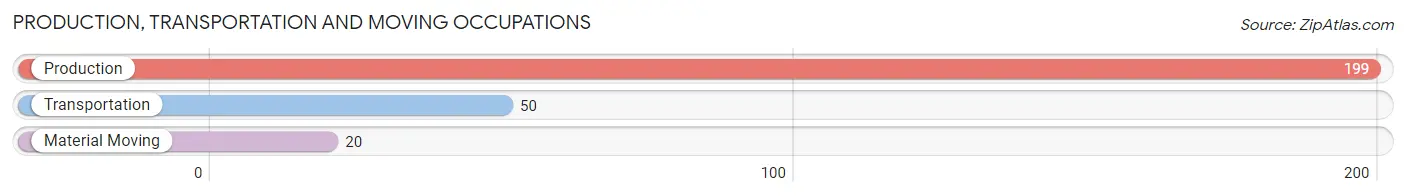
Production, Transportation and Moving Occupations
The most common Production, Transportation and Moving occupations in Bolindale are Production (199 | 24.1%), Transportation (50 | 6.1%), and Material Moving (20 | 2.4%).
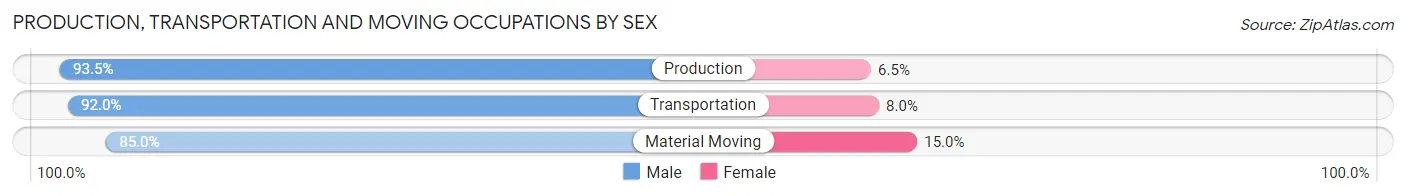
Production, Transportation and Moving Occupations by Sex
| Occupation | Male | Female |
| Production | 186 (93.5%) | 13 (6.5%) |
| Transportation | 46 (92.0%) | 4 (8.0%) |
| Material Moving | 17 (85.0%) | 3 (15.0%) |
| Total (Category) | 249 (92.6%) | 20 (7.4%) |
| Total (Overall) | 539 (65.4%) | 285 (34.6%) |
Employment Industries by Sex in Bolindale
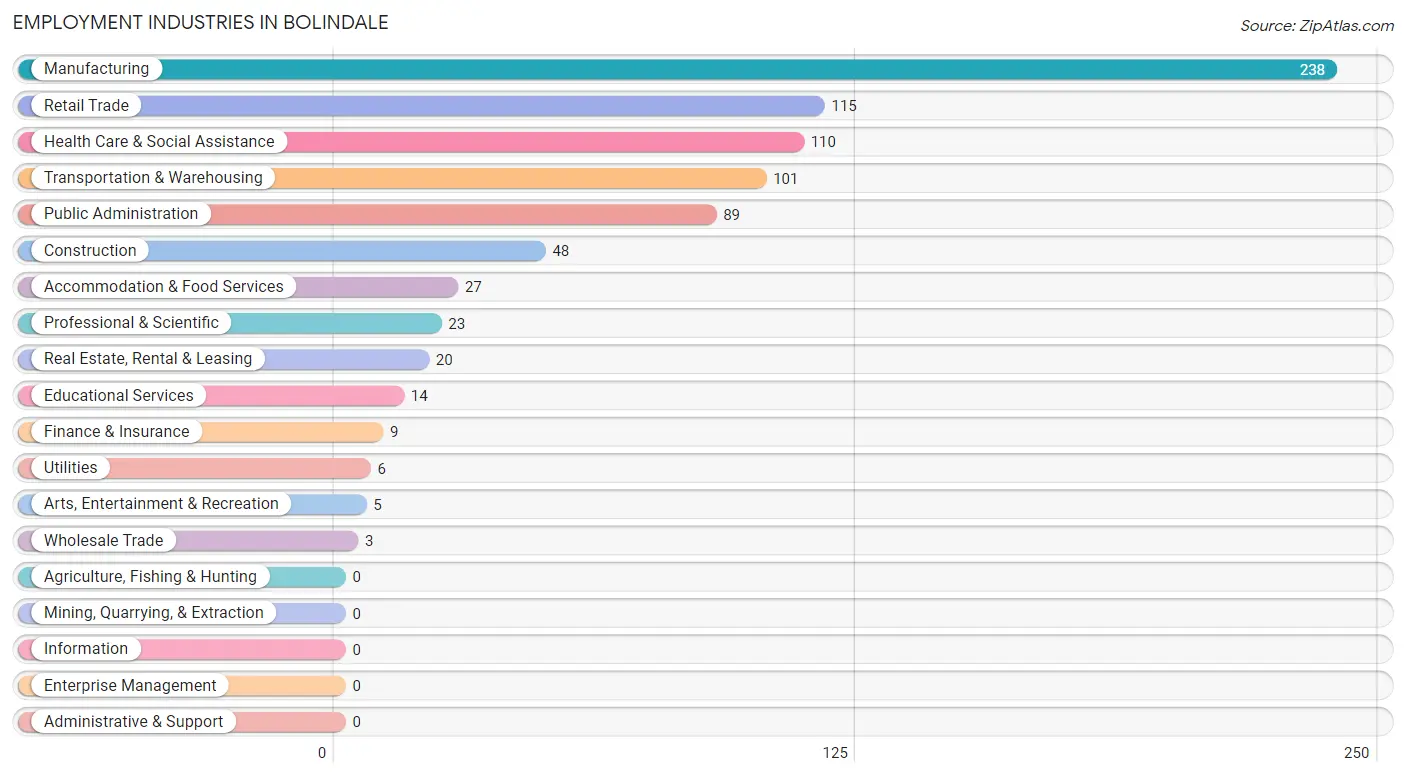
Employment Industries in Bolindale
The major employment industries in Bolindale include Manufacturing (238 | 28.9%), Retail Trade (115 | 14.0%), Health Care & Social Assistance (110 | 13.4%), Transportation & Warehousing (101 | 12.3%), and Public Administration (89 | 10.8%).
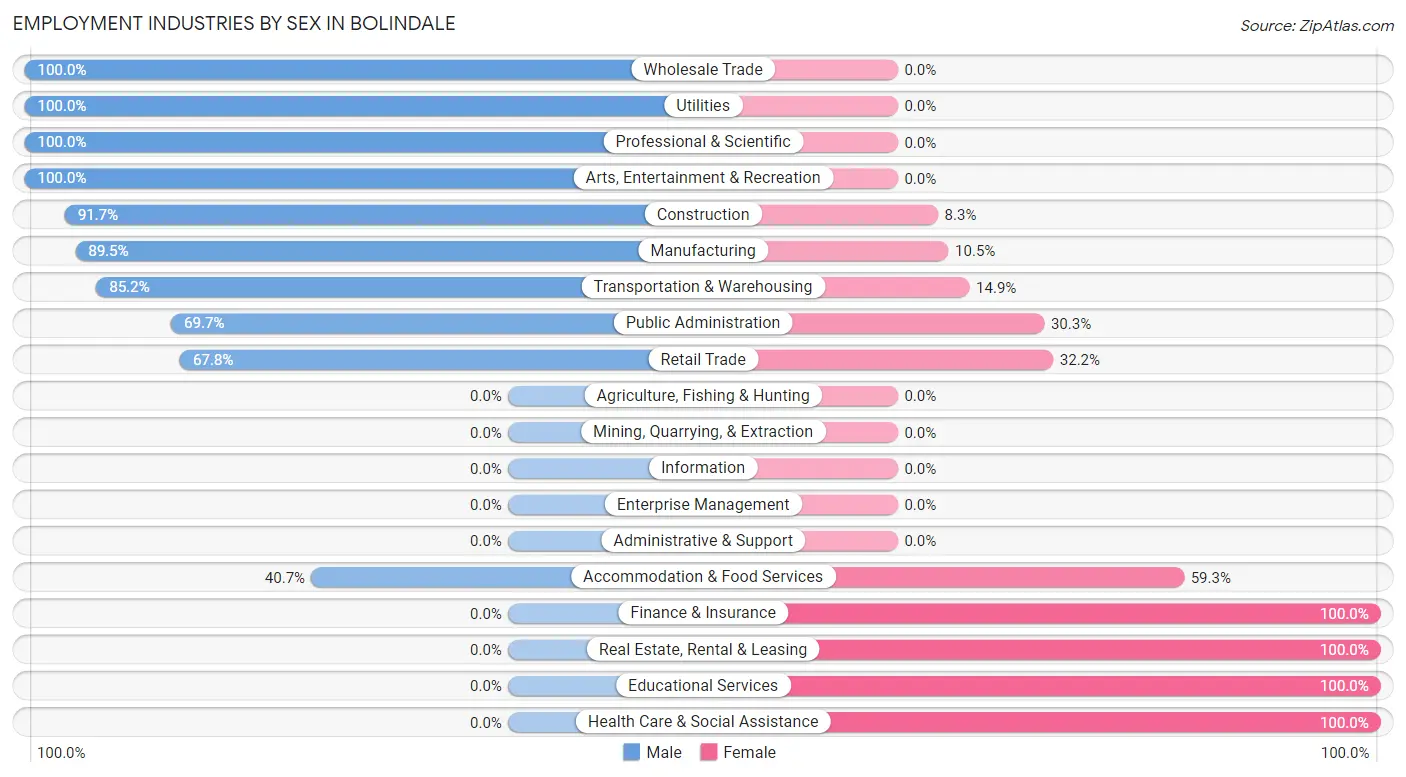
Employment Industries by Sex in Bolindale
The Bolindale industries that see more men than women are Wholesale Trade (100.0%), Utilities (100.0%), and Professional & Scientific (100.0%), whereas the industries that tend to have a higher number of women are Finance & Insurance (100.0%), Real Estate, Rental & Leasing (100.0%), and Educational Services (100.0%).
| Industry | Male | Female |
| Agriculture, Fishing & Hunting | 0 (0.0%) | 0 (0.0%) |
| Mining, Quarrying, & Extraction | 0 (0.0%) | 0 (0.0%) |
| Construction | 44 (91.7%) | 4 (8.3%) |
| Manufacturing | 213 (89.5%) | 25 (10.5%) |
| Wholesale Trade | 3 (100.0%) | 0 (0.0%) |
| Retail Trade | 78 (67.8%) | 37 (32.2%) |
| Transportation & Warehousing | 86 (85.2%) | 15 (14.8%) |
| Utilities | 6 (100.0%) | 0 (0.0%) |
| Information | 0 (0.0%) | 0 (0.0%) |
| Finance & Insurance | 0 (0.0%) | 9 (100.0%) |
| Real Estate, Rental & Leasing | 0 (0.0%) | 20 (100.0%) |
| Professional & Scientific | 23 (100.0%) | 0 (0.0%) |
| Enterprise Management | 0 (0.0%) | 0 (0.0%) |
| Administrative & Support | 0 (0.0%) | 0 (0.0%) |
| Educational Services | 0 (0.0%) | 14 (100.0%) |
| Health Care & Social Assistance | 0 (0.0%) | 110 (100.0%) |
| Arts, Entertainment & Recreation | 5 (100.0%) | 0 (0.0%) |
| Accommodation & Food Services | 11 (40.7%) | 16 (59.3%) |
| Public Administration | 62 (69.7%) | 27 (30.3%) |
| Total | 539 (65.4%) | 285 (34.6%) |
Education in Bolindale
School Enrollment in Bolindale
The most common levels of schooling among the 405 students in Bolindale are elementary school (117 | 28.9%), high school (78 | 19.3%), and college / undergraduate (76 | 18.8%).
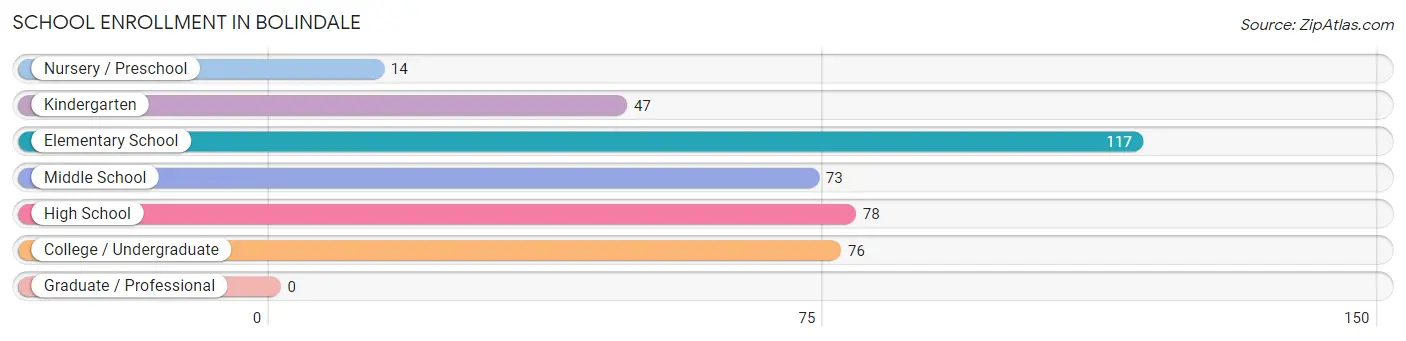
| School Level | # Students | % Students |
| Nursery / Preschool | 14 | 3.5% |
| Kindergarten | 47 | 11.6% |
| Elementary School | 117 | 28.9% |
| Middle School | 73 | 18.0% |
| High School | 78 | 19.3% |
| College / Undergraduate | 76 | 18.8% |
| Graduate / Professional | 0 | 0.0% |
| Total | 405 | 100.0% |
School Enrollment by Age by Funding Source in Bolindale
Out of a total of 405 students who are enrolled in schools in Bolindale, 31 (7.7%) attend a private institution, while the remaining 374 (92.3%) are enrolled in public schools. The age group of 5 to 9 year old has the highest likelihood of being enrolled in private schools, with 31 (18.9% in the age bracket) enrolled. Conversely, the age group of 3 to 4 year olds has the lowest likelihood of being enrolled in a private school, with 14 (100.0% in the age bracket) attending a public institution.
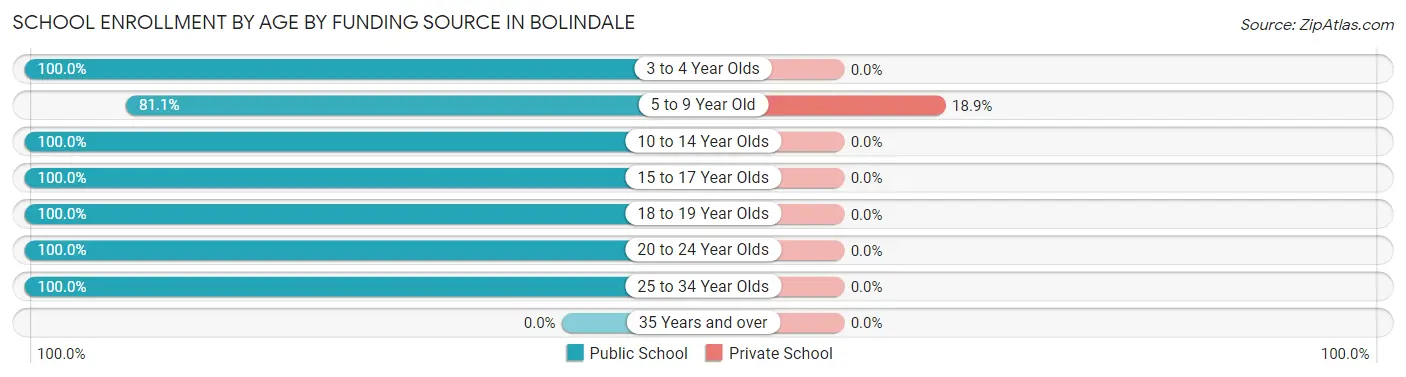
| Age Bracket | Public School | Private School |
| 3 to 4 Year Olds | 14 (100.0%) | 0 (0.0%) |
| 5 to 9 Year Old | 133 (81.1%) | 31 (18.9%) |
| 10 to 14 Year Olds | 89 (100.0%) | 0 (0.0%) |
| 15 to 17 Year Olds | 57 (100.0%) | 0 (0.0%) |
| 18 to 19 Year Olds | 9 (100.0%) | 0 (0.0%) |
| 20 to 24 Year Olds | 45 (100.0%) | 0 (0.0%) |
| 25 to 34 Year Olds | 27 (100.0%) | 0 (0.0%) |
| 35 Years and over | 0 (0.0%) | 0 (0.0%) |
| Total | 374 (92.3%) | 31 (7.7%) |
Educational Attainment by Field of Study in Bolindale
Education (35 | 34.3%), arts & humanities (33 | 32.4%), business (26 | 25.5%), and computers & mathematics (8 | 7.8%) are the most common fields of study among 102 individuals in Bolindale who have obtained a bachelor's degree or higher.
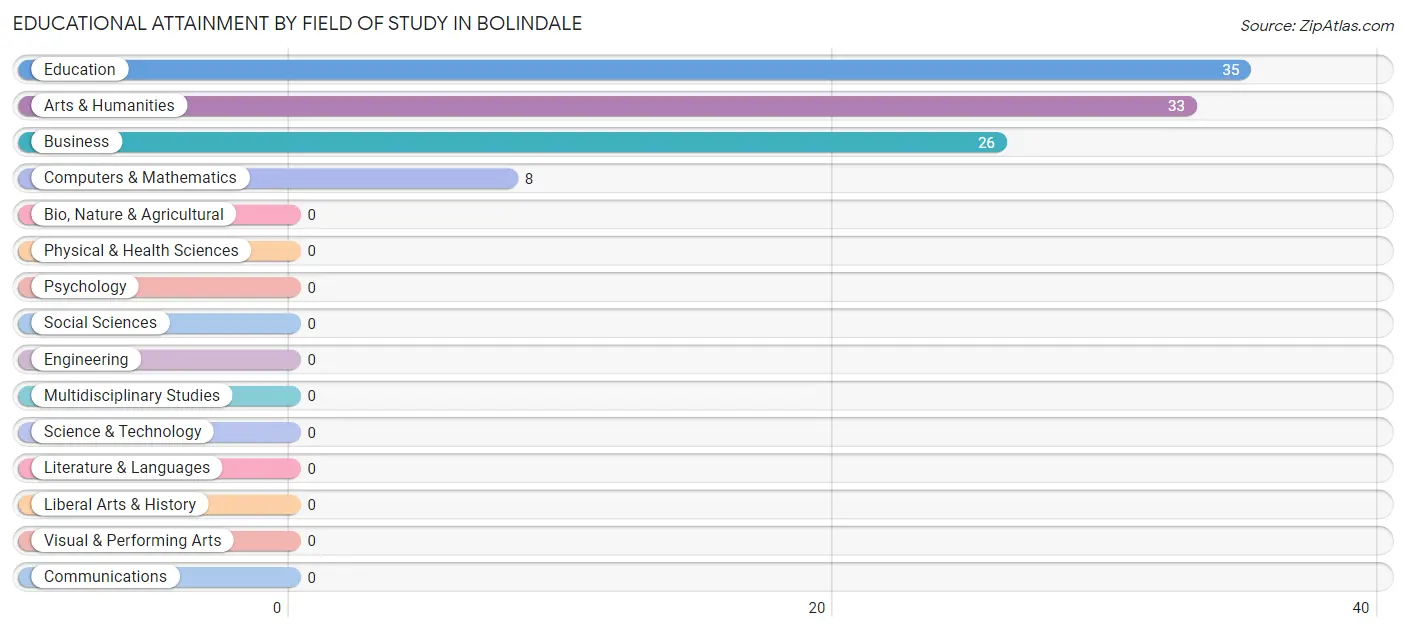
| Field of Study | # Graduates | % Graduates |
| Computers & Mathematics | 8 | 7.8% |
| Bio, Nature & Agricultural | 0 | 0.0% |
| Physical & Health Sciences | 0 | 0.0% |
| Psychology | 0 | 0.0% |
| Social Sciences | 0 | 0.0% |
| Engineering | 0 | 0.0% |
| Multidisciplinary Studies | 0 | 0.0% |
| Science & Technology | 0 | 0.0% |
| Business | 26 | 25.5% |
| Education | 35 | 34.3% |
| Literature & Languages | 0 | 0.0% |
| Liberal Arts & History | 0 | 0.0% |
| Visual & Performing Arts | 0 | 0.0% |
| Communications | 0 | 0.0% |
| Arts & Humanities | 33 | 32.4% |
| Total | 102 | 100.0% |
Transportation & Commute in Bolindale
Vehicle Availability by Sex in Bolindale
The most prevalent vehicle ownership categories in Bolindale are males with 2 vehicles (189, accounting for 35.9%) and females with 2 vehicles (94, making up 98.4%).
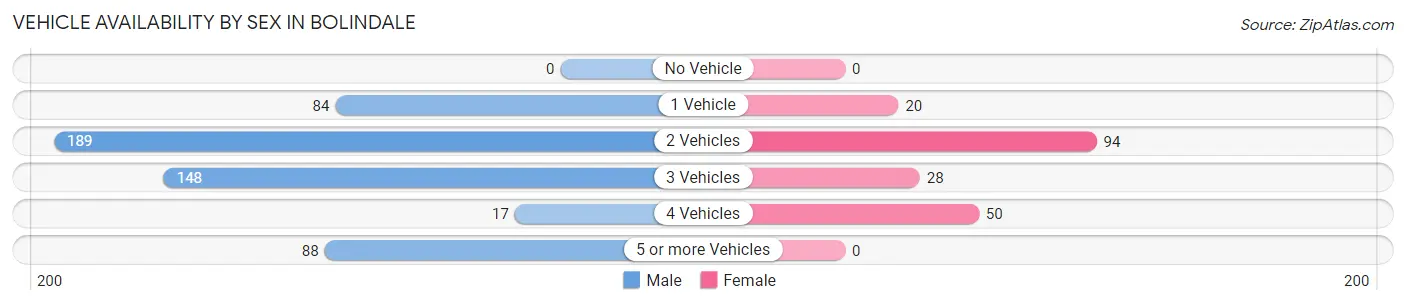
| Vehicles Available | Male | Female |
| No Vehicle | 0 (0.0%) | 0 (0.0%) |
| 1 Vehicle | 84 (16.0%) | 20 (10.4%) |
| 2 Vehicles | 189 (35.9%) | 94 (49.0%) |
| 3 Vehicles | 148 (28.1%) | 28 (14.6%) |
| 4 Vehicles | 17 (3.2%) | 50 (26.0%) |
| 5 or more Vehicles | 88 (16.7%) | 0 (0.0%) |
| Total | 526 (100.0%) | 192 (100.0%) |
Commute Time in Bolindale
The most frequently occuring commute durations in Bolindale are 5 to 9 minutes (168 commuters, 24.0%), 15 to 19 minutes (148 commuters, 21.2%), and 20 to 24 minutes (120 commuters, 17.2%).

| Commute Time | # Commuters | % Commuters |
| Less than 5 Minutes | 0 | 0.0% |
| 5 to 9 Minutes | 168 | 24.0% |
| 10 to 14 Minutes | 112 | 16.0% |
| 15 to 19 Minutes | 148 | 21.2% |
| 20 to 24 Minutes | 120 | 17.2% |
| 25 to 29 Minutes | 31 | 4.4% |
| 30 to 34 Minutes | 36 | 5.1% |
| 35 to 39 Minutes | 9 | 1.3% |
| 40 to 44 Minutes | 27 | 3.9% |
| 45 to 59 Minutes | 38 | 5.4% |
| 60 to 89 Minutes | 10 | 1.4% |
| 90 or more Minutes | 0 | 0.0% |
Commute Time by Sex in Bolindale
The most common commute times in Bolindale are 5 to 9 minutes (118 commuters, 23.3%) for males and 5 to 9 minutes (50 commuters, 26.0%) for females.
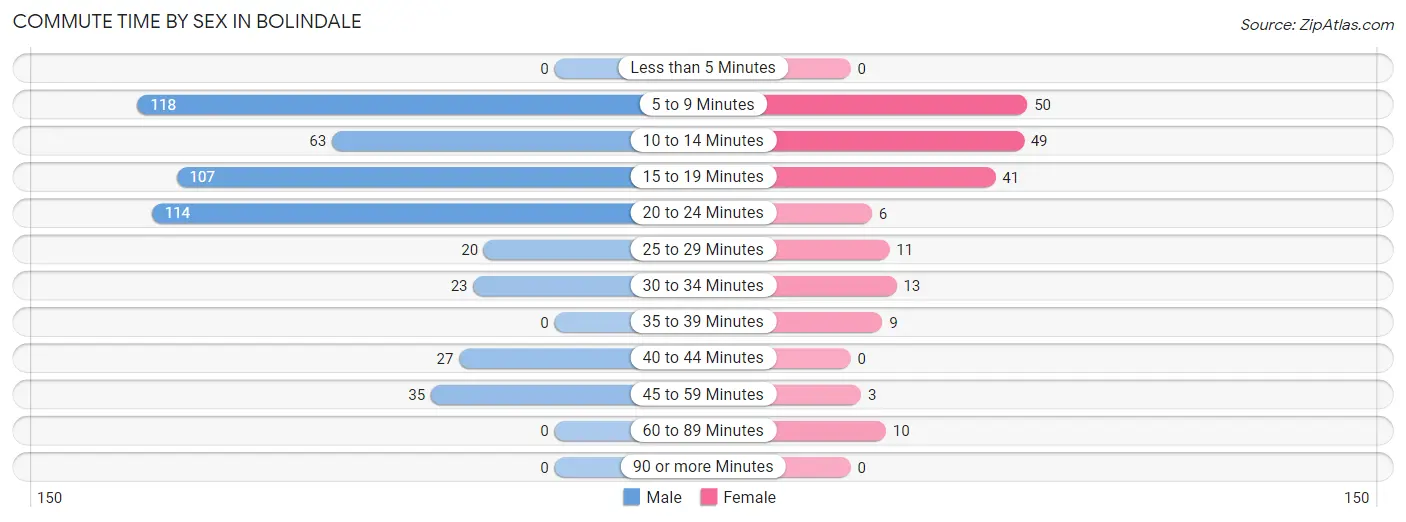
| Commute Time | Male | Female |
| Less than 5 Minutes | 0 (0.0%) | 0 (0.0%) |
| 5 to 9 Minutes | 118 (23.3%) | 50 (26.0%) |
| 10 to 14 Minutes | 63 (12.4%) | 49 (25.5%) |
| 15 to 19 Minutes | 107 (21.1%) | 41 (21.3%) |
| 20 to 24 Minutes | 114 (22.5%) | 6 (3.1%) |
| 25 to 29 Minutes | 20 (3.9%) | 11 (5.7%) |
| 30 to 34 Minutes | 23 (4.5%) | 13 (6.8%) |
| 35 to 39 Minutes | 0 (0.0%) | 9 (4.7%) |
| 40 to 44 Minutes | 27 (5.3%) | 0 (0.0%) |
| 45 to 59 Minutes | 35 (6.9%) | 3 (1.6%) |
| 60 to 89 Minutes | 0 (0.0%) | 10 (5.2%) |
| 90 or more Minutes | 0 (0.0%) | 0 (0.0%) |
Time of Departure to Work by Sex in Bolindale
The most frequent times of departure to work in Bolindale are 4:00 PM to 11:59 PM (176, 34.7%) for males and 6:30 AM to 6:59 AM (71, 37.0%) for females.
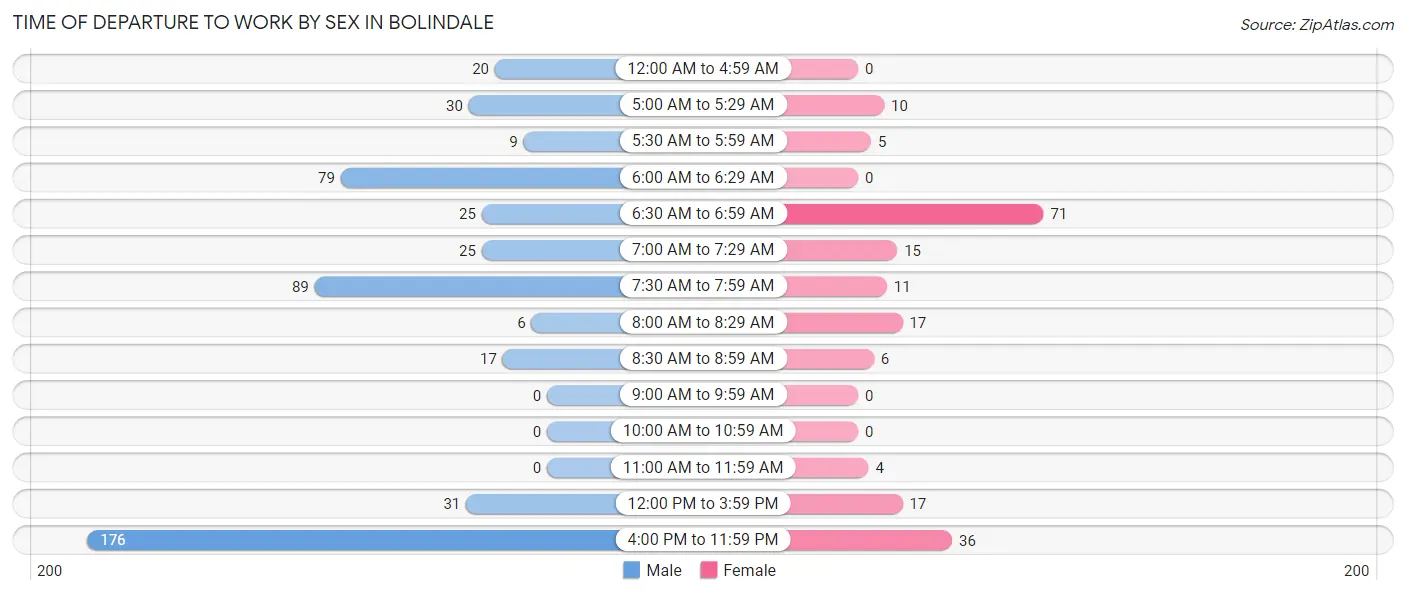
| Time of Departure | Male | Female |
| 12:00 AM to 4:59 AM | 20 (3.9%) | 0 (0.0%) |
| 5:00 AM to 5:29 AM | 30 (5.9%) | 10 (5.2%) |
| 5:30 AM to 5:59 AM | 9 (1.8%) | 5 (2.6%) |
| 6:00 AM to 6:29 AM | 79 (15.6%) | 0 (0.0%) |
| 6:30 AM to 6:59 AM | 25 (4.9%) | 71 (37.0%) |
| 7:00 AM to 7:29 AM | 25 (4.9%) | 15 (7.8%) |
| 7:30 AM to 7:59 AM | 89 (17.5%) | 11 (5.7%) |
| 8:00 AM to 8:29 AM | 6 (1.2%) | 17 (8.8%) |
| 8:30 AM to 8:59 AM | 17 (3.4%) | 6 (3.1%) |
| 9:00 AM to 9:59 AM | 0 (0.0%) | 0 (0.0%) |
| 10:00 AM to 10:59 AM | 0 (0.0%) | 0 (0.0%) |
| 11:00 AM to 11:59 AM | 0 (0.0%) | 4 (2.1%) |
| 12:00 PM to 3:59 PM | 31 (6.1%) | 17 (8.8%) |
| 4:00 PM to 11:59 PM | 176 (34.7%) | 36 (18.8%) |
| Total | 507 (100.0%) | 192 (100.0%) |
Housing Occupancy in Bolindale
Occupancy by Ownership in Bolindale
Of the total 793 dwellings in Bolindale, owner-occupied units account for 571 (72.0%), while renter-occupied units make up 222 (28.0%).
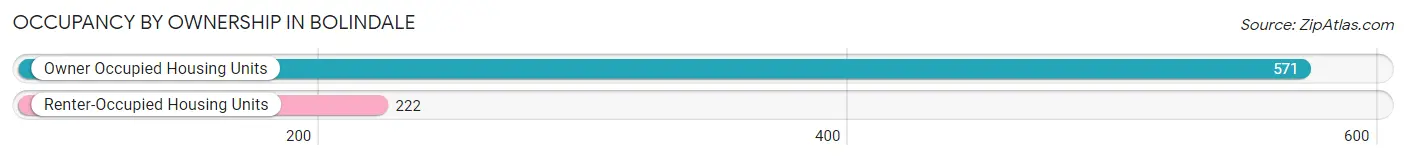
| Occupancy | # Housing Units | % Housing Units |
| Owner Occupied Housing Units | 571 | 72.0% |
| Renter-Occupied Housing Units | 222 | 28.0% |
| Total Occupied Housing Units | 793 | 100.0% |
Occupancy by Household Size in Bolindale
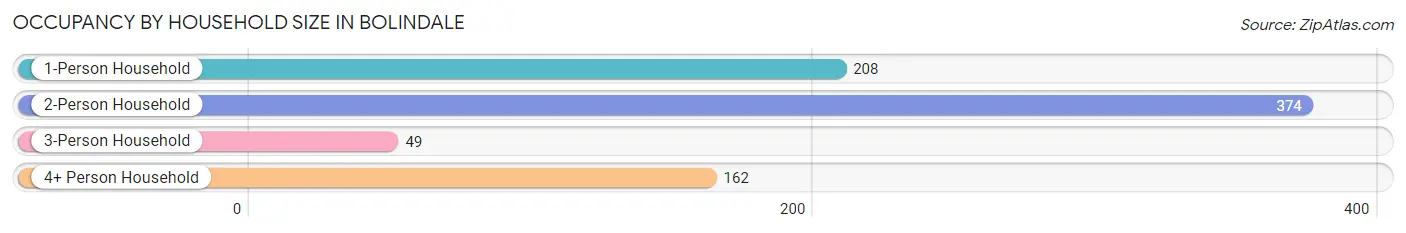
| Household Size | # Housing Units | % Housing Units |
| 1-Person Household | 208 | 26.2% |
| 2-Person Household | 374 | 47.2% |
| 3-Person Household | 49 | 6.2% |
| 4+ Person Household | 162 | 20.4% |
| Total Housing Units | 793 | 100.0% |
Occupancy by Ownership by Household Size in Bolindale
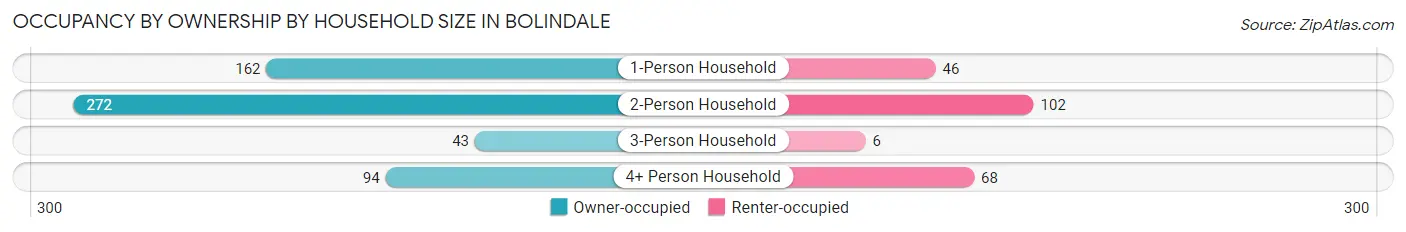
| Household Size | Owner-occupied | Renter-occupied |
| 1-Person Household | 162 (77.9%) | 46 (22.1%) |
| 2-Person Household | 272 (72.7%) | 102 (27.3%) |
| 3-Person Household | 43 (87.8%) | 6 (12.2%) |
| 4+ Person Household | 94 (58.0%) | 68 (42.0%) |
| Total Housing Units | 571 (72.0%) | 222 (28.0%) |
Occupancy by Educational Attainment in Bolindale
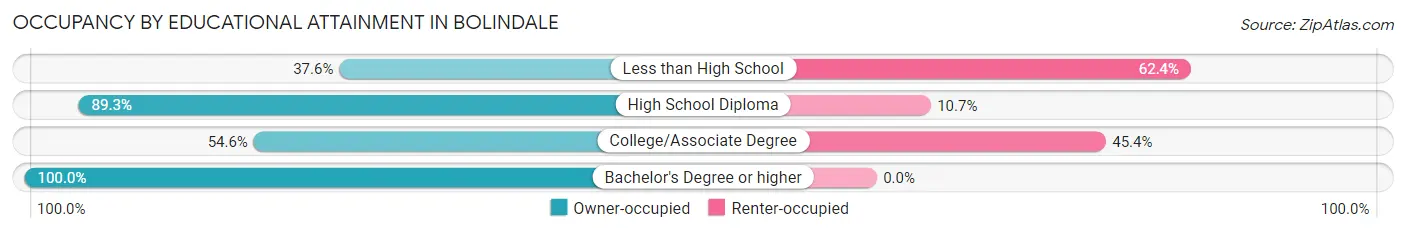
| Household Size | Owner-occupied | Renter-occupied |
| Less than High School | 38 (37.6%) | 63 (62.4%) |
| High School Diploma | 333 (89.3%) | 40 (10.7%) |
| College/Associate Degree | 143 (54.6%) | 119 (45.4%) |
| Bachelor's Degree or higher | 57 (100.0%) | 0 (0.0%) |
Occupancy by Age of Householder in Bolindale
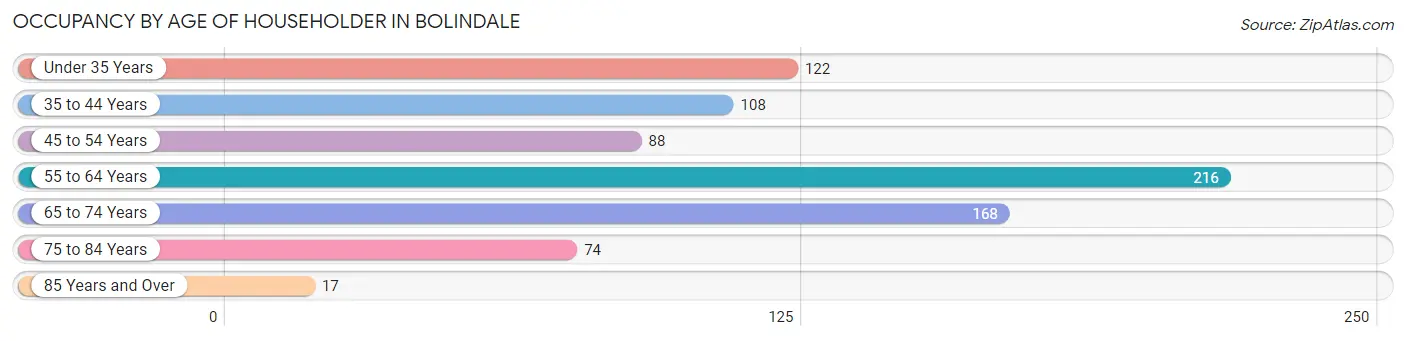
| Age Bracket | # Households | % Households |
| Under 35 Years | 122 | 15.4% |
| 35 to 44 Years | 108 | 13.6% |
| 45 to 54 Years | 88 | 11.1% |
| 55 to 64 Years | 216 | 27.2% |
| 65 to 74 Years | 168 | 21.2% |
| 75 to 84 Years | 74 | 9.3% |
| 85 Years and Over | 17 | 2.1% |
| Total | 793 | 100.0% |
Housing Finances in Bolindale
Median Income by Occupancy in Bolindale
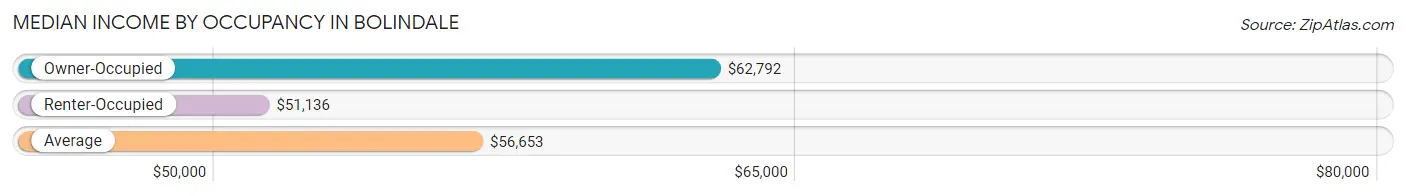
| Occupancy Type | # Households | Median Income |
| Owner-Occupied | 571 (72.0%) | $62,792 |
| Renter-Occupied | 222 (28.0%) | $51,136 |
| Average | 793 (100.0%) | $56,653 |
Occupancy by Householder Income Bracket in Bolindale
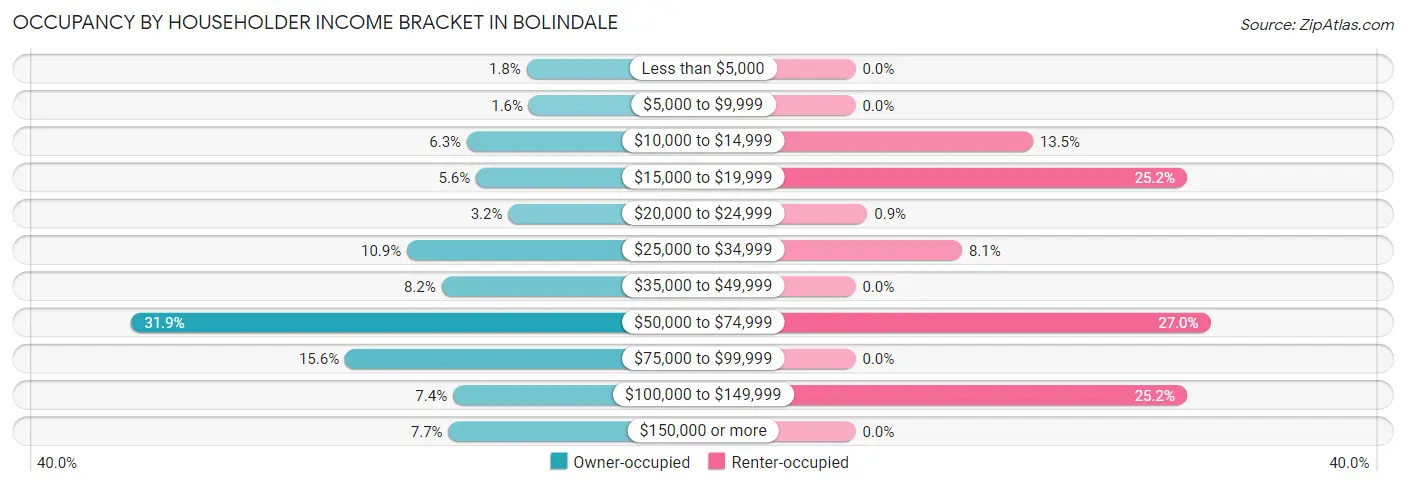
| Income Bracket | Owner-occupied | Renter-occupied |
| Less than $5,000 | 10 (1.8%) | 0 (0.0%) |
| $5,000 to $9,999 | 9 (1.6%) | 0 (0.0%) |
| $10,000 to $14,999 | 36 (6.3%) | 30 (13.5%) |
| $15,000 to $19,999 | 32 (5.6%) | 56 (25.2%) |
| $20,000 to $24,999 | 18 (3.2%) | 2 (0.9%) |
| $25,000 to $34,999 | 62 (10.9%) | 18 (8.1%) |
| $35,000 to $49,999 | 47 (8.2%) | 0 (0.0%) |
| $50,000 to $74,999 | 182 (31.9%) | 60 (27.0%) |
| $75,000 to $99,999 | 89 (15.6%) | 0 (0.0%) |
| $100,000 to $149,999 | 42 (7.4%) | 56 (25.2%) |
| $150,000 or more | 44 (7.7%) | 0 (0.0%) |
| Total | 571 (100.0%) | 222 (100.0%) |
Monthly Housing Cost Tiers in Bolindale
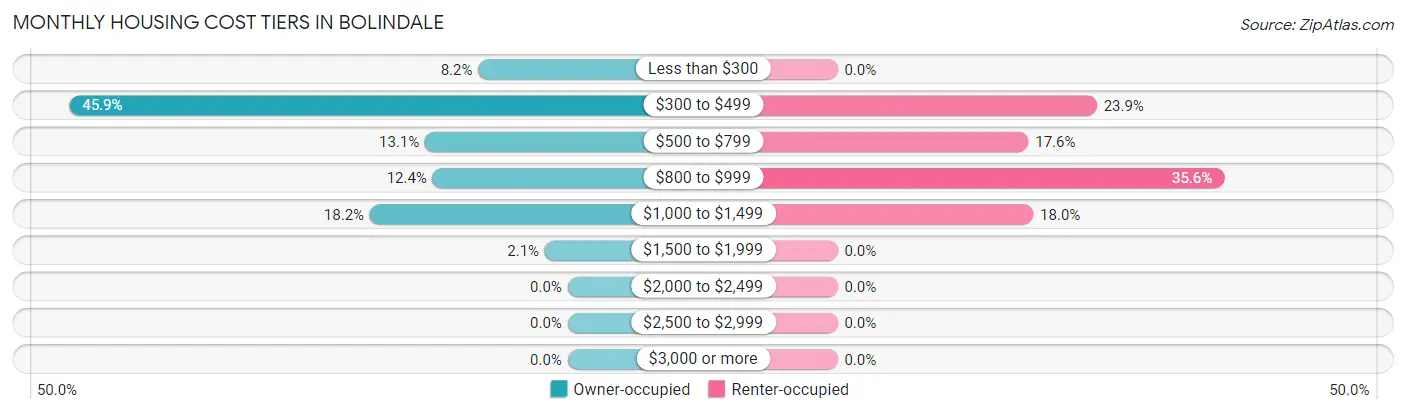
| Monthly Cost | Owner-occupied | Renter-occupied |
| Less than $300 | 47 (8.2%) | 0 (0.0%) |
| $300 to $499 | 262 (45.9%) | 53 (23.9%) |
| $500 to $799 | 75 (13.1%) | 39 (17.6%) |
| $800 to $999 | 71 (12.4%) | 79 (35.6%) |
| $1,000 to $1,499 | 104 (18.2%) | 40 (18.0%) |
| $1,500 to $1,999 | 12 (2.1%) | 0 (0.0%) |
| $2,000 to $2,499 | 0 (0.0%) | 0 (0.0%) |
| $2,500 to $2,999 | 0 (0.0%) | 0 (0.0%) |
| $3,000 or more | 0 (0.0%) | 0 (0.0%) |
| Total | 571 (100.0%) | 222 (100.0%) |
Physical Housing Characteristics in Bolindale
Housing Structures in Bolindale
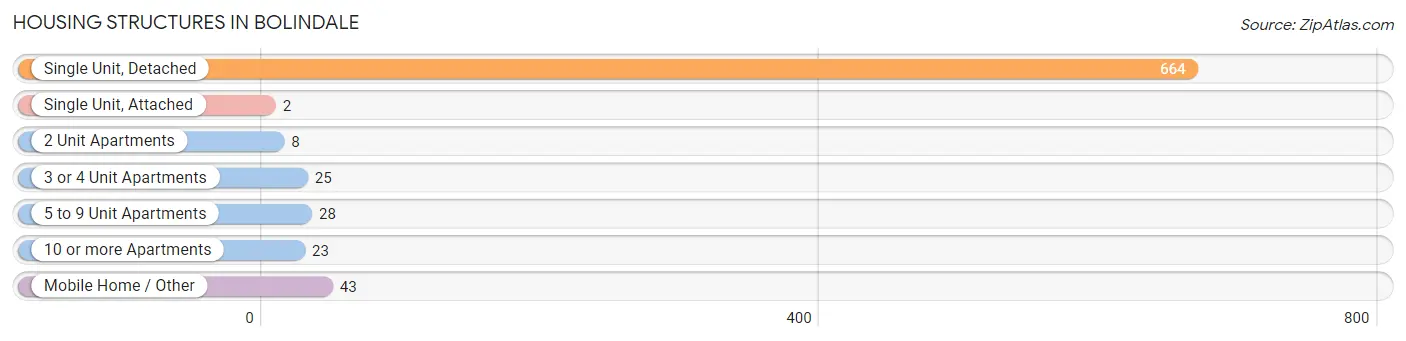
| Structure Type | # Housing Units | % Housing Units |
| Single Unit, Detached | 664 | 83.7% |
| Single Unit, Attached | 2 | 0.3% |
| 2 Unit Apartments | 8 | 1.0% |
| 3 or 4 Unit Apartments | 25 | 3.2% |
| 5 to 9 Unit Apartments | 28 | 3.5% |
| 10 or more Apartments | 23 | 2.9% |
| Mobile Home / Other | 43 | 5.4% |
| Total | 793 | 100.0% |
Housing Structures by Occupancy in Bolindale
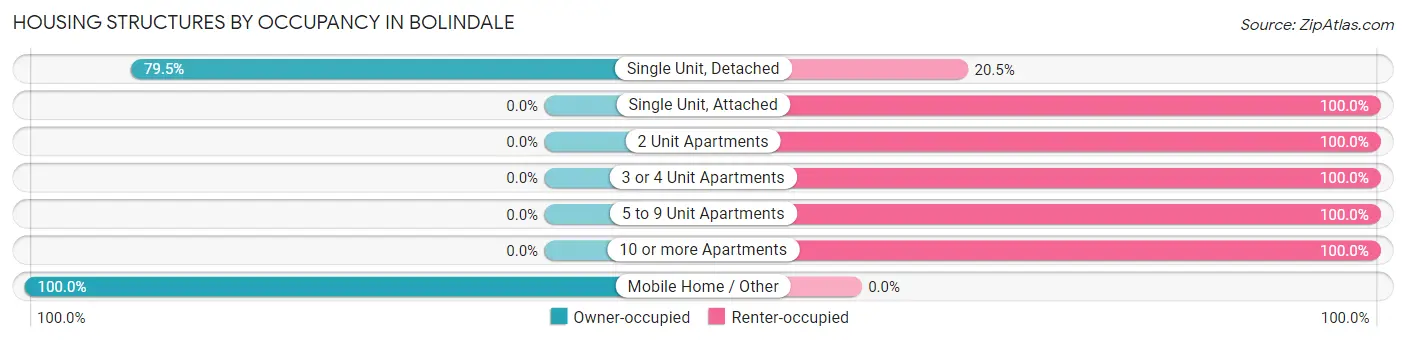
| Structure Type | Owner-occupied | Renter-occupied |
| Single Unit, Detached | 528 (79.5%) | 136 (20.5%) |
| Single Unit, Attached | 0 (0.0%) | 2 (100.0%) |
| 2 Unit Apartments | 0 (0.0%) | 8 (100.0%) |
| 3 or 4 Unit Apartments | 0 (0.0%) | 25 (100.0%) |
| 5 to 9 Unit Apartments | 0 (0.0%) | 28 (100.0%) |
| 10 or more Apartments | 0 (0.0%) | 23 (100.0%) |
| Mobile Home / Other | 43 (100.0%) | 0 (0.0%) |
| Total | 571 (72.0%) | 222 (28.0%) |
Housing Structures by Number of Rooms in Bolindale
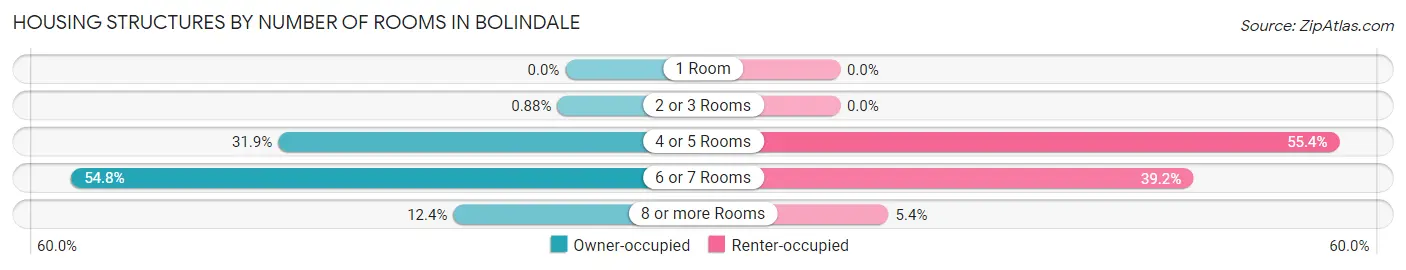
| Number of Rooms | Owner-occupied | Renter-occupied |
| 1 Room | 0 (0.0%) | 0 (0.0%) |
| 2 or 3 Rooms | 5 (0.9%) | 0 (0.0%) |
| 4 or 5 Rooms | 182 (31.9%) | 123 (55.4%) |
| 6 or 7 Rooms | 313 (54.8%) | 87 (39.2%) |
| 8 or more Rooms | 71 (12.4%) | 12 (5.4%) |
| Total | 571 (100.0%) | 222 (100.0%) |
Housing Structure by Heating Type in Bolindale
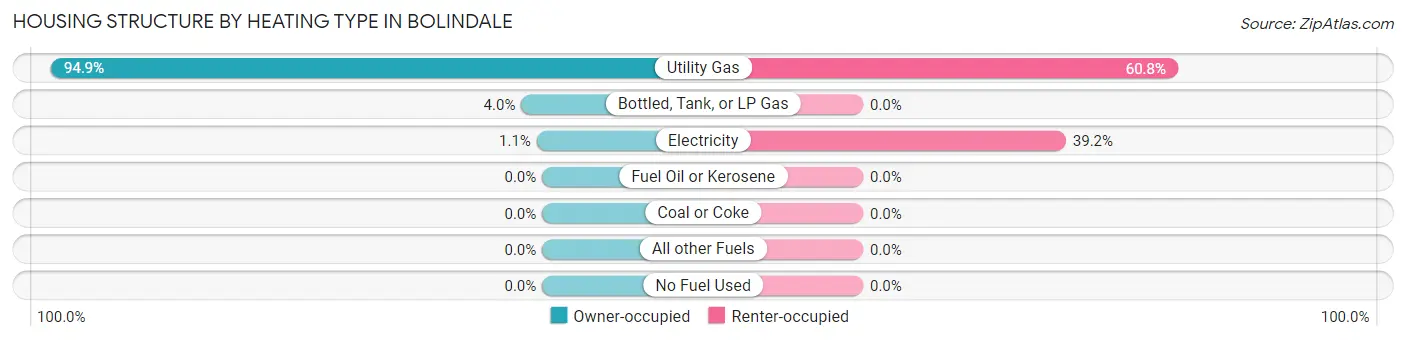
| Heating Type | Owner-occupied | Renter-occupied |
| Utility Gas | 542 (94.9%) | 135 (60.8%) |
| Bottled, Tank, or LP Gas | 23 (4.0%) | 0 (0.0%) |
| Electricity | 6 (1.1%) | 87 (39.2%) |
| Fuel Oil or Kerosene | 0 (0.0%) | 0 (0.0%) |
| Coal or Coke | 0 (0.0%) | 0 (0.0%) |
| All other Fuels | 0 (0.0%) | 0 (0.0%) |
| No Fuel Used | 0 (0.0%) | 0 (0.0%) |
| Total | 571 (100.0%) | 222 (100.0%) |
Household Vehicle Usage in Bolindale
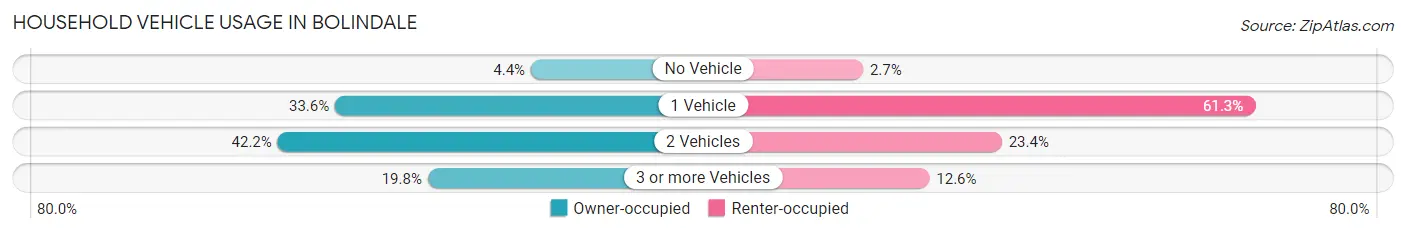
| Vehicles per Household | Owner-occupied | Renter-occupied |
| No Vehicle | 25 (4.4%) | 6 (2.7%) |
| 1 Vehicle | 192 (33.6%) | 136 (61.3%) |
| 2 Vehicles | 241 (42.2%) | 52 (23.4%) |
| 3 or more Vehicles | 113 (19.8%) | 28 (12.6%) |
| Total | 571 (100.0%) | 222 (100.0%) |
Real Estate & Mortgages in Bolindale
Real Estate and Mortgage Overview in Bolindale
| Characteristic | Without Mortgage | With Mortgage |
| Housing Units | 330 | 241 |
| Median Property Value | $77,700 | $107,700 |
| Median Household Income | $52,708 | $44 |
| Monthly Housing Costs | $378 | $0 |
| Real Estate Taxes | $1,144 | $0 |
Property Value by Mortgage Status in Bolindale
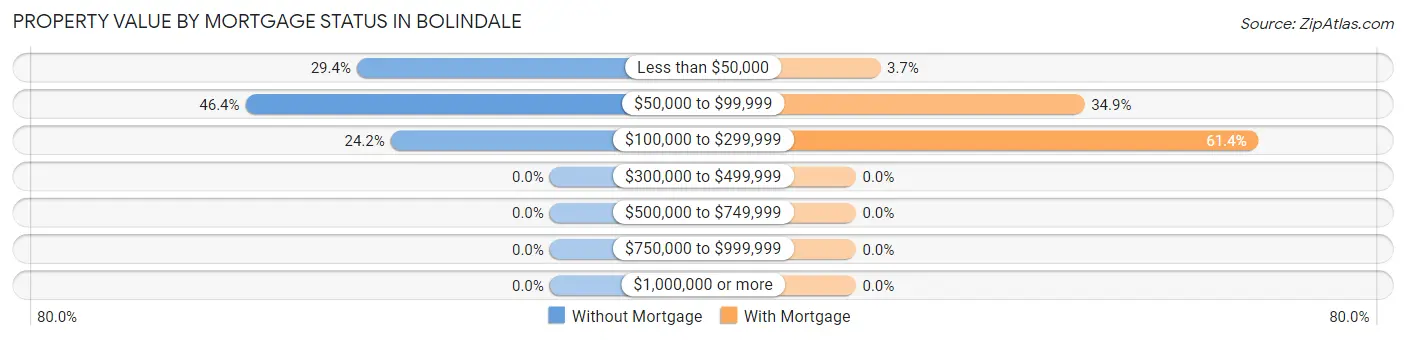
| Property Value | Without Mortgage | With Mortgage |
| Less than $50,000 | 97 (29.4%) | 9 (3.7%) |
| $50,000 to $99,999 | 153 (46.4%) | 84 (34.8%) |
| $100,000 to $299,999 | 80 (24.2%) | 148 (61.4%) |
| $300,000 to $499,999 | 0 (0.0%) | 0 (0.0%) |
| $500,000 to $749,999 | 0 (0.0%) | 0 (0.0%) |
| $750,000 to $999,999 | 0 (0.0%) | 0 (0.0%) |
| $1,000,000 or more | 0 (0.0%) | 0 (0.0%) |
| Total | 330 (100.0%) | 241 (100.0%) |
Household Income by Mortgage Status in Bolindale
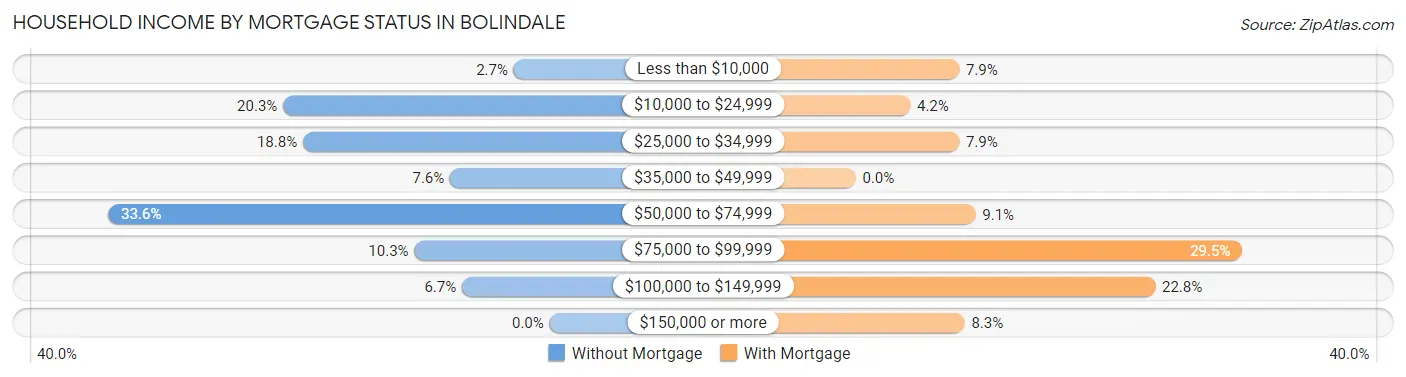
| Household Income | Without Mortgage | With Mortgage |
| Less than $10,000 | 9 (2.7%) | 19 (7.9%) |
| $10,000 to $24,999 | 67 (20.3%) | 10 (4.2%) |
| $25,000 to $34,999 | 62 (18.8%) | 19 (7.9%) |
| $35,000 to $49,999 | 25 (7.6%) | 0 (0.0%) |
| $50,000 to $74,999 | 111 (33.6%) | 22 (9.1%) |
| $75,000 to $99,999 | 34 (10.3%) | 71 (29.5%) |
| $100,000 to $149,999 | 22 (6.7%) | 55 (22.8%) |
| $150,000 or more | 0 (0.0%) | 20 (8.3%) |
| Total | 330 (100.0%) | 241 (100.0%) |
Property Value to Household Income Ratio in Bolindale
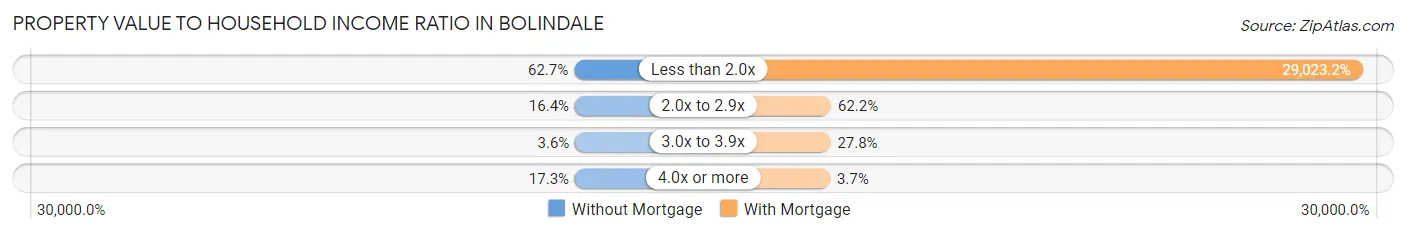
| Value-to-Income Ratio | Without Mortgage | With Mortgage |
| Less than 2.0x | 207 (62.7%) | 69,946 (29,023.2%) |
| 2.0x to 2.9x | 54 (16.4%) | 150 (62.2%) |
| 3.0x to 3.9x | 12 (3.6%) | 67 (27.8%) |
| 4.0x or more | 57 (17.3%) | 9 (3.7%) |
| Total | 330 (100.0%) | 241 (100.0%) |
Real Estate Taxes by Mortgage Status in Bolindale
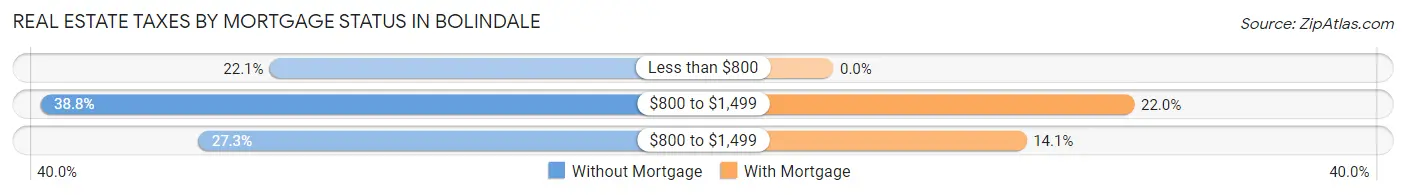
| Property Taxes | Without Mortgage | With Mortgage |
| Less than $800 | 73 (22.1%) | 0 (0.0%) |
| $800 to $1,499 | 128 (38.8%) | 53 (22.0%) |
| $800 to $1,499 | 90 (27.3%) | 34 (14.1%) |
| Total | 330 (100.0%) | 241 (100.0%) |
Health & Disability in Bolindale
Health Insurance Coverage by Age in Bolindale
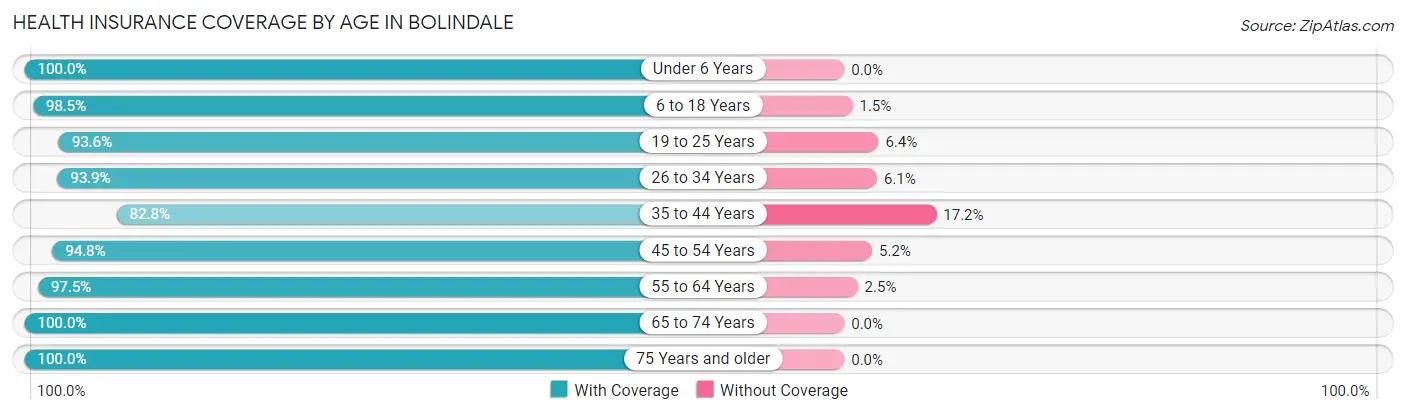
| Age Bracket | With Coverage | Without Coverage |
| Under 6 Years | 87 (100.0%) | 0 (0.0%) |
| 6 to 18 Years | 319 (98.5%) | 5 (1.5%) |
| 19 to 25 Years | 88 (93.6%) | 6 (6.4%) |
| 26 to 34 Years | 231 (93.9%) | 15 (6.1%) |
| 35 to 44 Years | 246 (82.8%) | 51 (17.2%) |
| 45 to 54 Years | 183 (94.8%) | 10 (5.2%) |
| 55 to 64 Years | 313 (97.5%) | 8 (2.5%) |
| 65 to 74 Years | 348 (100.0%) | 0 (0.0%) |
| 75 Years and older | 98 (100.0%) | 0 (0.0%) |
| Total | 1,913 (95.3%) | 95 (4.7%) |
Health Insurance Coverage by Citizenship Status in Bolindale
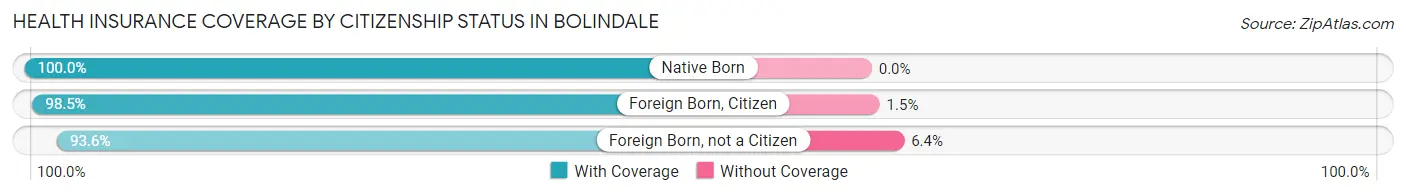
| Citizenship Status | With Coverage | Without Coverage |
| Native Born | 87 (100.0%) | 0 (0.0%) |
| Foreign Born, Citizen | 319 (98.5%) | 5 (1.5%) |
| Foreign Born, not a Citizen | 88 (93.6%) | 6 (6.4%) |
Health Insurance Coverage by Household Income in Bolindale
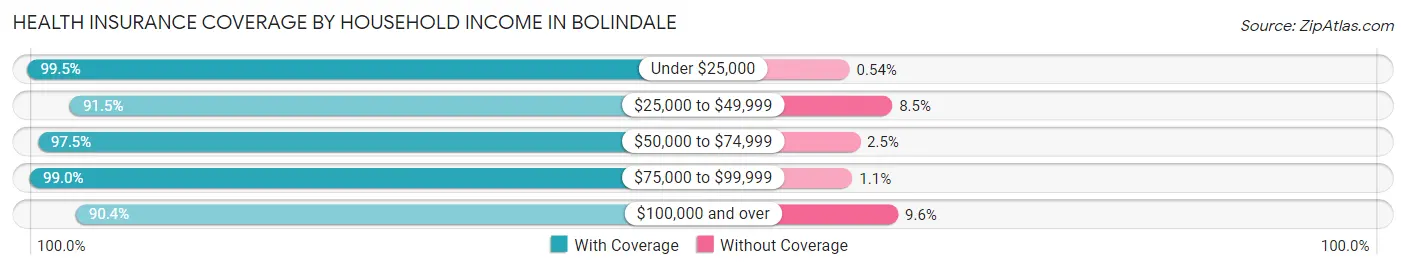
| Household Income | With Coverage | Without Coverage |
| Under $25,000 | 368 (99.5%) | 2 (0.5%) |
| $25,000 to $49,999 | 215 (91.5%) | 20 (8.5%) |
| $50,000 to $74,999 | 510 (97.5%) | 13 (2.5%) |
| $75,000 to $99,999 | 284 (99.0%) | 3 (1.1%) |
| $100,000 and over | 536 (90.4%) | 57 (9.6%) |
Public vs Private Health Insurance Coverage by Age in Bolindale
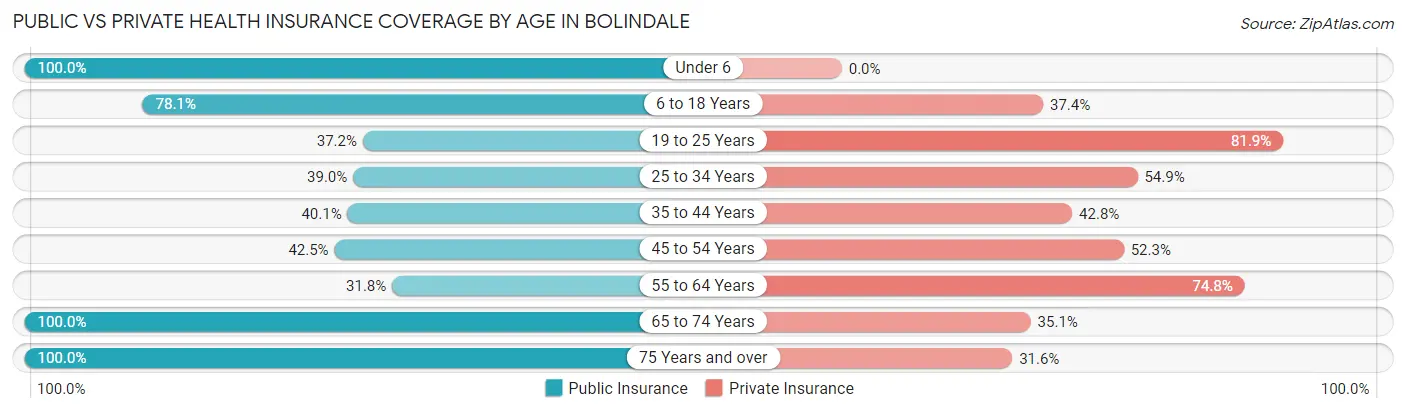
| Age Bracket | Public Insurance | Private Insurance |
| Under 6 | 87 (100.0%) | 0 (0.0%) |
| 6 to 18 Years | 253 (78.1%) | 121 (37.3%) |
| 19 to 25 Years | 35 (37.2%) | 77 (81.9%) |
| 25 to 34 Years | 96 (39.0%) | 135 (54.9%) |
| 35 to 44 Years | 119 (40.1%) | 127 (42.8%) |
| 45 to 54 Years | 82 (42.5%) | 101 (52.3%) |
| 55 to 64 Years | 102 (31.8%) | 240 (74.8%) |
| 65 to 74 Years | 348 (100.0%) | 122 (35.1%) |
| 75 Years and over | 98 (100.0%) | 31 (31.6%) |
| Total | 1,220 (60.8%) | 954 (47.5%) |
Disability Status by Sex by Age in Bolindale
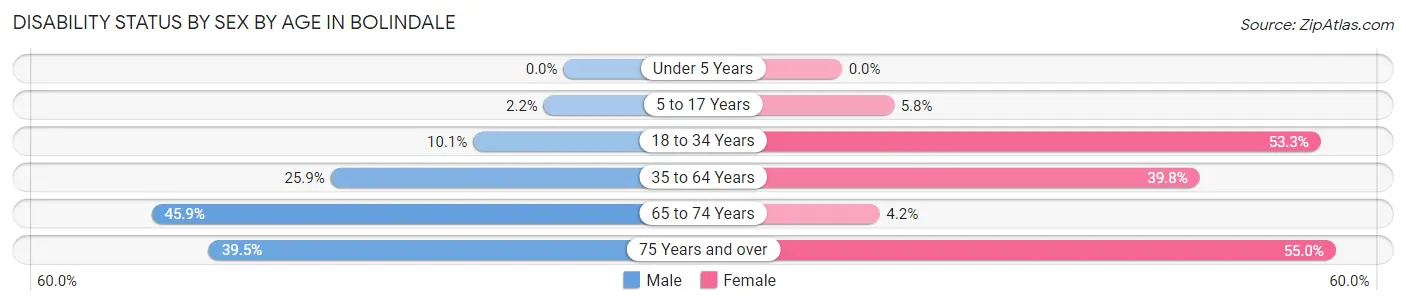
| Age Bracket | Male | Female |
| Under 5 Years | 0 (0.0%) | 0 (0.0%) |
| 5 to 17 Years | 3 (2.2%) | 10 (5.8%) |
| 18 to 34 Years | 19 (10.1%) | 88 (53.3%) |
| 35 to 64 Years | 112 (25.9%) | 151 (39.8%) |
| 65 to 74 Years | 72 (45.9%) | 8 (4.2%) |
| 75 Years and over | 15 (39.5%) | 33 (55.0%) |
Disability Class by Sex by Age in Bolindale
Disability Class: Hearing Difficulty
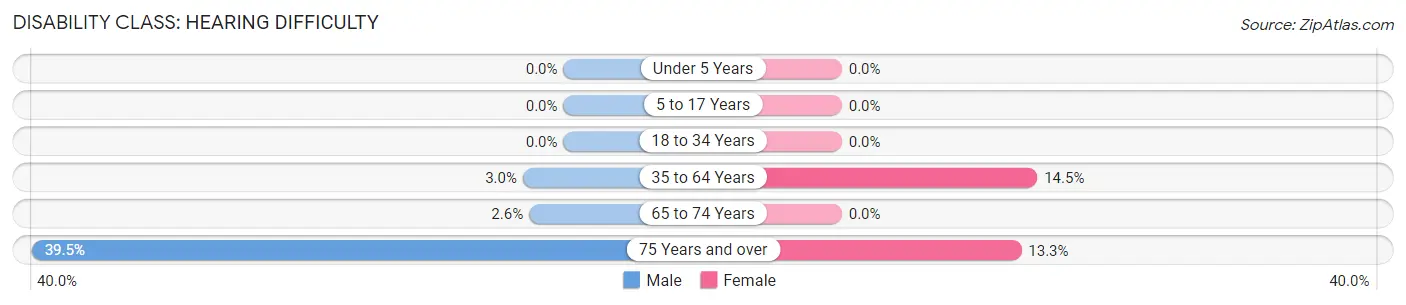
| Age Bracket | Male | Female |
| Under 5 Years | 0 (0.0%) | 0 (0.0%) |
| 5 to 17 Years | 0 (0.0%) | 0 (0.0%) |
| 18 to 34 Years | 0 (0.0%) | 0 (0.0%) |
| 35 to 64 Years | 13 (3.0%) | 55 (14.5%) |
| 65 to 74 Years | 4 (2.5%) | 0 (0.0%) |
| 75 Years and over | 15 (39.5%) | 8 (13.3%) |
Disability Class: Vision Difficulty
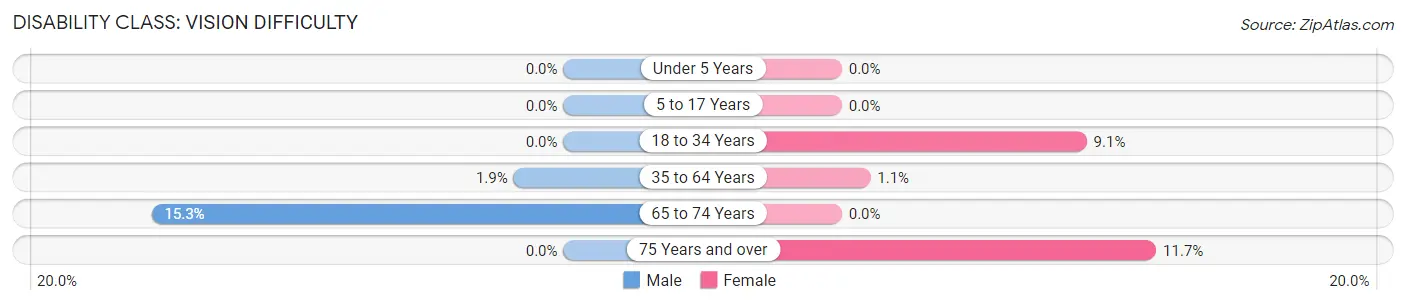
| Age Bracket | Male | Female |
| Under 5 Years | 0 (0.0%) | 0 (0.0%) |
| 5 to 17 Years | 0 (0.0%) | 0 (0.0%) |
| 18 to 34 Years | 0 (0.0%) | 15 (9.1%) |
| 35 to 64 Years | 8 (1.8%) | 4 (1.1%) |
| 65 to 74 Years | 24 (15.3%) | 0 (0.0%) |
| 75 Years and over | 0 (0.0%) | 7 (11.7%) |
Disability Class: Cognitive Difficulty
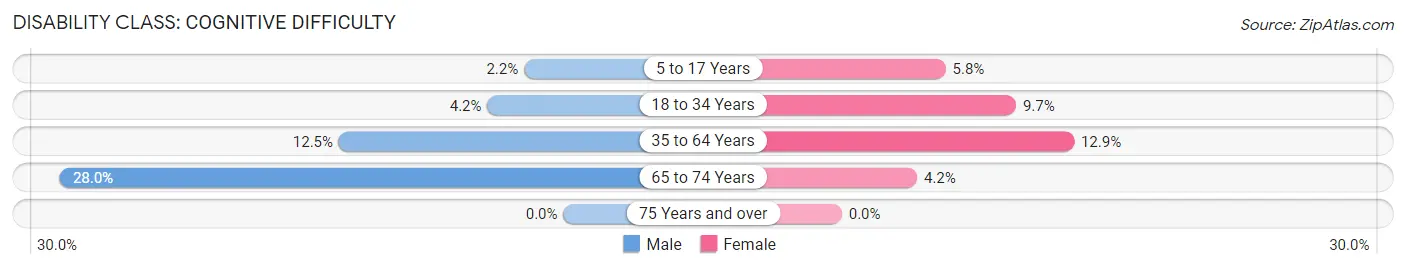
| Age Bracket | Male | Female |
| 5 to 17 Years | 3 (2.2%) | 10 (5.8%) |
| 18 to 34 Years | 8 (4.2%) | 16 (9.7%) |
| 35 to 64 Years | 54 (12.5%) | 49 (12.9%) |
| 65 to 74 Years | 44 (28.0%) | 8 (4.2%) |
| 75 Years and over | 0 (0.0%) | 0 (0.0%) |
Disability Class: Ambulatory Difficulty
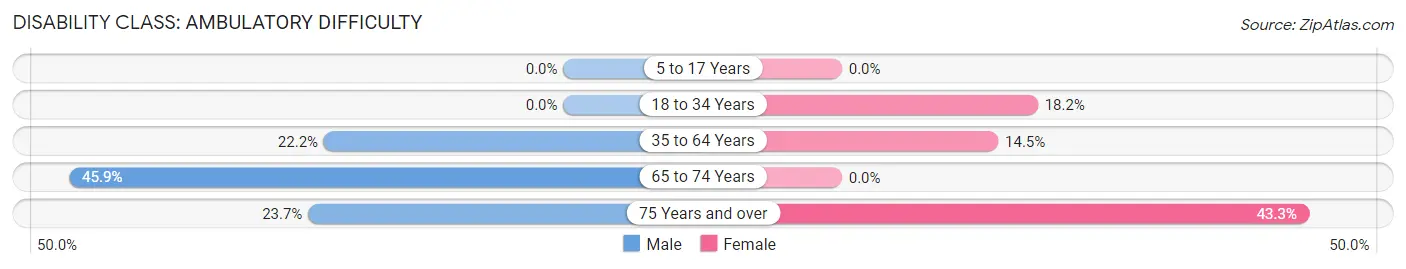
| Age Bracket | Male | Female |
| 5 to 17 Years | 0 (0.0%) | 0 (0.0%) |
| 18 to 34 Years | 0 (0.0%) | 30 (18.2%) |
| 35 to 64 Years | 96 (22.2%) | 55 (14.5%) |
| 65 to 74 Years | 72 (45.9%) | 0 (0.0%) |
| 75 Years and over | 9 (23.7%) | 26 (43.3%) |
Disability Class: Self-Care Difficulty
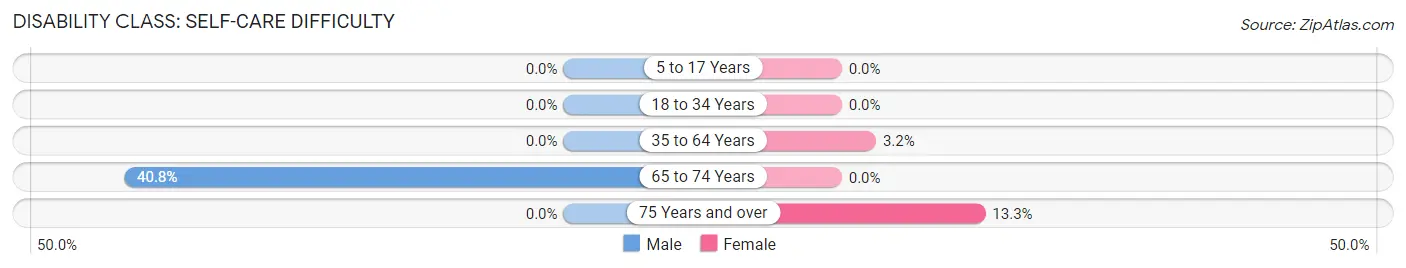
| Age Bracket | Male | Female |
| 5 to 17 Years | 0 (0.0%) | 0 (0.0%) |
| 18 to 34 Years | 0 (0.0%) | 0 (0.0%) |
| 35 to 64 Years | 0 (0.0%) | 12 (3.2%) |
| 65 to 74 Years | 64 (40.8%) | 0 (0.0%) |
| 75 Years and over | 0 (0.0%) | 8 (13.3%) |
Technology Access in Bolindale
Computing Device Access in Bolindale
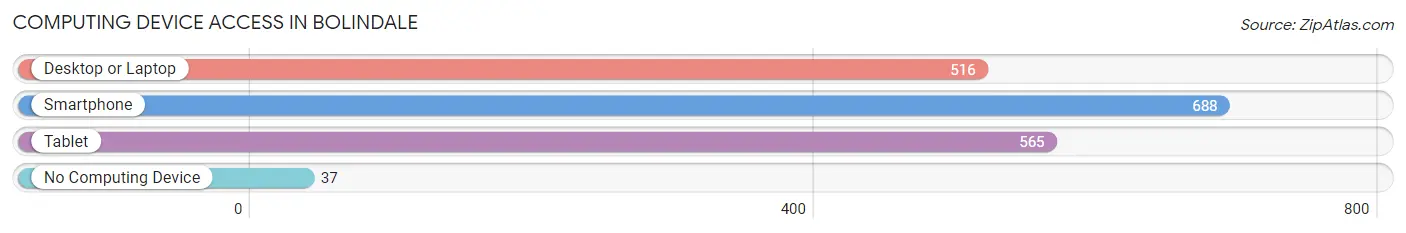
| Device Type | # Households | % Households |
| Desktop or Laptop | 516 | 65.1% |
| Smartphone | 688 | 86.8% |
| Tablet | 565 | 71.3% |
| No Computing Device | 37 | 4.7% |
| Total | 793 | 100.0% |
Internet Access in Bolindale
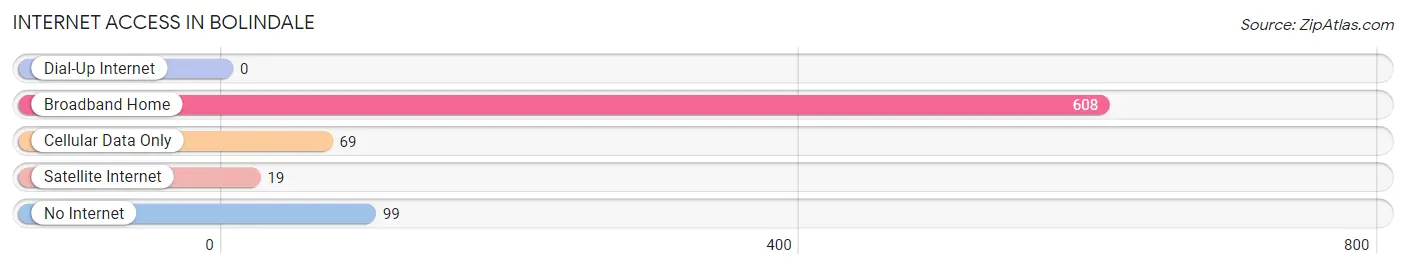
| Internet Type | # Households | % Households |
| Dial-Up Internet | 0 | 0.0% |
| Broadband Home | 608 | 76.7% |
| Cellular Data Only | 69 | 8.7% |
| Satellite Internet | 19 | 2.4% |
| No Internet | 99 | 12.5% |
| Total | 793 | 100.0% |
Bolindale Summary
Bolindale is a small village located in the state of Ohio, United States. It is situated in the county of Belmont, and is part of the Wheeling Metropolitan Statistical Area. The village has a population of approximately 500 people, and is located in the Appalachian region of the state.
History
Bolindale was founded in 1817 by a group of settlers from Pennsylvania. The village was originally known as “Bolin’s Dale”, after the family who owned the land. The village was officially incorporated in 1837, and the name was changed to Bolindale.
The village was a small farming community for many years, and the main industry was coal mining. The coal mines were located in the nearby hills, and the miners would travel to the village to purchase supplies. The village also had a few small businesses, such as a general store and a blacksmith shop.
In the late 19th century, the village began to grow and develop. The railroad was extended to Bolindale in 1891, and this allowed for the transportation of goods and people to and from the village. The village also had a post office, which was established in 1892.
Geography
Bolindale is located in the Appalachian region of Ohio, and is situated in the county of Belmont. The village is located in the northern part of the state, and is approximately 30 miles from the city of Wheeling. The village is situated in a valley, and is surrounded by hills and forests. The nearest major city is Pittsburgh, which is located approximately 70 miles away.
The village has a total area of 0.3 square miles, all of which is land. The village is located at an elevation of 890 feet above sea level. The climate in Bolindale is classified as humid continental, and the average temperature in the summer is around 75 degrees Fahrenheit.
Economy
The economy of Bolindale is largely based on agriculture and tourism. The village is home to several farms, which produce a variety of crops, including corn, soybeans, and wheat. The village also has a few small businesses, such as a general store and a gas station.
The village is also a popular tourist destination, and is home to several attractions, such as the Bolindale Historical Museum and the Bolindale Nature Center. The village also hosts several festivals throughout the year, such as the Bolindale Harvest Festival and the Bolindale Music Festival.
Demographics
As of the 2010 census, the population of Bolindale was 498 people. The racial makeup of the village was 97.2% White, 0.6% African American, 0.2% Native American, 0.2% Asian, 0.2% from other races, and 1.8% from two or more races. The median household income in the village was $37,500, and the median age was 43 years.
Conclusion
Bolindale is a small village located in the state of Ohio, United States. It is situated in the county of Belmont, and is part of the Wheeling Metropolitan Statistical Area. The village has a population of approximately 500 people, and is located in the Appalachian region of the state. The economy of Bolindale is largely based on agriculture and tourism, and the village is home to several farms and attractions. The racial makeup of the village is predominantly White, and the median household income is $37,500. Bolindale is a small but vibrant village, and is a great place to visit or live.
Common Questions
What is Per Capita Income in Bolindale?
Per Capita income in Bolindale is $26,838.
What is the Median Family Income in Bolindale?
Median Family Income in Bolindale is $56,198.
What is the Median Household income in Bolindale?
Median Household Income in Bolindale is $56,653.
What is Income or Wage Gap in Bolindale?
Income or Wage Gap in Bolindale is 42.8%.
Women in Bolindale earn 57.2 cents for every dollar earned by a man.
What is Inequality or Gini Index in Bolindale?
Inequality or Gini Index in Bolindale is 0.40.
What is the Total Population of Bolindale?
Total Population of Bolindale is 2,008.
What is the Total Male Population of Bolindale?
Total Male Population of Bolindale is 995.
What is the Total Female Population of Bolindale?
Total Female Population of Bolindale is 1,013.
What is the Ratio of Males per 100 Females in Bolindale?
There are 98.22 Males per 100 Females in Bolindale.
What is the Ratio of Females per 100 Males in Bolindale?
There are 101.81 Females per 100 Males in Bolindale.
What is the Median Population Age in Bolindale?
Median Population Age in Bolindale is 42.5 Years.
What is the Average Family Size in Bolindale
Average Family Size in Bolindale is 3.0 People.
What is the Average Household Size in Bolindale
Average Household Size in Bolindale is 2.5 People.
How Large is the Labor Force in Bolindale?
There are 840 People in the Labor Forcein in Bolindale.
What is the Percentage of People in the Labor Force in Bolindale?
50.7% of People are in the Labor Force in Bolindale.
What is the Unemployment Rate in Bolindale?
Unemployment Rate in Bolindale is 1.9%.