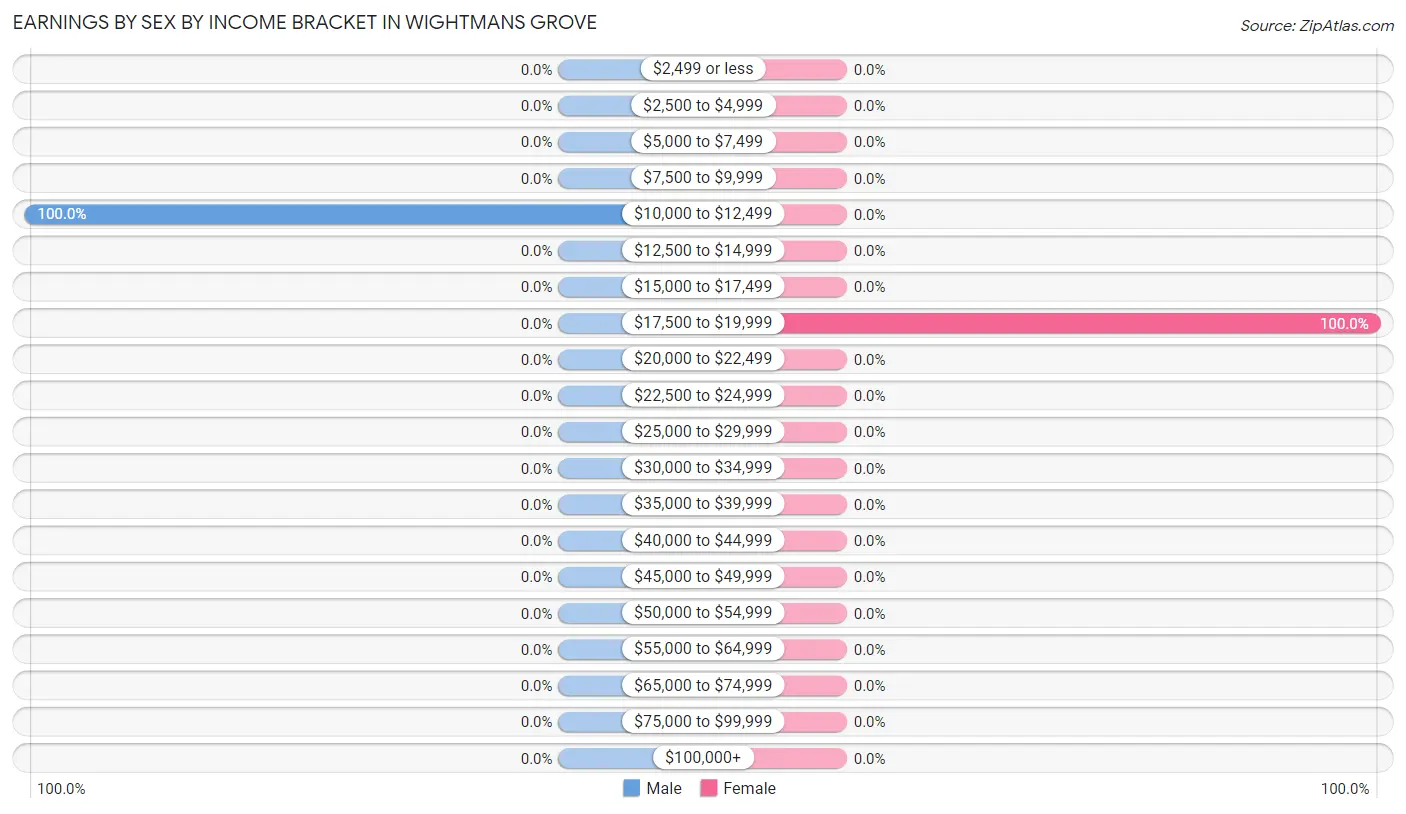
Earnings by Sex by Income Bracket in Wightmans Grove
The most common earnings brackets in Wightmans Grove are $10,000 to $12,499 for men (8 | 100.0%) and $17,500 to $19,999 for women (7 | 100.0%).
Income
Male
Female
$2,499 or less
0 (0.0%)
0 (0.0%)
$2,500 to $4,999
0 (0.0%)
0 (0.0%)
$5,000 to $7,499
0 (0.0%)
0 (0.0%)
$7,500 to $9,999
0 (0.0%)
0 (0.0%)
$10,000 to $12,499
8 (100.0%)
0 (0.0%)
$12,500 to $14,999
0 (0.0%)
0 (0.0%)
$15,000 to $17,499
0 (0.0%)
0 (0.0%)
$17,500 to $19,999
0 (0.0%)
7 (100.0%)
$20,000 to $22,499
0 (0.0%)
0 (0.0%)
$22,500 to $24,999
0 (0.0%)
0 (0.0%)
$25,000 to $29,999
0 (0.0%)
0 (0.0%)
$30,000 to $34,999
0 (0.0%)
0 (0.0%)
$35,000 to $39,999
0 (0.0%)
0 (0.0%)
$40,000 to $44,999
0 (0.0%)
0 (0.0%)
$45,000 to $49,999
0 (0.0%)
0 (0.0%)
$50,000 to $54,999
0 (0.0%)
0 (0.0%)
$55,000 to $64,999
0 (0.0%)
0 (0.0%)
$65,000 to $74,999
0 (0.0%)
0 (0.0%)
$75,000 to $99,999
0 (0.0%)
0 (0.0%)
$100,000+
0 (0.0%)
0 (0.0%)
Total
8 (100.0%)
7 (100.0%)
Earnings by Sex by Educational Attainment in Wightmans Grove
Educational Attainment
Male Income
Female Income
Less than High School
-
-
High School Diploma
-
-
College or Associate's Degree
-
-
Bachelor's Degree
-
-
Graduate Degree
-
-
Total
-
-
Family Income in Wightmans Grove
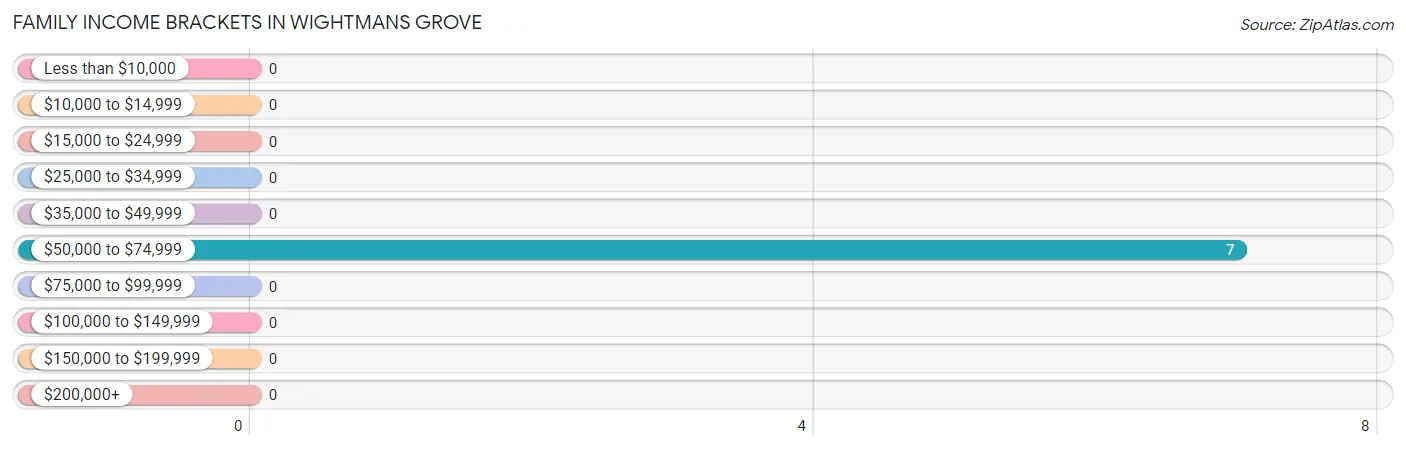
Family Income Brackets in Wightmans Grove
According to the Wightmans Grove family income data, there are 7 families falling into the $50,000 to $74,999 income range, which is the most common income bracket and makes up 100.0% of all families.
Income Bracket
# Families
% Families
Less than $10,000
0
0.0%
$10,000 to $14,999
0
0.0%
$15,000 to $24,999
0
0.0%
$25,000 to $34,999
0
0.0%
$35,000 to $49,999
0
0.0%
$50,000 to $74,999
7
100.0%
$75,000 to $99,999
0
0.0%
$100,000 to $149,999
0
0.0%
$150,000 to $199,999
0
0.0%
$200,000+
0
0.0%
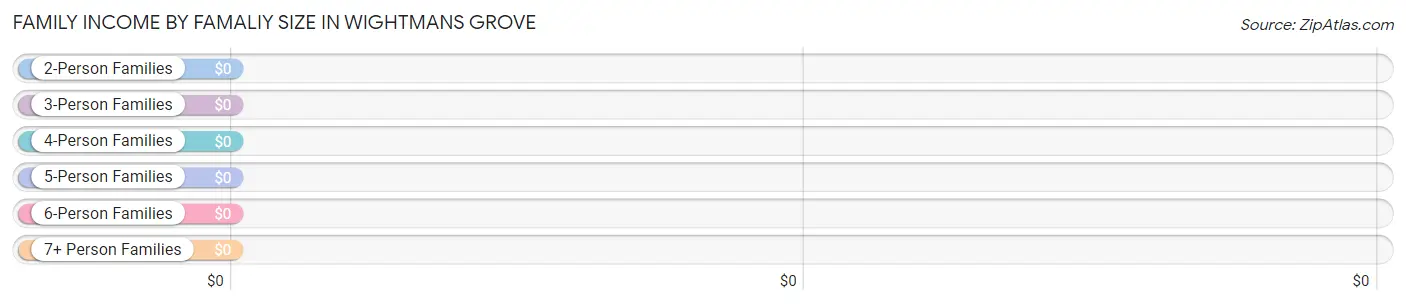
Family Income by Famaliy Size in Wightmans Grove
Income Bracket
# Families
Median Income
2-Person Families
7 (100.0%)
$0
3-Person Families
0 (0.0%)
$0
4-Person Families
0 (0.0%)
$0
5-Person Families
0 (0.0%)
$0
6-Person Families
0 (0.0%)
$0
7+ Person Families
0 (0.0%)
$0
Total
7 (100.0%)
$0
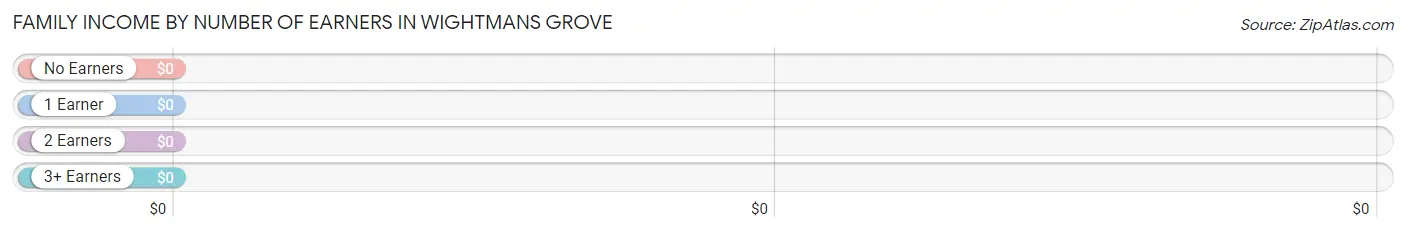
Family Income by Number of Earners in Wightmans Grove
Number of Earners
# Families
Median Income
No Earners
0 (0.0%)
$0
1 Earner
0 (0.0%)
$0
2 Earners
7 (100.0%)
$0
3+ Earners
0 (0.0%)
$0
Total
7 (100.0%)
$0
Household Income in Wightmans Grove
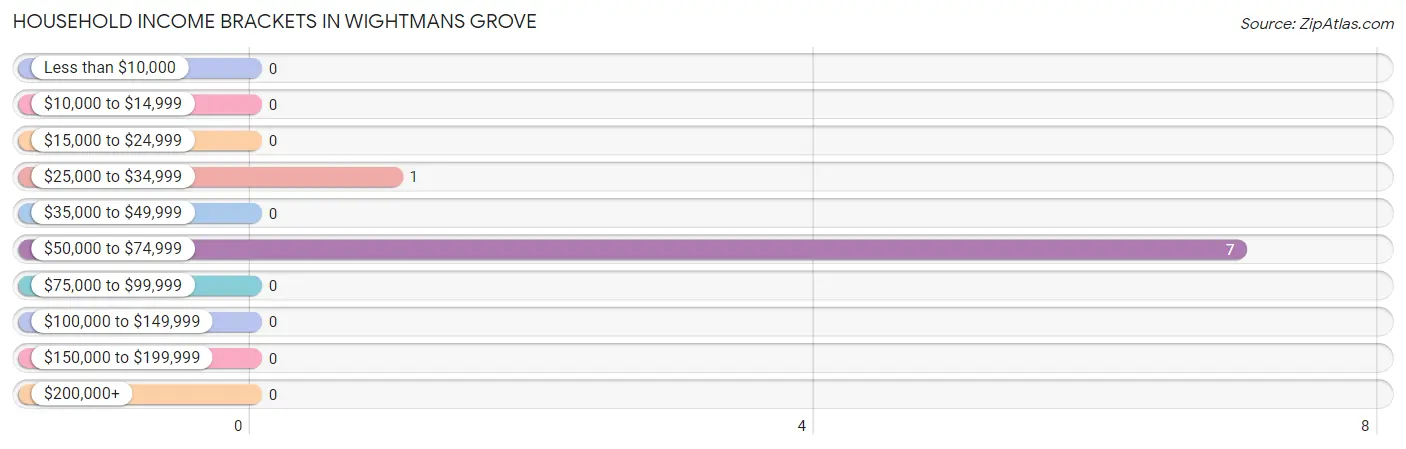
Household Income Brackets in Wightmans Grove
With 7 households falling in the category, the $50,000 to $74,999 income range is the most frequent in Wightmans Grove, accounting for 87.5% of all households.
Income Bracket
# Households
% Households
Less than $10,000
0
0.0%
$10,000 to $14,999
0
0.0%
$15,000 to $24,999
0
0.0%
$25,000 to $34,999
1
12.5%
$35,000 to $49,999
0
0.0%
$50,000 to $74,999
7
87.5%
$75,000 to $99,999
0
0.0%
$100,000 to $149,999
0
0.0%
$150,000 to $199,999
0
0.0%
$200,000+
0
0.0%
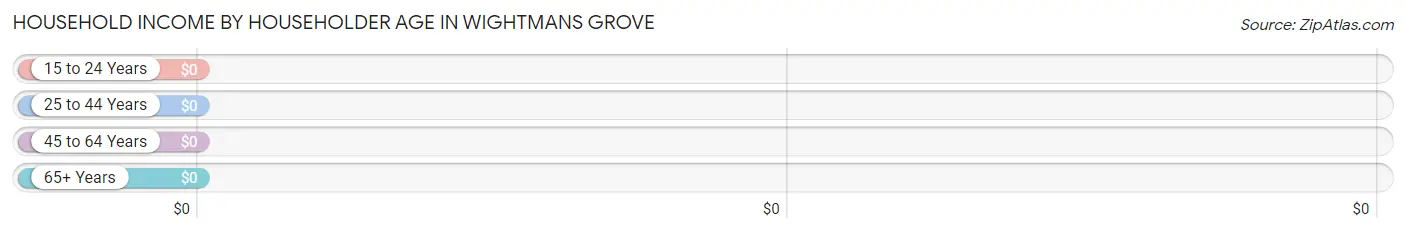
Household Income by Householder Age in Wightmans Grove
Income Bracket
# Households
Median Income
15 to 24 Years
0 (0.0%)
$0
25 to 44 Years
0 (0.0%)
$0
45 to 64 Years
7 (87.5%)
$0
65+ Years
1 (12.5%)
$0
Total
8 (100.0%)
$0
Poverty in Wightmans Grove
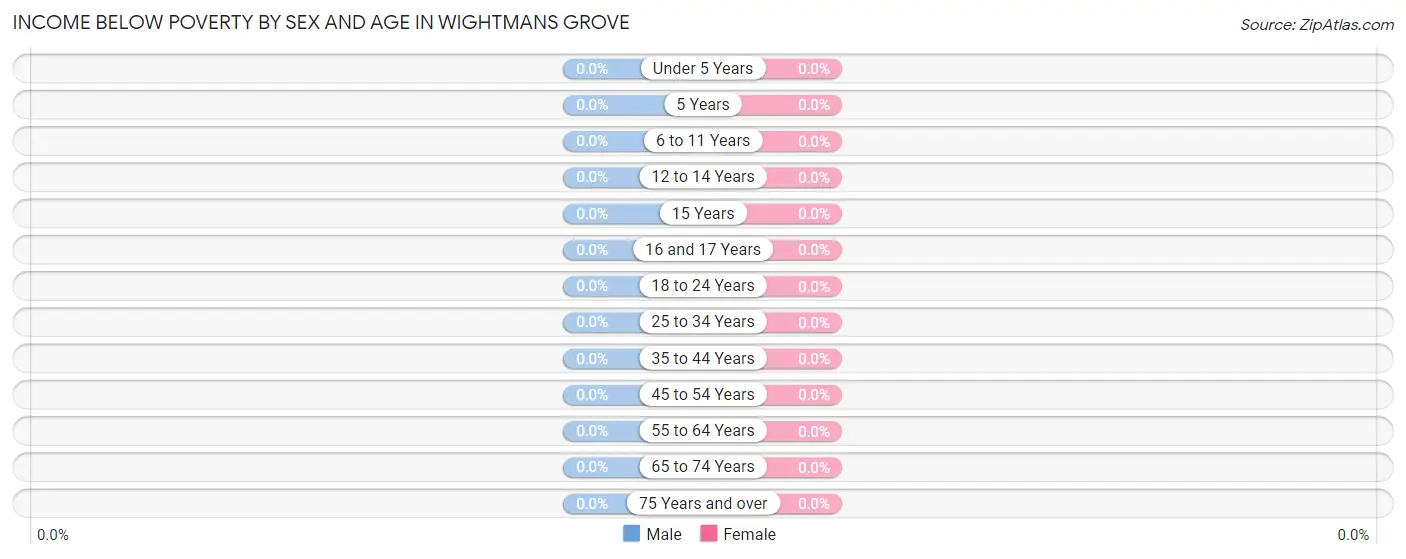
Income Below Poverty by Sex and Age in Wightmans Grove
Age Bracket
Male
Female
Under 5 Years
0 (0.0%)
0 (0.0%)
5 Years
0 (0.0%)
0 (0.0%)
6 to 11 Years
0 (0.0%)
0 (0.0%)
12 to 14 Years
0 (0.0%)
0 (0.0%)
15 Years
0 (0.0%)
0 (0.0%)
16 and 17 Years
0 (0.0%)
0 (0.0%)
18 to 24 Years
0 (0.0%)
0 (0.0%)
25 to 34 Years
0 (0.0%)
0 (0.0%)
35 to 44 Years
0 (0.0%)
0 (0.0%)
45 to 54 Years
0 (0.0%)
0 (0.0%)
55 to 64 Years
0 (0.0%)
0 (0.0%)
65 to 74 Years
0 (0.0%)
0 (0.0%)
75 Years and over
0 (0.0%)
0 (0.0%)
Total
0 (0.0%)
0 (0.0%)
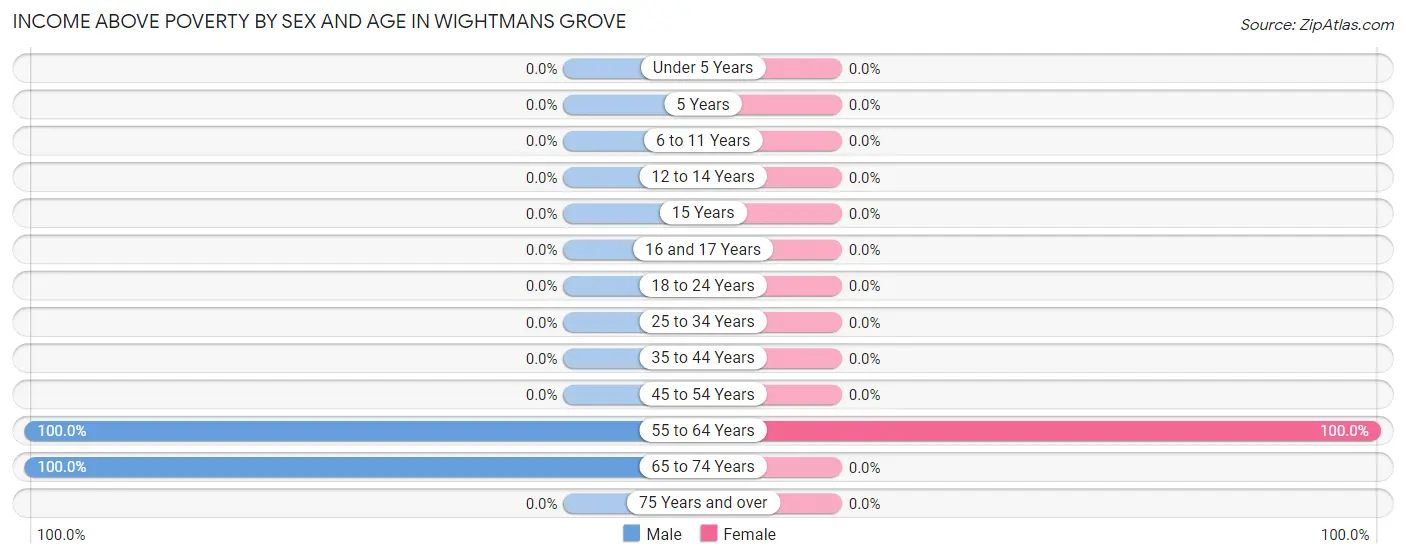
Income Above Poverty by Sex and Age in Wightmans Grove
According to the poverty statistics in Wightmans Grove, males aged 55 to 64 years and females aged 55 to 64 years are the age groups that are most secure financially, with 100.0% of males and 100.0% of females in these age groups living above the poverty line.
Age Bracket
Male
Female
Under 5 Years
0 (0.0%)
0 (0.0%)
5 Years
0 (0.0%)
0 (0.0%)
6 to 11 Years
0 (0.0%)
0 (0.0%)
12 to 14 Years
0 (0.0%)
0 (0.0%)
15 Years
0 (0.0%)
0 (0.0%)
16 and 17 Years
0 (0.0%)
0 (0.0%)
18 to 24 Years
0 (0.0%)
0 (0.0%)
25 to 34 Years
0 (0.0%)
0 (0.0%)
35 to 44 Years
0 (0.0%)
0 (0.0%)
45 to 54 Years
0 (0.0%)
0 (0.0%)
55 to 64 Years
8 (100.0%)
7 (100.0%)
65 to 74 Years
1 (100.0%)
0 (0.0%)
75 Years and over
0 (0.0%)
0 (0.0%)
Total
9 (100.0%)
7 (100.0%)
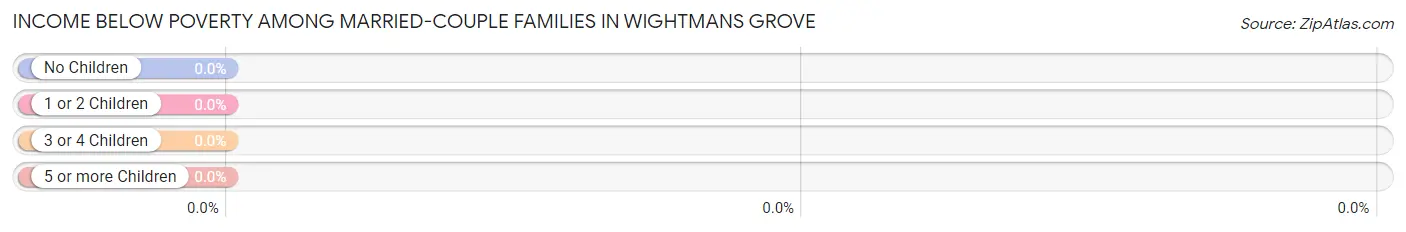
Income Below Poverty Among Married-Couple Families in Wightmans Grove
Children
Above Poverty
Below Poverty
No Children
7 (100.0%)
0 (0.0%)
1 or 2 Children
0 (0.0%)
0 (0.0%)
3 or 4 Children
0 (0.0%)
0 (0.0%)
5 or more Children
0 (0.0%)
0 (0.0%)
Total
7 (100.0%)
0 (0.0%)
Income Below Poverty Among Single-Parent Households in Wightmans Grove
Children
Single Father
Single Mother
No Children
0 (0.0%)
0 (0.0%)
1 or 2 Children
0 (0.0%)
0 (0.0%)
3 or 4 Children
0 (0.0%)
0 (0.0%)
5 or more Children
0 (0.0%)
0 (0.0%)
Total
0 (0.0%)
0 (0.0%)
Income Below Poverty Among Married-Couple vs Single-Parent Households in Wightmans Grove
Children
Married-Couple Families
Single-Parent Households
No Children
0 (0.0%)
0 (0.0%)
1 or 2 Children
0 (0.0%)
0 (0.0%)
3 or 4 Children
0 (0.0%)
0 (0.0%)
5 or more Children
0 (0.0%)
0 (0.0%)
Total
0 (0.0%)
0 (0.0%)
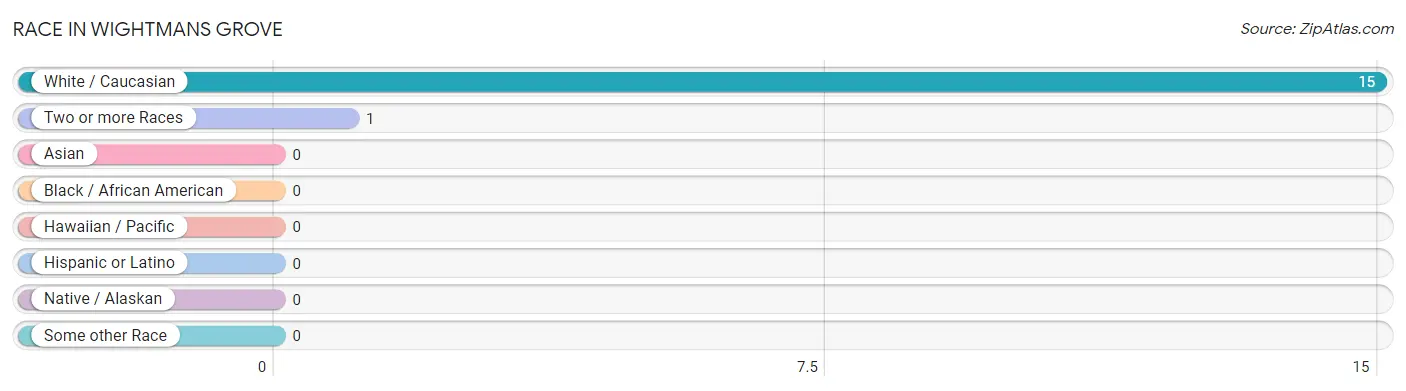
Race in Wightmans Grove
The most populous races in Wightmans Grove are White / Caucasian (15 | 93.8%), and Two or more Races (1 | 6.2%).
Race
# Population
% Population
Asian
0
0.0%
Black / African American
0
0.0%
Hawaiian / Pacific
0
0.0%
Hispanic or Latino
0
0.0%
Native / Alaskan
0
0.0%
White / Caucasian
15
93.8%
Two or more Races
1
6.2%
Some other Race
0
0.0%
Total
16
100.0%
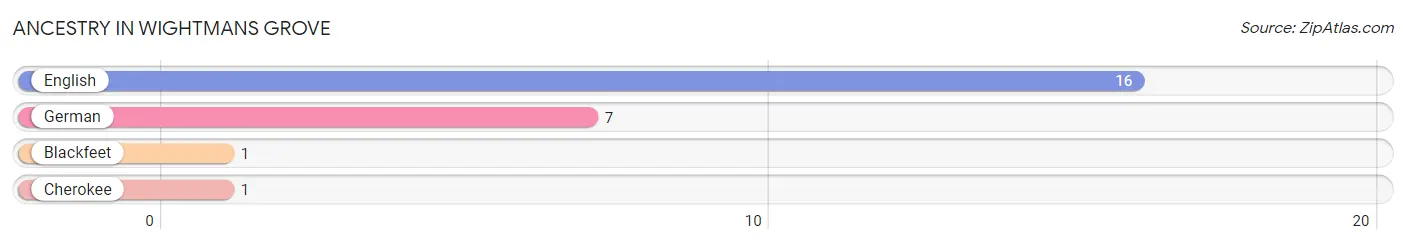
Ancestry in Wightmans Grove
The most populous ancestries reported in Wightmans Grove are English (16 | 100.0%), German (7 | 43.8%), Blackfeet (1 | 6.2%), and Cherokee (1 | 6.2%), together accounting for 156.2% of all Wightmans Grove residents.
Ancestry
# Population
% Population
Blackfeet
1
6.2%
Cherokee
1
6.2%
English
16
100.0%
German
7
43.8%
View All 4 Rows
Immigrants in Wightmans Grove
Immigration Origin
# Population
% Population
View All 0 Rows
Sex and Age in Wightmans Grove
Sex and Age in Wightmans Grove
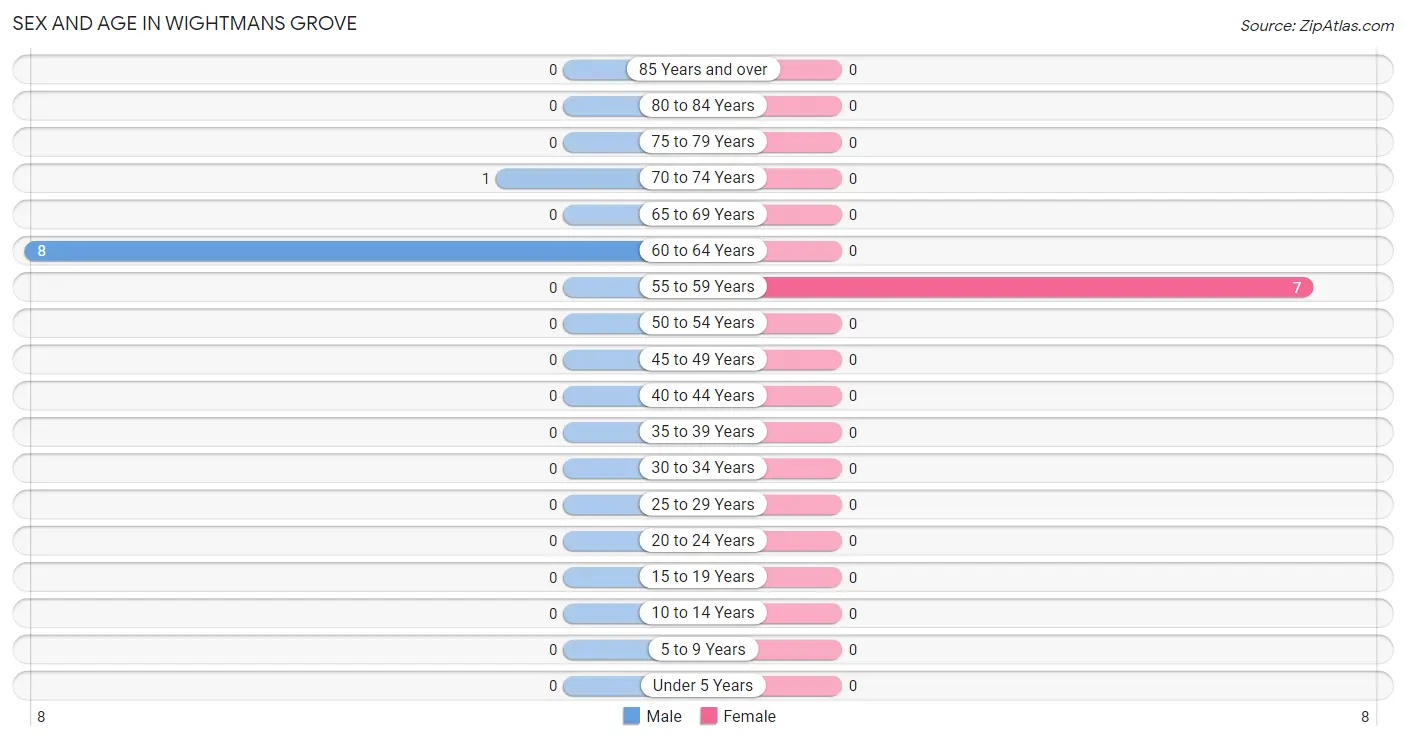
The most populous age groups in Wightmans Grove are 60 to 64 Years (8 | 88.9%) for men and 55 to 59 Years (7 | 100.0%) for women.
Age Bracket
Male
Female
Under 5 Years
0 (0.0%)
0 (0.0%)
5 to 9 Years
0 (0.0%)
0 (0.0%)
10 to 14 Years
0 (0.0%)
0 (0.0%)
15 to 19 Years
0 (0.0%)
0 (0.0%)
20 to 24 Years
0 (0.0%)
0 (0.0%)
25 to 29 Years
0 (0.0%)
0 (0.0%)
30 to 34 Years
0 (0.0%)
0 (0.0%)
35 to 39 Years
0 (0.0%)
0 (0.0%)
40 to 44 Years
0 (0.0%)
0 (0.0%)
45 to 49 Years
0 (0.0%)
0 (0.0%)
50 to 54 Years
0 (0.0%)
0 (0.0%)
55 to 59 Years
0 (0.0%)
7 (100.0%)
60 to 64 Years
8 (88.9%)
0 (0.0%)
65 to 69 Years
0 (0.0%)
0 (0.0%)
70 to 74 Years
1 (11.1%)
0 (0.0%)
75 to 79 Years
0 (0.0%)
0 (0.0%)
80 to 84 Years
0 (0.0%)
0 (0.0%)
85 Years and over
0 (0.0%)
0 (0.0%)
Total
9 (100.0%)
7 (100.0%)
Families and Households in Wightmans Grove
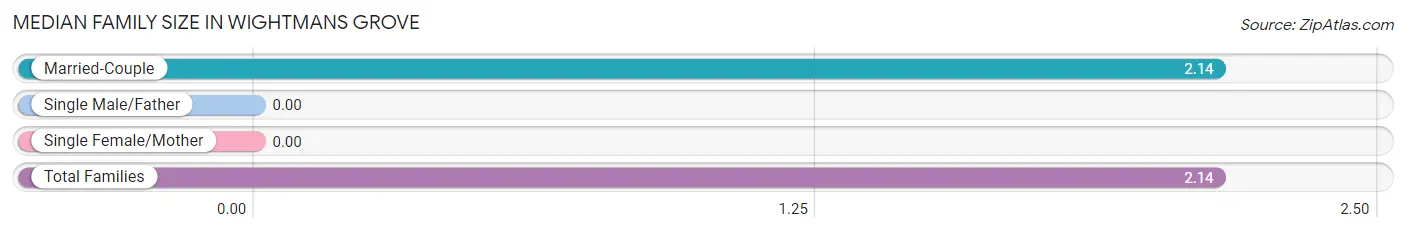
Median Family Size in Wightmans Grove
Family Type
# Families
Family Size
Married-Couple
7 (100.0%)
2.14
Single Male/Father
0 (0.0%)
-
Single Female/Mother
0 (0.0%)
-
Total Families
7 (100.0%)
2.14
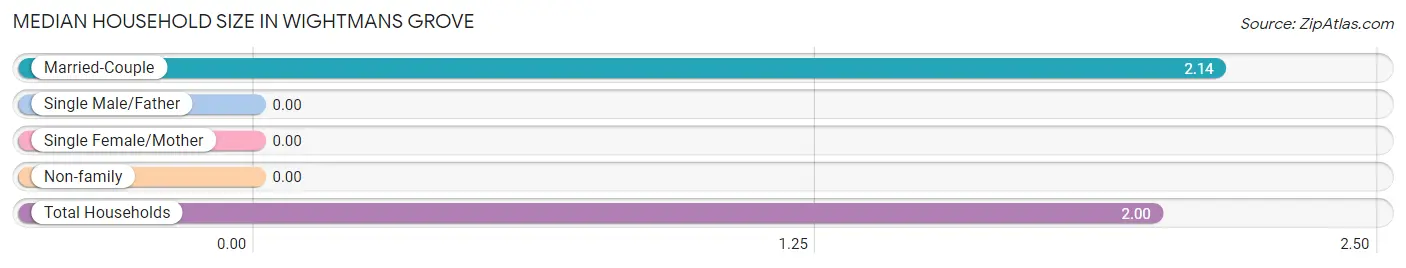
Median Household Size in Wightmans Grove
Household Type
# Households
Household Size
Married-Couple
7 (87.5%)
2.14
Single Male/Father
0 (0.0%)
-
Single Female/Mother
0 (0.0%)
-
Non-family
1 (12.5%)
-
Total Households
8 (100.0%)
2.00
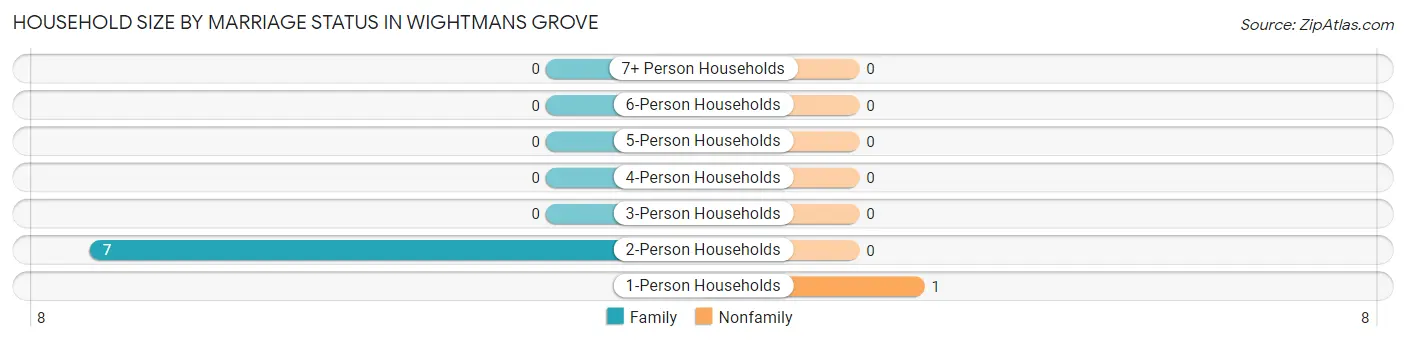
Household Size by Marriage Status in Wightmans Grove
Out of a total of 8 households in Wightmans Grove, 7 (87.5%) are family households, while 1 (12.5%) are nonfamily households. The most numerous type of family households are 2-person households, comprising 7, and the most common type of nonfamily households are 1-person households, comprising 1.
Household Size
Family Households
Nonfamily Households
1-Person Households
-
1 (12.5%)
2-Person Households
7 (87.5%)
0 (0.0%)
3-Person Households
0 (0.0%)
0 (0.0%)
4-Person Households
0 (0.0%)
0 (0.0%)
5-Person Households
0 (0.0%)
0 (0.0%)
6-Person Households
0 (0.0%)
0 (0.0%)
7+ Person Households
0 (0.0%)
0 (0.0%)
Total
7 (87.5%)
1 (12.5%)
Female Fertility in Wightmans Grove
Fertility by Age in Wightmans Grove
Age Bracket
Women with Births
Births / 1,000 Women
15 to 19 years
0 (0.0%)
0.0
20 to 34 years
0 (0.0%)
0.0
35 to 50 years
0 (0.0%)
0.0
Total
0 (0.0%)
0.0
Fertility by Age by Marriage Status in Wightmans Grove
Age Bracket
Married
Unmarried
15 to 19 years
0 (0.0%)
0 (0.0%)
20 to 34 years
0 (0.0%)
0 (0.0%)
35 to 50 years
0 (0.0%)
0 (0.0%)
Total
0 (0.0%)
0 (0.0%)
Fertility by Education in Wightmans Grove
Educational Attainment
Women with Births
Births / 1,000 Women
Less than High School
0 (0.0%)
0.0
High School Diploma
0 (0.0%)
0.0
College or Associate's Degree
0 (0.0%)
0.0
Bachelor's Degree
0 (0.0%)
0.0
Graduate Degree
0 (0.0%)
0.0
Total
0 (0.0%)
0.0
Fertility by Education by Marriage Status in Wightmans Grove
Educational Attainment
Married
Unmarried
Less than High School
0 (0.0%)
0 (0.0%)
High School Diploma
0 (0.0%)
0 (0.0%)
College or Associate's Degree
0 (0.0%)
0 (0.0%)
Bachelor's Degree
0 (0.0%)
0 (0.0%)
Graduate Degree
0 (0.0%)
0 (0.0%)
Total
0 (0.0%)
0 (0.0%)
Employment Characteristics in Wightmans Grove
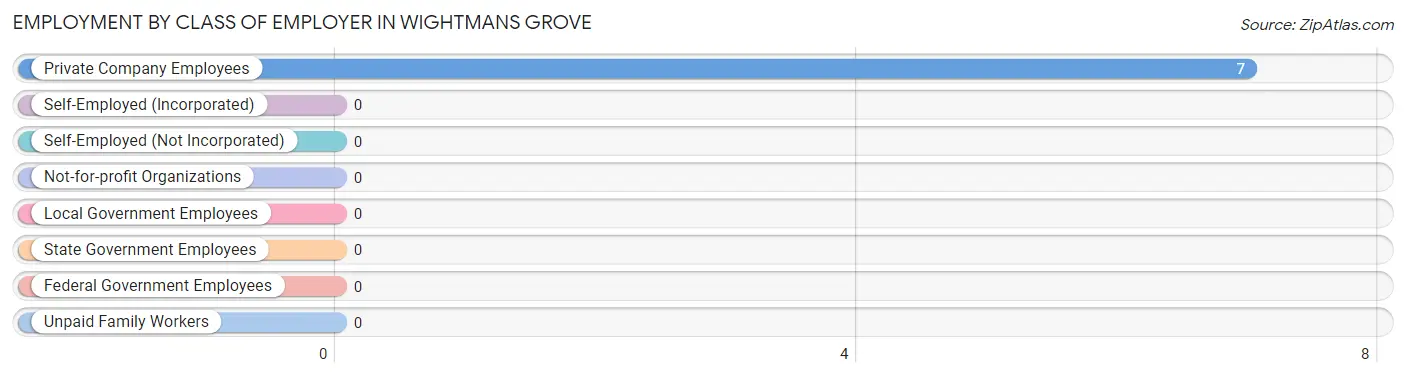
Employment by Class of Employer in Wightmans Grove
Among the 7 employed individuals in Wightmans Grove, , and private company employees (7 | 100.0%) make up the most common classes of employment.
Employer Class
# Employees
% Employees
Private Company Employees
7
100.0%
Self-Employed (Incorporated)
0
0.0%
Self-Employed (Not Incorporated)
0
0.0%
Not-for-profit Organizations
0
0.0%
Local Government Employees
0
0.0%
State Government Employees
0
0.0%
Federal Government Employees
0
0.0%
Unpaid Family Workers
0
0.0%
Total
7
100.0%
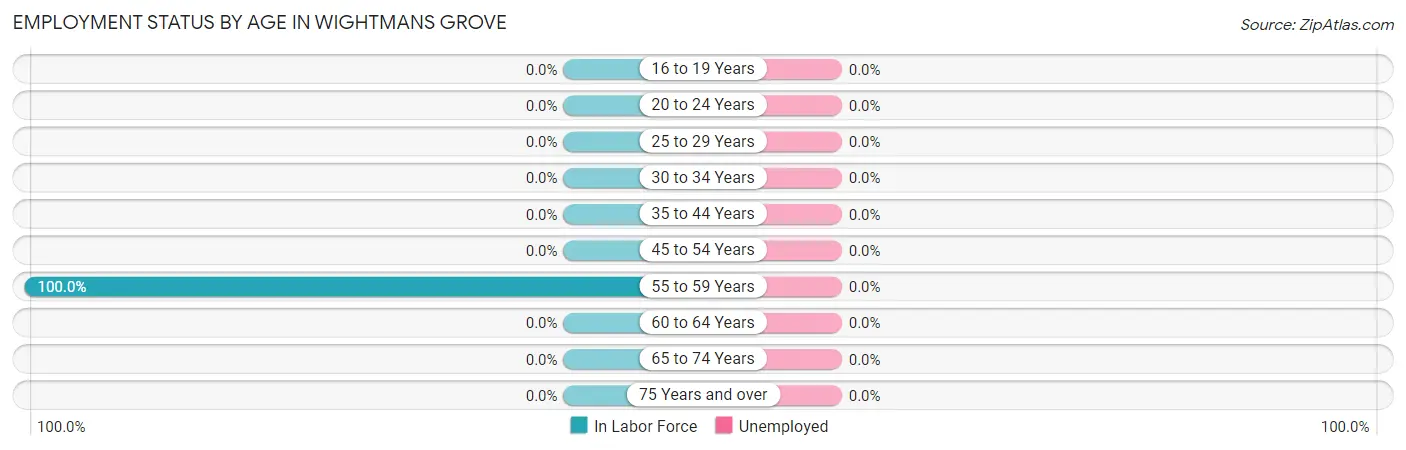
Employment Status by Age in Wightmans Grove
Age Bracket
In Labor Force
Unemployed
16 to 19 Years
0 (0.0%)
0 (0.0%)
20 to 24 Years
0 (0.0%)
0 (0.0%)
25 to 29 Years
0 (0.0%)
0 (0.0%)
30 to 34 Years
0 (0.0%)
0 (0.0%)
35 to 44 Years
0 (0.0%)
0 (0.0%)
45 to 54 Years
0 (0.0%)
0 (0.0%)
55 to 59 Years
7 (100.0%)
0 (0.0%)
60 to 64 Years
0 (0.0%)
0 (0.0%)
65 to 74 Years
0 (0.0%)
0 (0.0%)
75 Years and over
0 (0.0%)
0 (0.0%)
Total
7 (43.8%)
0 (0.0%)
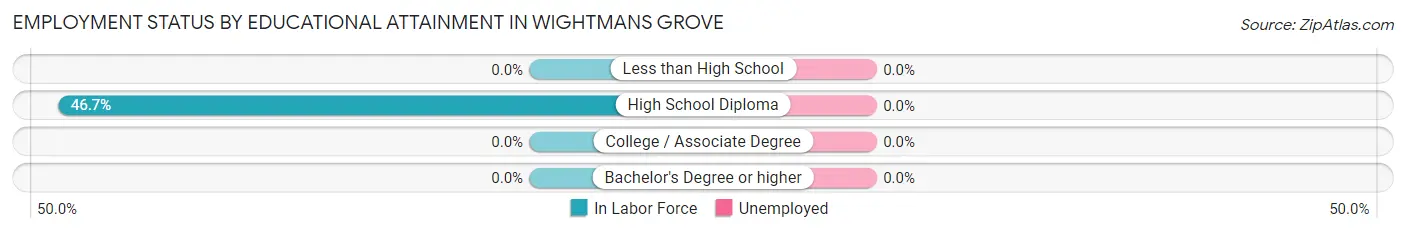
Employment Status by Educational Attainment in Wightmans Grove
Educational Attainment
In Labor Force
Unemployed
Less than High School
0 (0.0%)
0 (0.0%)
High School Diploma
7 (46.7%)
0 (0.0%)
College / Associate Degree
0 (0.0%)
0 (0.0%)
Bachelor's Degree or higher
0 (0.0%)
0 (0.0%)
Total
7 (46.7%)
0 (0.0%)
Employment Occupations by Sex in Wightmans Grove
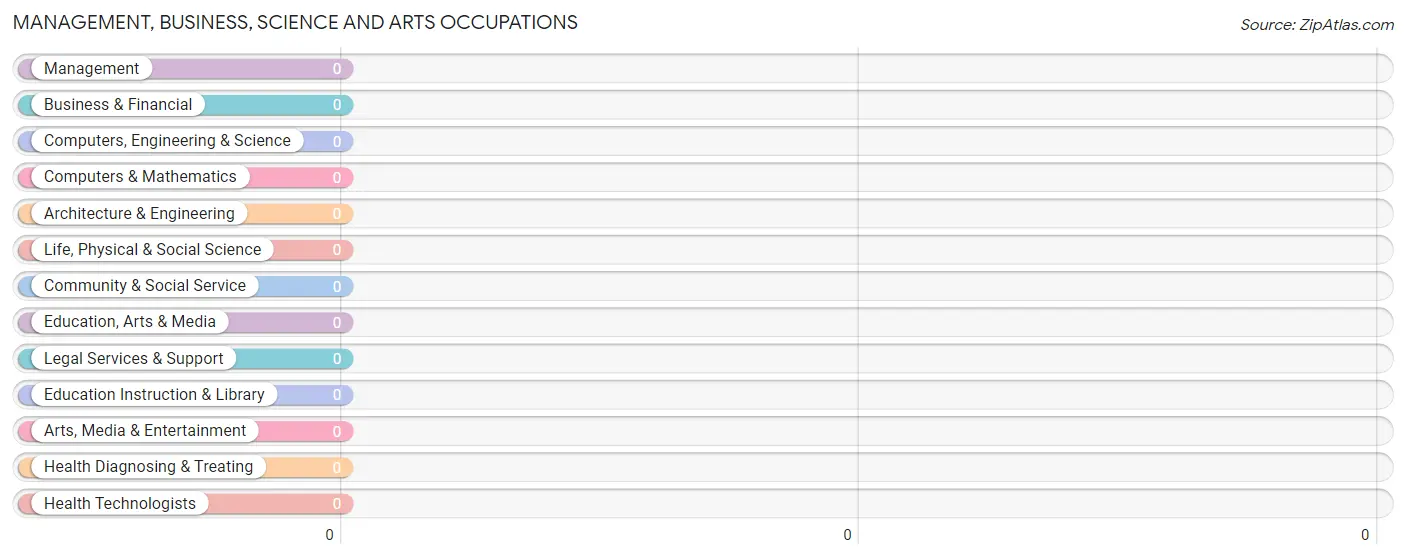
Management, Business, Science and Arts Occupations
Management, Business, Science and Arts Occupations by Sex
Occupation
Male
Female
Management
0 (0.0%)
0 (0.0%)
Business & Financial
0 (0.0%)
0 (0.0%)
Computers, Engineering & Science
0 (0.0%)
0 (0.0%)
Computers & Mathematics
0 (0.0%)
0 (0.0%)
Architecture & Engineering
0 (0.0%)
0 (0.0%)
Life, Physical & Social Science
0 (0.0%)
0 (0.0%)
Community & Social Service
0 (0.0%)
0 (0.0%)
Education, Arts & Media
0 (0.0%)
0 (0.0%)
Legal Services & Support
0 (0.0%)
0 (0.0%)
Education Instruction & Library
0 (0.0%)
0 (0.0%)
Arts, Media & Entertainment
0 (0.0%)
0 (0.0%)
Health Diagnosing & Treating
0 (0.0%)
0 (0.0%)
Health Technologists
0 (0.0%)
0 (0.0%)
Total (Category)
0 (0.0%)
0 (0.0%)
Total (Overall)
0 (0.0%)
7 (100.0%)
Services Occupations
Services Occupations by Sex
Occupation
Male
Female
Healthcare Support
0 (0.0%)
0 (0.0%)
Security & Protection
0 (0.0%)
0 (0.0%)
Firefighting & Prevention
0 (0.0%)
0 (0.0%)
Law Enforcement
0 (0.0%)
0 (0.0%)
Food Preparation & Serving
0 (0.0%)
0 (0.0%)
Cleaning & Maintenance
0 (0.0%)
0 (0.0%)
Personal Care & Service
0 (0.0%)
0 (0.0%)
Total (Category)
0 (0.0%)
0 (0.0%)
Total (Overall)
0 (0.0%)
7 (100.0%)
Sales and Office Occupations
Sales and Office Occupations by Sex
Occupation
Male
Female
Sales & Related
0 (0.0%)
0 (0.0%)
Office & Administration
0 (0.0%)
0 (0.0%)
Total (Category)
0 (0.0%)
0 (0.0%)
Total (Overall)
0 (0.0%)
7 (100.0%)
Natural Resources, Construction and Maintenance Occupations
Natural Resources, Construction and Maintenance Occupations by Sex
Occupation
Male
Female
Farming, Fishing & Forestry
0 (0.0%)
0 (0.0%)
Construction & Extraction
0 (0.0%)
0 (0.0%)
Installation, Maintenance & Repair
0 (0.0%)
0 (0.0%)
Total (Category)
0 (0.0%)
0 (0.0%)
Total (Overall)
0 (0.0%)
7 (100.0%)
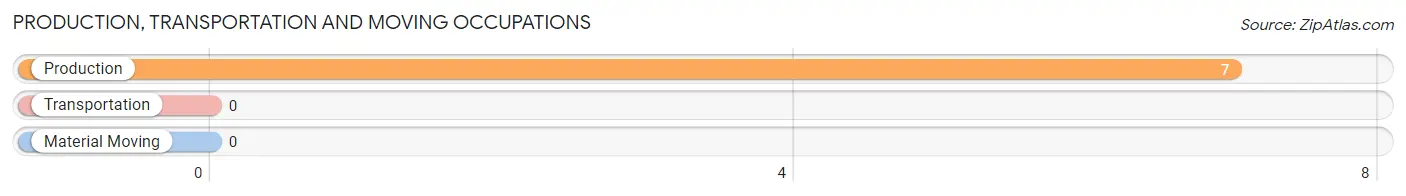
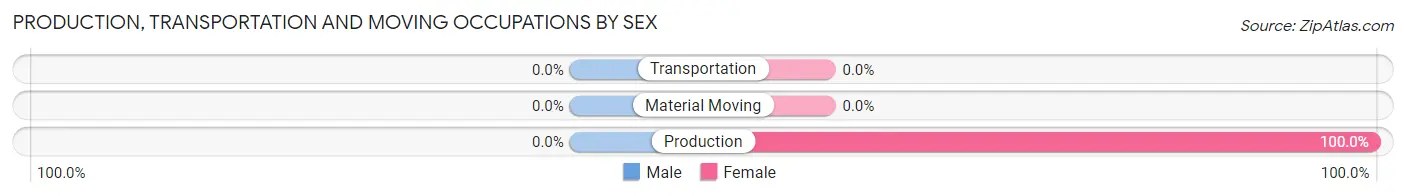
Production, Transportation and Moving Occupations
The most common Production, Transportation and Moving occupations in Wightmans Grove are , and Production (7 | 100.0%).
Production, Transportation and Moving Occupations by Sex
Occupation
Male
Female
Production
0 (0.0%)
7 (100.0%)
Transportation
0 (0.0%)
0 (0.0%)
Material Moving
0 (0.0%)
0 (0.0%)
Total (Category)
0 (0.0%)
7 (100.0%)
Total (Overall)
0 (0.0%)
7 (100.0%)
Employment Industries by Sex in Wightmans Grove
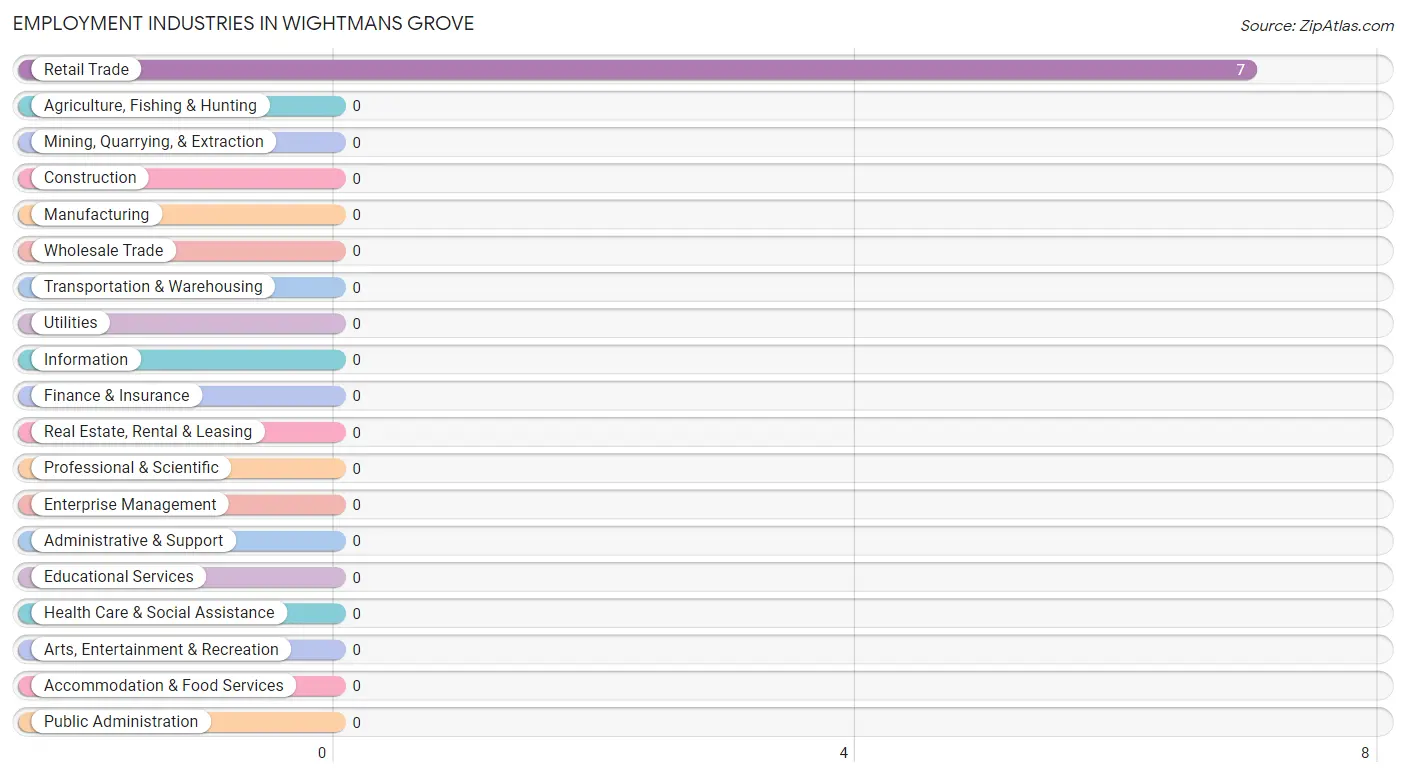
Employment Industries in Wightmans Grove
The major employment industries in Wightmans Grove include , and Retail Trade (7 | 100.0%).
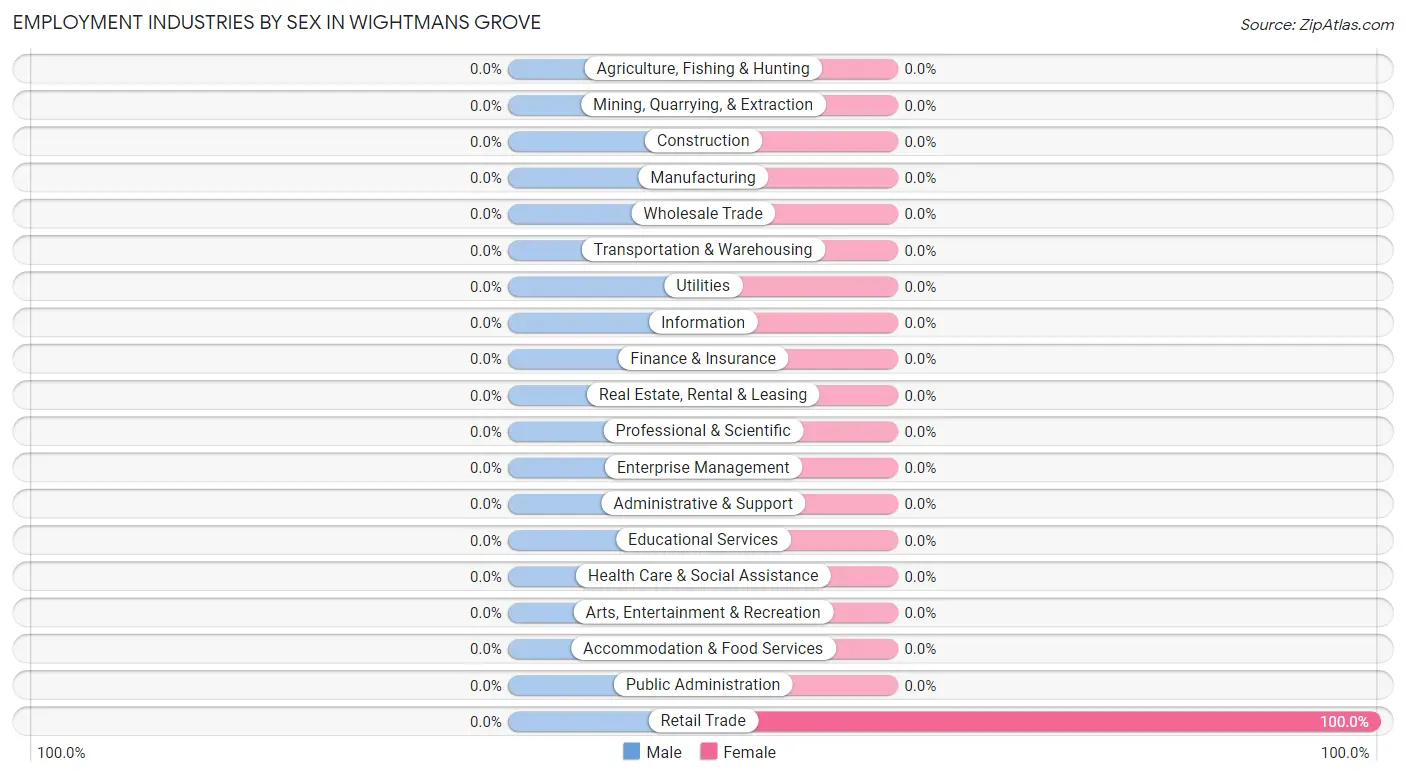
Employment Industries by Sex in Wightmans Grove
Industry
Male
Female
Agriculture, Fishing & Hunting
0 (0.0%)
0 (0.0%)
Mining, Quarrying, & Extraction
0 (0.0%)
0 (0.0%)
Construction
0 (0.0%)
0 (0.0%)
Manufacturing
0 (0.0%)
0 (0.0%)
Wholesale Trade
0 (0.0%)
0 (0.0%)
Retail Trade
0 (0.0%)
7 (100.0%)
Transportation & Warehousing
0 (0.0%)
0 (0.0%)
Utilities
0 (0.0%)
0 (0.0%)
Information
0 (0.0%)
0 (0.0%)
Finance & Insurance
0 (0.0%)
0 (0.0%)
Real Estate, Rental & Leasing
0 (0.0%)
0 (0.0%)
Professional & Scientific
0 (0.0%)
0 (0.0%)
Enterprise Management
0 (0.0%)
0 (0.0%)
Administrative & Support
0 (0.0%)
0 (0.0%)
Educational Services
0 (0.0%)
0 (0.0%)
Health Care & Social Assistance
0 (0.0%)
0 (0.0%)
Arts, Entertainment & Recreation
0 (0.0%)
0 (0.0%)
Accommodation & Food Services
0 (0.0%)
0 (0.0%)
Public Administration
0 (0.0%)
0 (0.0%)
Total
0 (0.0%)
7 (100.0%)
Education in Wightmans Grove
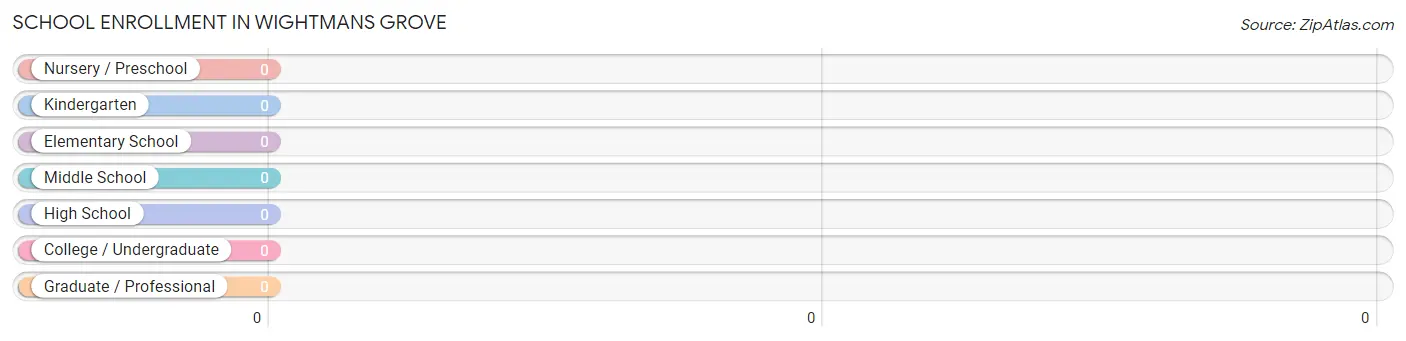
School Enrollment in Wightmans Grove
School Level
# Students
% Students
Nursery / Preschool
0
0.0%
Kindergarten
0
0.0%
Elementary School
0
0.0%
Middle School
0
0.0%
High School
0
0.0%
College / Undergraduate
0
0.0%
Graduate / Professional
0
0.0%
Total
0
0.0%
School Enrollment by Age by Funding Source in Wightmans Grove
Age Bracket
Public School
Private School
3 to 4 Year Olds
0 (0.0%)
0 (0.0%)
5 to 9 Year Old
0 (0.0%)
0 (0.0%)
10 to 14 Year Olds
0 (0.0%)
0 (0.0%)
15 to 17 Year Olds
0 (0.0%)
0 (0.0%)
18 to 19 Year Olds
0 (0.0%)
0 (0.0%)
20 to 24 Year Olds
0 (0.0%)
0 (0.0%)
25 to 34 Year Olds
0 (0.0%)
0 (0.0%)
35 Years and over
0 (0.0%)
0 (0.0%)
Total
0 (0.0%)
0 (0.0%)
Educational Attainment by Field of Study in Wightmans Grove
Field of Study
# Graduates
% Graduates
Computers & Mathematics
0
0.0%
Bio, Nature & Agricultural
0
0.0%
Physical & Health Sciences
0
0.0%
Psychology
0
0.0%
Social Sciences
0
0.0%
Engineering
0
0.0%
Multidisciplinary Studies
0
0.0%
Science & Technology
0
0.0%
Business
0
0.0%
Education
0
0.0%
Literature & Languages
0
0.0%
Liberal Arts & History
0
0.0%
Visual & Performing Arts
0
0.0%
Communications
0
0.0%
Arts & Humanities
0
0.0%
Total
0
0.0%
Transportation & Commute in Wightmans Grove
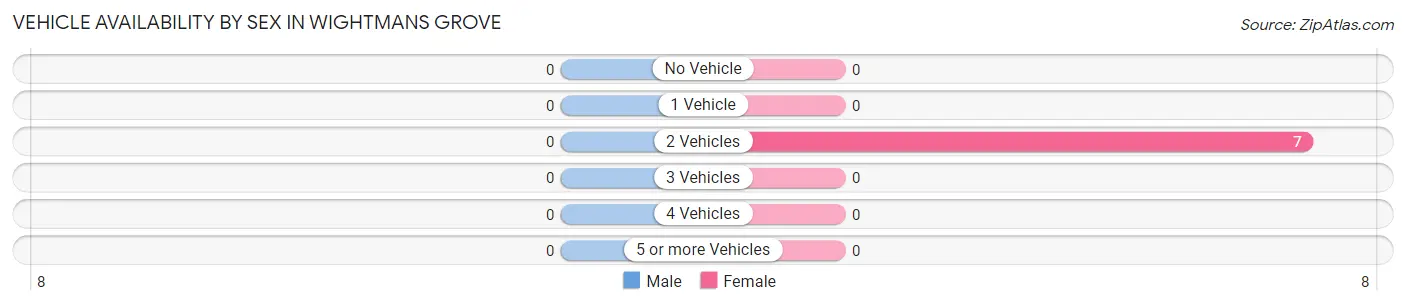
Vehicle Availability by Sex in Wightmans Grove
Vehicles Available
Male
Female
No Vehicle
0 (0.0%)
0 (0.0%)
1 Vehicle
0 (0.0%)
0 (0.0%)
2 Vehicles
0 (0.0%)
7 (100.0%)
3 Vehicles
0 (0.0%)
0 (0.0%)
4 Vehicles
0 (0.0%)
0 (0.0%)
5 or more Vehicles
0 (0.0%)
0 (0.0%)
Total
0 (0.0%)
7 (100.0%)
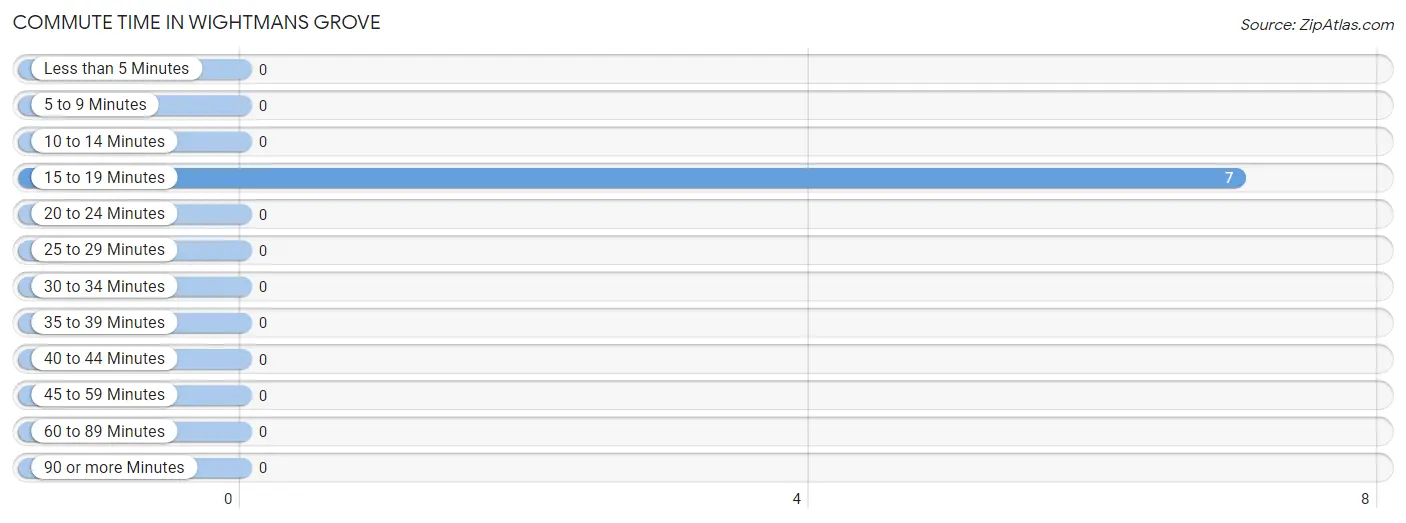
Commute Time in Wightmans Grove
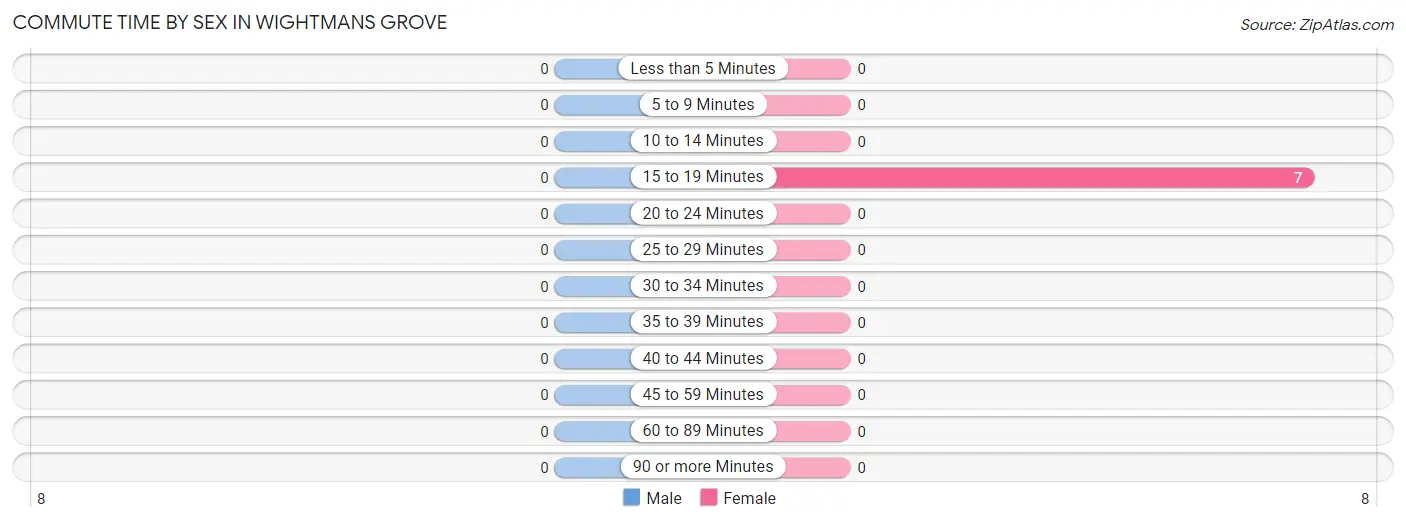
The most frequently occuring commute durations in Wightmans Grove are 15 to 19 minutes (7 commuters, 100.0%), less than 5 minutes (0 commuters, 0.0%), and 5 to 9 minutes (0 commuters, 0.0%).
Commute Time
# Commuters
% Commuters
Less than 5 Minutes
0
0.0%
5 to 9 Minutes
0
0.0%
10 to 14 Minutes
0
0.0%
15 to 19 Minutes
7
100.0%
20 to 24 Minutes
0
0.0%
25 to 29 Minutes
0
0.0%
30 to 34 Minutes
0
0.0%
35 to 39 Minutes
0
0.0%
40 to 44 Minutes
0
0.0%
45 to 59 Minutes
0
0.0%
60 to 89 Minutes
0
0.0%
90 or more Minutes
0
0.0%
Commute Time by Sex in Wightmans Grove
Commute Time
Male
Female
Less than 5 Minutes
0 (0.0%)
0 (0.0%)
5 to 9 Minutes
0 (0.0%)
0 (0.0%)
10 to 14 Minutes
0 (0.0%)
0 (0.0%)
15 to 19 Minutes
0 (0.0%)
7 (100.0%)
20 to 24 Minutes
0 (0.0%)
0 (0.0%)
25 to 29 Minutes
0 (0.0%)
0 (0.0%)
30 to 34 Minutes
0 (0.0%)
0 (0.0%)
35 to 39 Minutes
0 (0.0%)
0 (0.0%)
40 to 44 Minutes
0 (0.0%)
0 (0.0%)
45 to 59 Minutes
0 (0.0%)
0 (0.0%)
60 to 89 Minutes
0 (0.0%)
0 (0.0%)
90 or more Minutes
0 (0.0%)
0 (0.0%)
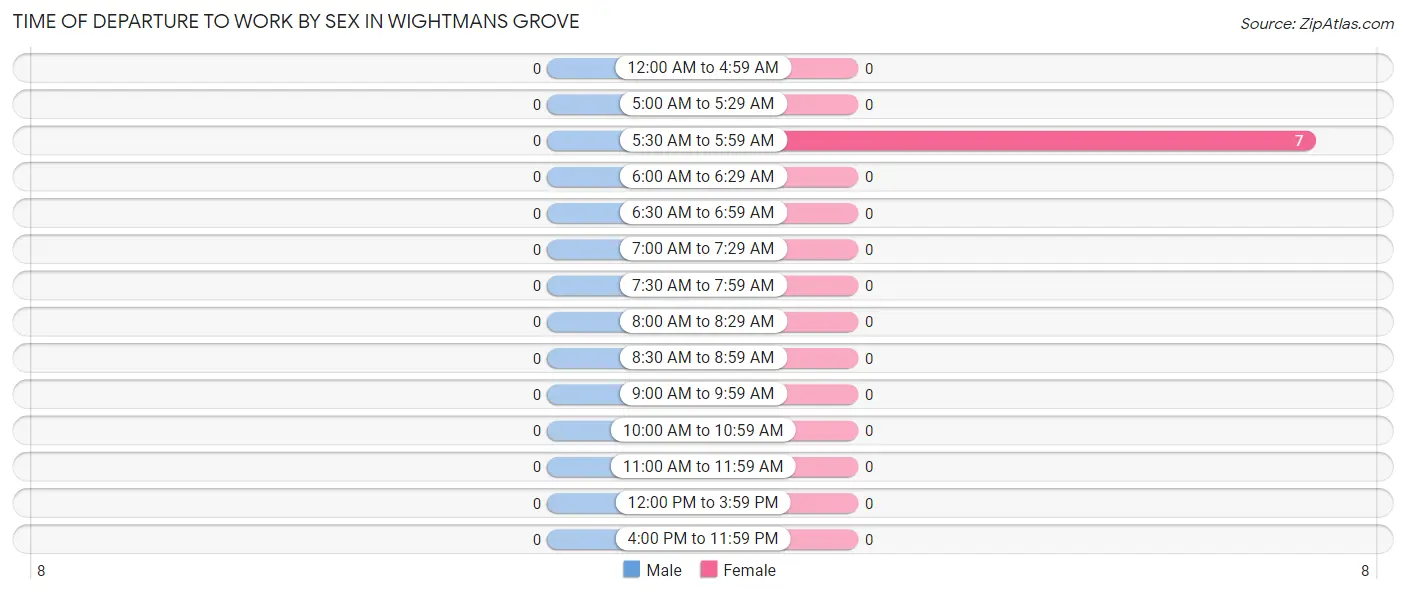
Time of Departure to Work by Sex in Wightmans Grove
Time of Departure
Male
Female
12:00 AM to 4:59 AM
0 (0.0%)
0 (0.0%)
5:00 AM to 5:29 AM
0 (0.0%)
0 (0.0%)
5:30 AM to 5:59 AM
0 (0.0%)
7 (100.0%)
6:00 AM to 6:29 AM
0 (0.0%)
0 (0.0%)
6:30 AM to 6:59 AM
0 (0.0%)
0 (0.0%)
7:00 AM to 7:29 AM
0 (0.0%)
0 (0.0%)
7:30 AM to 7:59 AM
0 (0.0%)
0 (0.0%)
8:00 AM to 8:29 AM
0 (0.0%)
0 (0.0%)
8:30 AM to 8:59 AM
0 (0.0%)
0 (0.0%)
9:00 AM to 9:59 AM
0 (0.0%)
0 (0.0%)
10:00 AM to 10:59 AM
0 (0.0%)
0 (0.0%)
11:00 AM to 11:59 AM
0 (0.0%)
0 (0.0%)
12:00 PM to 3:59 PM
0 (0.0%)
0 (0.0%)
4:00 PM to 11:59 PM
0 (0.0%)
0 (0.0%)
Total
0 (0.0%)
7 (100.0%)
Housing Occupancy in Wightmans Grove
Occupancy by Ownership in Wightmans Grove
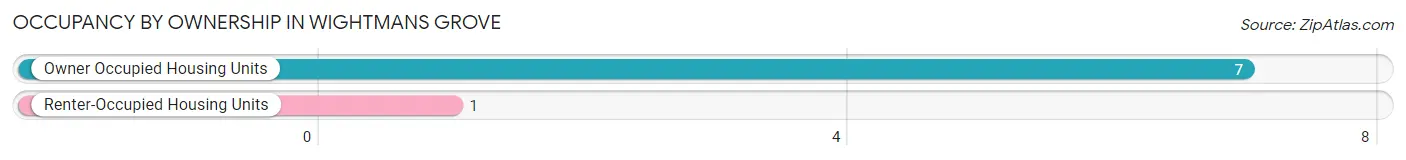
Of the total 8 dwellings in Wightmans Grove, owner-occupied units account for 7 (87.5%), while renter-occupied units make up 1 (12.5%).
Occupancy
# Housing Units
% Housing Units
Owner Occupied Housing Units
7
87.5%
Renter-Occupied Housing Units
1
12.5%
Total Occupied Housing Units
8
100.0%
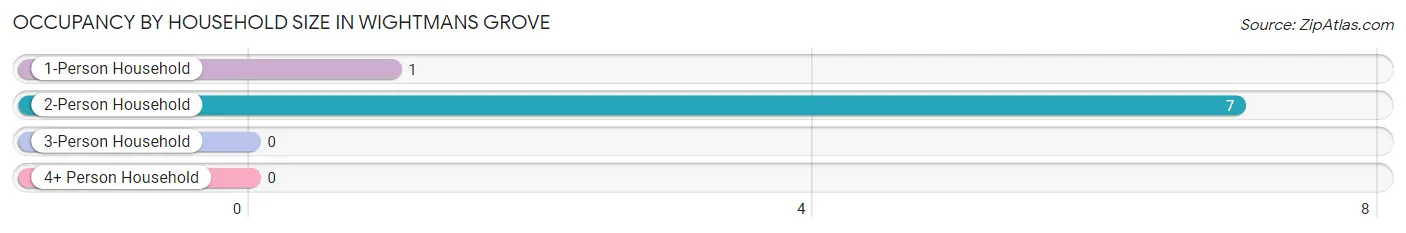
Occupancy by Household Size in Wightmans Grove
Household Size
# Housing Units
% Housing Units
1-Person Household
1
12.5%
2-Person Household
7
87.5%
3-Person Household
0
0.0%
4+ Person Household
0
0.0%
Total Housing Units
8
100.0%
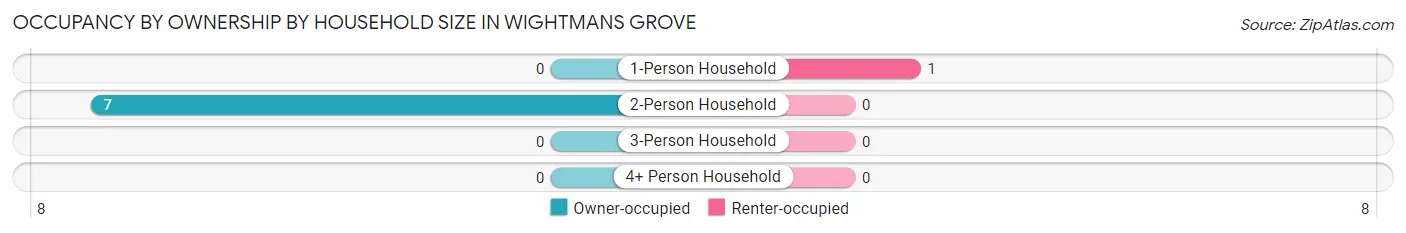
Occupancy by Ownership by Household Size in Wightmans Grove
Household Size
Owner-occupied
Renter-occupied
1-Person Household
0 (0.0%)
1 (100.0%)
2-Person Household
7 (100.0%)
0 (0.0%)
3-Person Household
0 (0.0%)
0 (0.0%)
4+ Person Household
0 (0.0%)
0 (0.0%)
Total Housing Units
7 (87.5%)
1 (12.5%)
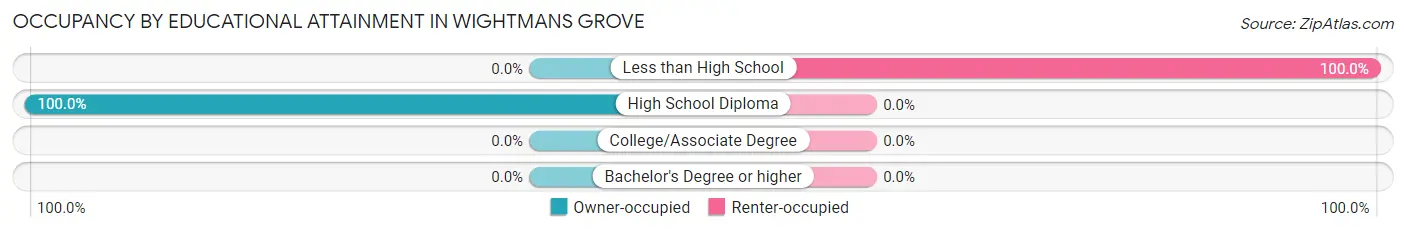
Occupancy by Educational Attainment in Wightmans Grove
Household Size
Owner-occupied
Renter-occupied
Less than High School
0 (0.0%)
1 (100.0%)
High School Diploma
7 (100.0%)
0 (0.0%)
College/Associate Degree
0 (0.0%)
0 (0.0%)
Bachelor's Degree or higher
0 (0.0%)
0 (0.0%)
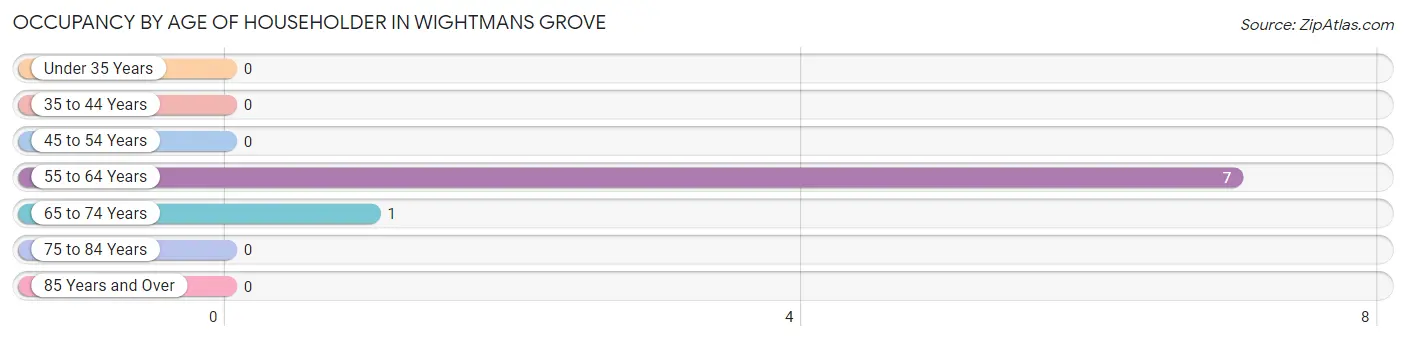
Occupancy by Age of Householder in Wightmans Grove
Age Bracket
# Households
% Households
Under 35 Years
0
0.0%
35 to 44 Years
0
0.0%
45 to 54 Years
0
0.0%
55 to 64 Years
7
87.5%
65 to 74 Years
1
12.5%
75 to 84 Years
0
0.0%
85 Years and Over
0
0.0%
Total
8
100.0%
Housing Finances in Wightmans Grove
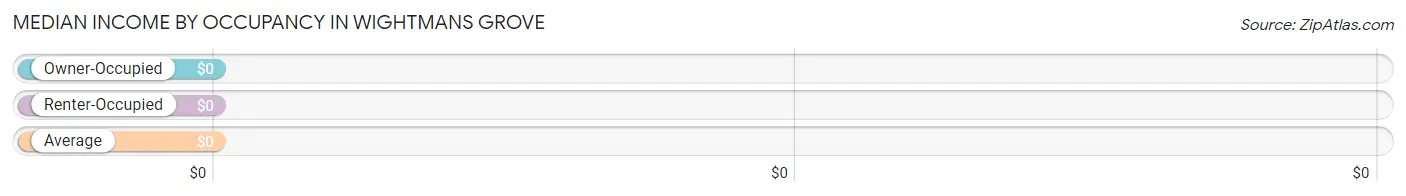
Median Income by Occupancy in Wightmans Grove
Occupancy Type
# Households
Median Income
Owner-Occupied
7 (87.5%)
$0
Renter-Occupied
1 (12.5%)
$0
Average
8 (100.0%)
$0
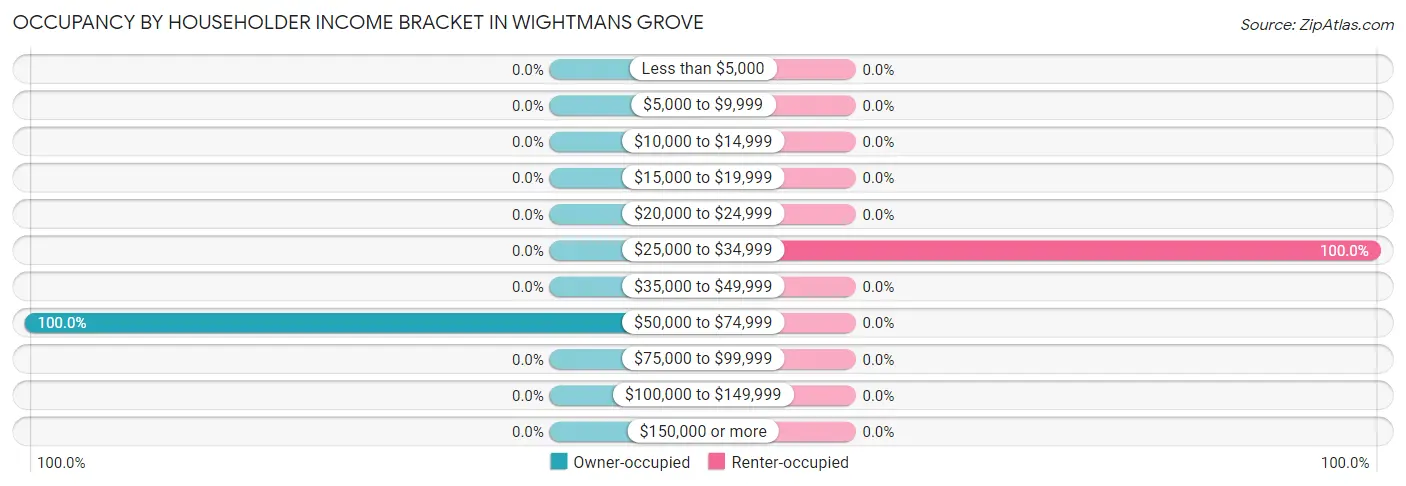
Occupancy by Householder Income Bracket in Wightmans Grove
Income Bracket
Owner-occupied
Renter-occupied
Less than $5,000
0 (0.0%)
0 (0.0%)
$5,000 to $9,999
0 (0.0%)
0 (0.0%)
$10,000 to $14,999
0 (0.0%)
0 (0.0%)
$15,000 to $19,999
0 (0.0%)
0 (0.0%)
$20,000 to $24,999
0 (0.0%)
0 (0.0%)
$25,000 to $34,999
0 (0.0%)
1 (100.0%)
$35,000 to $49,999
0 (0.0%)
0 (0.0%)
$50,000 to $74,999
7 (100.0%)
0 (0.0%)
$75,000 to $99,999
0 (0.0%)
0 (0.0%)
$100,000 to $149,999
0 (0.0%)
0 (0.0%)
$150,000 or more
0 (0.0%)
0 (0.0%)
Total
7 (100.0%)
1 (100.0%)
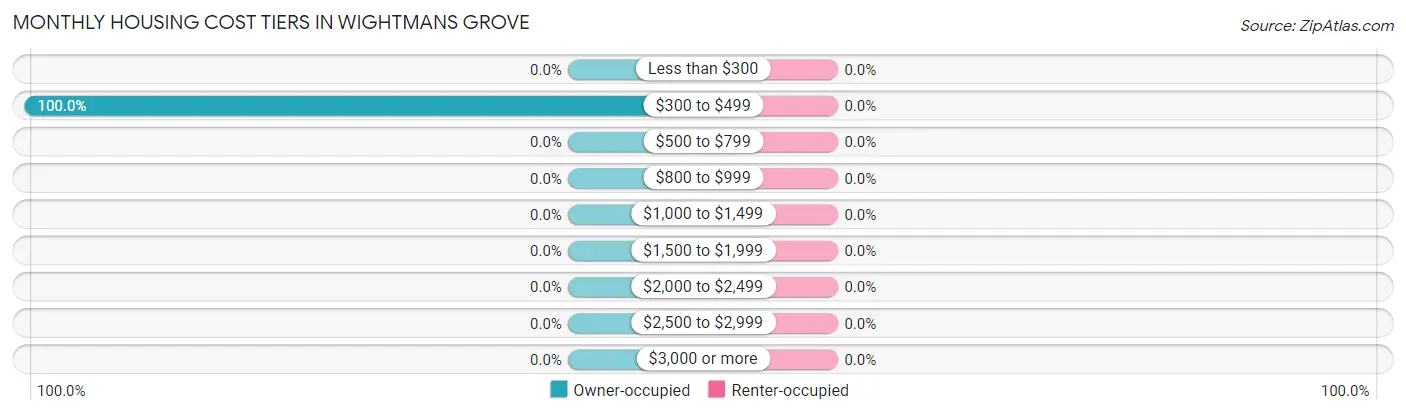
Monthly Housing Cost Tiers in Wightmans Grove
Monthly Cost
Owner-occupied
Renter-occupied
Less than $300
0 (0.0%)
0 (0.0%)
$300 to $499
7 (100.0%)
0 (0.0%)
$500 to $799
0 (0.0%)
0 (0.0%)
$800 to $999
0 (0.0%)
0 (0.0%)
$1,000 to $1,499
0 (0.0%)
0 (0.0%)
$1,500 to $1,999
0 (0.0%)
0 (0.0%)
$2,000 to $2,499
0 (0.0%)
0 (0.0%)
$2,500 to $2,999
0 (0.0%)
0 (0.0%)
$3,000 or more
0 (0.0%)
0 (0.0%)
Total
7 (100.0%)
1 (100.0%)
Physical Housing Characteristics in Wightmans Grove
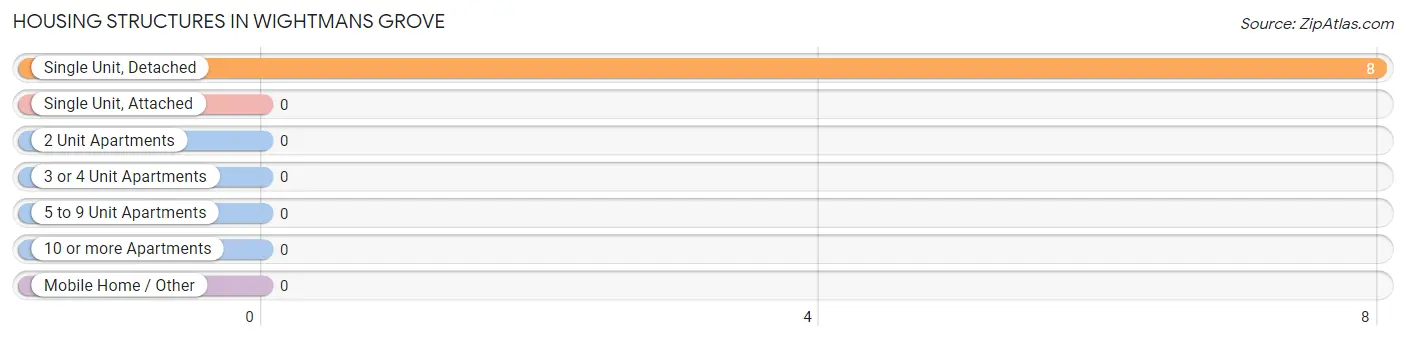
Housing Structures in Wightmans Grove
Structure Type
# Housing Units
% Housing Units
Single Unit, Detached
8
100.0%
Single Unit, Attached
0
0.0%
2 Unit Apartments
0
0.0%
3 or 4 Unit Apartments
0
0.0%
5 to 9 Unit Apartments
0
0.0%
10 or more Apartments
0
0.0%
Mobile Home / Other
0
0.0%
Total
8
100.0%
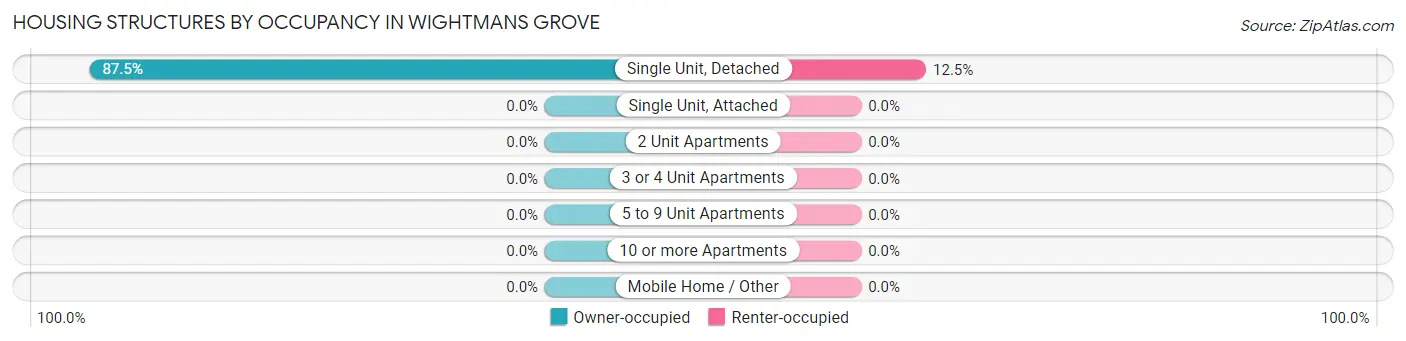
Housing Structures by Occupancy in Wightmans Grove
Structure Type
Owner-occupied
Renter-occupied
Single Unit, Detached
7 (87.5%)
1 (12.5%)
Single Unit, Attached
0 (0.0%)
0 (0.0%)
2 Unit Apartments
0 (0.0%)
0 (0.0%)
3 or 4 Unit Apartments
0 (0.0%)
0 (0.0%)
5 to 9 Unit Apartments
0 (0.0%)
0 (0.0%)
10 or more Apartments
0 (0.0%)
0 (0.0%)
Mobile Home / Other
0 (0.0%)
0 (0.0%)
Total
7 (87.5%)
1 (12.5%)
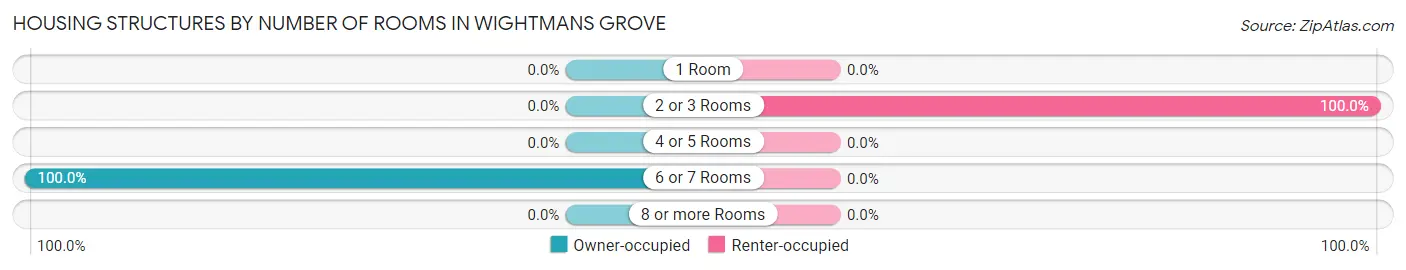
Housing Structures by Number of Rooms in Wightmans Grove
Number of Rooms
Owner-occupied
Renter-occupied
1 Room
0 (0.0%)
0 (0.0%)
2 or 3 Rooms
0 (0.0%)
1 (100.0%)
4 or 5 Rooms
0 (0.0%)
0 (0.0%)
6 or 7 Rooms
7 (100.0%)
0 (0.0%)
8 or more Rooms
0 (0.0%)
0 (0.0%)
Total
7 (100.0%)
1 (100.0%)
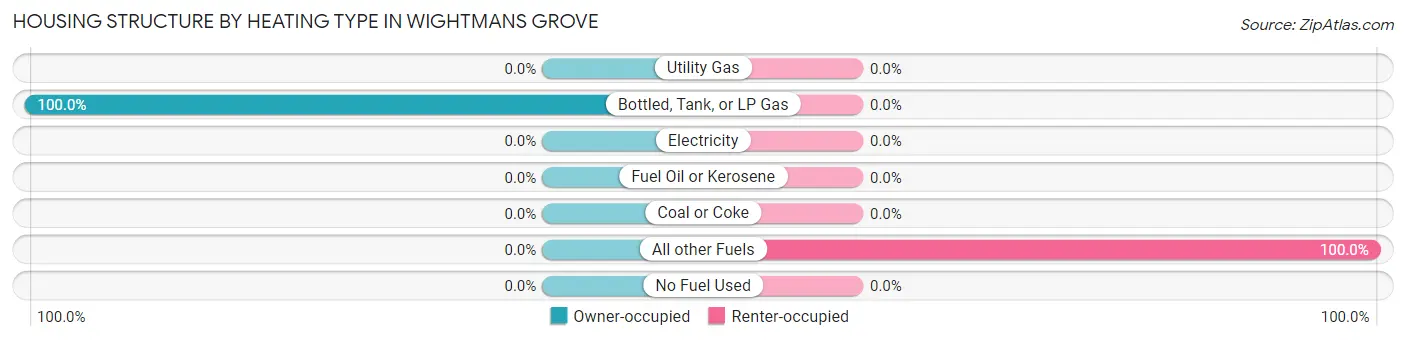
Housing Structure by Heating Type in Wightmans Grove
Heating Type
Owner-occupied
Renter-occupied
Utility Gas
0 (0.0%)
0 (0.0%)
Bottled, Tank, or LP Gas
7 (100.0%)
0 (0.0%)
Electricity
0 (0.0%)
0 (0.0%)
Fuel Oil or Kerosene
0 (0.0%)
0 (0.0%)
Coal or Coke
0 (0.0%)
0 (0.0%)
All other Fuels
0 (0.0%)
1 (100.0%)
No Fuel Used
0 (0.0%)
0 (0.0%)
Total
7 (100.0%)
1 (100.0%)
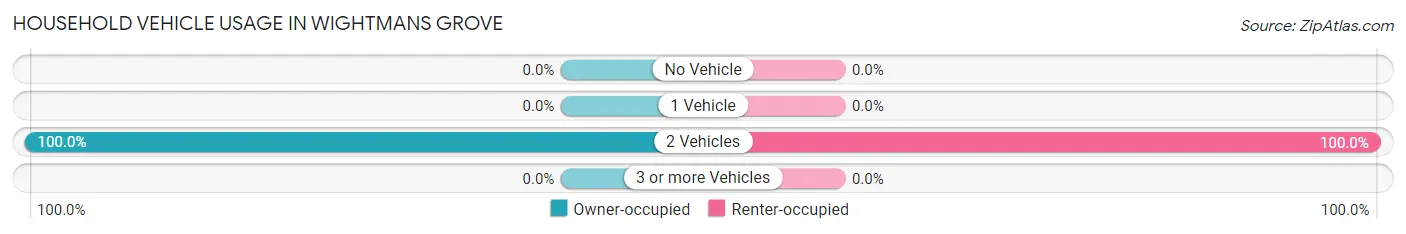
Household Vehicle Usage in Wightmans Grove
Vehicles per Household
Owner-occupied
Renter-occupied
No Vehicle
0 (0.0%)
0 (0.0%)
1 Vehicle
0 (0.0%)
0 (0.0%)
2 Vehicles
7 (100.0%)
1 (100.0%)
3 or more Vehicles
0 (0.0%)
0 (0.0%)
Total
7 (100.0%)
1 (100.0%)
Real Estate & Mortgages in Wightmans Grove
Real Estate and Mortgage Overview in Wightmans Grove
Characteristic
Without Mortgage
With Mortgage
Housing Units
7
0
Median Property Value
-
-
Median Household Income
-
-
Monthly Housing Costs
-
-
Real Estate Taxes
-
-
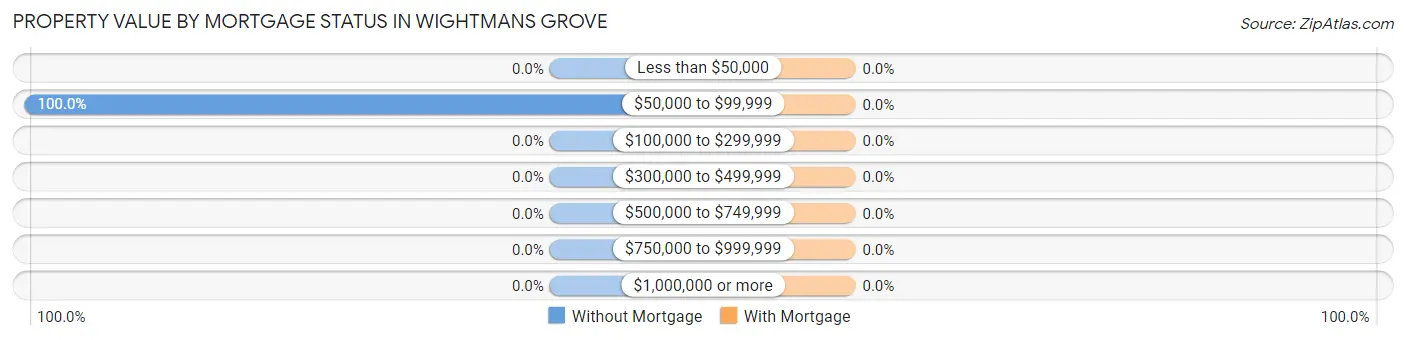
Property Value by Mortgage Status in Wightmans Grove
Property Value
Without Mortgage
With Mortgage
Less than $50,000
0 (0.0%)
0 (0.0%)
$50,000 to $99,999
7 (100.0%)
0 (0.0%)
$100,000 to $299,999
0 (0.0%)
0 (0.0%)
$300,000 to $499,999
0 (0.0%)
0 (0.0%)
$500,000 to $749,999
0 (0.0%)
0 (0.0%)
$750,000 to $999,999
0 (0.0%)
0 (0.0%)
$1,000,000 or more
0 (0.0%)
0 (0.0%)
Total
7 (100.0%)
0 (0.0%)
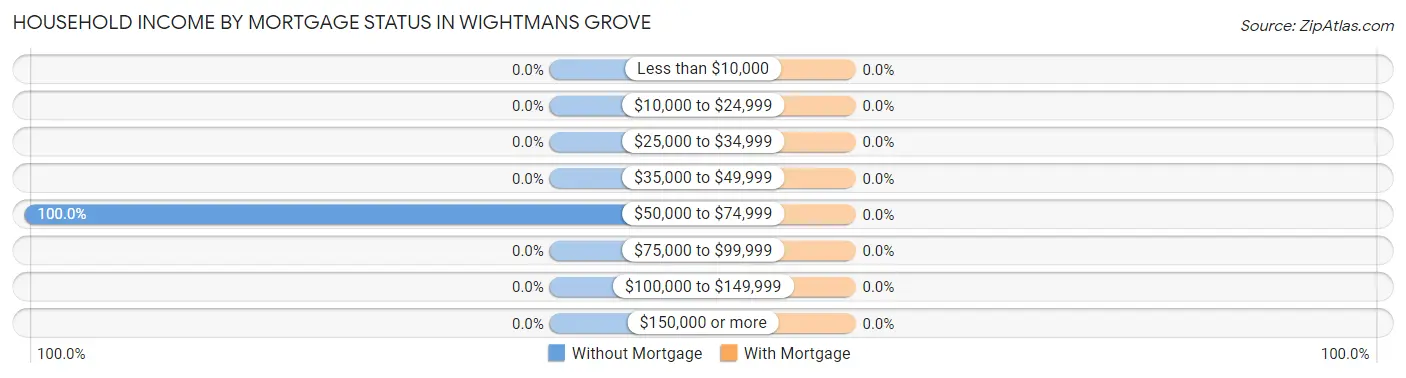
Household Income by Mortgage Status in Wightmans Grove
Household Income
Without Mortgage
With Mortgage
Less than $10,000
0 (0.0%)
0 (0.0%)
$10,000 to $24,999
0 (0.0%)
0 (0.0%)
$25,000 to $34,999
0 (0.0%)
0 (0.0%)
$35,000 to $49,999
0 (0.0%)
0 (0.0%)
$50,000 to $74,999
7 (100.0%)
0 (0.0%)
$75,000 to $99,999
0 (0.0%)
0 (0.0%)
$100,000 to $149,999
0 (0.0%)
0 (0.0%)
$150,000 or more
0 (0.0%)
0 (0.0%)
Total
7 (100.0%)
0 (0.0%)
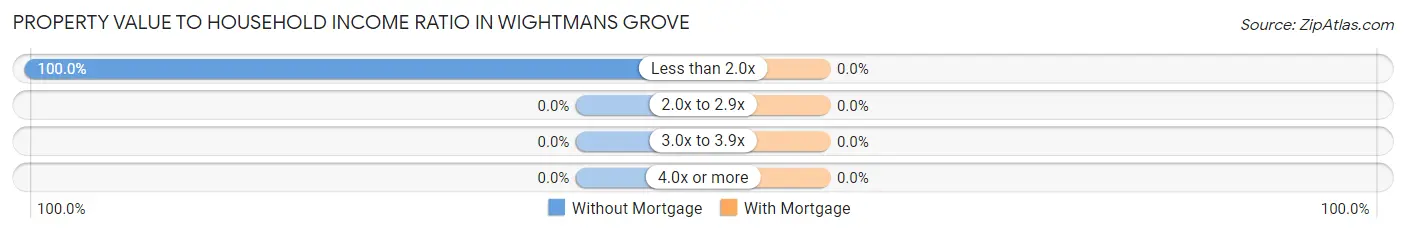
Property Value to Household Income Ratio in Wightmans Grove
Value-to-Income Ratio
Without Mortgage
With Mortgage
Less than 2.0x
7 (100.0%)
0 (0.0%)
2.0x to 2.9x
0 (0.0%)
0 (0.0%)
3.0x to 3.9x
0 (0.0%)
0 (0.0%)
4.0x or more
0 (0.0%)
0 (0.0%)
Total
7 (100.0%)
0 (0.0%)
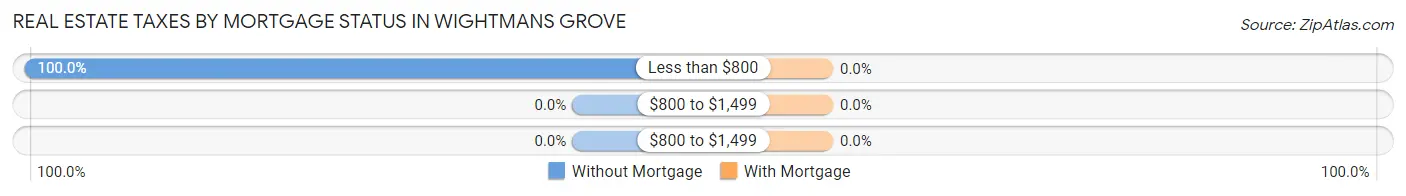
Real Estate Taxes by Mortgage Status in Wightmans Grove
Property Taxes
Without Mortgage
With Mortgage
Less than $800
7 (100.0%)
0 (0.0%)
$800 to $1,499
0 (0.0%)
0 (0.0%)
$800 to $1,499
0 (0.0%)
0 (0.0%)
Total
7 (100.0%)
0 (0.0%)
Health & Disability in Wightmans Grove
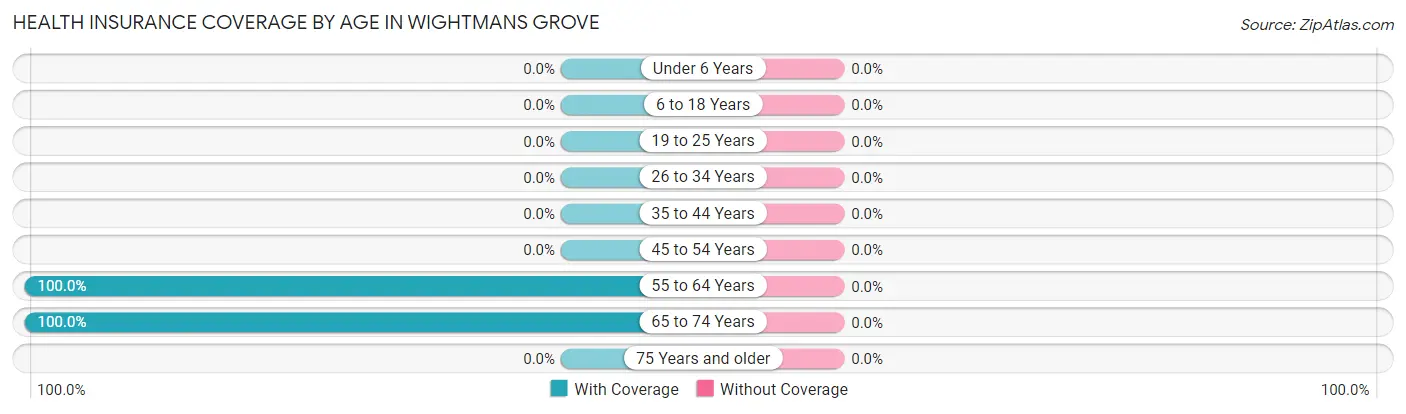
Health Insurance Coverage by Age in Wightmans Grove
Age Bracket
With Coverage
Without Coverage
Under 6 Years
0 (0.0%)
0 (0.0%)
6 to 18 Years
0 (0.0%)
0 (0.0%)
19 to 25 Years
0 (0.0%)
0 (0.0%)
26 to 34 Years
0 (0.0%)
0 (0.0%)
35 to 44 Years
0 (0.0%)
0 (0.0%)
45 to 54 Years
0 (0.0%)
0 (0.0%)
55 to 64 Years
15 (100.0%)
0 (0.0%)
65 to 74 Years
1 (100.0%)
0 (0.0%)
75 Years and older
0 (0.0%)
0 (0.0%)
Total
16 (100.0%)
0 (0.0%)
Health Insurance Coverage by Citizenship Status in Wightmans Grove
Citizenship Status
With Coverage
Without Coverage
Native Born
0 (0.0%)
0 (0.0%)
Foreign Born, Citizen
0 (0.0%)
0 (0.0%)
Foreign Born, not a Citizen
0 (0.0%)
0 (0.0%)
Health Insurance Coverage by Household Income in Wightmans Grove
Household Income
With Coverage
Without Coverage
Under $25,000
0 (0.0%)
0 (0.0%)
$25,000 to $49,999
1 (100.0%)
0 (0.0%)
$50,000 to $74,999
15 (100.0%)
0 (0.0%)
$75,000 to $99,999
0 (0.0%)
0 (0.0%)
$100,000 and over
0 (0.0%)
0 (0.0%)
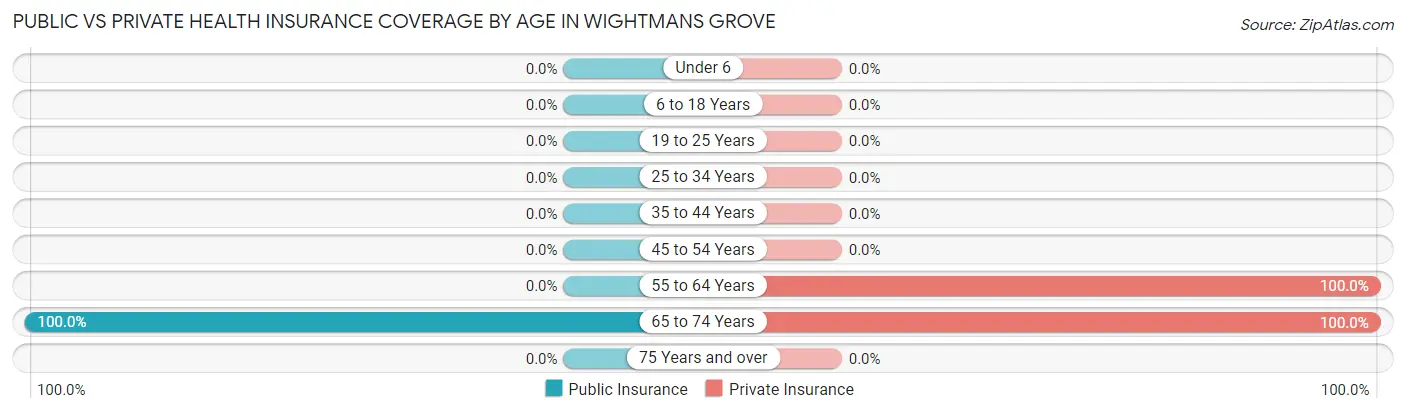
Public vs Private Health Insurance Coverage by Age in Wightmans Grove
Age Bracket
Public Insurance
Private Insurance
Under 6
0 (0.0%)
0 (0.0%)
6 to 18 Years
0 (0.0%)
0 (0.0%)
19 to 25 Years
0 (0.0%)
0 (0.0%)
25 to 34 Years
0 (0.0%)
0 (0.0%)
35 to 44 Years
0 (0.0%)
0 (0.0%)
45 to 54 Years
0 (0.0%)
0 (0.0%)
55 to 64 Years
0 (0.0%)
15 (100.0%)
65 to 74 Years
1 (100.0%)
1 (100.0%)
75 Years and over
0 (0.0%)
0 (0.0%)
Total
1 (6.2%)
16 (100.0%)
Disability Status by Sex by Age in Wightmans Grove
Age Bracket
Male
Female
Under 5 Years
0 (0.0%)
0 (0.0%)
5 to 17 Years
0 (0.0%)
0 (0.0%)
18 to 34 Years
0 (0.0%)
0 (0.0%)
35 to 64 Years
0 (0.0%)
0 (0.0%)
65 to 74 Years
0 (0.0%)
0 (0.0%)
75 Years and over
0 (0.0%)
0 (0.0%)
Disability Class by Sex by Age in Wightmans Grove
Disability Class: Hearing Difficulty
Age Bracket
Male
Female
Under 5 Years
0 (0.0%)
0 (0.0%)
5 to 17 Years
0 (0.0%)
0 (0.0%)
18 to 34 Years
0 (0.0%)
0 (0.0%)
35 to 64 Years
0 (0.0%)
0 (0.0%)
65 to 74 Years
0 (0.0%)
0 (0.0%)
75 Years and over
0 (0.0%)
0 (0.0%)
Disability Class: Vision Difficulty
Age Bracket
Male
Female
Under 5 Years
0 (0.0%)
0 (0.0%)
5 to 17 Years
0 (0.0%)
0 (0.0%)
18 to 34 Years
0 (0.0%)
0 (0.0%)
35 to 64 Years
0 (0.0%)
0 (0.0%)
65 to 74 Years
0 (0.0%)
0 (0.0%)
75 Years and over
0 (0.0%)
0 (0.0%)
Disability Class: Cognitive Difficulty
Age Bracket
Male
Female
5 to 17 Years
0 (0.0%)
0 (0.0%)
18 to 34 Years
0 (0.0%)
0 (0.0%)
35 to 64 Years
0 (0.0%)
0 (0.0%)
65 to 74 Years
0 (0.0%)
0 (0.0%)
75 Years and over
0 (0.0%)
0 (0.0%)
Disability Class: Ambulatory Difficulty
Age Bracket
Male
Female
5 to 17 Years
0 (0.0%)
0 (0.0%)
18 to 34 Years
0 (0.0%)
0 (0.0%)
35 to 64 Years
0 (0.0%)
0 (0.0%)
65 to 74 Years
0 (0.0%)
0 (0.0%)
75 Years and over
0 (0.0%)
0 (0.0%)
Disability Class: Self-Care Difficulty
Age Bracket
Male
Female
5 to 17 Years
0 (0.0%)
0 (0.0%)
18 to 34 Years
0 (0.0%)
0 (0.0%)
35 to 64 Years
0 (0.0%)
0 (0.0%)
65 to 74 Years
0 (0.0%)
0 (0.0%)
75 Years and over
0 (0.0%)
0 (0.0%)
Technology Access in Wightmans Grove
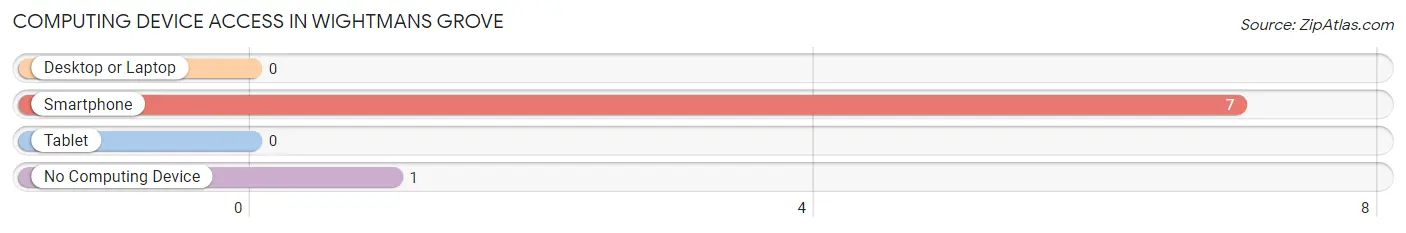
Computing Device Access in Wightmans Grove
Device Type
# Households
% Households
Desktop or Laptop
0
0.0%
Smartphone
7
87.5%
Tablet
0
0.0%
No Computing Device
1
12.5%
Total
8
100.0%
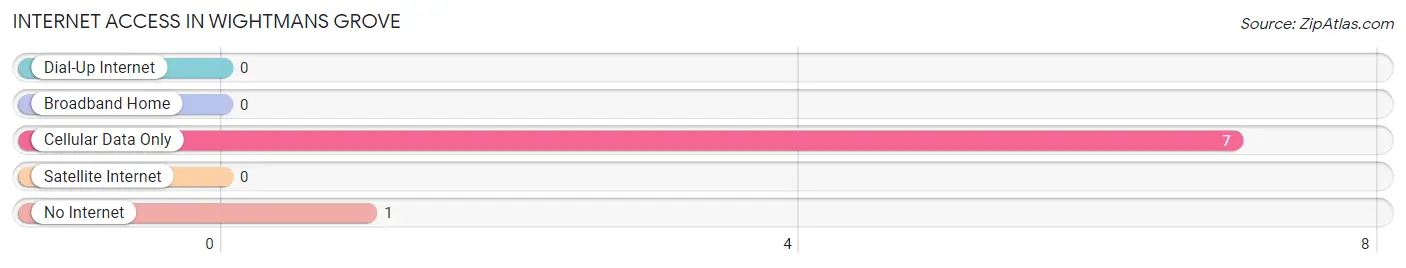
Internet Access in Wightmans Grove
Internet Type
# Households
% Households
Dial-Up Internet
0
0.0%
Broadband Home
0
0.0%
Cellular Data Only
7
87.5%
Satellite Internet
0
0.0%
No Internet
1
12.5%
Total
8
100.0%
Wightmans Grove Summary
Wightmans Grove is a small unincorporated community located in the southeastern corner of Montgomery County, Ohio. It is situated along the banks of the Stillwater River, just south of the city of Dayton. The community is named after the Wightman family, who settled in the area in the early 1800s.
History
The Wightman family first settled in the area in 1805, when John Wightman and his wife, Mary, purchased a tract of land along the Stillwater River. The Wightmans were among the first settlers in the area, and their homestead became the nucleus of the community that would eventually become Wightmans Grove.
John and Mary Wightman had seven children, and their descendants continued to live in the area for generations. The Wightman family was active in the local community, and their influence can still be seen in the area today.
The Wightman family was also instrumental in the development of the local economy. In 1820, John Wightman opened a grist mill on the Stillwater River, which provided a much-needed source of income for the community. The mill was in operation until the early 1900s, when it was destroyed by a flood.
Geography
Wightmans Grove is located in the southeastern corner of Montgomery County, Ohio. It is situated along the banks of the Stillwater River, just south of the city of Dayton. The community is bordered by the cities of Kettering and Huber Heights to the north, and the city of Riverside to the south.
The terrain of Wightmans Grove is mostly flat, with some rolling hills in the area. The Stillwater River runs through the community, providing a source of water for the area. The climate in Wightmans Grove is typical of the Midwest, with hot summers and cold winters.
Economy
The economy of Wightmans Grove is largely based on agriculture. The area is home to several farms, which produce a variety of crops, including corn, soybeans, and wheat. The community also has a few small businesses, including a gas station, a convenience store, and a restaurant.
Demographics
As of the 2010 census, the population of Wightmans Grove was 1,845. The racial makeup of the community was 97.3% White, 0.9% African American, 0.3% Native American, 0.2% Asian, and 0.3% from other races. The median household income in Wightmans Grove was $50,972, and the median home value was $133,000.
Conclusion
Wightmans Grove is a small unincorporated community located in the southeastern corner of Montgomery County, Ohio. It is situated along the banks of the Stillwater River, just south of the city of Dayton. The community is named after the Wightman family, who settled in the area in the early 1800s. The economy of Wightmans Grove is largely based on agriculture, and the population of the community was 1,845 as of the 2010 census. The Wightman family has had a lasting influence on the area, and their legacy can still be seen in the community today.
Common Questions
What is Per Capita Income in Wightmans Grove?
Per Capita income in Wightmans Grove is $27,400.
What is Inequality or Gini Index in Wightmans Grove?
Inequality or Gini Index in Wightmans Grove is 0.06.
What is the Total Population of Wightmans Grove?
Total Population of Wightmans Grove is 16.
What is the Total Male Population of Wightmans Grove?
Total Male Population of Wightmans Grove is 9.
What is the Total Female Population of Wightmans Grove?
Total Female Population of Wightmans Grove is 7.
What is the Ratio of Males per 100 Females in Wightmans Grove?
There are 128.57 Males per 100 Females in Wightmans Grove.
What is the Ratio of Females per 100 Males in Wightmans Grove?
There are 77.78 Females per 100 Males in Wightmans Grove.
What is the Median Population Age in Wightmans Grove?
Median Population Age in Wightmans Grove is 61.1 Years.
What is the Average Family Size in Wightmans Grove
Average Family Size in Wightmans Grove is 2.1 People.
What is the Average Household Size in Wightmans Grove
Average Household Size in Wightmans Grove is 2.0 People.
How Large is the Labor Force in Wightmans Grove?
There are 7 People in the Labor Forcein in Wightmans Grove.
What is the Percentage of People in the Labor Force in Wightmans Grove?
43.8% of People are in the Labor Force in Wightmans Grove.
Report Title
Report Link
HTML Copy & Paste Link
Social Media
Copy and paste the folowing code into any webpage where you would like this interactive chart to display