Zip Codes with the Highest Percentage of Population Employed in Production in Warren, OH
RELATED REPORTS & OPTIONS
Production
Warren
Compare Zip Codes
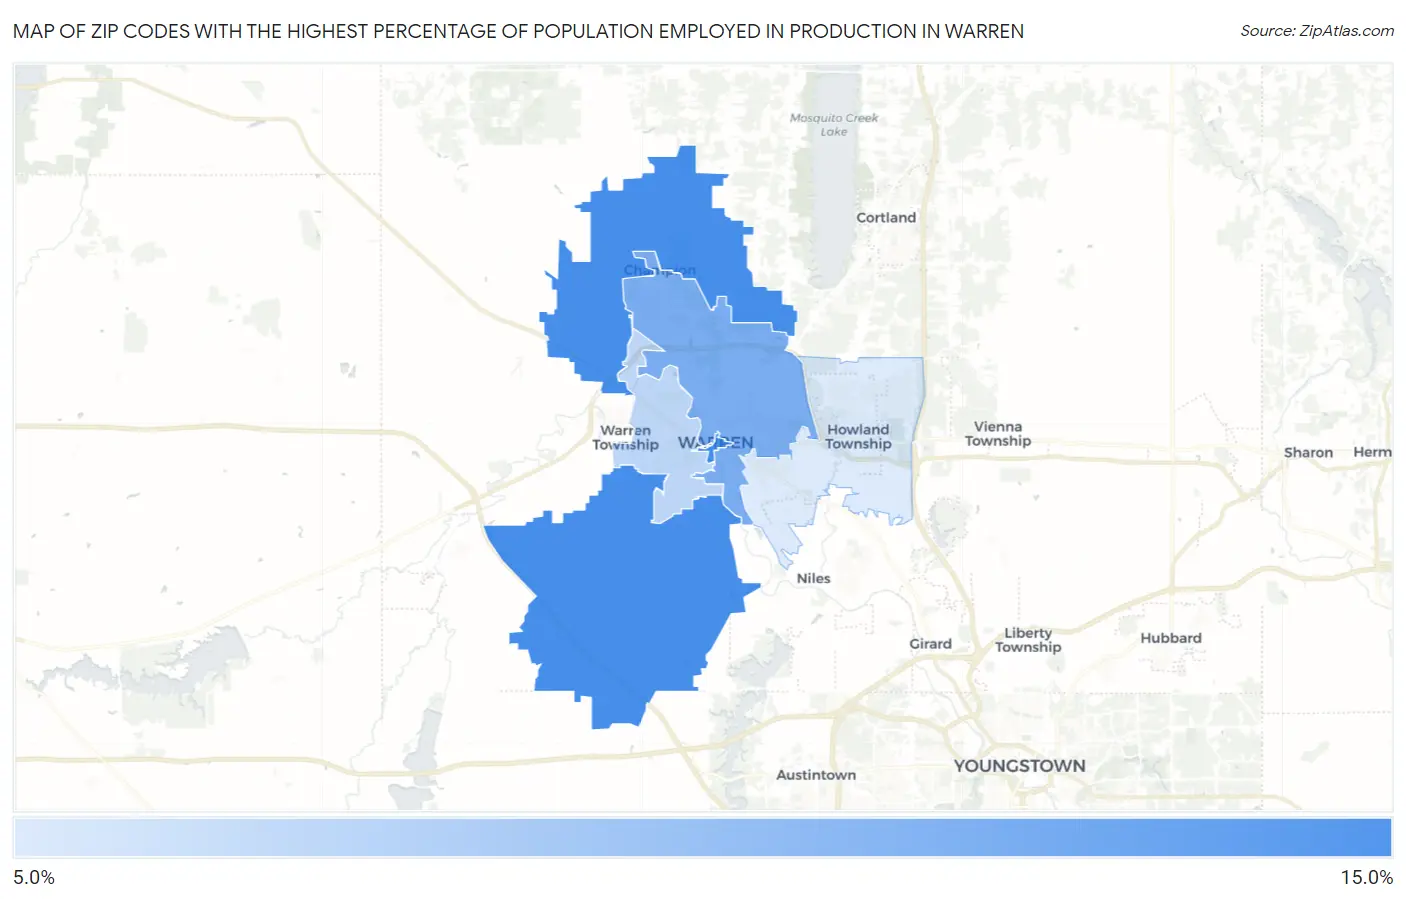
Map of Zip Codes with the Highest Percentage of Population Employed in Production in Warren
10.6%
14.1%
Zip Codes with the Highest Percentage of Population Employed in Production in Warren, OH
| Zip Code | % Employed | vs State | vs National | |
| 1. | 44481 | 14.1% | 8.1%(+6.03)#278 | 5.5%(+8.61)#3,746 |
| 2. | 44483 | 12.9% | 8.1%(+4.83)#351 | 5.5%(+7.42)#4,632 |
| 3. | 44485 | 11.4% | 8.1%(+3.32)#446 | 5.5%(+5.91)#6,113 |
| 4. | 44484 | 10.6% | 8.1%(+2.57)#488 | 5.5%(+5.16)#7,004 |
1
Common Questions
What are the Top 3 Zip Codes with the Highest Percentage of Population Employed in Production in Warren, OH?
Top 3 Zip Codes with the Highest Percentage of Population Employed in Production in Warren, OH are:
What zip code has the Highest Percentage of Population Employed in Production in Warren, OH?
44481 has the Highest Percentage of Population Employed in Production in Warren, OH with 14.1%.
What is the Percentage of Population Employed in Production in Warren, OH?
Percentage of Population Employed in Production in Warren is 12.9%.
What is the Percentage of Population Employed in Production in Ohio?
Percentage of Population Employed in Production in Ohio is 8.1%.
What is the Percentage of Population Employed in Production in the United States?
Percentage of Population Employed in Production in the United States is 5.5%.