Ravenna, OH Map & Demographics
Ravenna Map
Ravenna Overview
$29,996
PER CAPITA INCOME
$67,344
AVG FAMILY INCOME
$48,221
AVG HOUSEHOLD INCOME
21.3%
WAGE / INCOME GAP [ % ]
78.7¢/ $1
WAGE / INCOME GAP [ $ ]
$8,497
FAMILY INCOME DEFICIT
0.49
INEQUALITY / GINI INDEX
11,323
TOTAL POPULATION
5,535
MALE POPULATION
5,788
FEMALE POPULATION
95.63
MALES / 100 FEMALES
104.57
FEMALES / 100 MALES
41.0
MEDIAN AGE
3.0
AVG FAMILY SIZE
2.2
AVG HOUSEHOLD SIZE
5,814
LABOR FORCE [ PEOPLE ]
62.7%
PERCENT IN LABOR FORCE
7.0%
UNEMPLOYMENT RATE
Ravenna Zip Codes
Income in Ravenna
Income Overview in Ravenna
Per Capita Income in Ravenna is $29,996, while median incomes of families and households are $67,344 and $48,221 respectively.
| Characteristic | Number | Measure |
| Per Capita Income | 11,323 | $29,996 |
| Median Family Income | 2,646 | $67,344 |
| Mean Family Income | 2,646 | $82,663 |
| Median Household Income | 5,020 | $48,221 |
| Mean Household Income | 5,020 | $65,646 |
| Income Deficit | 2,646 | $8,497 |
| Wage / Income Gap (%) | 11,323 | 21.31% |
| Wage / Income Gap ($) | 11,323 | 78.69¢ per $1 |
| Gini / Inequality Index | 11,323 | 0.49 |
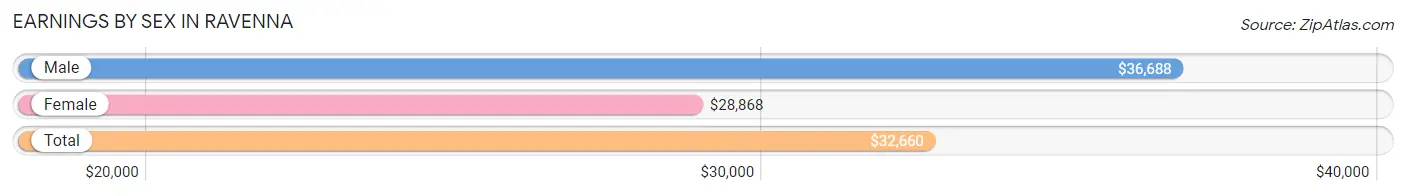
Earnings by Sex in Ravenna
Average Earnings in Ravenna are $32,660, $36,688 for men and $28,868 for women, a difference of 21.3%.
| Sex | Number | Average Earnings |
| Male | 3,193 (53.9%) | $36,688 |
| Female | 2,731 (46.1%) | $28,868 |
| Total | 5,924 (100.0%) | $32,660 |
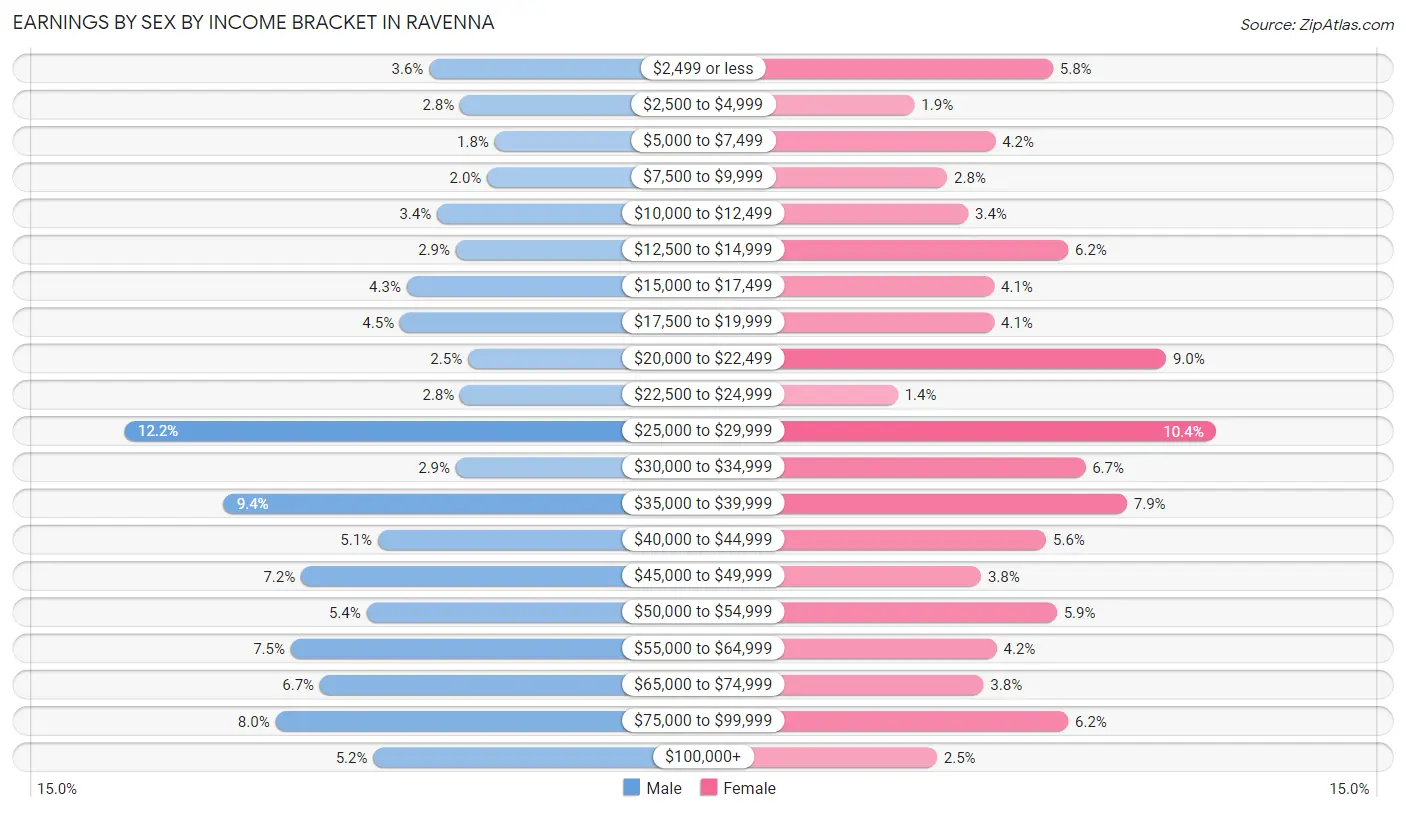
Earnings by Sex by Income Bracket in Ravenna
The most common earnings brackets in Ravenna are $25,000 to $29,999 for men (389 | 12.2%) and $25,000 to $29,999 for women (283 | 10.4%).
| Income | Male | Female |
| $2,499 or less | 116 (3.6%) | 158 (5.8%) |
| $2,500 to $4,999 | 88 (2.8%) | 52 (1.9%) |
| $5,000 to $7,499 | 57 (1.8%) | 114 (4.2%) |
| $7,500 to $9,999 | 64 (2.0%) | 77 (2.8%) |
| $10,000 to $12,499 | 109 (3.4%) | 93 (3.4%) |
| $12,500 to $14,999 | 92 (2.9%) | 170 (6.2%) |
| $15,000 to $17,499 | 136 (4.3%) | 113 (4.1%) |
| $17,500 to $19,999 | 142 (4.4%) | 113 (4.1%) |
| $20,000 to $22,499 | 81 (2.5%) | 245 (9.0%) |
| $22,500 to $24,999 | 88 (2.8%) | 39 (1.4%) |
| $25,000 to $29,999 | 389 (12.2%) | 283 (10.4%) |
| $30,000 to $34,999 | 92 (2.9%) | 183 (6.7%) |
| $35,000 to $39,999 | 300 (9.4%) | 215 (7.9%) |
| $40,000 to $44,999 | 162 (5.1%) | 153 (5.6%) |
| $45,000 to $49,999 | 231 (7.2%) | 103 (3.8%) |
| $50,000 to $54,999 | 172 (5.4%) | 161 (5.9%) |
| $55,000 to $64,999 | 240 (7.5%) | 115 (4.2%) |
| $65,000 to $74,999 | 214 (6.7%) | 105 (3.8%) |
| $75,000 to $99,999 | 254 (8.0%) | 170 (6.2%) |
| $100,000+ | 166 (5.2%) | 69 (2.5%) |
| Total | 3,193 (100.0%) | 2,731 (100.0%) |
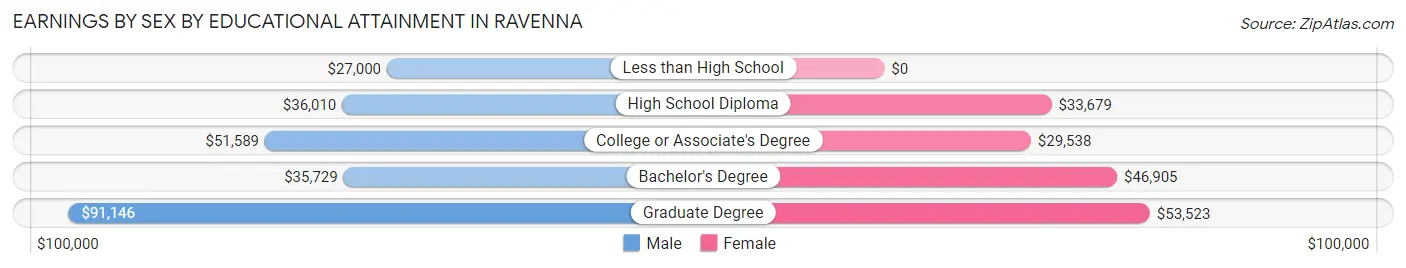
Earnings by Sex by Educational Attainment in Ravenna
Average earnings in Ravenna are $38,666 for men and $35,328 for women, a difference of 8.6%. Men with an educational attainment of graduate degree enjoy the highest average annual earnings of $91,146, while those with less than high school education earn the least with $27,000. Women with an educational attainment of graduate degree earn the most with the average annual earnings of $53,523, while those with college or associate's degree education have the smallest earnings of $29,538.
| Educational Attainment | Male Income | Female Income |
| Less than High School | $27,000 | $0 |
| High School Diploma | $36,010 | $33,679 |
| College or Associate's Degree | $51,589 | $29,538 |
| Bachelor's Degree | $35,729 | $46,905 |
| Graduate Degree | $91,146 | $53,523 |
| Total | $38,666 | $35,328 |
Family Income in Ravenna
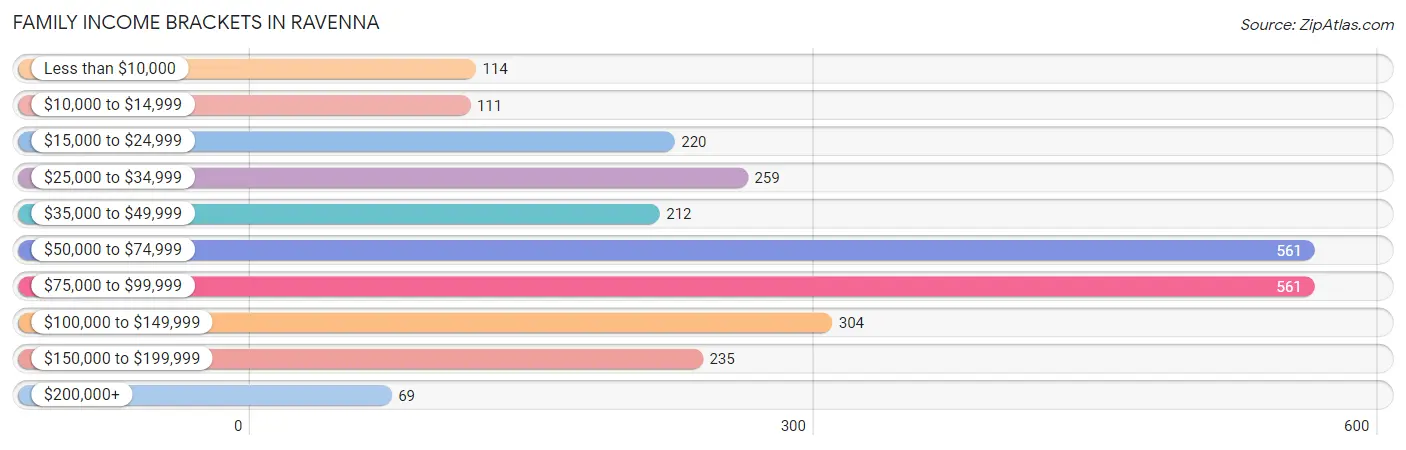
Family Income Brackets in Ravenna
According to the Ravenna family income data, there are 561 families falling into the $50,000 to $74,999 income range, which is the most common income bracket and makes up 21.2% of all families. Conversely, the $200,000+ income bracket is the least frequent group with only 69 families (2.6%) belonging to this category.
| Income Bracket | # Families | % Families |
| Less than $10,000 | 114 | 4.3% |
| $10,000 to $14,999 | 111 | 4.2% |
| $15,000 to $24,999 | 220 | 8.3% |
| $25,000 to $34,999 | 259 | 9.8% |
| $35,000 to $49,999 | 212 | 8.0% |
| $50,000 to $74,999 | 561 | 21.2% |
| $75,000 to $99,999 | 561 | 21.2% |
| $100,000 to $149,999 | 304 | 11.5% |
| $150,000 to $199,999 | 235 | 8.9% |
| $200,000+ | 69 | 2.6% |
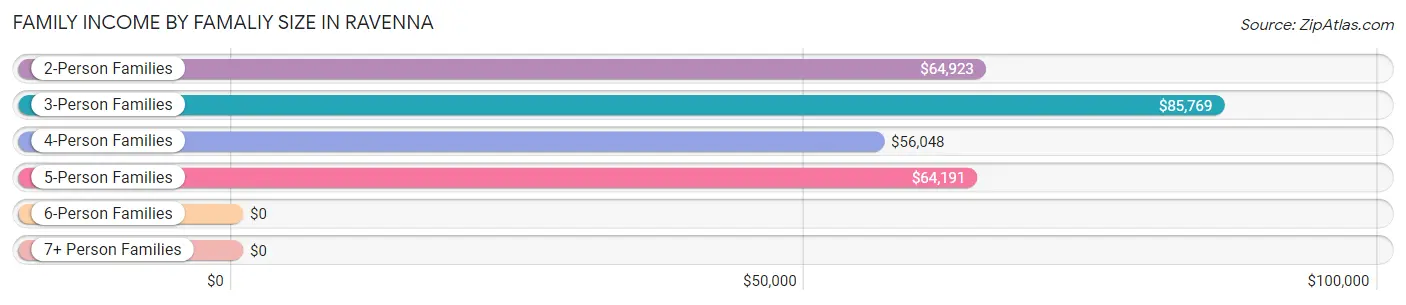
Family Income by Famaliy Size in Ravenna
3-person families (594 | 22.5%) account for the highest median family income in Ravenna with $85,769 per family, while 2-person families (1,326 | 50.1%) have the highest median income of $32,462 per family member.
| Income Bracket | # Families | Median Income |
| 2-Person Families | 1,326 (50.1%) | $64,923 |
| 3-Person Families | 594 (22.5%) | $85,769 |
| 4-Person Families | 420 (15.9%) | $56,048 |
| 5-Person Families | 217 (8.2%) | $64,191 |
| 6-Person Families | 89 (3.4%) | $0 |
| 7+ Person Families | 0 (0.0%) | $0 |
| Total | 2,646 (100.0%) | $67,344 |
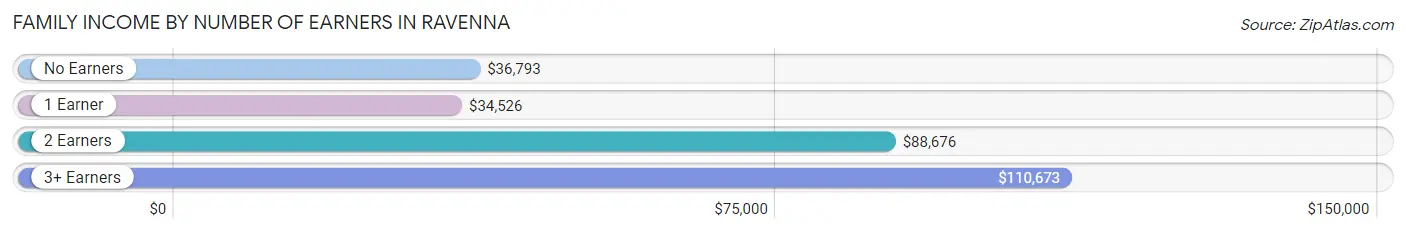
Family Income by Number of Earners in Ravenna
The median family income in Ravenna is $67,344, with families comprising 3+ earners (413) having the highest median family income of $110,673, while families with 1 earner (1,072) have the lowest median family income of $34,526, accounting for 15.6% and 40.5% of families, respectively.
| Number of Earners | # Families | Median Income |
| No Earners | 285 (10.8%) | $36,793 |
| 1 Earner | 1,072 (40.5%) | $34,526 |
| 2 Earners | 876 (33.1%) | $88,676 |
| 3+ Earners | 413 (15.6%) | $110,673 |
| Total | 2,646 (100.0%) | $67,344 |
Household Income in Ravenna
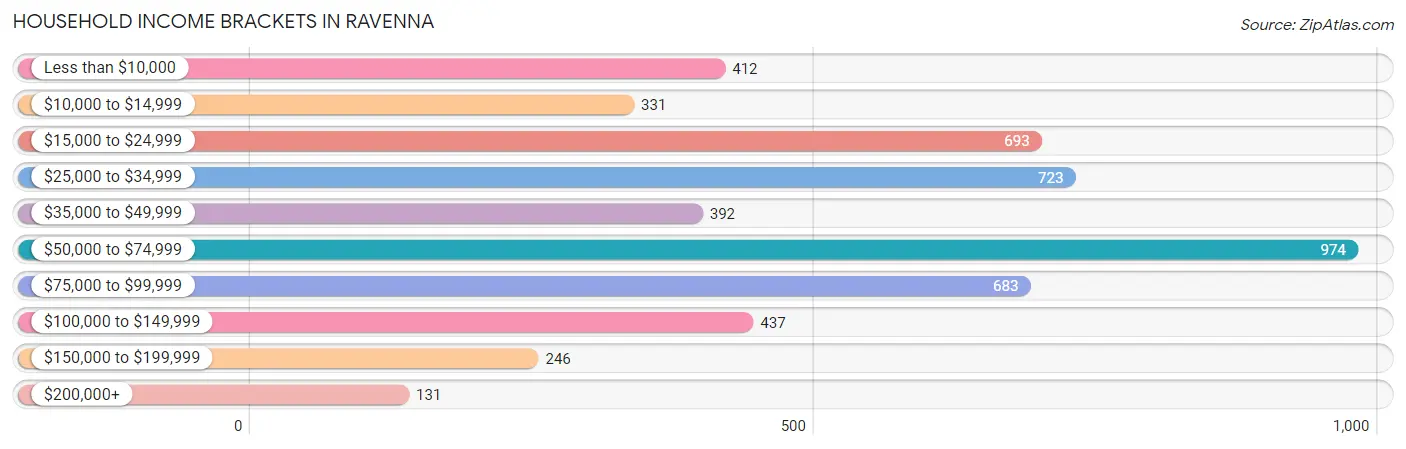
Household Income Brackets in Ravenna
With 974 households falling in the category, the $50,000 to $74,999 income range is the most frequent in Ravenna, accounting for 19.4% of all households. In contrast, only 131 households (2.6%) fall into the $200,000+ income bracket, making it the least populous group.
| Income Bracket | # Households | % Households |
| Less than $10,000 | 412 | 8.2% |
| $10,000 to $14,999 | 331 | 6.6% |
| $15,000 to $24,999 | 693 | 13.8% |
| $25,000 to $34,999 | 723 | 14.4% |
| $35,000 to $49,999 | 392 | 7.8% |
| $50,000 to $74,999 | 974 | 19.4% |
| $75,000 to $99,999 | 683 | 13.6% |
| $100,000 to $149,999 | 437 | 8.7% |
| $150,000 to $199,999 | 246 | 4.9% |
| $200,000+ | 131 | 2.6% |
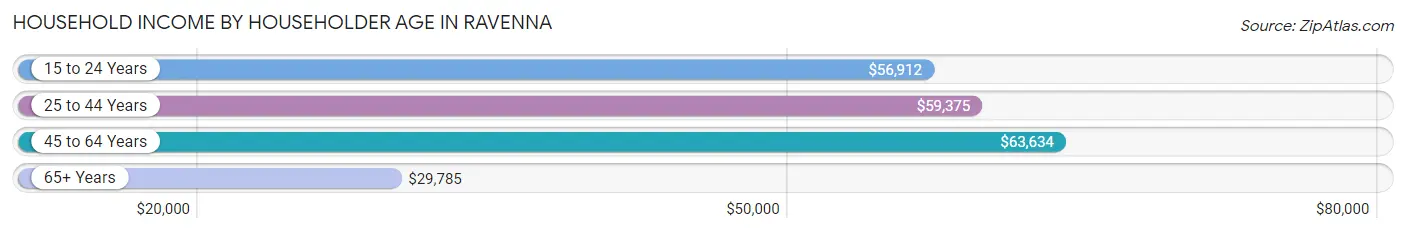
Household Income by Householder Age in Ravenna
The median household income in Ravenna is $48,221, with the highest median household income of $63,634 found in the 45 to 64 years age bracket for the primary householder. A total of 1,849 households (36.8%) fall into this category. Meanwhile, the 65+ years age bracket for the primary householder has the lowest median household income of $29,785, with 1,608 households (32.0%) in this group.
| Income Bracket | # Households | Median Income |
| 15 to 24 Years | 188 (3.7%) | $56,912 |
| 25 to 44 Years | 1,375 (27.4%) | $59,375 |
| 45 to 64 Years | 1,849 (36.8%) | $63,634 |
| 65+ Years | 1,608 (32.0%) | $29,785 |
| Total | 5,020 (100.0%) | $48,221 |
Poverty in Ravenna
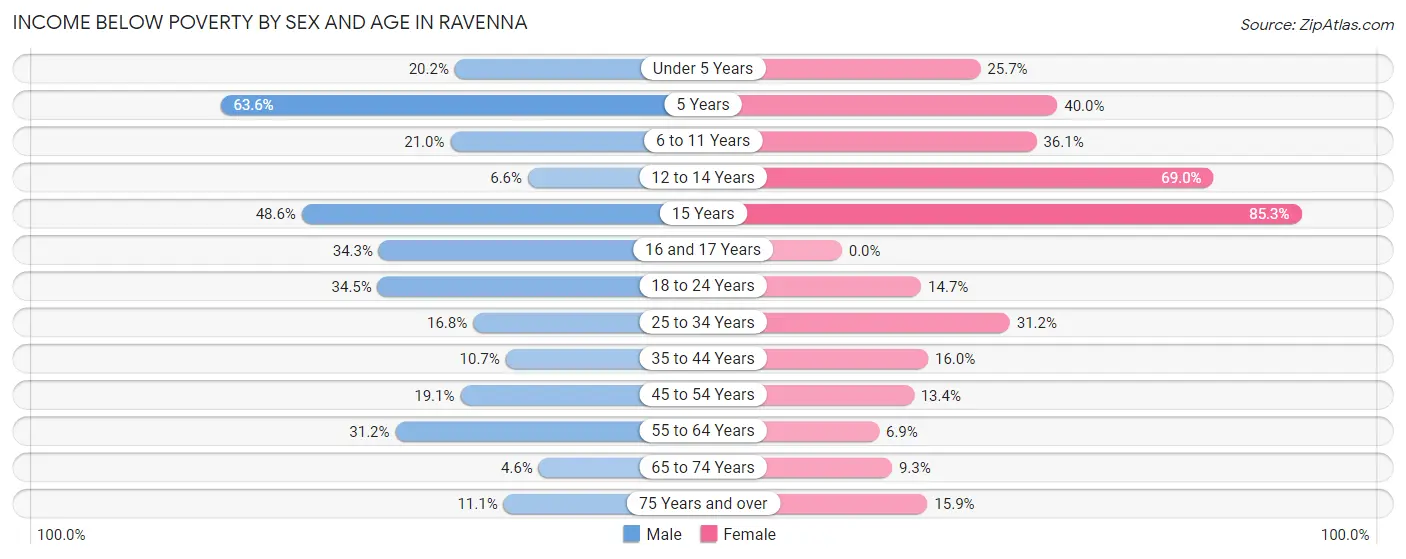
Income Below Poverty by Sex and Age in Ravenna
With 20.2% poverty level for males and 19.5% for females among the residents of Ravenna, 5 year old males and 15 year old females are the most vulnerable to poverty, with 49 males (63.6%) and 29 females (85.3%) in their respective age groups living below the poverty level.
| Age Bracket | Male | Female |
| Under 5 Years | 49 (20.2%) | 62 (25.7%) |
| 5 Years | 49 (63.6%) | 16 (40.0%) |
| 6 to 11 Years | 98 (21.0%) | 202 (36.1%) |
| 12 to 14 Years | 11 (6.6%) | 100 (69.0%) |
| 15 Years | 34 (48.6%) | 29 (85.3%) |
| 16 and 17 Years | 25 (34.3%) | 0 (0.0%) |
| 18 to 24 Years | 181 (34.5%) | 94 (14.7%) |
| 25 to 34 Years | 134 (16.8%) | 227 (31.2%) |
| 35 to 44 Years | 67 (10.7%) | 90 (16.0%) |
| 45 to 54 Years | 134 (19.1%) | 102 (13.4%) |
| 55 to 64 Years | 270 (31.2%) | 52 (6.9%) |
| 65 to 74 Years | 28 (4.6%) | 68 (9.3%) |
| 75 Years and over | 29 (11.1%) | 72 (15.9%) |
| Total | 1,109 (20.2%) | 1,114 (19.5%) |
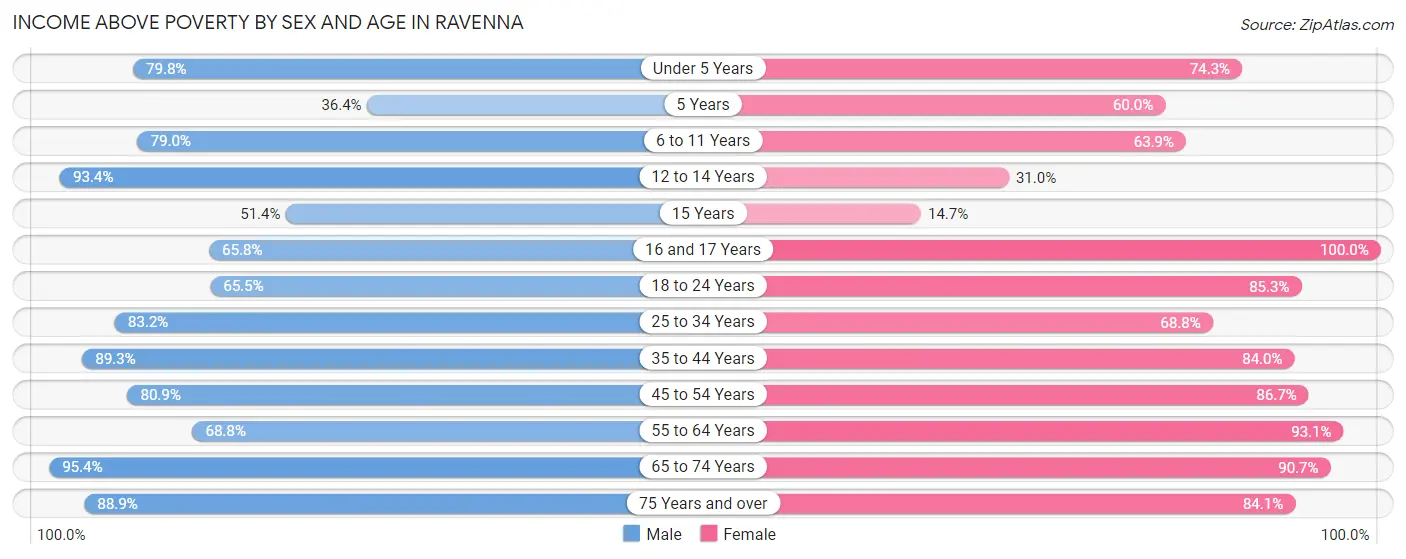
Income Above Poverty by Sex and Age in Ravenna
According to the poverty statistics in Ravenna, males aged 65 to 74 years and females aged 16 and 17 years are the age groups that are most secure financially, with 95.4% of males and 100.0% of females in these age groups living above the poverty line.
| Age Bracket | Male | Female |
| Under 5 Years | 194 (79.8%) | 179 (74.3%) |
| 5 Years | 28 (36.4%) | 24 (60.0%) |
| 6 to 11 Years | 369 (79.0%) | 357 (63.9%) |
| 12 to 14 Years | 156 (93.4%) | 45 (31.0%) |
| 15 Years | 36 (51.4%) | 5 (14.7%) |
| 16 and 17 Years | 48 (65.7%) | 81 (100.0%) |
| 18 to 24 Years | 344 (65.5%) | 544 (85.3%) |
| 25 to 34 Years | 665 (83.2%) | 501 (68.8%) |
| 35 to 44 Years | 558 (89.3%) | 472 (84.0%) |
| 45 to 54 Years | 567 (80.9%) | 662 (86.7%) |
| 55 to 64 Years | 596 (68.8%) | 701 (93.1%) |
| 65 to 74 Years | 583 (95.4%) | 662 (90.7%) |
| 75 Years and over | 232 (88.9%) | 381 (84.1%) |
| Total | 4,376 (79.8%) | 4,614 (80.5%) |
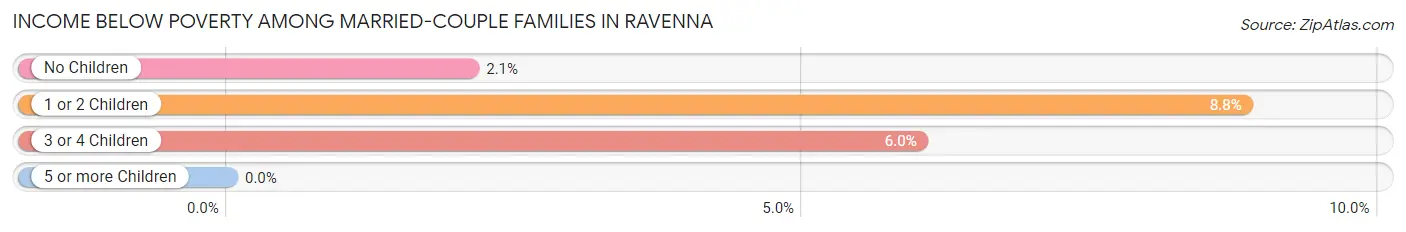
Income Below Poverty Among Married-Couple Families in Ravenna
The poverty statistics for married-couple families in Ravenna show that 4.0% or 71 of the total 1,770 families live below the poverty line. Families with 1 or 2 children have the highest poverty rate of 8.8%, comprising of 35 families. On the other hand, families with no children have the lowest poverty rate of 2.1%, which includes 25 families.
| Children | Above Poverty | Below Poverty |
| No Children | 1,166 (97.9%) | 25 (2.1%) |
| 1 or 2 Children | 361 (91.2%) | 35 (8.8%) |
| 3 or 4 Children | 172 (94.0%) | 11 (6.0%) |
| 5 or more Children | 0 (0.0%) | 0 (0.0%) |
| Total | 1,699 (96.0%) | 71 (4.0%) |
Income Below Poverty Among Single-Parent Households in Ravenna
According to the poverty data in Ravenna, 42.4% or 100 single-father households and 43.6% or 279 single-mother households are living below the poverty line. Among single-father households, those with 3 or 4 children have the highest poverty rate, with 35 households (100.0%) experiencing poverty. Likewise, among single-mother households, those with 1 or 2 children have the highest poverty rate, with 207 households (66.3%) falling below the poverty line.
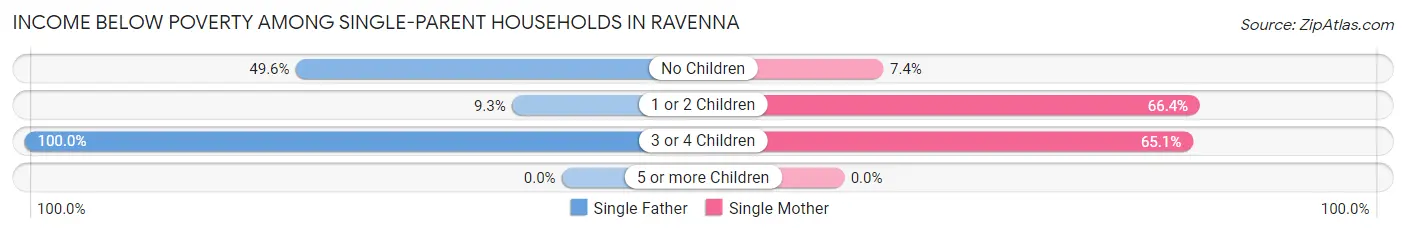
| Children | Single Father | Single Mother |
| No Children | 57 (49.6%) | 18 (7.3%) |
| 1 or 2 Children | 8 (9.3%) | 207 (66.3%) |
| 3 or 4 Children | 35 (100.0%) | 54 (65.1%) |
| 5 or more Children | 0 (0.0%) | 0 (0.0%) |
| Total | 100 (42.4%) | 279 (43.6%) |
Income Below Poverty Among Married-Couple vs Single-Parent Households in Ravenna
The poverty data for Ravenna shows that 71 of the married-couple family households (4.0%) and 379 of the single-parent households (43.3%) are living below the poverty level. Within the married-couple family households, those with 1 or 2 children have the highest poverty rate, with 35 households (8.8%) falling below the poverty line. Among the single-parent households, those with 3 or 4 children have the highest poverty rate, with 89 household (75.4%) living below poverty.
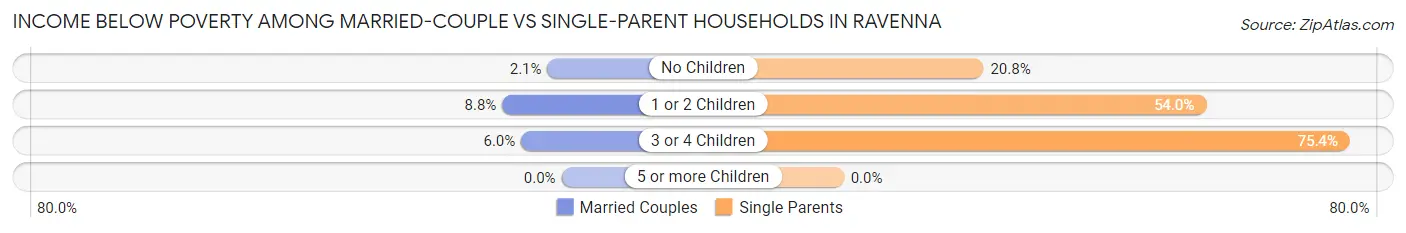
| Children | Married-Couple Families | Single-Parent Households |
| No Children | 25 (2.1%) | 75 (20.8%) |
| 1 or 2 Children | 35 (8.8%) | 215 (54.0%) |
| 3 or 4 Children | 11 (6.0%) | 89 (75.4%) |
| 5 or more Children | 0 (0.0%) | 0 (0.0%) |
| Total | 71 (4.0%) | 379 (43.3%) |
Race in Ravenna
The most populous races in Ravenna are White / Caucasian (9,061 | 80.0%), Black / African American (1,205 | 10.6%), and Two or more Races (720 | 6.4%).
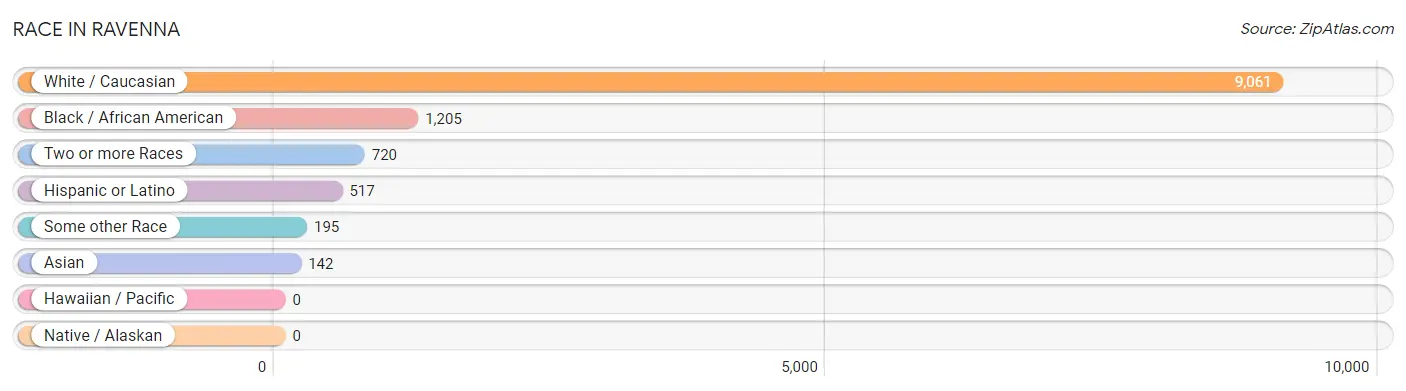
| Race | # Population | % Population |
| Asian | 142 | 1.3% |
| Black / African American | 1,205 | 10.6% |
| Hawaiian / Pacific | 0 | 0.0% |
| Hispanic or Latino | 517 | 4.6% |
| Native / Alaskan | 0 | 0.0% |
| White / Caucasian | 9,061 | 80.0% |
| Two or more Races | 720 | 6.4% |
| Some other Race | 195 | 1.7% |
| Total | 11,323 | 100.0% |
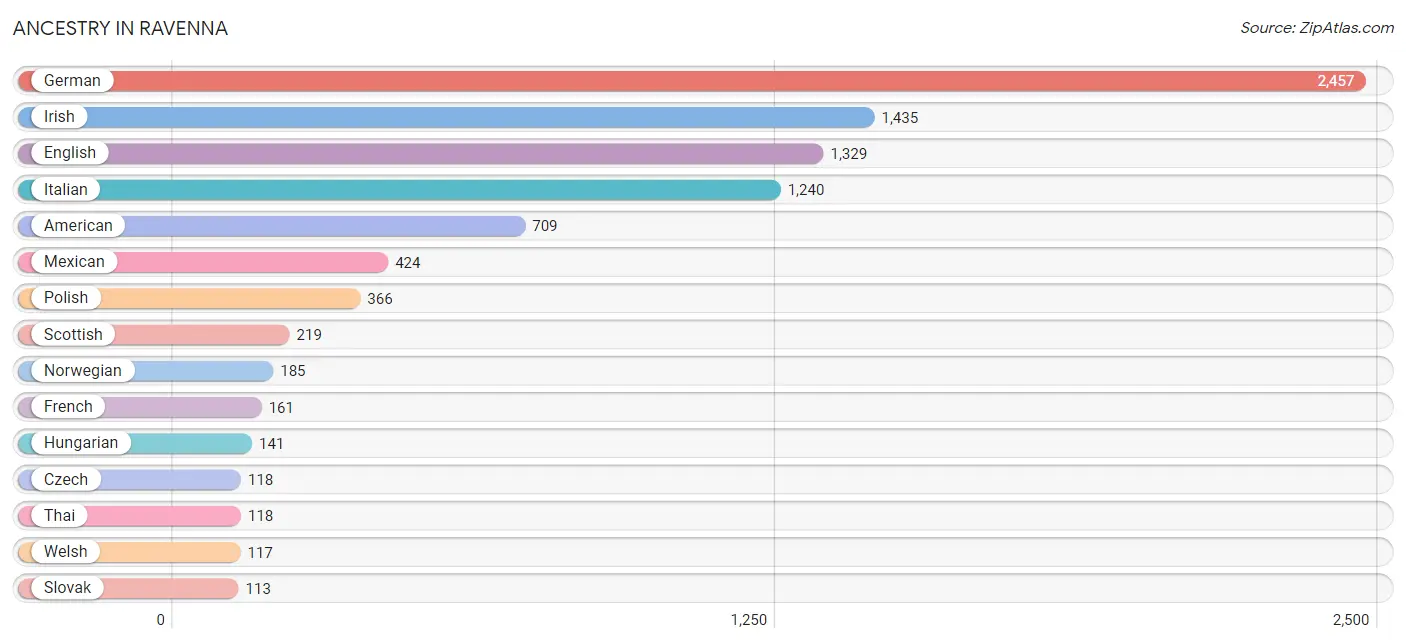
Ancestry in Ravenna
The most populous ancestries reported in Ravenna are German (2,457 | 21.7%), Irish (1,435 | 12.7%), English (1,329 | 11.7%), Italian (1,240 | 11.0%), and American (709 | 6.3%), together accounting for 63.3% of all Ravenna residents.
| Ancestry | # Population | % Population |
| American | 709 | 6.3% |
| Arab | 63 | 0.6% |
| Austrian | 21 | 0.2% |
| Bhutanese | 18 | 0.2% |
| British | 7 | 0.1% |
| Cherokee | 30 | 0.3% |
| Choctaw | 3 | 0.0% |
| Croatian | 11 | 0.1% |
| Czech | 118 | 1.0% |
| Czechoslovakian | 14 | 0.1% |
| Dutch | 102 | 0.9% |
| English | 1,329 | 11.7% |
| European | 48 | 0.4% |
| Finnish | 22 | 0.2% |
| French | 161 | 1.4% |
| German | 2,457 | 21.7% |
| Greek | 57 | 0.5% |
| Guamanian / Chamorro | 21 | 0.2% |
| Hungarian | 141 | 1.3% |
| Icelander | 6 | 0.1% |
| Indian (Asian) | 11 | 0.1% |
| Irish | 1,435 | 12.7% |
| Italian | 1,240 | 11.0% |
| Korean | 84 | 0.7% |
| Lithuanian | 50 | 0.4% |
| Mexican | 424 | 3.7% |
| Norwegian | 185 | 1.6% |
| Pennsylvania German | 11 | 0.1% |
| Polish | 366 | 3.2% |
| Puerto Rican | 23 | 0.2% |
| Romanian | 19 | 0.2% |
| Russian | 12 | 0.1% |
| Scandinavian | 8 | 0.1% |
| Scotch-Irish | 50 | 0.4% |
| Scottish | 219 | 1.9% |
| Slavic | 19 | 0.2% |
| Slovak | 113 | 1.0% |
| Spaniard | 53 | 0.5% |
| Spanish | 17 | 0.2% |
| Swedish | 31 | 0.3% |
| Swiss | 58 | 0.5% |
| Thai | 118 | 1.0% |
| Ukrainian | 74 | 0.6% |
| Welsh | 117 | 1.0% | View All 44 Rows |
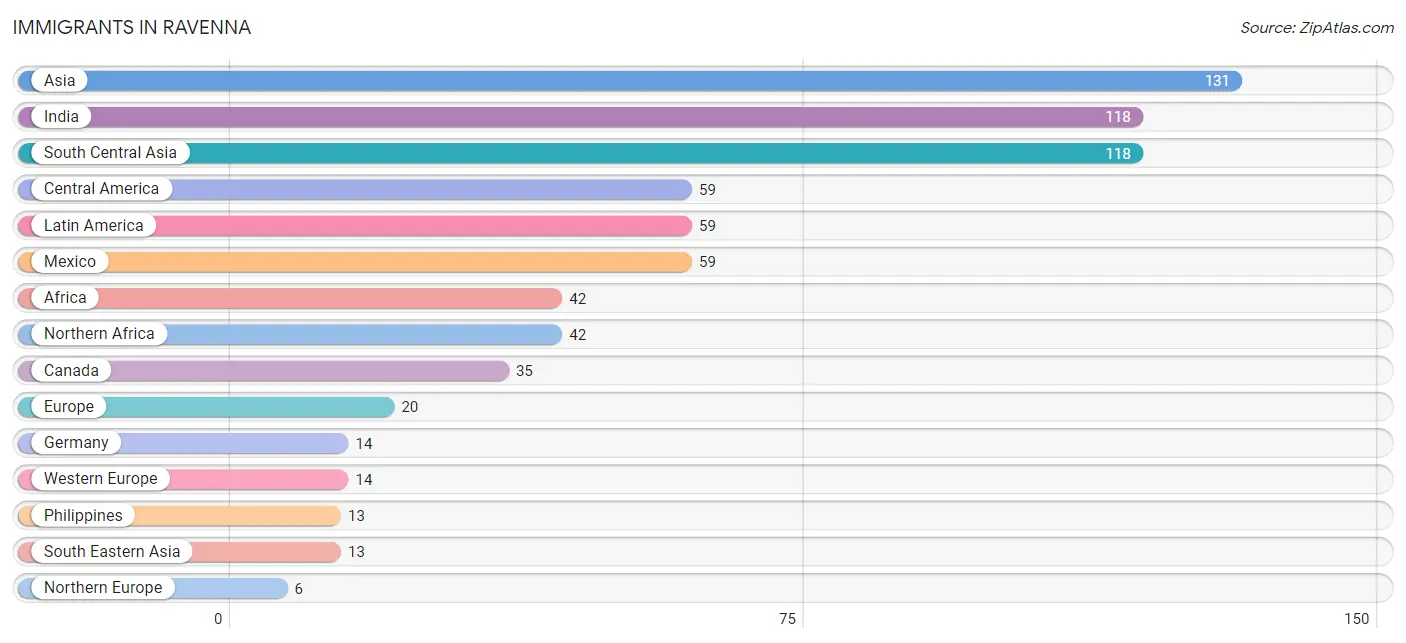
Immigrants in Ravenna
The most numerous immigrant groups reported in Ravenna came from Asia (131 | 1.2%), India (118 | 1.0%), South Central Asia (118 | 1.0%), Central America (59 | 0.5%), and Latin America (59 | 0.5%), together accounting for 4.3% of all Ravenna residents.
| Immigration Origin | # Population | % Population |
| Africa | 42 | 0.4% |
| Asia | 131 | 1.2% |
| Canada | 35 | 0.3% |
| Central America | 59 | 0.5% |
| Europe | 20 | 0.2% |
| Germany | 14 | 0.1% |
| India | 118 | 1.0% |
| Latin America | 59 | 0.5% |
| Mexico | 59 | 0.5% |
| Northern Africa | 42 | 0.4% |
| Northern Europe | 6 | 0.1% |
| Philippines | 13 | 0.1% |
| South Central Asia | 118 | 1.0% |
| South Eastern Asia | 13 | 0.1% |
| Western Europe | 14 | 0.1% | View All 15 Rows |
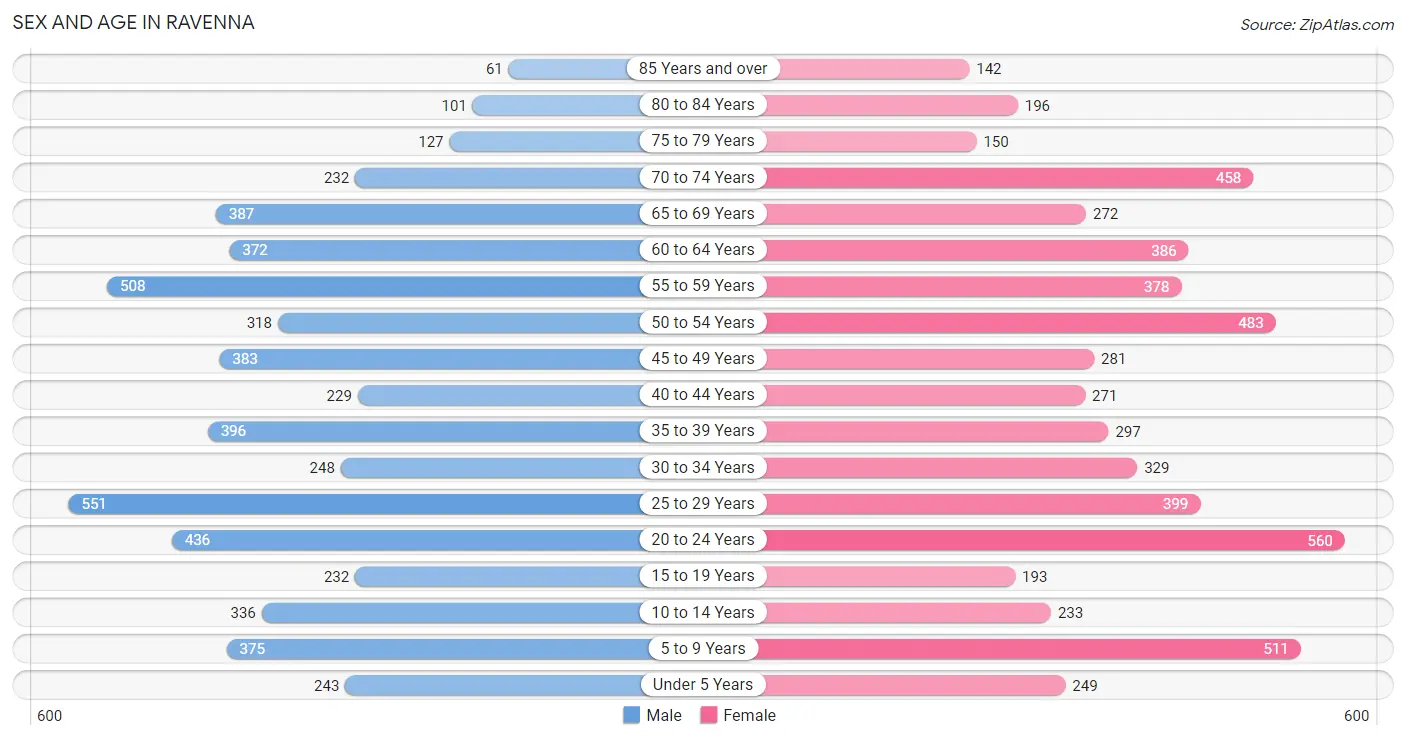
Sex and Age in Ravenna
Sex and Age in Ravenna
The most populous age groups in Ravenna are 25 to 29 Years (551 | 10.0%) for men and 20 to 24 Years (560 | 9.7%) for women.
| Age Bracket | Male | Female |
| Under 5 Years | 243 (4.4%) | 249 (4.3%) |
| 5 to 9 Years | 375 (6.8%) | 511 (8.8%) |
| 10 to 14 Years | 336 (6.1%) | 233 (4.0%) |
| 15 to 19 Years | 232 (4.2%) | 193 (3.3%) |
| 20 to 24 Years | 436 (7.9%) | 560 (9.7%) |
| 25 to 29 Years | 551 (10.0%) | 399 (6.9%) |
| 30 to 34 Years | 248 (4.5%) | 329 (5.7%) |
| 35 to 39 Years | 396 (7.1%) | 297 (5.1%) |
| 40 to 44 Years | 229 (4.1%) | 271 (4.7%) |
| 45 to 49 Years | 383 (6.9%) | 281 (4.9%) |
| 50 to 54 Years | 318 (5.8%) | 483 (8.3%) |
| 55 to 59 Years | 508 (9.2%) | 378 (6.5%) |
| 60 to 64 Years | 372 (6.7%) | 386 (6.7%) |
| 65 to 69 Years | 387 (7.0%) | 272 (4.7%) |
| 70 to 74 Years | 232 (4.2%) | 458 (7.9%) |
| 75 to 79 Years | 127 (2.3%) | 150 (2.6%) |
| 80 to 84 Years | 101 (1.8%) | 196 (3.4%) |
| 85 Years and over | 61 (1.1%) | 142 (2.5%) |
| Total | 5,535 (100.0%) | 5,788 (100.0%) |
Families and Households in Ravenna
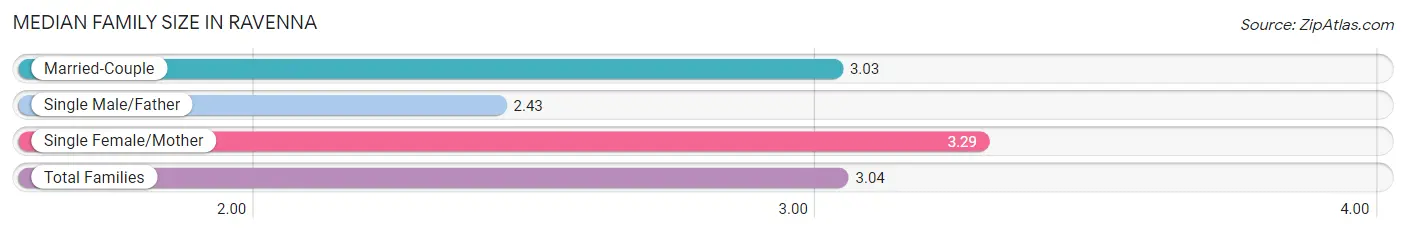
Median Family Size in Ravenna
The median family size in Ravenna is 3.04 persons per family, with single female/mother families (640 | 24.2%) accounting for the largest median family size of 3.29 persons per family. On the other hand, single male/father families (236 | 8.9%) represent the smallest median family size with 2.43 persons per family.
| Family Type | # Families | Family Size |
| Married-Couple | 1,770 (66.9%) | 3.03 |
| Single Male/Father | 236 (8.9%) | 2.43 |
| Single Female/Mother | 640 (24.2%) | 3.29 |
| Total Families | 2,646 (100.0%) | 3.04 |
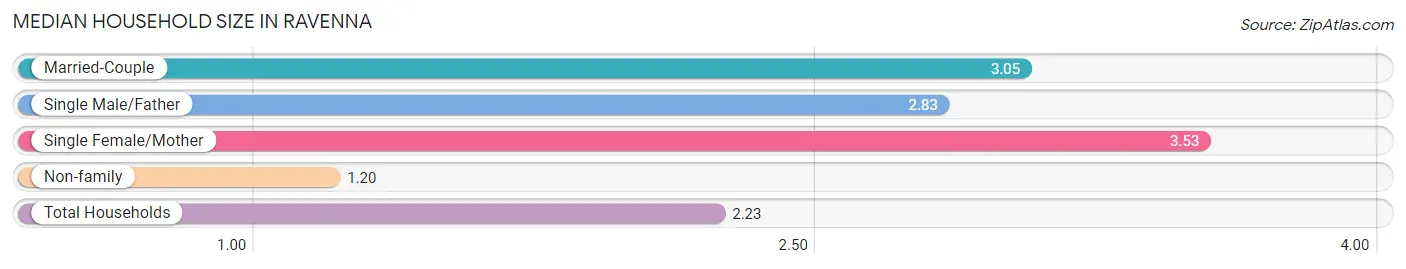
Median Household Size in Ravenna
The median household size in Ravenna is 2.23 persons per household, with single female/mother households (640 | 12.8%) accounting for the largest median household size of 3.53 persons per household. non-family households (2,374 | 47.3%) represent the smallest median household size with 1.20 persons per household.
| Household Type | # Households | Household Size |
| Married-Couple | 1,770 (35.3%) | 3.05 |
| Single Male/Father | 236 (4.7%) | 2.83 |
| Single Female/Mother | 640 (12.8%) | 3.53 |
| Non-family | 2,374 (47.3%) | 1.20 |
| Total Households | 5,020 (100.0%) | 2.23 |
Household Size by Marriage Status in Ravenna
Out of a total of 5,020 households in Ravenna, 2,646 (52.7%) are family households, while 2,374 (47.3%) are nonfamily households. The most numerous type of family households are 2-person households, comprising 1,163, and the most common type of nonfamily households are 1-person households, comprising 2,017.
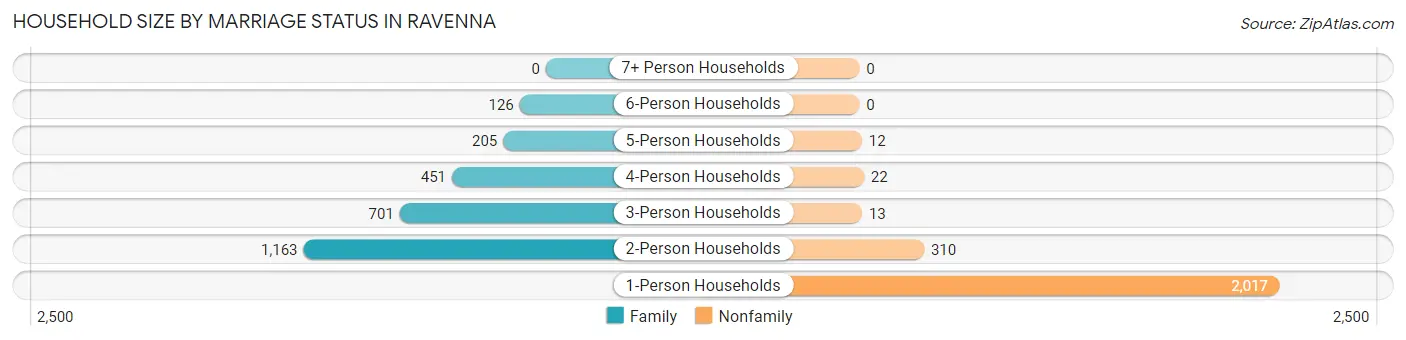
| Household Size | Family Households | Nonfamily Households |
| 1-Person Households | - | 2,017 (40.2%) |
| 2-Person Households | 1,163 (23.2%) | 310 (6.2%) |
| 3-Person Households | 701 (14.0%) | 13 (0.3%) |
| 4-Person Households | 451 (9.0%) | 22 (0.4%) |
| 5-Person Households | 205 (4.1%) | 12 (0.2%) |
| 6-Person Households | 126 (2.5%) | 0 (0.0%) |
| 7+ Person Households | 0 (0.0%) | 0 (0.0%) |
| Total | 2,646 (52.7%) | 2,374 (47.3%) |
Female Fertility in Ravenna
Fertility by Age in Ravenna
Average fertility rate in Ravenna is 27.0 births per 1,000 women. Women in the age bracket of 35 to 50 years have the highest fertility rate with 49.0 births per 1,000 women. Women in the age bracket of 35 to 50 years acount for 70.2% of all women with births.
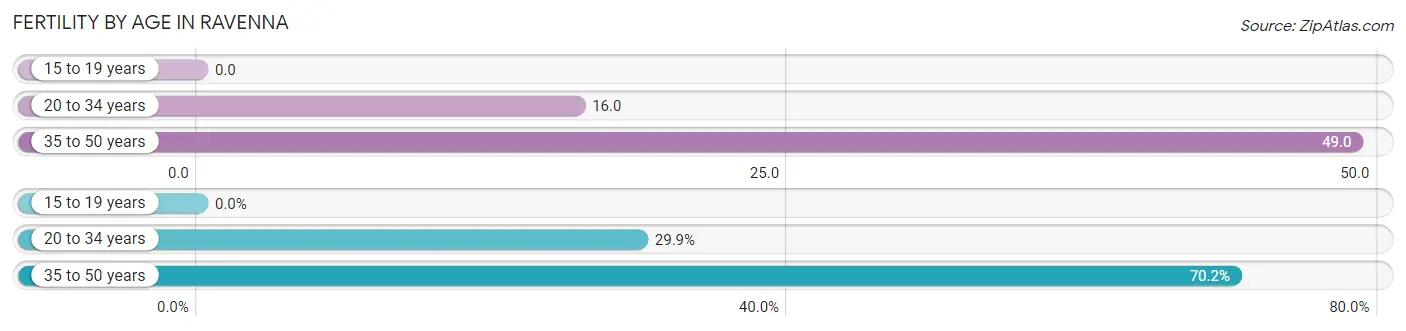
| Age Bracket | Women with Births | Births / 1,000 Women |
| 15 to 19 years | 0 (0.0%) | 0.0 |
| 20 to 34 years | 20 (29.8%) | 16.0 |
| 35 to 50 years | 47 (70.2%) | 49.0 |
| Total | 67 (100.0%) | 27.0 |
Fertility by Age by Marriage Status in Ravenna
83.6% of women with births (67) in Ravenna are married. The highest percentage of unmarried women with births falls into 20 to 34 years age bracket with 55.0% of them unmarried at the time of birth, while the lowest percentage of unmarried women with births belong to 35 to 50 years age bracket with 0.0% of them unmarried.
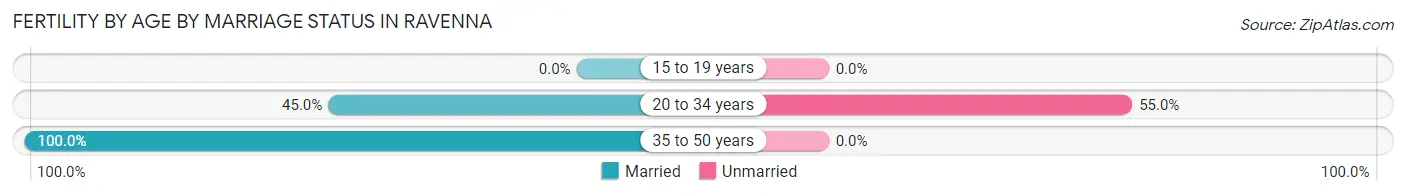
| Age Bracket | Married | Unmarried |
| 15 to 19 years | 0 (0.0%) | 0 (0.0%) |
| 20 to 34 years | 9 (45.0%) | 11 (55.0%) |
| 35 to 50 years | 47 (100.0%) | 0 (0.0%) |
| Total | 56 (83.6%) | 11 (16.4%) |
Fertility by Education in Ravenna
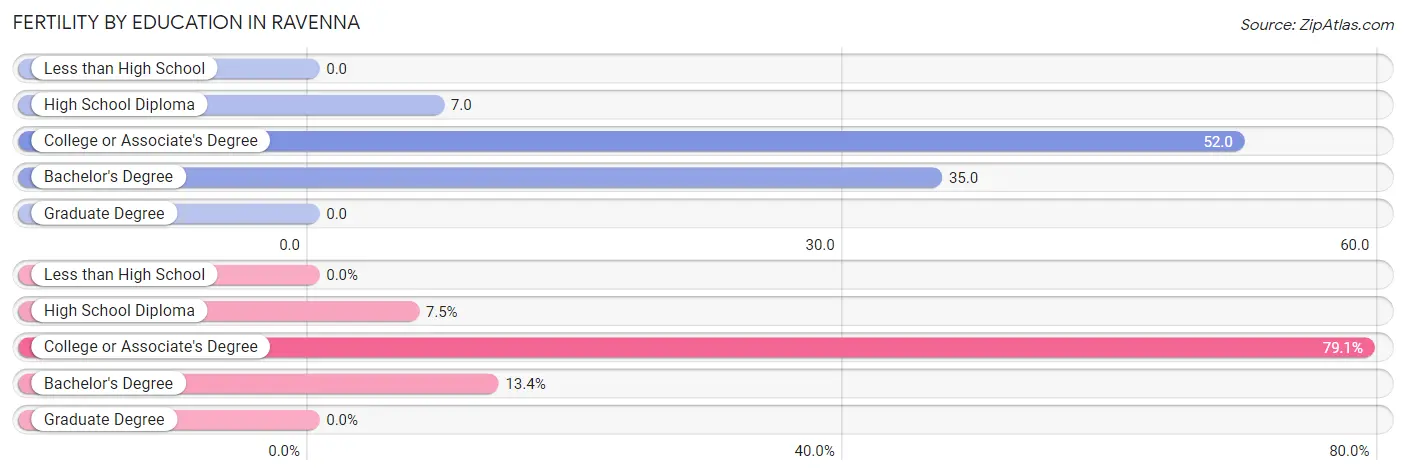
| Educational Attainment | Women with Births | Births / 1,000 Women |
| Less than High School | 0 (0.0%) | 0.0 |
| High School Diploma | 5 (7.5%) | 7.0 |
| College or Associate's Degree | 53 (79.1%) | 52.0 |
| Bachelor's Degree | 9 (13.4%) | 35.0 |
| Graduate Degree | 0 (0.0%) | 0.0 |
| Total | 67 (100.0%) | 27.0 |
Fertility by Education by Marriage Status in Ravenna
16.4% of women with births in Ravenna are unmarried. Women with the educational attainment of bachelor's degree are most likely to be married with 100.0% of them married at childbirth, while women with the educational attainment of high school diploma are least likely to be married with 100.0% of them unmarried at childbirth.
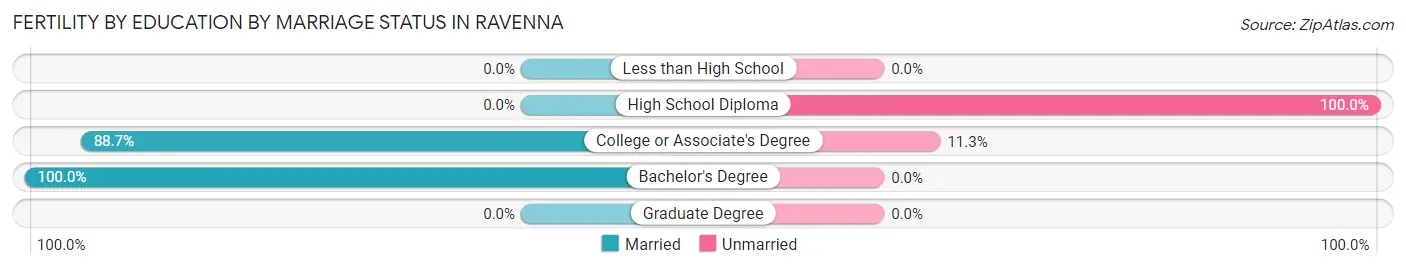
| Educational Attainment | Married | Unmarried |
| Less than High School | 0 (0.0%) | 0 (0.0%) |
| High School Diploma | 0 (0.0%) | 5 (100.0%) |
| College or Associate's Degree | 47 (88.7%) | 6 (11.3%) |
| Bachelor's Degree | 9 (100.0%) | 0 (0.0%) |
| Graduate Degree | 0 (0.0%) | 0 (0.0%) |
| Total | 56 (83.6%) | 11 (16.4%) |
Employment Characteristics in Ravenna
Employment by Class of Employer in Ravenna
Among the 5,257 employed individuals in Ravenna, private company employees (3,640 | 69.2%), local government employees (592 | 11.3%), and not-for-profit organizations (396 | 7.5%) make up the most common classes of employment.
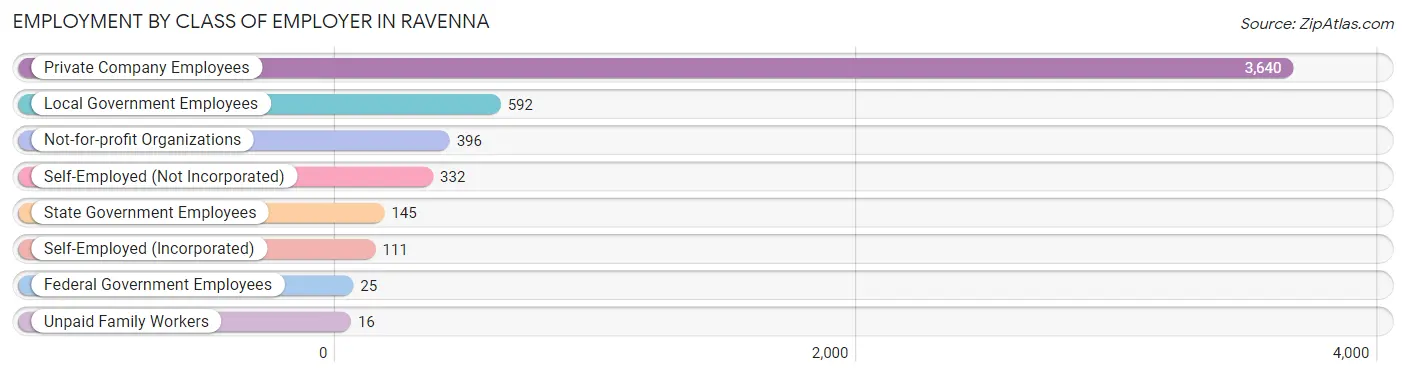
| Employer Class | # Employees | % Employees |
| Private Company Employees | 3,640 | 69.2% |
| Self-Employed (Incorporated) | 111 | 2.1% |
| Self-Employed (Not Incorporated) | 332 | 6.3% |
| Not-for-profit Organizations | 396 | 7.5% |
| Local Government Employees | 592 | 11.3% |
| State Government Employees | 145 | 2.8% |
| Federal Government Employees | 25 | 0.5% |
| Unpaid Family Workers | 16 | 0.3% |
| Total | 5,257 | 100.0% |
Employment Status by Age in Ravenna
According to the labor force statistics for Ravenna, out of the total population over 16 years of age (9,272), 62.7% or 5,814 individuals are in the labor force, with 7.0% or 407 of them unemployed. The age group with the highest labor force participation rate is 25 to 29 years, with 97.6% or 927 individuals in the labor force. Within the labor force, the 16 to 19 years age range has the highest percentage of unemployed individuals, with 16.7% or 22 of them being unemployed.
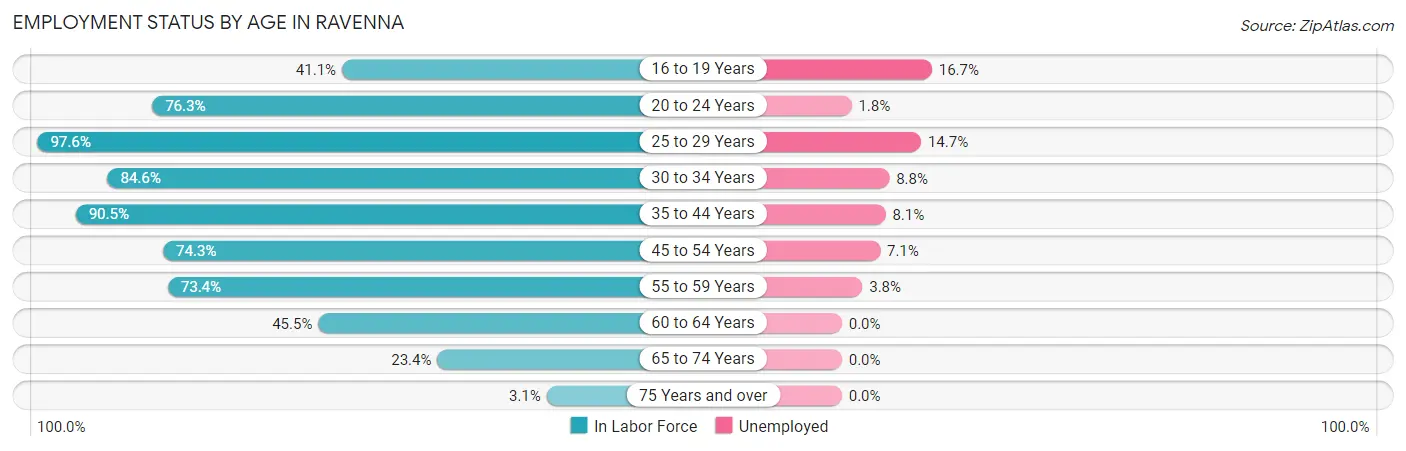
| Age Bracket | In Labor Force | Unemployed |
| 16 to 19 Years | 132 (41.1%) | 22 (16.7%) |
| 20 to 24 Years | 760 (76.3%) | 14 (1.8%) |
| 25 to 29 Years | 927 (97.6%) | 136 (14.7%) |
| 30 to 34 Years | 488 (84.6%) | 43 (8.8%) |
| 35 to 44 Years | 1,080 (90.5%) | 87 (8.1%) |
| 45 to 54 Years | 1,088 (74.3%) | 77 (7.1%) |
| 55 to 59 Years | 650 (73.4%) | 25 (3.8%) |
| 60 to 64 Years | 345 (45.5%) | 0 (0.0%) |
| 65 to 74 Years | 316 (23.4%) | 0 (0.0%) |
| 75 Years and over | 24 (3.1%) | 0 (0.0%) |
| Total | 5,814 (62.7%) | 407 (7.0%) |
Employment Status by Educational Attainment in Ravenna
According to labor force statistics for Ravenna, 78.6% of individuals (4,582) out of the total population between 25 and 64 years of age (5,829) are in the labor force, with 8.1% or 371 of them being unemployed. The group with the highest labor force participation rate are those with the educational attainment of bachelor's degree or higher, with 93.5% or 1,067 individuals in the labor force. Within the labor force, individuals with less than high school education have the highest percentage of unemployment, with 16.9% or 54 of them being unemployed.
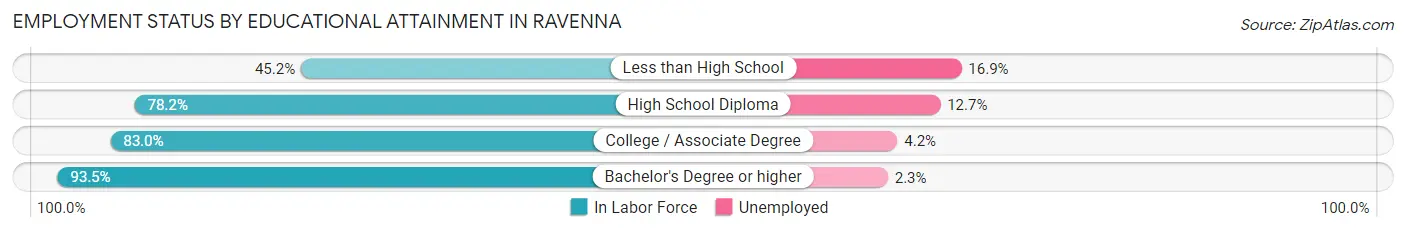
| Educational Attainment | In Labor Force | Unemployed |
| Less than High School | 319 (45.2%) | 119 (16.9%) |
| High School Diploma | 1,840 (78.2%) | 299 (12.7%) |
| College / Associate Degree | 1,353 (83.0%) | 68 (4.2%) |
| Bachelor's Degree or higher | 1,067 (93.5%) | 26 (2.3%) |
| Total | 4,582 (78.6%) | 472 (8.1%) |
Employment Occupations by Sex in Ravenna
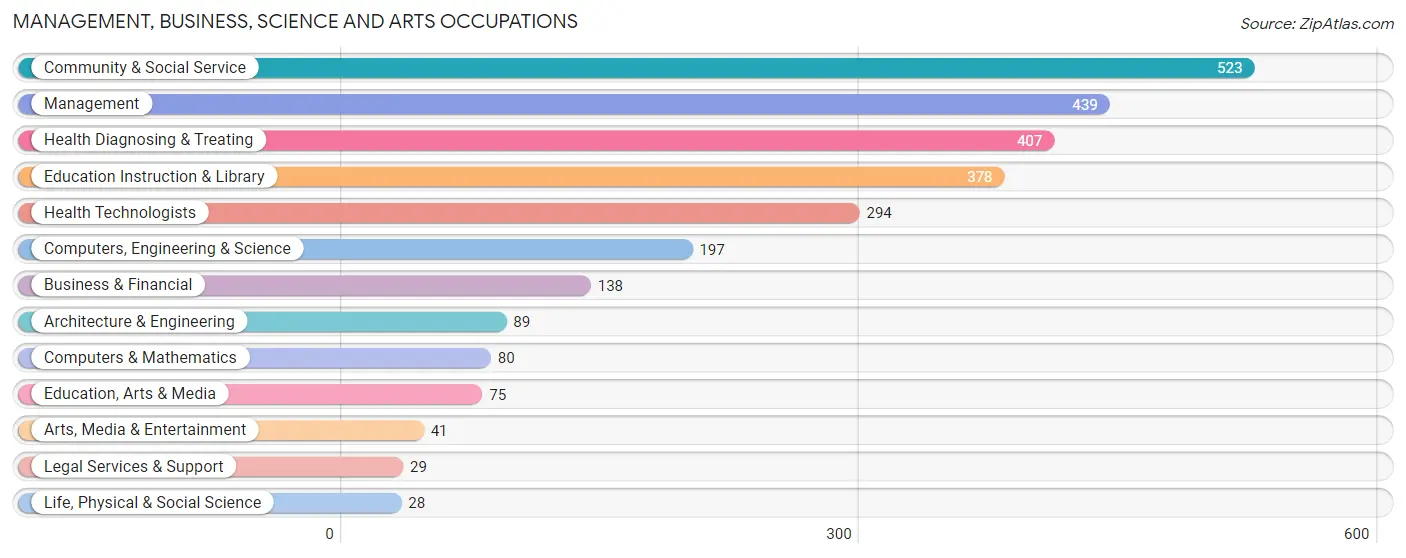
Management, Business, Science and Arts Occupations
The most common Management, Business, Science and Arts occupations in Ravenna are Community & Social Service (523 | 9.7%), Management (439 | 8.1%), Health Diagnosing & Treating (407 | 7.5%), Education Instruction & Library (378 | 7.0%), and Health Technologists (294 | 5.4%).
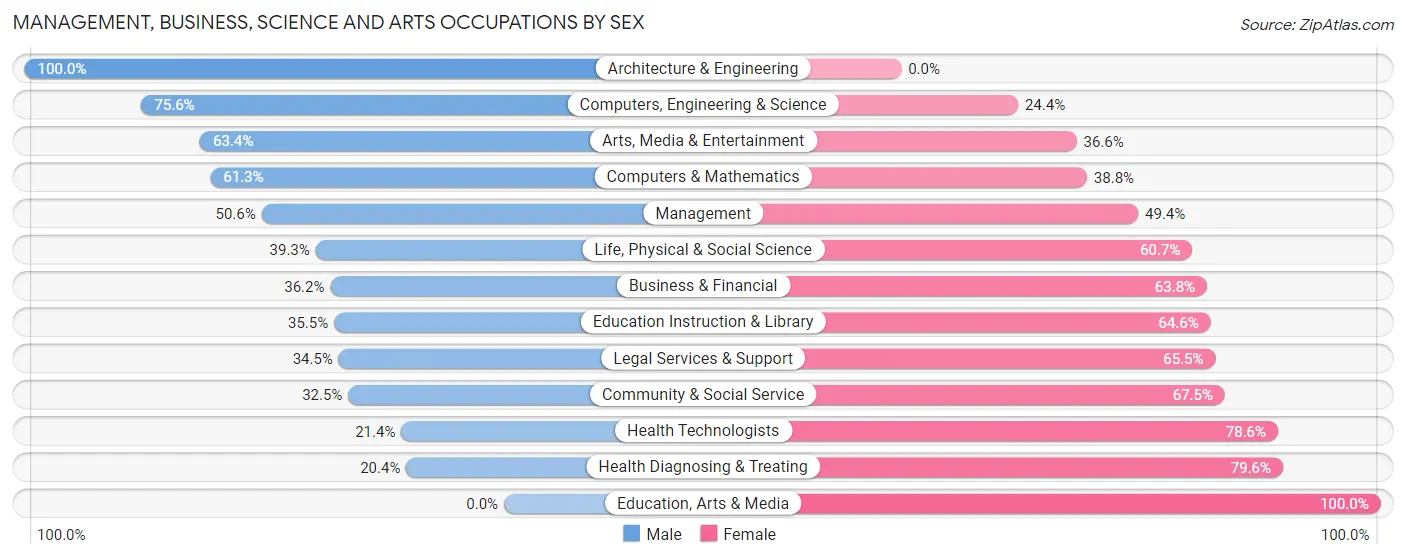
Management, Business, Science and Arts Occupations by Sex
Within the Management, Business, Science and Arts occupations in Ravenna, the most male-oriented occupations are Architecture & Engineering (100.0%), Computers, Engineering & Science (75.6%), and Arts, Media & Entertainment (63.4%), while the most female-oriented occupations are Education, Arts & Media (100.0%), Health Diagnosing & Treating (79.6%), and Health Technologists (78.6%).
| Occupation | Male | Female |
| Management | 222 (50.6%) | 217 (49.4%) |
| Business & Financial | 50 (36.2%) | 88 (63.8%) |
| Computers, Engineering & Science | 149 (75.6%) | 48 (24.4%) |
| Computers & Mathematics | 49 (61.3%) | 31 (38.8%) |
| Architecture & Engineering | 89 (100.0%) | 0 (0.0%) |
| Life, Physical & Social Science | 11 (39.3%) | 17 (60.7%) |
| Community & Social Service | 170 (32.5%) | 353 (67.5%) |
| Education, Arts & Media | 0 (0.0%) | 75 (100.0%) |
| Legal Services & Support | 10 (34.5%) | 19 (65.5%) |
| Education Instruction & Library | 134 (35.4%) | 244 (64.5%) |
| Arts, Media & Entertainment | 26 (63.4%) | 15 (36.6%) |
| Health Diagnosing & Treating | 83 (20.4%) | 324 (79.6%) |
| Health Technologists | 63 (21.4%) | 231 (78.6%) |
| Total (Category) | 674 (39.6%) | 1,030 (60.5%) |
| Total (Overall) | 2,826 (52.3%) | 2,580 (47.7%) |
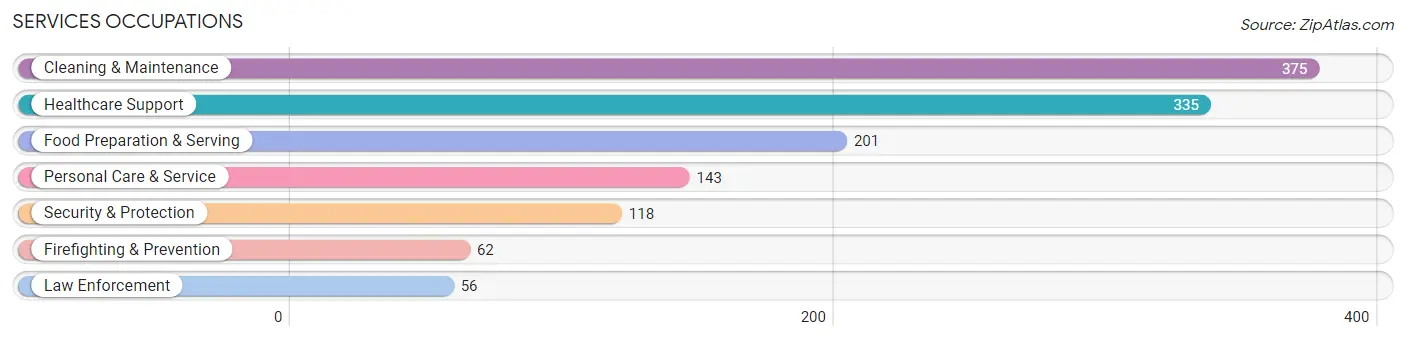
Services Occupations
The most common Services occupations in Ravenna are Cleaning & Maintenance (375 | 6.9%), Healthcare Support (335 | 6.2%), Food Preparation & Serving (201 | 3.7%), Personal Care & Service (143 | 2.6%), and Security & Protection (118 | 2.2%).
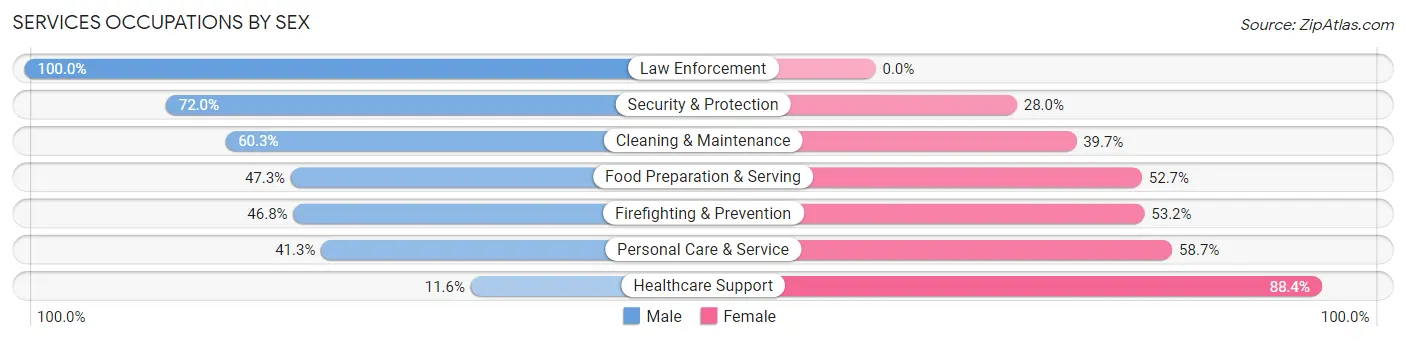
Services Occupations by Sex
Within the Services occupations in Ravenna, the most male-oriented occupations are Law Enforcement (100.0%), Security & Protection (72.0%), and Cleaning & Maintenance (60.3%), while the most female-oriented occupations are Healthcare Support (88.4%), Personal Care & Service (58.7%), and Firefighting & Prevention (53.2%).
| Occupation | Male | Female |
| Healthcare Support | 39 (11.6%) | 296 (88.4%) |
| Security & Protection | 85 (72.0%) | 33 (28.0%) |
| Firefighting & Prevention | 29 (46.8%) | 33 (53.2%) |
| Law Enforcement | 56 (100.0%) | 0 (0.0%) |
| Food Preparation & Serving | 95 (47.3%) | 106 (52.7%) |
| Cleaning & Maintenance | 226 (60.3%) | 149 (39.7%) |
| Personal Care & Service | 59 (41.3%) | 84 (58.7%) |
| Total (Category) | 504 (43.0%) | 668 (57.0%) |
| Total (Overall) | 2,826 (52.3%) | 2,580 (47.7%) |
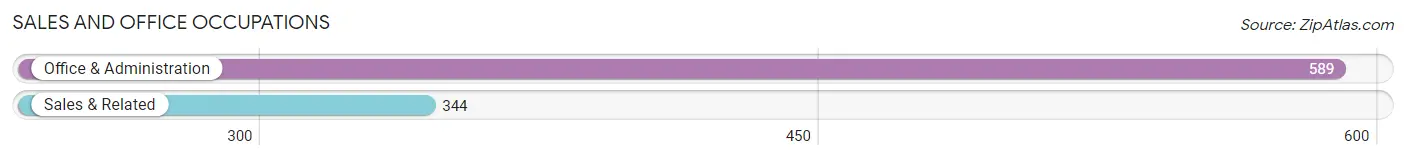
Sales and Office Occupations
The most common Sales and Office occupations in Ravenna are Office & Administration (589 | 10.9%), and Sales & Related (344 | 6.4%).
Sales and Office Occupations by Sex
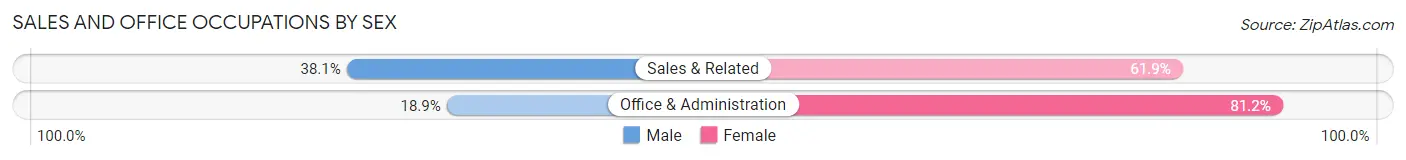
| Occupation | Male | Female |
| Sales & Related | 131 (38.1%) | 213 (61.9%) |
| Office & Administration | 111 (18.9%) | 478 (81.1%) |
| Total (Category) | 242 (25.9%) | 691 (74.1%) |
| Total (Overall) | 2,826 (52.3%) | 2,580 (47.7%) |
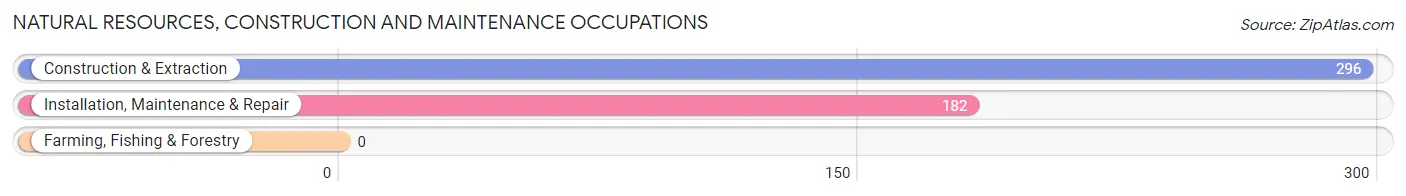
Natural Resources, Construction and Maintenance Occupations
The most common Natural Resources, Construction and Maintenance occupations in Ravenna are Construction & Extraction (296 | 5.5%), and Installation, Maintenance & Repair (182 | 3.4%).
Natural Resources, Construction and Maintenance Occupations by Sex
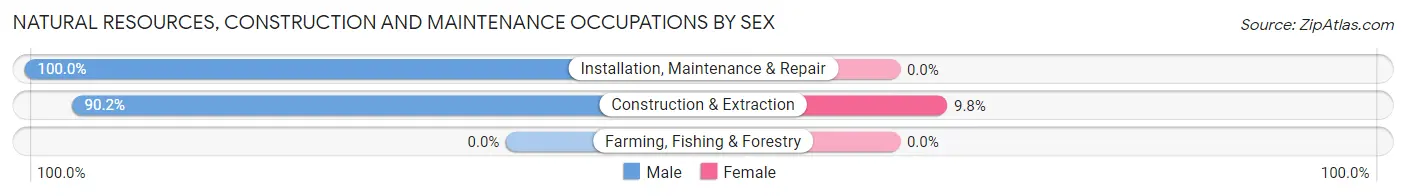
| Occupation | Male | Female |
| Farming, Fishing & Forestry | 0 (0.0%) | 0 (0.0%) |
| Construction & Extraction | 267 (90.2%) | 29 (9.8%) |
| Installation, Maintenance & Repair | 182 (100.0%) | 0 (0.0%) |
| Total (Category) | 449 (93.9%) | 29 (6.1%) |
| Total (Overall) | 2,826 (52.3%) | 2,580 (47.7%) |
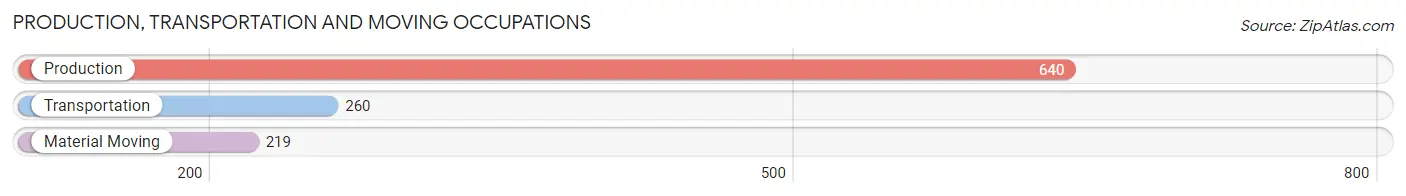
Production, Transportation and Moving Occupations
The most common Production, Transportation and Moving occupations in Ravenna are Production (640 | 11.8%), Transportation (260 | 4.8%), and Material Moving (219 | 4.1%).
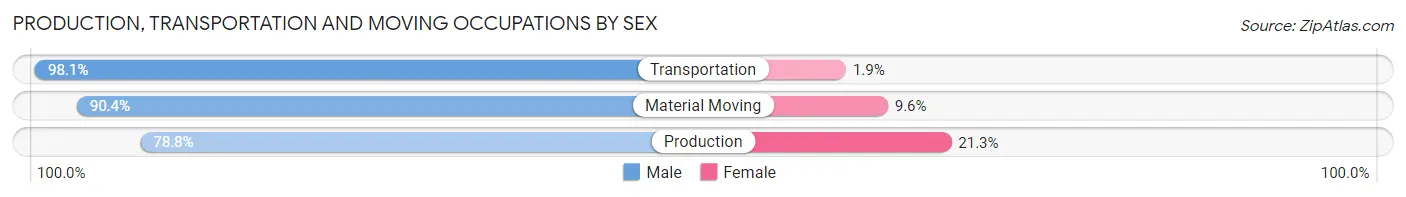
Production, Transportation and Moving Occupations by Sex
| Occupation | Male | Female |
| Production | 504 (78.7%) | 136 (21.2%) |
| Transportation | 255 (98.1%) | 5 (1.9%) |
| Material Moving | 198 (90.4%) | 21 (9.6%) |
| Total (Category) | 957 (85.5%) | 162 (14.5%) |
| Total (Overall) | 2,826 (52.3%) | 2,580 (47.7%) |
Employment Industries by Sex in Ravenna
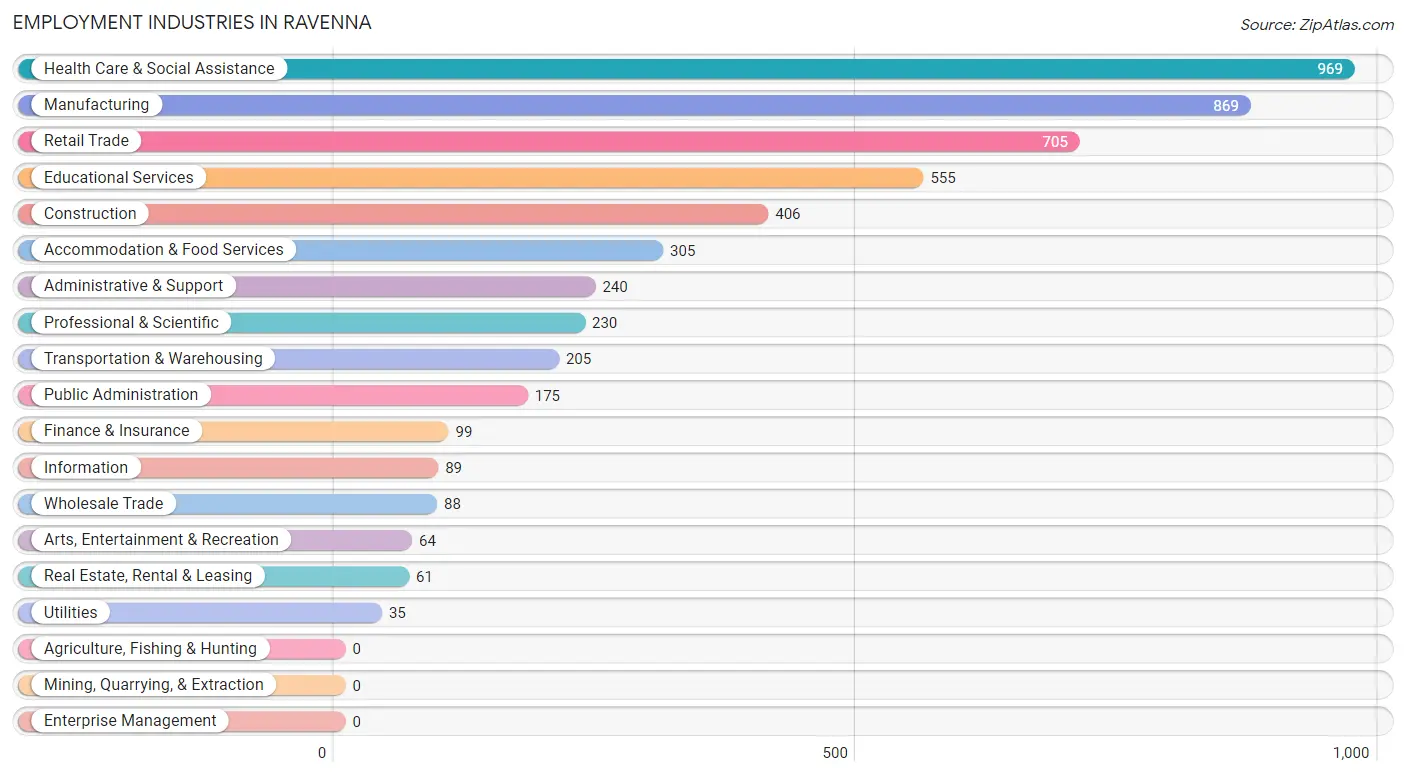
Employment Industries in Ravenna
The major employment industries in Ravenna include Health Care & Social Assistance (969 | 17.9%), Manufacturing (869 | 16.1%), Retail Trade (705 | 13.0%), Educational Services (555 | 10.3%), and Construction (406 | 7.5%).
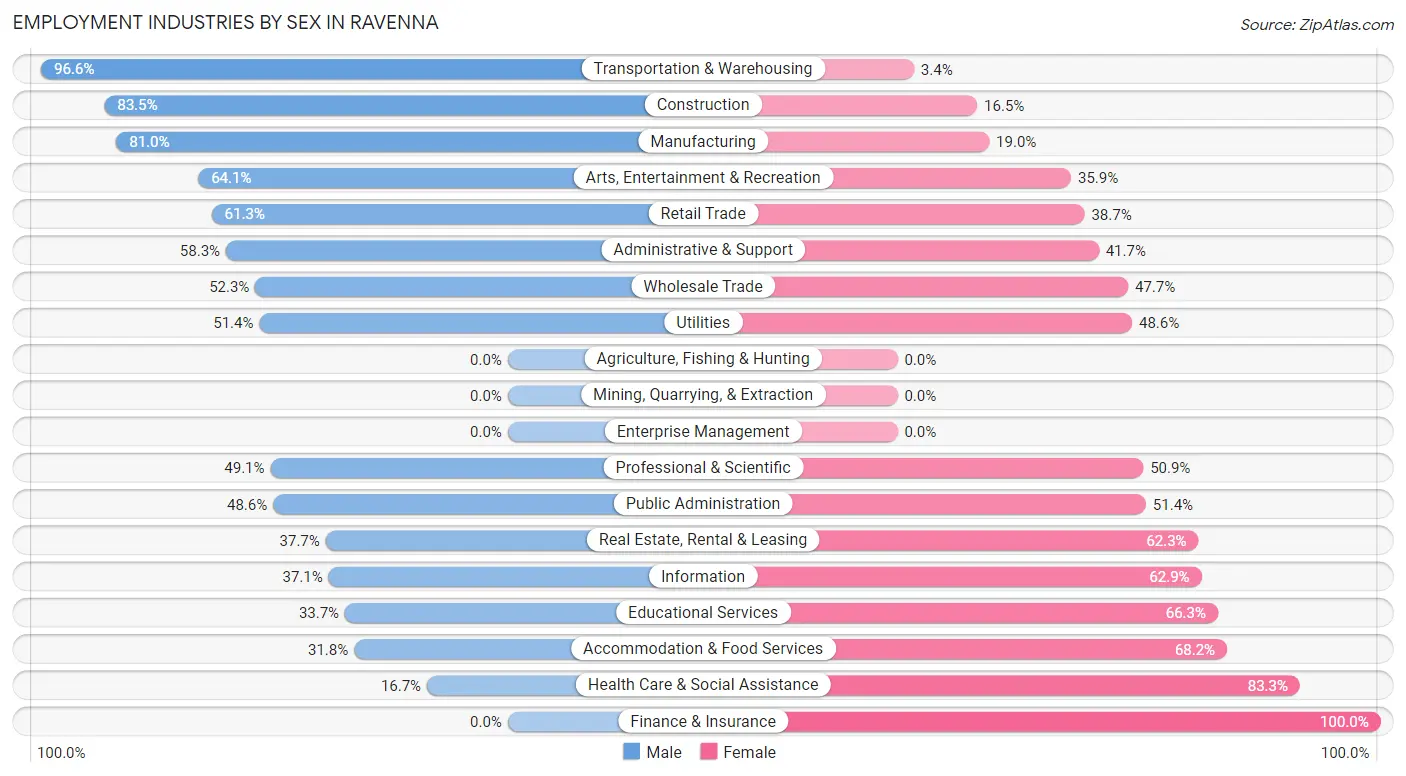
Employment Industries by Sex in Ravenna
The Ravenna industries that see more men than women are Transportation & Warehousing (96.6%), Construction (83.5%), and Manufacturing (81.0%), whereas the industries that tend to have a higher number of women are Finance & Insurance (100.0%), Health Care & Social Assistance (83.3%), and Accommodation & Food Services (68.2%).
| Industry | Male | Female |
| Agriculture, Fishing & Hunting | 0 (0.0%) | 0 (0.0%) |
| Mining, Quarrying, & Extraction | 0 (0.0%) | 0 (0.0%) |
| Construction | 339 (83.5%) | 67 (16.5%) |
| Manufacturing | 704 (81.0%) | 165 (19.0%) |
| Wholesale Trade | 46 (52.3%) | 42 (47.7%) |
| Retail Trade | 432 (61.3%) | 273 (38.7%) |
| Transportation & Warehousing | 198 (96.6%) | 7 (3.4%) |
| Utilities | 18 (51.4%) | 17 (48.6%) |
| Information | 33 (37.1%) | 56 (62.9%) |
| Finance & Insurance | 0 (0.0%) | 99 (100.0%) |
| Real Estate, Rental & Leasing | 23 (37.7%) | 38 (62.3%) |
| Professional & Scientific | 113 (49.1%) | 117 (50.9%) |
| Enterprise Management | 0 (0.0%) | 0 (0.0%) |
| Administrative & Support | 140 (58.3%) | 100 (41.7%) |
| Educational Services | 187 (33.7%) | 368 (66.3%) |
| Health Care & Social Assistance | 162 (16.7%) | 807 (83.3%) |
| Arts, Entertainment & Recreation | 41 (64.1%) | 23 (35.9%) |
| Accommodation & Food Services | 97 (31.8%) | 208 (68.2%) |
| Public Administration | 85 (48.6%) | 90 (51.4%) |
| Total | 2,826 (52.3%) | 2,580 (47.7%) |
Education in Ravenna
School Enrollment in Ravenna
The most common levels of schooling among the 2,426 students in Ravenna are elementary school (695 | 28.6%), college / undergraduate (519 | 21.4%), and middle school (447 | 18.4%).
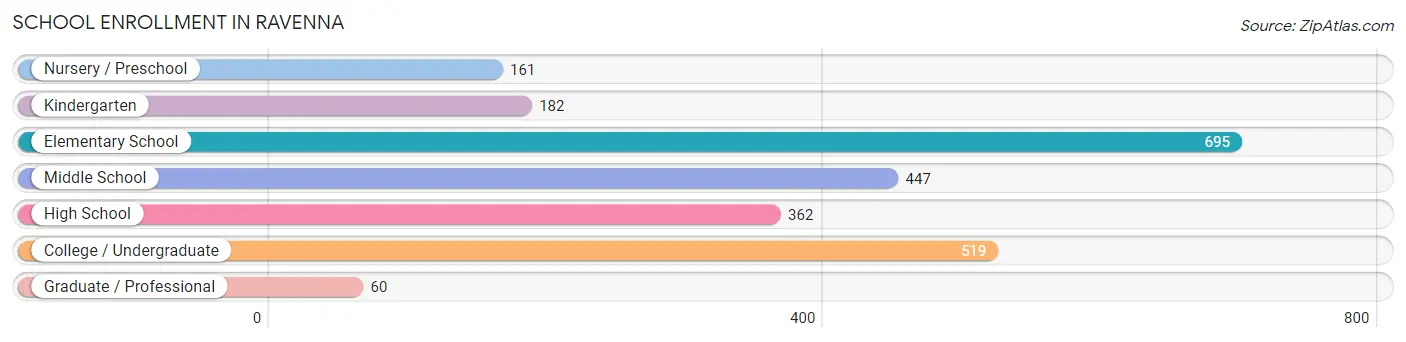
| School Level | # Students | % Students |
| Nursery / Preschool | 161 | 6.6% |
| Kindergarten | 182 | 7.5% |
| Elementary School | 695 | 28.6% |
| Middle School | 447 | 18.4% |
| High School | 362 | 14.9% |
| College / Undergraduate | 519 | 21.4% |
| Graduate / Professional | 60 | 2.5% |
| Total | 2,426 | 100.0% |
School Enrollment by Age by Funding Source in Ravenna
Out of a total of 2,426 students who are enrolled in schools in Ravenna, 182 (7.5%) attend a private institution, while the remaining 2,244 (92.5%) are enrolled in public schools. The age group of 35 years and over has the highest likelihood of being enrolled in private schools, with 23 (28.4% in the age bracket) enrolled. Conversely, the age group of 3 to 4 year olds has the lowest likelihood of being enrolled in a private school, with 131 (100.0% in the age bracket) attending a public institution.
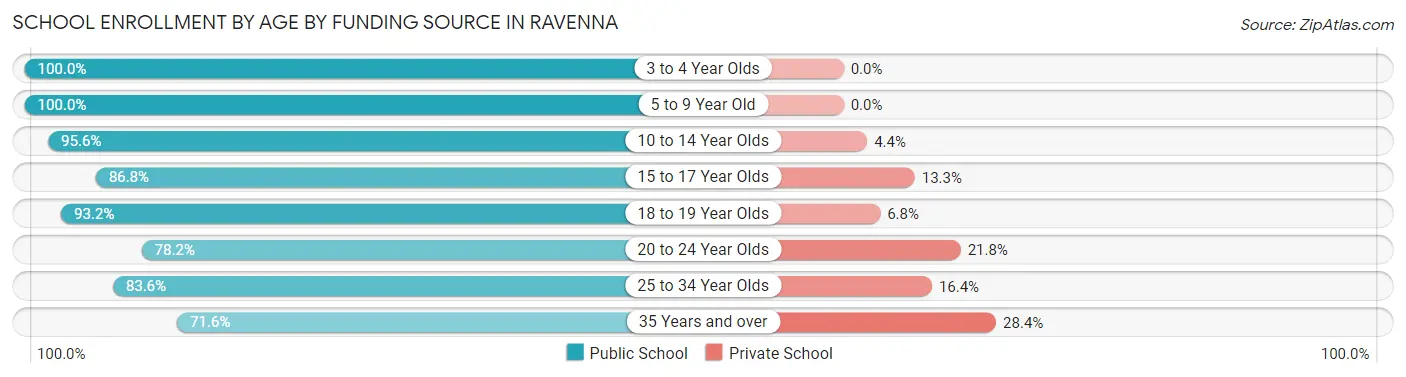
| Age Bracket | Public School | Private School |
| 3 to 4 Year Olds | 131 (100.0%) | 0 (0.0%) |
| 5 to 9 Year Old | 809 (100.0%) | 0 (0.0%) |
| 10 to 14 Year Olds | 544 (95.6%) | 25 (4.4%) |
| 15 to 17 Year Olds | 216 (86.8%) | 33 (13.3%) |
| 18 to 19 Year Olds | 137 (93.2%) | 10 (6.8%) |
| 20 to 24 Year Olds | 287 (78.2%) | 80 (21.8%) |
| 25 to 34 Year Olds | 61 (83.6%) | 12 (16.4%) |
| 35 Years and over | 58 (71.6%) | 23 (28.4%) |
| Total | 2,244 (92.5%) | 182 (7.5%) |
Educational Attainment by Field of Study in Ravenna
Visual & performing arts (313 | 18.3%), education (275 | 16.1%), business (268 | 15.7%), science & technology (180 | 10.5%), and bio, nature & agricultural (107 | 6.3%) are the most common fields of study among 1,707 individuals in Ravenna who have obtained a bachelor's degree or higher.
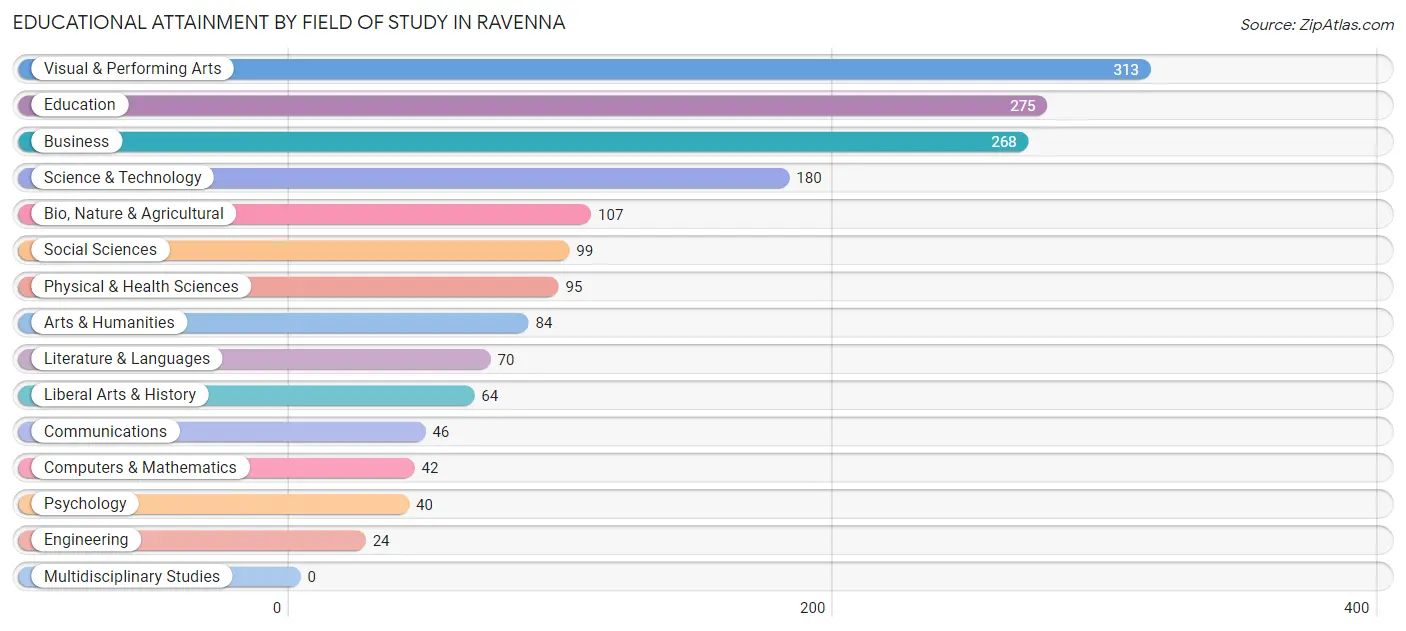
| Field of Study | # Graduates | % Graduates |
| Computers & Mathematics | 42 | 2.5% |
| Bio, Nature & Agricultural | 107 | 6.3% |
| Physical & Health Sciences | 95 | 5.6% |
| Psychology | 40 | 2.3% |
| Social Sciences | 99 | 5.8% |
| Engineering | 24 | 1.4% |
| Multidisciplinary Studies | 0 | 0.0% |
| Science & Technology | 180 | 10.5% |
| Business | 268 | 15.7% |
| Education | 275 | 16.1% |
| Literature & Languages | 70 | 4.1% |
| Liberal Arts & History | 64 | 3.7% |
| Visual & Performing Arts | 313 | 18.3% |
| Communications | 46 | 2.7% |
| Arts & Humanities | 84 | 4.9% |
| Total | 1,707 | 100.0% |
Transportation & Commute in Ravenna
Vehicle Availability by Sex in Ravenna
The most prevalent vehicle ownership categories in Ravenna are males with 2 vehicles (1,200, accounting for 44.1%) and females with 2 vehicles (937, making up 47.3%).
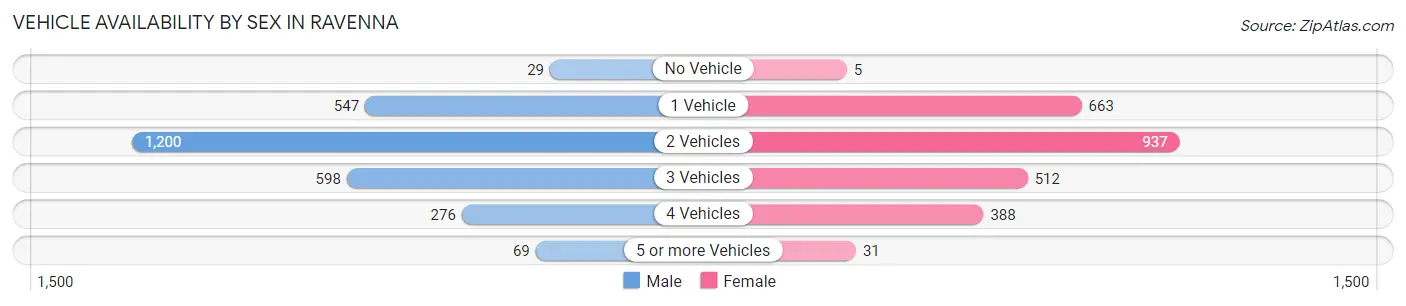
| Vehicles Available | Male | Female |
| No Vehicle | 29 (1.1%) | 5 (0.2%) |
| 1 Vehicle | 547 (20.1%) | 663 (26.1%) |
| 2 Vehicles | 1,200 (44.1%) | 937 (36.9%) |
| 3 Vehicles | 598 (22.0%) | 512 (20.2%) |
| 4 Vehicles | 276 (10.2%) | 388 (15.3%) |
| 5 or more Vehicles | 69 (2.5%) | 31 (1.2%) |
| Total | 2,719 (100.0%) | 2,536 (100.0%) |
Commute Time in Ravenna
The most frequently occuring commute durations in Ravenna are 5 to 9 minutes (806 commuters, 16.3%), 15 to 19 minutes (769 commuters, 15.5%), and 20 to 24 minutes (593 commuters, 12.0%).
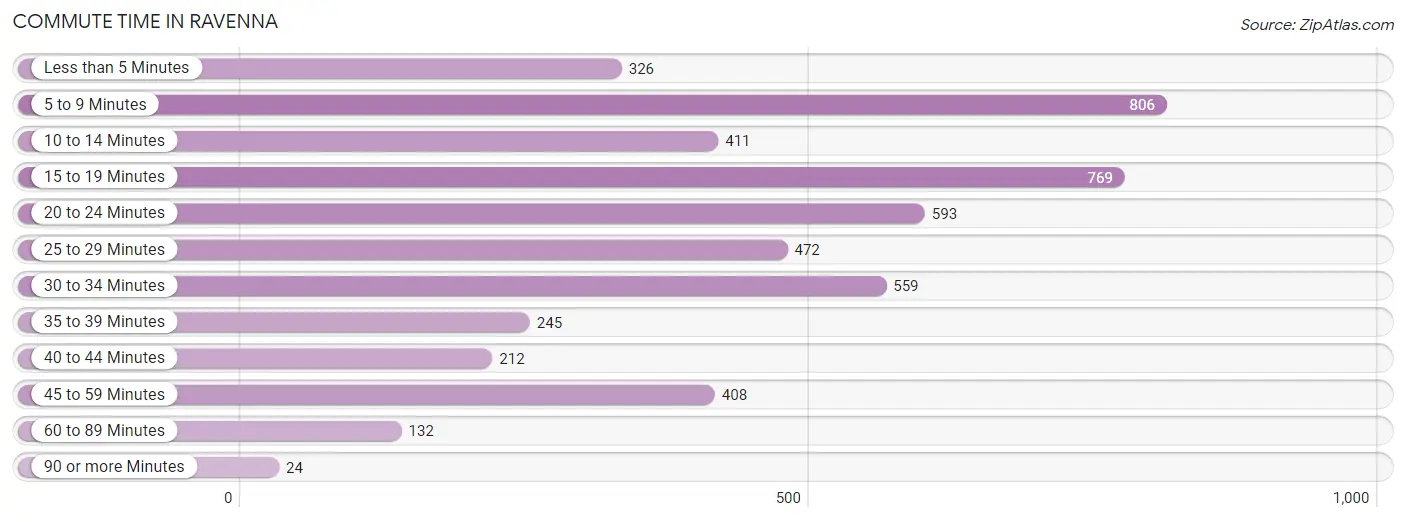
| Commute Time | # Commuters | % Commuters |
| Less than 5 Minutes | 326 | 6.6% |
| 5 to 9 Minutes | 806 | 16.3% |
| 10 to 14 Minutes | 411 | 8.3% |
| 15 to 19 Minutes | 769 | 15.5% |
| 20 to 24 Minutes | 593 | 12.0% |
| 25 to 29 Minutes | 472 | 9.5% |
| 30 to 34 Minutes | 559 | 11.3% |
| 35 to 39 Minutes | 245 | 4.9% |
| 40 to 44 Minutes | 212 | 4.3% |
| 45 to 59 Minutes | 408 | 8.2% |
| 60 to 89 Minutes | 132 | 2.7% |
| 90 or more Minutes | 24 | 0.5% |
Commute Time by Sex in Ravenna
The most common commute times in Ravenna are 15 to 19 minutes (353 commuters, 13.9%) for males and 5 to 9 minutes (472 commuters, 19.6%) for females.
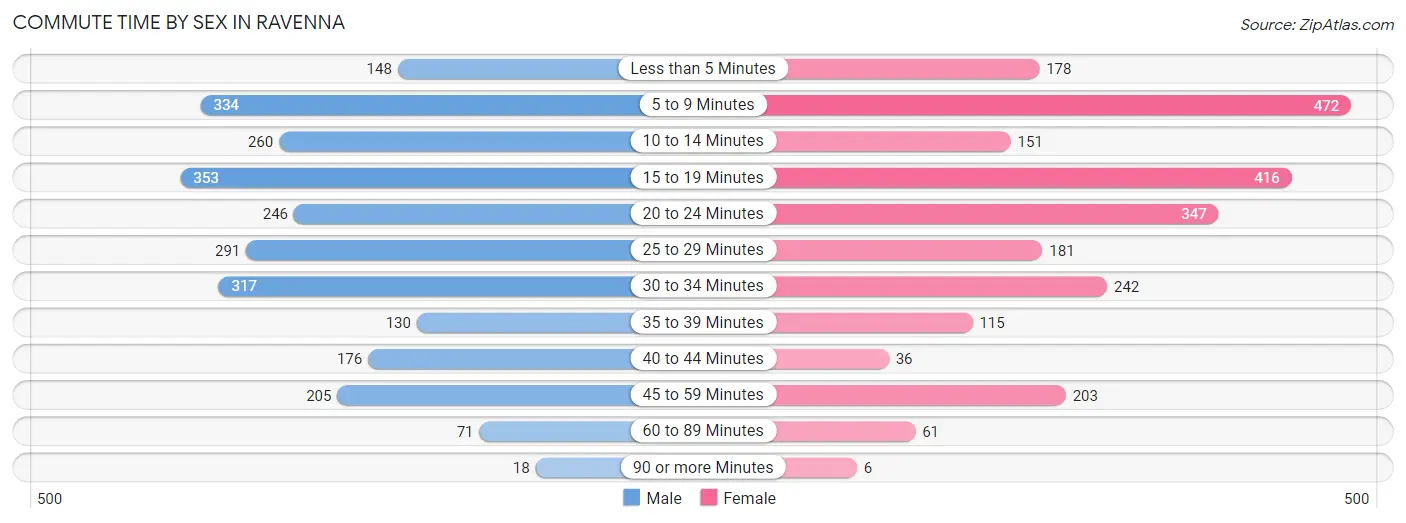
| Commute Time | Male | Female |
| Less than 5 Minutes | 148 (5.8%) | 178 (7.4%) |
| 5 to 9 Minutes | 334 (13.1%) | 472 (19.6%) |
| 10 to 14 Minutes | 260 (10.2%) | 151 (6.3%) |
| 15 to 19 Minutes | 353 (13.9%) | 416 (17.3%) |
| 20 to 24 Minutes | 246 (9.7%) | 347 (14.4%) |
| 25 to 29 Minutes | 291 (11.4%) | 181 (7.5%) |
| 30 to 34 Minutes | 317 (12.4%) | 242 (10.1%) |
| 35 to 39 Minutes | 130 (5.1%) | 115 (4.8%) |
| 40 to 44 Minutes | 176 (6.9%) | 36 (1.5%) |
| 45 to 59 Minutes | 205 (8.0%) | 203 (8.4%) |
| 60 to 89 Minutes | 71 (2.8%) | 61 (2.5%) |
| 90 or more Minutes | 18 (0.7%) | 6 (0.3%) |
Time of Departure to Work by Sex in Ravenna
The most frequent times of departure to work in Ravenna are 7:00 AM to 7:29 AM (297, 11.7%) for males and 6:30 AM to 6:59 AM (353, 14.7%) for females.
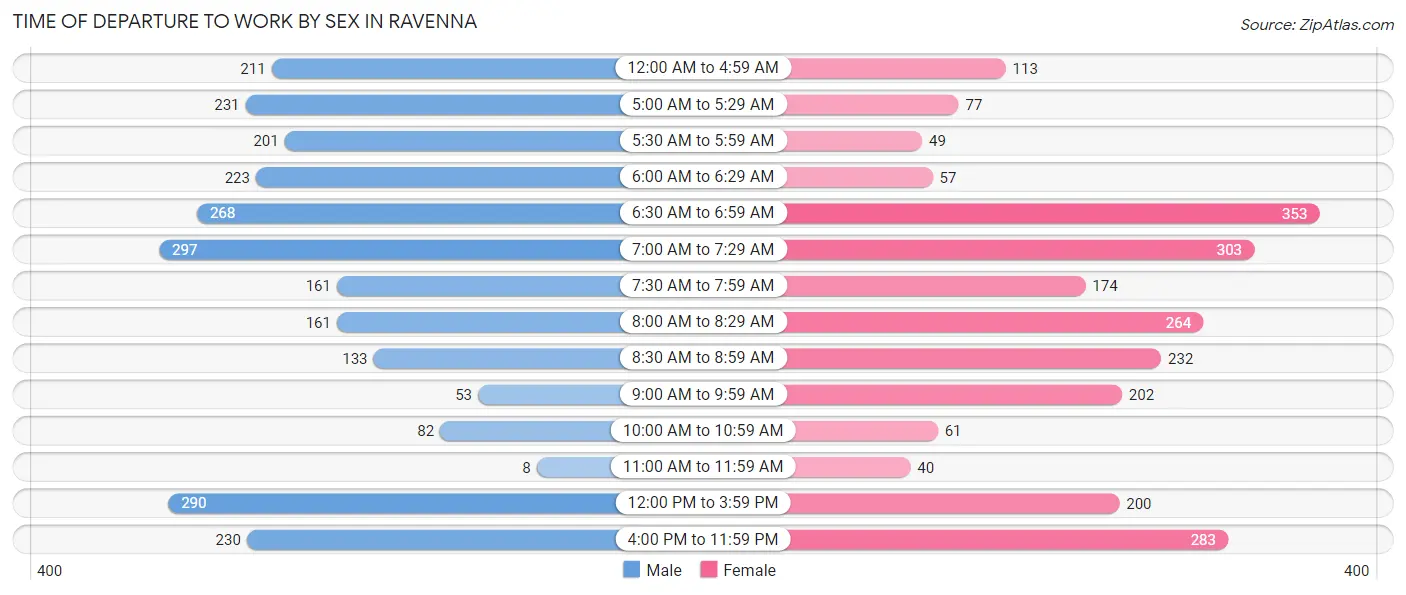
| Time of Departure | Male | Female |
| 12:00 AM to 4:59 AM | 211 (8.3%) | 113 (4.7%) |
| 5:00 AM to 5:29 AM | 231 (9.1%) | 77 (3.2%) |
| 5:30 AM to 5:59 AM | 201 (7.9%) | 49 (2.0%) |
| 6:00 AM to 6:29 AM | 223 (8.7%) | 57 (2.4%) |
| 6:30 AM to 6:59 AM | 268 (10.5%) | 353 (14.7%) |
| 7:00 AM to 7:29 AM | 297 (11.7%) | 303 (12.6%) |
| 7:30 AM to 7:59 AM | 161 (6.3%) | 174 (7.2%) |
| 8:00 AM to 8:29 AM | 161 (6.3%) | 264 (11.0%) |
| 8:30 AM to 8:59 AM | 133 (5.2%) | 232 (9.6%) |
| 9:00 AM to 9:59 AM | 53 (2.1%) | 202 (8.4%) |
| 10:00 AM to 10:59 AM | 82 (3.2%) | 61 (2.5%) |
| 11:00 AM to 11:59 AM | 8 (0.3%) | 40 (1.7%) |
| 12:00 PM to 3:59 PM | 290 (11.4%) | 200 (8.3%) |
| 4:00 PM to 11:59 PM | 230 (9.0%) | 283 (11.7%) |
| Total | 2,549 (100.0%) | 2,408 (100.0%) |
Housing Occupancy in Ravenna
Occupancy by Ownership in Ravenna
Of the total 5,020 dwellings in Ravenna, owner-occupied units account for 2,525 (50.3%), while renter-occupied units make up 2,495 (49.7%).
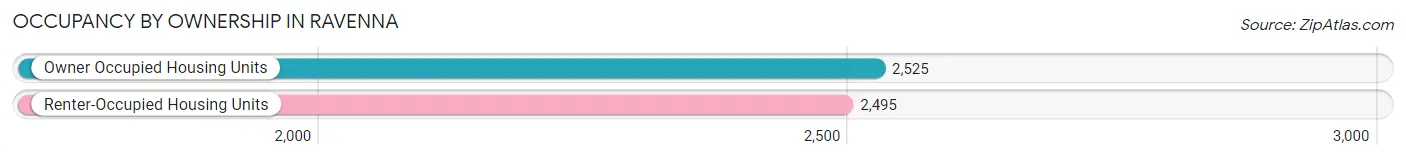
| Occupancy | # Housing Units | % Housing Units |
| Owner Occupied Housing Units | 2,525 | 50.3% |
| Renter-Occupied Housing Units | 2,495 | 49.7% |
| Total Occupied Housing Units | 5,020 | 100.0% |
Occupancy by Household Size in Ravenna
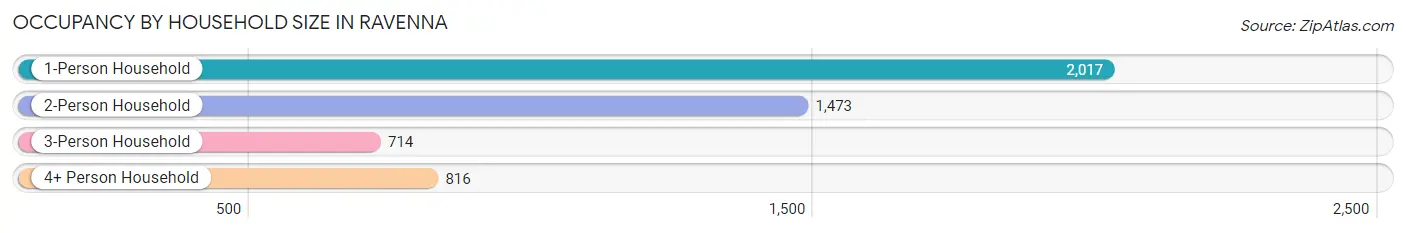
| Household Size | # Housing Units | % Housing Units |
| 1-Person Household | 2,017 | 40.2% |
| 2-Person Household | 1,473 | 29.3% |
| 3-Person Household | 714 | 14.2% |
| 4+ Person Household | 816 | 16.3% |
| Total Housing Units | 5,020 | 100.0% |
Occupancy by Ownership by Household Size in Ravenna
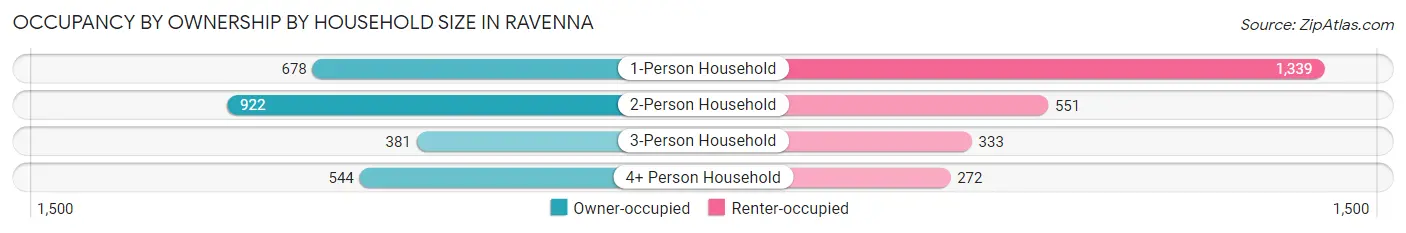
| Household Size | Owner-occupied | Renter-occupied |
| 1-Person Household | 678 (33.6%) | 1,339 (66.4%) |
| 2-Person Household | 922 (62.6%) | 551 (37.4%) |
| 3-Person Household | 381 (53.4%) | 333 (46.6%) |
| 4+ Person Household | 544 (66.7%) | 272 (33.3%) |
| Total Housing Units | 2,525 (50.3%) | 2,495 (49.7%) |
Occupancy by Educational Attainment in Ravenna
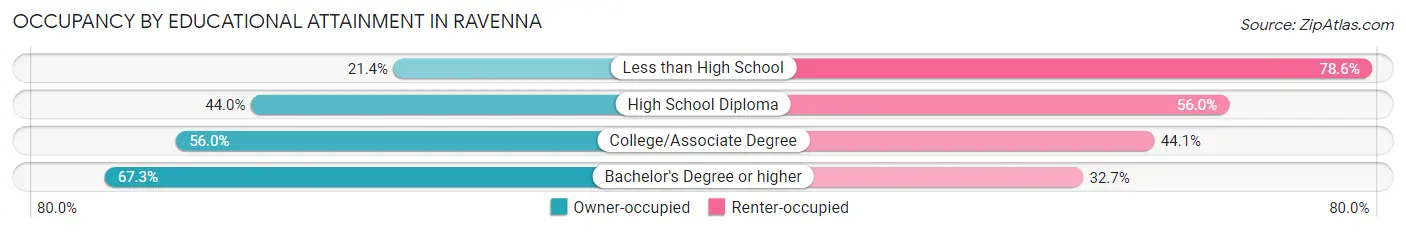
| Household Size | Owner-occupied | Renter-occupied |
| Less than High School | 120 (21.4%) | 440 (78.6%) |
| High School Diploma | 816 (44.0%) | 1,037 (56.0%) |
| College/Associate Degree | 814 (55.9%) | 641 (44.1%) |
| Bachelor's Degree or higher | 775 (67.3%) | 377 (32.7%) |
Occupancy by Age of Householder in Ravenna
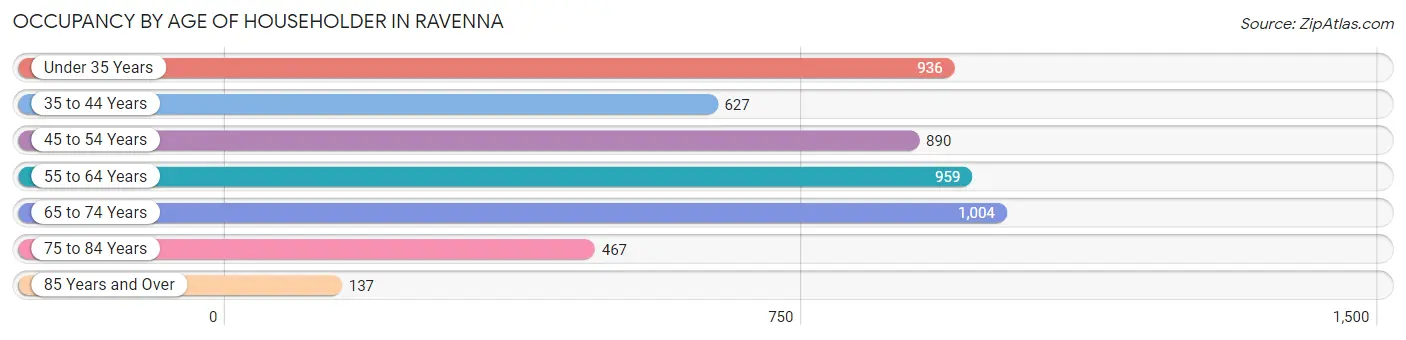
| Age Bracket | # Households | % Households |
| Under 35 Years | 936 | 18.6% |
| 35 to 44 Years | 627 | 12.5% |
| 45 to 54 Years | 890 | 17.7% |
| 55 to 64 Years | 959 | 19.1% |
| 65 to 74 Years | 1,004 | 20.0% |
| 75 to 84 Years | 467 | 9.3% |
| 85 Years and Over | 137 | 2.7% |
| Total | 5,020 | 100.0% |
Housing Finances in Ravenna
Median Income by Occupancy in Ravenna
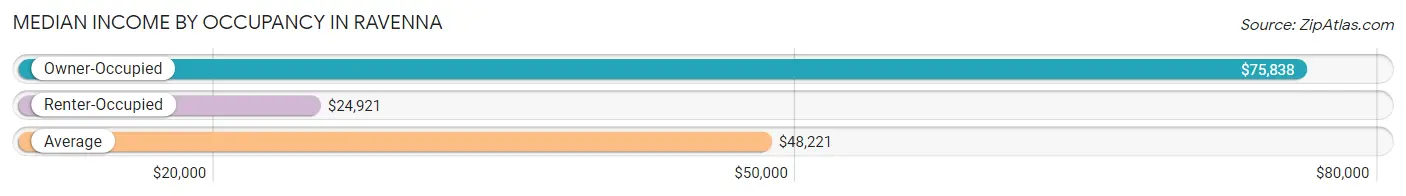
| Occupancy Type | # Households | Median Income |
| Owner-Occupied | 2,525 (50.3%) | $75,838 |
| Renter-Occupied | 2,495 (49.7%) | $24,921 |
| Average | 5,020 (100.0%) | $48,221 |
Occupancy by Householder Income Bracket in Ravenna
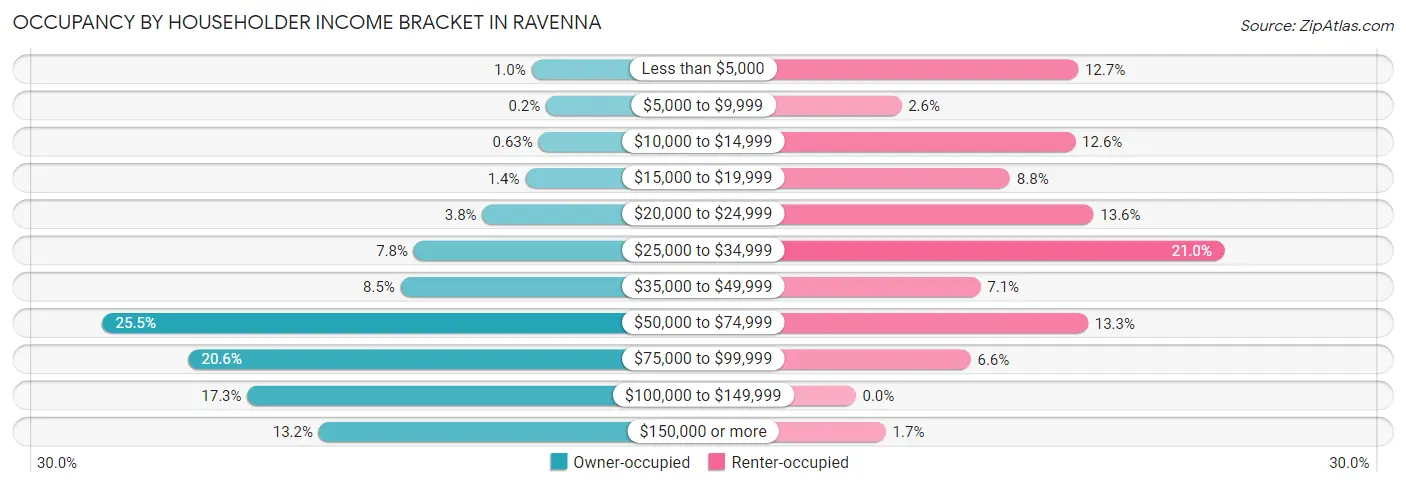
| Income Bracket | Owner-occupied | Renter-occupied |
| Less than $5,000 | 26 (1.0%) | 317 (12.7%) |
| $5,000 to $9,999 | 5 (0.2%) | 65 (2.6%) |
| $10,000 to $14,999 | 16 (0.6%) | 313 (12.6%) |
| $15,000 to $19,999 | 35 (1.4%) | 220 (8.8%) |
| $20,000 to $24,999 | 97 (3.8%) | 339 (13.6%) |
| $25,000 to $34,999 | 196 (7.8%) | 525 (21.0%) |
| $35,000 to $49,999 | 215 (8.5%) | 178 (7.1%) |
| $50,000 to $74,999 | 645 (25.5%) | 331 (13.3%) |
| $75,000 to $99,999 | 521 (20.6%) | 164 (6.6%) |
| $100,000 to $149,999 | 436 (17.3%) | 0 (0.0%) |
| $150,000 or more | 333 (13.2%) | 43 (1.7%) |
| Total | 2,525 (100.0%) | 2,495 (100.0%) |
Monthly Housing Cost Tiers in Ravenna
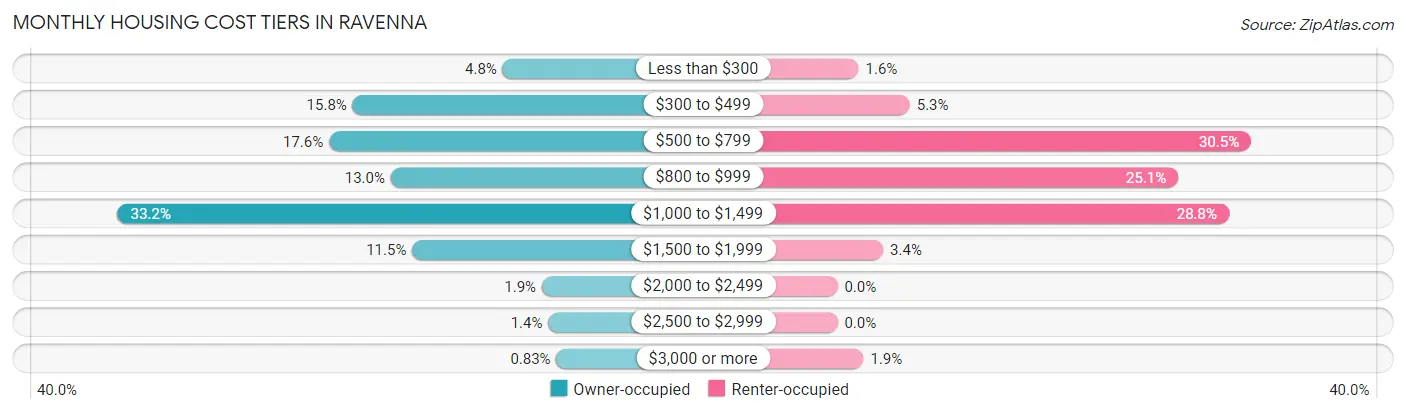
| Monthly Cost | Owner-occupied | Renter-occupied |
| Less than $300 | 121 (4.8%) | 39 (1.6%) |
| $300 to $499 | 400 (15.8%) | 133 (5.3%) |
| $500 to $799 | 444 (17.6%) | 760 (30.5%) |
| $800 to $999 | 329 (13.0%) | 626 (25.1%) |
| $1,000 to $1,499 | 837 (33.2%) | 719 (28.8%) |
| $1,500 to $1,999 | 289 (11.5%) | 84 (3.4%) |
| $2,000 to $2,499 | 48 (1.9%) | 0 (0.0%) |
| $2,500 to $2,999 | 36 (1.4%) | 0 (0.0%) |
| $3,000 or more | 21 (0.8%) | 48 (1.9%) |
| Total | 2,525 (100.0%) | 2,495 (100.0%) |
Physical Housing Characteristics in Ravenna
Housing Structures in Ravenna
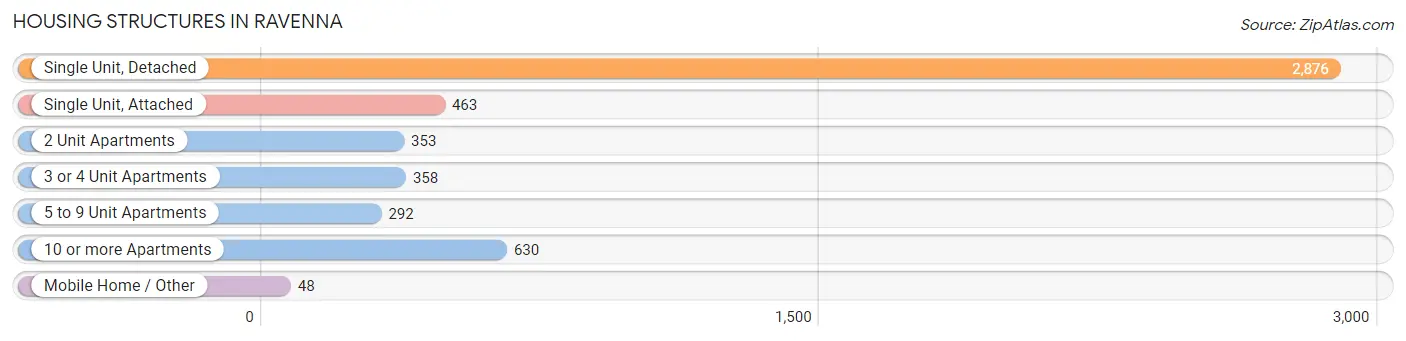
| Structure Type | # Housing Units | % Housing Units |
| Single Unit, Detached | 2,876 | 57.3% |
| Single Unit, Attached | 463 | 9.2% |
| 2 Unit Apartments | 353 | 7.0% |
| 3 or 4 Unit Apartments | 358 | 7.1% |
| 5 to 9 Unit Apartments | 292 | 5.8% |
| 10 or more Apartments | 630 | 12.6% |
| Mobile Home / Other | 48 | 1.0% |
| Total | 5,020 | 100.0% |
Housing Structures by Occupancy in Ravenna
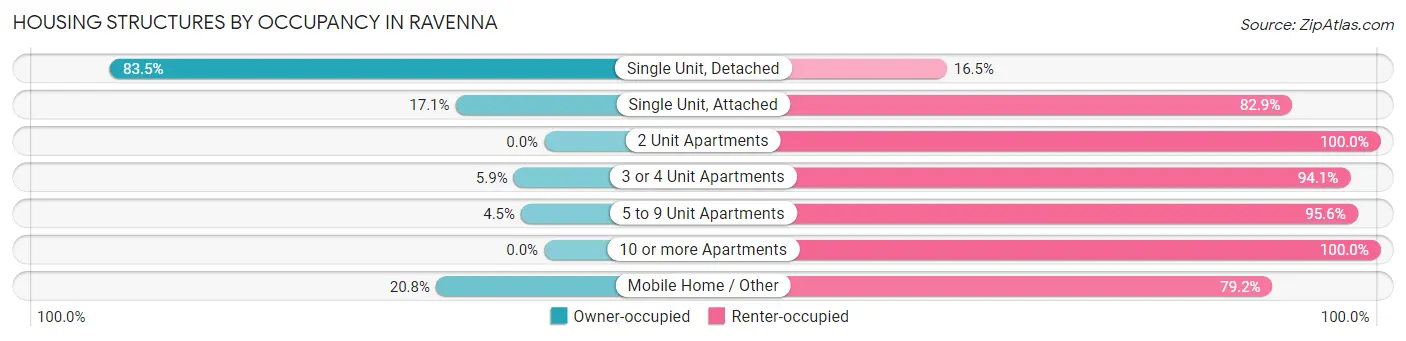
| Structure Type | Owner-occupied | Renter-occupied |
| Single Unit, Detached | 2,402 (83.5%) | 474 (16.5%) |
| Single Unit, Attached | 79 (17.1%) | 384 (82.9%) |
| 2 Unit Apartments | 0 (0.0%) | 353 (100.0%) |
| 3 or 4 Unit Apartments | 21 (5.9%) | 337 (94.1%) |
| 5 to 9 Unit Apartments | 13 (4.4%) | 279 (95.6%) |
| 10 or more Apartments | 0 (0.0%) | 630 (100.0%) |
| Mobile Home / Other | 10 (20.8%) | 38 (79.2%) |
| Total | 2,525 (50.3%) | 2,495 (49.7%) |
Housing Structures by Number of Rooms in Ravenna
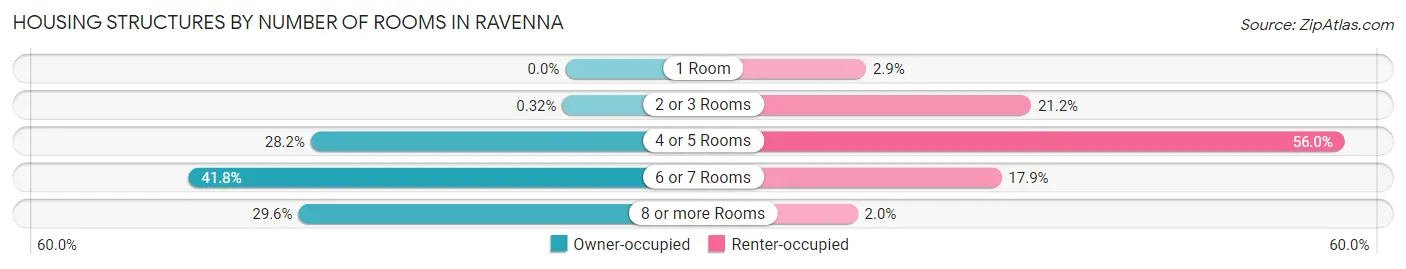
| Number of Rooms | Owner-occupied | Renter-occupied |
| 1 Room | 0 (0.0%) | 72 (2.9%) |
| 2 or 3 Rooms | 8 (0.3%) | 529 (21.2%) |
| 4 or 5 Rooms | 713 (28.2%) | 1,398 (56.0%) |
| 6 or 7 Rooms | 1,056 (41.8%) | 447 (17.9%) |
| 8 or more Rooms | 748 (29.6%) | 49 (2.0%) |
| Total | 2,525 (100.0%) | 2,495 (100.0%) |
Housing Structure by Heating Type in Ravenna
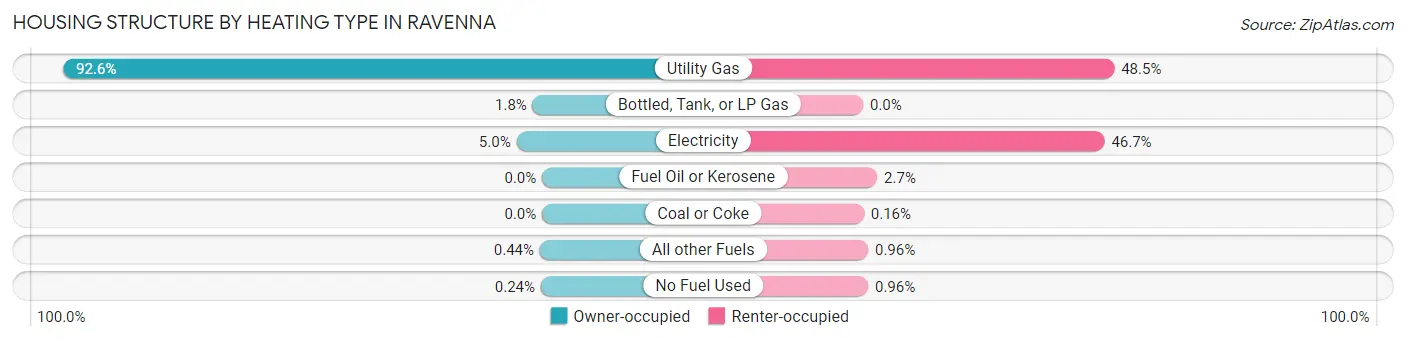
| Heating Type | Owner-occupied | Renter-occupied |
| Utility Gas | 2,337 (92.5%) | 1,211 (48.5%) |
| Bottled, Tank, or LP Gas | 46 (1.8%) | 0 (0.0%) |
| Electricity | 125 (5.0%) | 1,164 (46.7%) |
| Fuel Oil or Kerosene | 0 (0.0%) | 68 (2.7%) |
| Coal or Coke | 0 (0.0%) | 4 (0.2%) |
| All other Fuels | 11 (0.4%) | 24 (1.0%) |
| No Fuel Used | 6 (0.2%) | 24 (1.0%) |
| Total | 2,525 (100.0%) | 2,495 (100.0%) |
Household Vehicle Usage in Ravenna
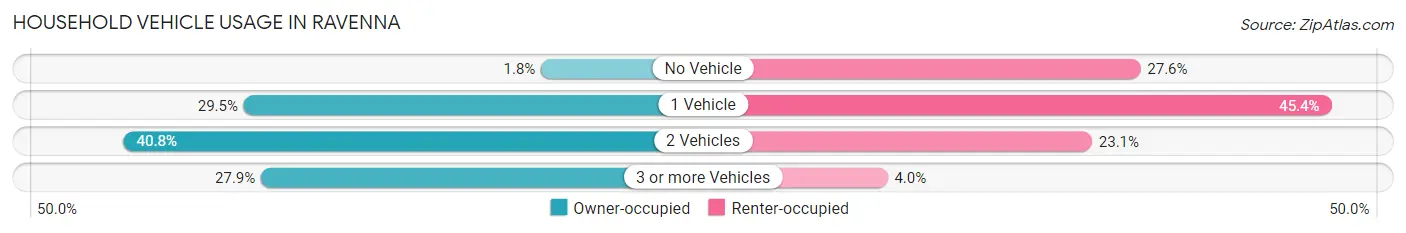
| Vehicles per Household | Owner-occupied | Renter-occupied |
| No Vehicle | 45 (1.8%) | 688 (27.6%) |
| 1 Vehicle | 746 (29.5%) | 1,133 (45.4%) |
| 2 Vehicles | 1,029 (40.7%) | 575 (23.1%) |
| 3 or more Vehicles | 705 (27.9%) | 99 (4.0%) |
| Total | 2,525 (100.0%) | 2,495 (100.0%) |
Real Estate & Mortgages in Ravenna
Real Estate and Mortgage Overview in Ravenna
| Characteristic | Without Mortgage | With Mortgage |
| Housing Units | 742 | 1,783 |
| Median Property Value | $118,100 | $125,800 |
| Median Household Income | $58,942 | $271 |
| Monthly Housing Costs | $446 | $21 |
| Real Estate Taxes | $1,761 | $32 |
Property Value by Mortgage Status in Ravenna
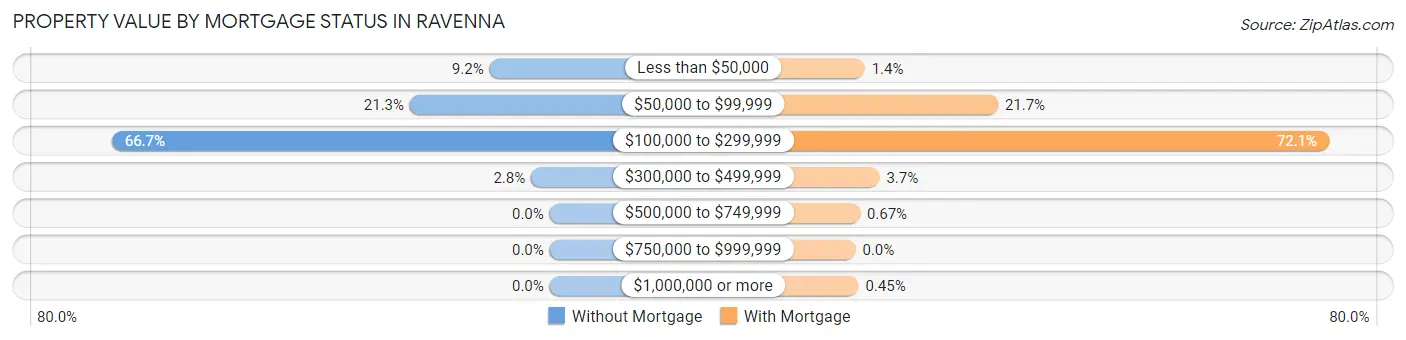
| Property Value | Without Mortgage | With Mortgage |
| Less than $50,000 | 68 (9.2%) | 25 (1.4%) |
| $50,000 to $99,999 | 158 (21.3%) | 387 (21.7%) |
| $100,000 to $299,999 | 495 (66.7%) | 1,286 (72.1%) |
| $300,000 to $499,999 | 21 (2.8%) | 65 (3.6%) |
| $500,000 to $749,999 | 0 (0.0%) | 12 (0.7%) |
| $750,000 to $999,999 | 0 (0.0%) | 0 (0.0%) |
| $1,000,000 or more | 0 (0.0%) | 8 (0.4%) |
| Total | 742 (100.0%) | 1,783 (100.0%) |
Household Income by Mortgage Status in Ravenna
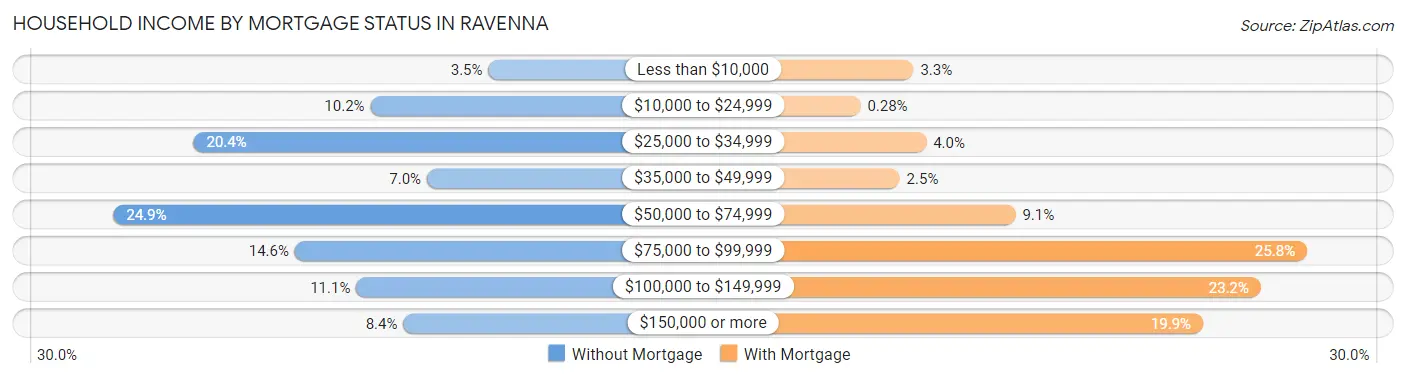
| Household Income | Without Mortgage | With Mortgage |
| Less than $10,000 | 26 (3.5%) | 59 (3.3%) |
| $10,000 to $24,999 | 76 (10.2%) | 5 (0.3%) |
| $25,000 to $34,999 | 151 (20.3%) | 72 (4.0%) |
| $35,000 to $49,999 | 52 (7.0%) | 45 (2.5%) |
| $50,000 to $74,999 | 185 (24.9%) | 163 (9.1%) |
| $75,000 to $99,999 | 108 (14.6%) | 460 (25.8%) |
| $100,000 to $149,999 | 82 (11.1%) | 413 (23.2%) |
| $150,000 or more | 62 (8.4%) | 354 (19.9%) |
| Total | 742 (100.0%) | 1,783 (100.0%) |
Property Value to Household Income Ratio in Ravenna
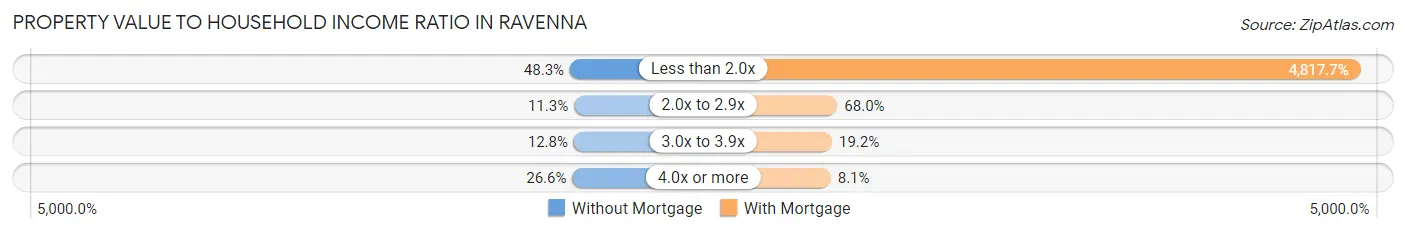
| Value-to-Income Ratio | Without Mortgage | With Mortgage |
| Less than 2.0x | 358 (48.2%) | 85,900 (4,817.7%) |
| 2.0x to 2.9x | 84 (11.3%) | 1,213 (68.0%) |
| 3.0x to 3.9x | 95 (12.8%) | 343 (19.2%) |
| 4.0x or more | 197 (26.6%) | 144 (8.1%) |
| Total | 742 (100.0%) | 1,783 (100.0%) |
Real Estate Taxes by Mortgage Status in Ravenna
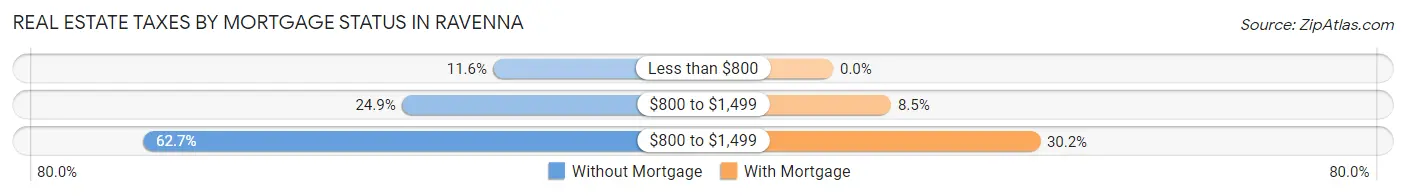
| Property Taxes | Without Mortgage | With Mortgage |
| Less than $800 | 86 (11.6%) | 0 (0.0%) |
| $800 to $1,499 | 185 (24.9%) | 151 (8.5%) |
| $800 to $1,499 | 465 (62.7%) | 539 (30.2%) |
| Total | 742 (100.0%) | 1,783 (100.0%) |
Health & Disability in Ravenna
Health Insurance Coverage by Age in Ravenna
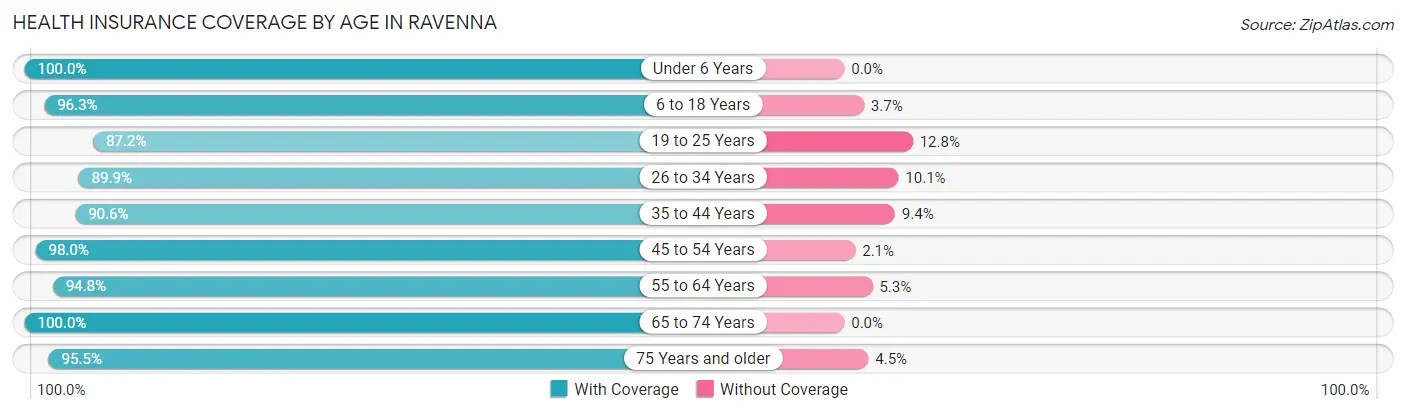
| Age Bracket | With Coverage | Without Coverage |
| Under 6 Years | 609 (100.0%) | 0 (0.0%) |
| 6 to 18 Years | 1,686 (96.3%) | 64 (3.7%) |
| 19 to 25 Years | 1,244 (87.2%) | 182 (12.8%) |
| 26 to 34 Years | 998 (89.9%) | 112 (10.1%) |
| 35 to 44 Years | 1,075 (90.6%) | 112 (9.4%) |
| 45 to 54 Years | 1,435 (98.0%) | 30 (2.1%) |
| 55 to 64 Years | 1,534 (94.8%) | 85 (5.2%) |
| 65 to 74 Years | 1,341 (100.0%) | 0 (0.0%) |
| 75 Years and older | 682 (95.5%) | 32 (4.5%) |
| Total | 10,604 (94.5%) | 617 (5.5%) |
Health Insurance Coverage by Citizenship Status in Ravenna
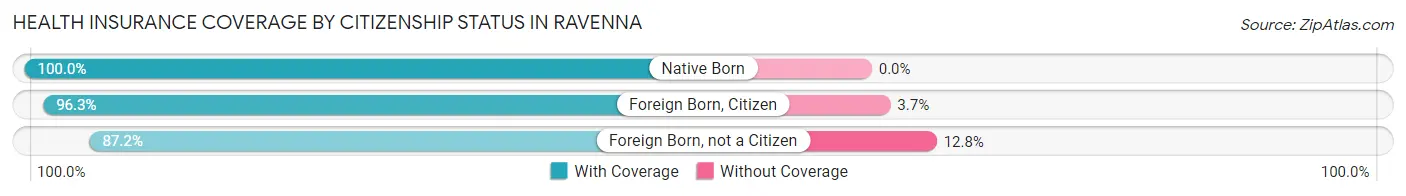
| Citizenship Status | With Coverage | Without Coverage |
| Native Born | 609 (100.0%) | 0 (0.0%) |
| Foreign Born, Citizen | 1,686 (96.3%) | 64 (3.7%) |
| Foreign Born, not a Citizen | 1,244 (87.2%) | 182 (12.8%) |
Health Insurance Coverage by Household Income in Ravenna
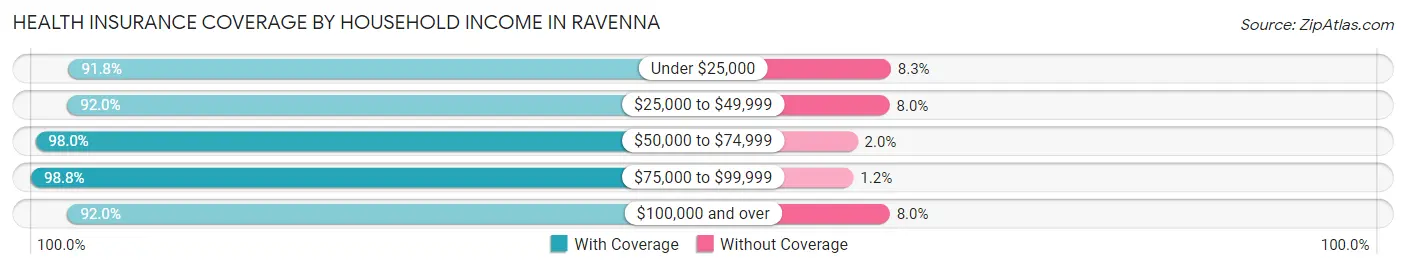
| Household Income | With Coverage | Without Coverage |
| Under $25,000 | 2,025 (91.7%) | 182 (8.3%) |
| $25,000 to $49,999 | 1,870 (92.0%) | 163 (8.0%) |
| $50,000 to $74,999 | 2,408 (98.0%) | 50 (2.0%) |
| $75,000 to $99,999 | 1,998 (98.8%) | 25 (1.2%) |
| $100,000 and over | 2,254 (92.0%) | 197 (8.0%) |
Public vs Private Health Insurance Coverage by Age in Ravenna
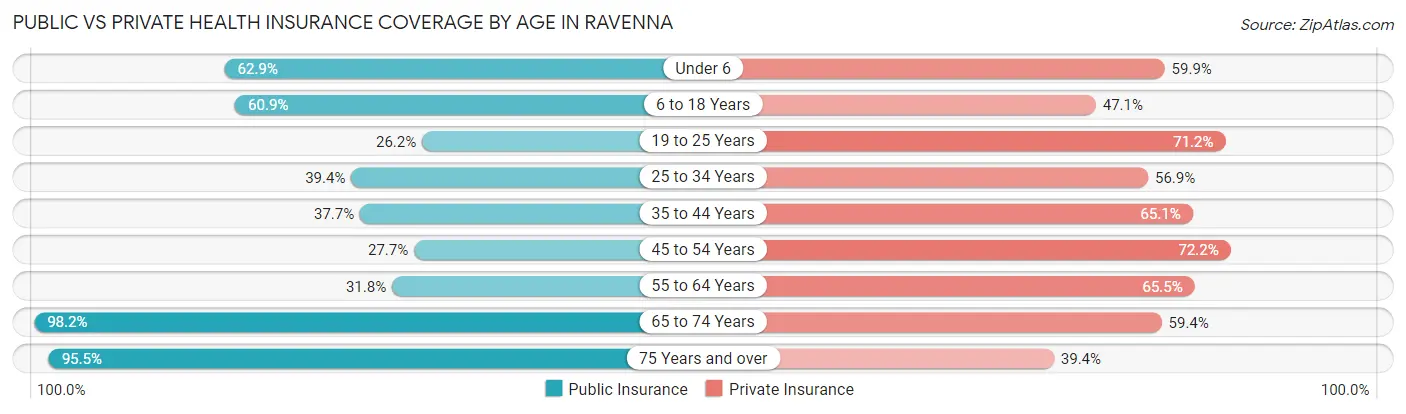
| Age Bracket | Public Insurance | Private Insurance |
| Under 6 | 383 (62.9%) | 365 (59.9%) |
| 6 to 18 Years | 1,066 (60.9%) | 825 (47.1%) |
| 19 to 25 Years | 374 (26.2%) | 1,015 (71.2%) |
| 25 to 34 Years | 437 (39.4%) | 631 (56.9%) |
| 35 to 44 Years | 448 (37.7%) | 773 (65.1%) |
| 45 to 54 Years | 406 (27.7%) | 1,057 (72.2%) |
| 55 to 64 Years | 515 (31.8%) | 1,060 (65.5%) |
| 65 to 74 Years | 1,317 (98.2%) | 796 (59.4%) |
| 75 Years and over | 682 (95.5%) | 281 (39.4%) |
| Total | 5,628 (50.2%) | 6,803 (60.6%) |
Disability Status by Sex by Age in Ravenna
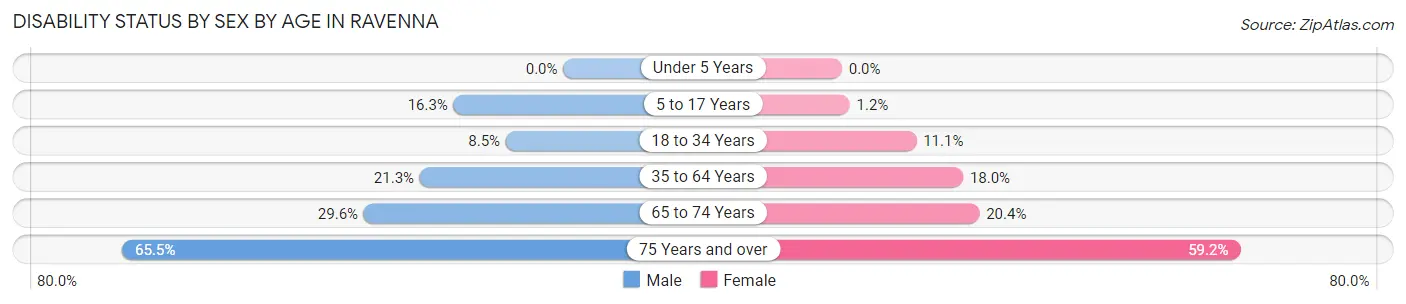
| Age Bracket | Male | Female |
| Under 5 Years | 0 (0.0%) | 0 (0.0%) |
| 5 to 17 Years | 139 (16.3%) | 10 (1.2%) |
| 18 to 34 Years | 113 (8.5%) | 151 (11.1%) |
| 35 to 64 Years | 467 (21.3%) | 374 (18.0%) |
| 65 to 74 Years | 181 (29.6%) | 149 (20.4%) |
| 75 Years and over | 171 (65.5%) | 268 (59.2%) |
Disability Class by Sex by Age in Ravenna
Disability Class: Hearing Difficulty
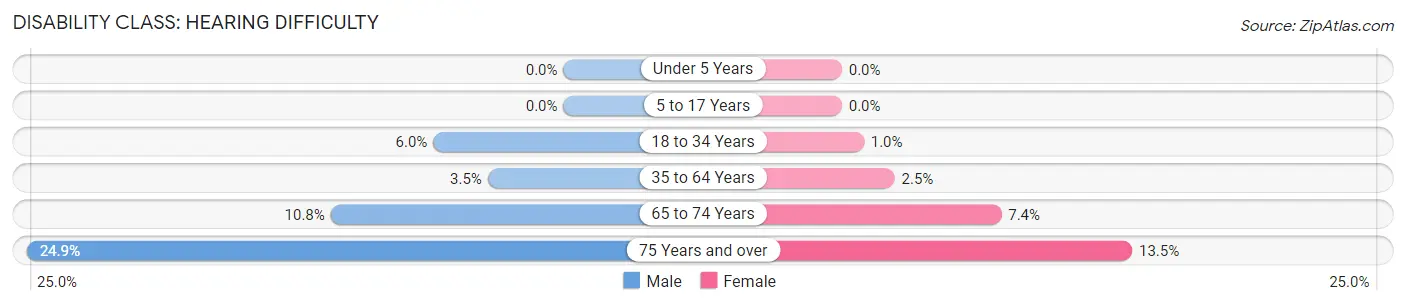
| Age Bracket | Male | Female |
| Under 5 Years | 0 (0.0%) | 0 (0.0%) |
| 5 to 17 Years | 0 (0.0%) | 0 (0.0%) |
| 18 to 34 Years | 80 (6.0%) | 14 (1.0%) |
| 35 to 64 Years | 77 (3.5%) | 51 (2.5%) |
| 65 to 74 Years | 66 (10.8%) | 54 (7.4%) |
| 75 Years and over | 65 (24.9%) | 61 (13.5%) |
Disability Class: Vision Difficulty
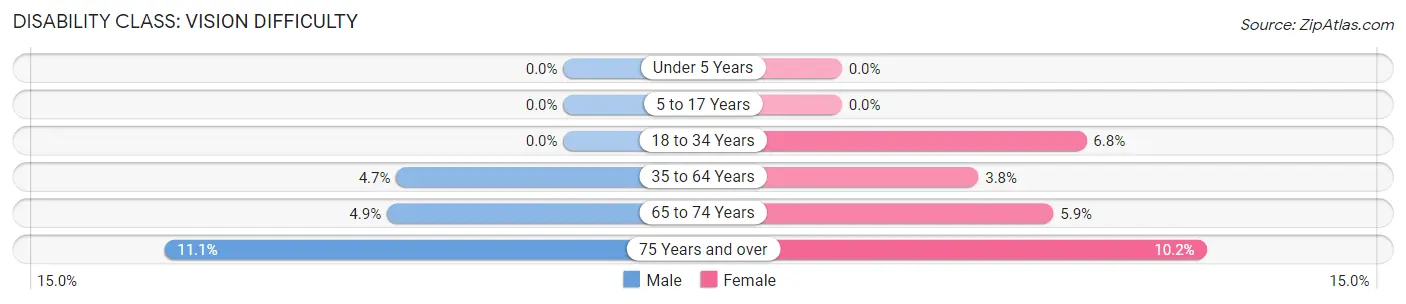
| Age Bracket | Male | Female |
| Under 5 Years | 0 (0.0%) | 0 (0.0%) |
| 5 to 17 Years | 0 (0.0%) | 0 (0.0%) |
| 18 to 34 Years | 0 (0.0%) | 93 (6.8%) |
| 35 to 64 Years | 102 (4.6%) | 79 (3.8%) |
| 65 to 74 Years | 30 (4.9%) | 43 (5.9%) |
| 75 Years and over | 29 (11.1%) | 46 (10.2%) |
Disability Class: Cognitive Difficulty
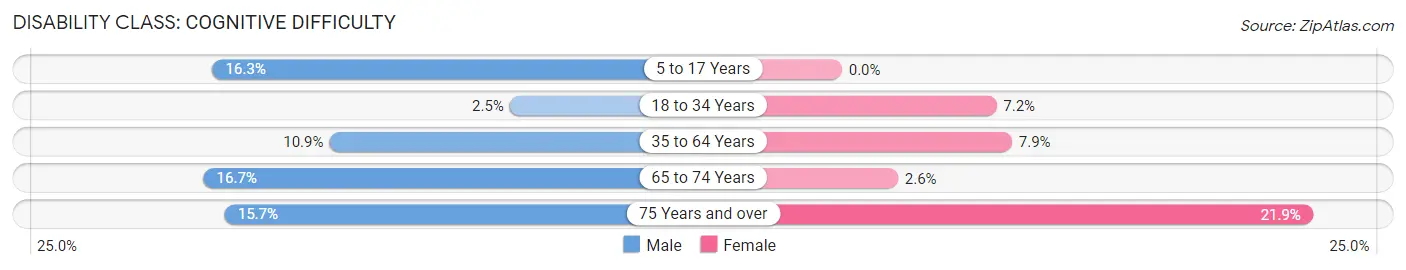
| Age Bracket | Male | Female |
| 5 to 17 Years | 139 (16.3%) | 0 (0.0%) |
| 18 to 34 Years | 33 (2.5%) | 98 (7.2%) |
| 35 to 64 Years | 238 (10.9%) | 164 (7.9%) |
| 65 to 74 Years | 102 (16.7%) | 19 (2.6%) |
| 75 Years and over | 41 (15.7%) | 99 (21.8%) |
Disability Class: Ambulatory Difficulty
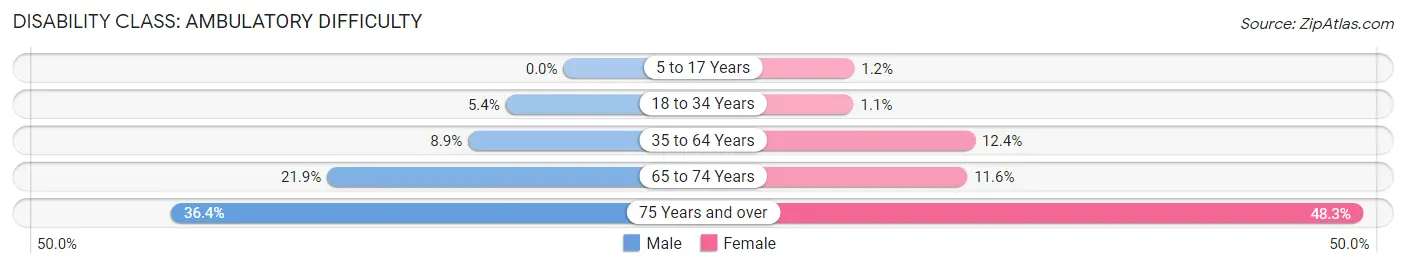
| Age Bracket | Male | Female |
| 5 to 17 Years | 0 (0.0%) | 10 (1.2%) |
| 18 to 34 Years | 71 (5.4%) | 15 (1.1%) |
| 35 to 64 Years | 194 (8.8%) | 257 (12.4%) |
| 65 to 74 Years | 134 (21.9%) | 85 (11.6%) |
| 75 Years and over | 95 (36.4%) | 219 (48.3%) |
Disability Class: Self-Care Difficulty
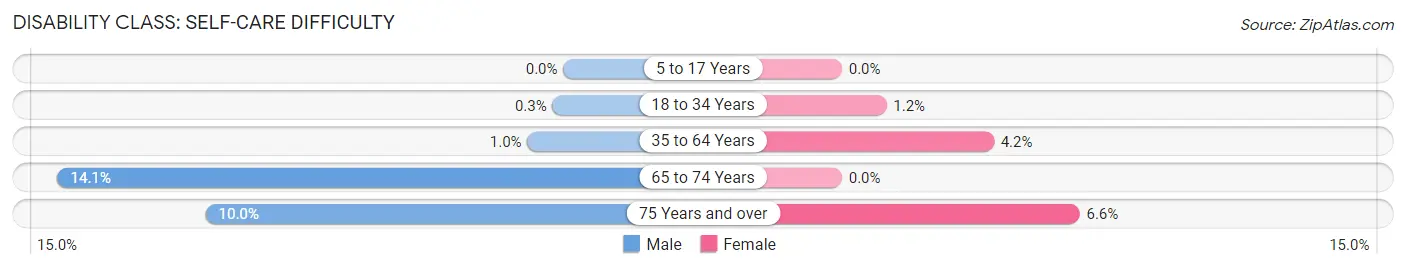
| Age Bracket | Male | Female |
| 5 to 17 Years | 0 (0.0%) | 0 (0.0%) |
| 18 to 34 Years | 4 (0.3%) | 17 (1.2%) |
| 35 to 64 Years | 22 (1.0%) | 88 (4.2%) |
| 65 to 74 Years | 86 (14.1%) | 0 (0.0%) |
| 75 Years and over | 26 (10.0%) | 30 (6.6%) |
Technology Access in Ravenna
Computing Device Access in Ravenna
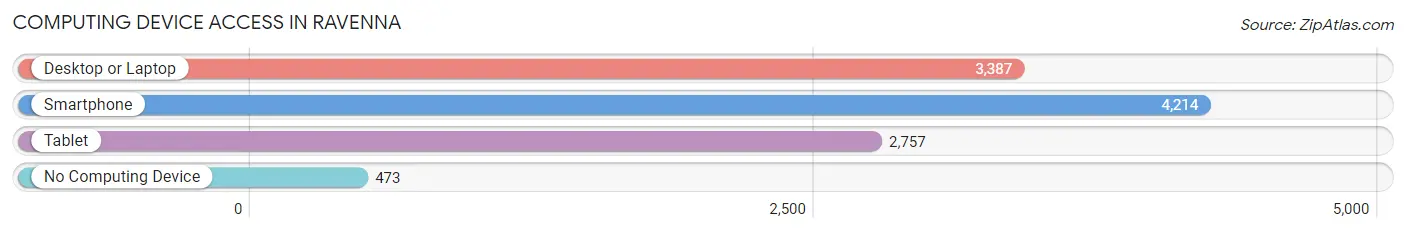
| Device Type | # Households | % Households |
| Desktop or Laptop | 3,387 | 67.5% |
| Smartphone | 4,214 | 83.9% |
| Tablet | 2,757 | 54.9% |
| No Computing Device | 473 | 9.4% |
| Total | 5,020 | 100.0% |
Internet Access in Ravenna
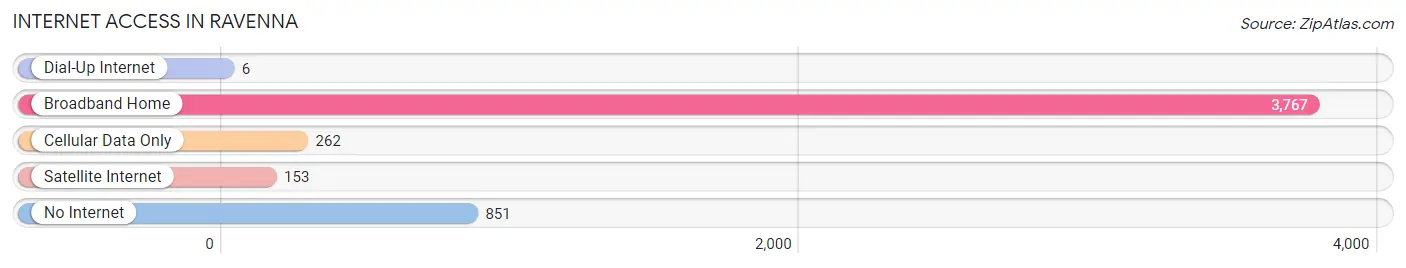
| Internet Type | # Households | % Households |
| Dial-Up Internet | 6 | 0.1% |
| Broadband Home | 3,767 | 75.0% |
| Cellular Data Only | 262 | 5.2% |
| Satellite Internet | 153 | 3.0% |
| No Internet | 851 | 17.0% |
| Total | 5,020 | 100.0% |
Ravenna Summary
Ravenna, Ohio is a city located in Portage County, Ohio, United States. It is the county seat of Portage County and is located approximately 30 miles southeast of Cleveland. The population of Ravenna was 11,724 at the 2010 census.
History
The area that is now Ravenna was first settled in 1799 by a group of settlers from Connecticut. The town was originally known as "Ravenna Township" and was named after the Italian city of Ravenna. The town was officially incorporated in 1808.
In 1815, the first post office was established in Ravenna and the town began to grow. By 1820, the population had grown to over 500 people.
In 1825, the first school was established in Ravenna. The school was a one-room log cabin and was located on the corner of Main and Chestnut Streets.
In 1827, the first newspaper, the Portage Sentinel, was established in Ravenna. The newspaper was published until 1831.
In 1831, the first church was established in Ravenna. The church was the First Congregational Church and was located on the corner of Main and Chestnut Streets.
In 1832, the first bank was established in Ravenna. The bank was the Portage County Bank and was located on the corner of Main and Chestnut Streets.
In 1837, the first railroad was established in Ravenna. The railroad was the Cleveland and Pittsburgh Railroad and ran from Cleveland to Pittsburgh.
In 1845, the first telegraph line was established in Ravenna. The telegraph line ran from Cleveland to Pittsburgh.
In 1848, the first gas works was established in Ravenna. The gas works was located on the corner of Main and Chestnut Streets.
In 1851, the first fire department was established in Ravenna. The fire department was located on the corner of Main and Chestnut Streets.
In 1853, the first public library was established in Ravenna. The library was located on the corner of Main and Chestnut Streets.
In 1854, the first hospital was established in Ravenna. The hospital was located on the corner of Main and Chestnut Streets.
In 1856, the first telephone line was established in Ravenna. The telephone line ran from Cleveland to Pittsburgh.
In 1858, the first water works was established in Ravenna. The water works was located on the corner of Main and Chestnut Streets.
In 1859, the first electric light plant was established in Ravenna. The electric light plant was located on the corner of Main and Chestnut Streets.
In 1864, the first public park was established in Ravenna. The park was located on the corner of Main and Chestnut Streets.
Geography
Ravenna is located at 41°10'45" North, 81°10'45" West (41.179167, -81.179167). According to the United States Census Bureau, the city has a total area of 5.2 square miles, all of it land.
Economy
The economy of Ravenna is largely based on manufacturing and services. The city is home to several manufacturing companies, including Ravenna Metal Products, Ravenna Tool & Die, and Ravenna Plastics. The city is also home to several service-based businesses, including Ravenna Medical Center, Ravenna Veterinary Clinic, and Ravenna Auto Repair.
Demographics
As of the 2010 census, there were 11,724 people, 4,717 households, and 2,945 families residing in the city. The population density was 2,269.2 people per square mile. The racial makeup of the city was 92.2% White, 4.2% African American, 0.3% Native American, 0.7% Asian, 0.1% Pacific Islander, 0.7% from other races, and 1.9% from two or more races. Hispanic or Latino of any race were 2.2% of the population.
The median income for a household in the city was $37,917, and the median income for a family was $45,945. Males had a median income of $35,917 versus $25,917 for females. The per capita income for the city was $18,945. About 11.2% of families and 14.2% of the population were below the poverty line, including 20.2% of those under age 18 and 8.2% of those age 65 or over.
Common Questions
What is Per Capita Income in Ravenna?
Per Capita income in Ravenna is $29,996.
What is the Median Family Income in Ravenna?
Median Family Income in Ravenna is $67,344.
What is the Median Household income in Ravenna?
Median Household Income in Ravenna is $48,221.
What is Income or Wage Gap in Ravenna?
Income or Wage Gap in Ravenna is 21.3%.
Women in Ravenna earn 78.7 cents for every dollar earned by a man.
What is Family Income Deficit in Ravenna?
Family Income Deficit in Ravenna is $8,497.
Families that are below poverty line in Ravenna earn $8,497 less on average than the poverty threshold level.
What is Inequality or Gini Index in Ravenna?
Inequality or Gini Index in Ravenna is 0.49.
What is the Total Population of Ravenna?
Total Population of Ravenna is 11,323.
What is the Total Male Population of Ravenna?
Total Male Population of Ravenna is 5,535.
What is the Total Female Population of Ravenna?
Total Female Population of Ravenna is 5,788.
What is the Ratio of Males per 100 Females in Ravenna?
There are 95.63 Males per 100 Females in Ravenna.
What is the Ratio of Females per 100 Males in Ravenna?
There are 104.57 Females per 100 Males in Ravenna.
What is the Median Population Age in Ravenna?
Median Population Age in Ravenna is 41.0 Years.
What is the Average Family Size in Ravenna
Average Family Size in Ravenna is 3.0 People.
What is the Average Household Size in Ravenna
Average Household Size in Ravenna is 2.2 People.
How Large is the Labor Force in Ravenna?
There are 5,814 People in the Labor Forcein in Ravenna.
What is the Percentage of People in the Labor Force in Ravenna?
62.7% of People are in the Labor Force in Ravenna.
What is the Unemployment Rate in Ravenna?
Unemployment Rate in Ravenna is 7.0%.