Belpre, OH Map & Demographics
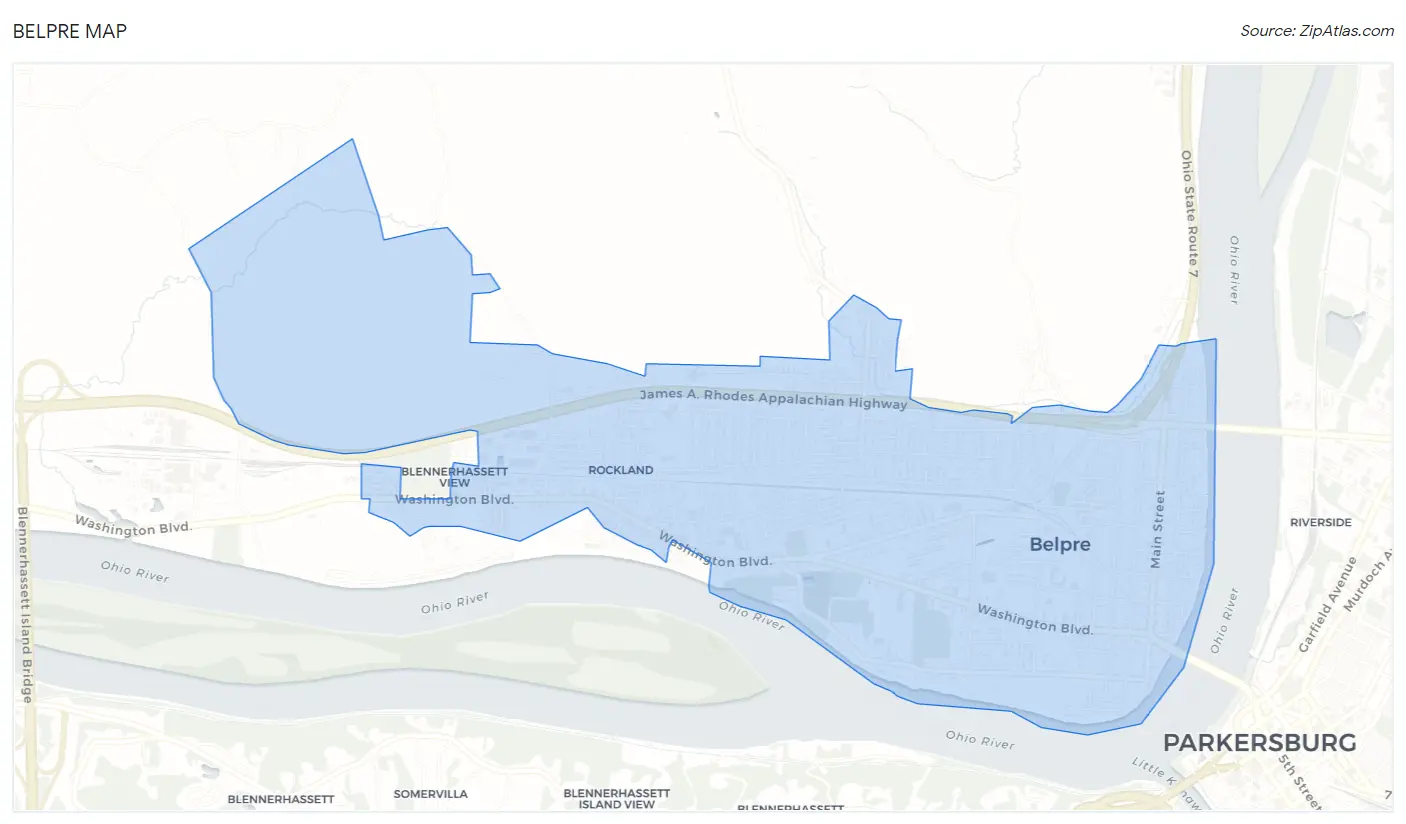
Belpre Map
Belpre Overview
$28,122
PER CAPITA INCOME
$67,848
AVG FAMILY INCOME
$47,474
AVG HOUSEHOLD INCOME
26.8%
WAGE / INCOME GAP [ % ]
73.2¢/ $1
WAGE / INCOME GAP [ $ ]
0.40
INEQUALITY / GINI INDEX
6,690
TOTAL POPULATION
3,257
MALE POPULATION
3,433
FEMALE POPULATION
94.87
MALES / 100 FEMALES
105.40
FEMALES / 100 MALES
45.4
MEDIAN AGE
2.9
AVG FAMILY SIZE
2.2
AVG HOUSEHOLD SIZE
3,094
LABOR FORCE [ PEOPLE ]
55.8%
PERCENT IN LABOR FORCE
3.9%
UNEMPLOYMENT RATE
Belpre Zip Codes
Belpre Area Codes
Income in Belpre
Income Overview in Belpre
Per Capita Income in Belpre is $28,122, while median incomes of families and households are $67,848 and $47,474 respectively.
| Characteristic | Number | Measure |
| Per Capita Income | 6,690 | $28,122 |
| Median Family Income | 1,568 | $67,848 |
| Mean Family Income | 1,568 | $72,937 |
| Median Household Income | 3,074 | $47,474 |
| Mean Household Income | 3,074 | $59,170 |
| Income Deficit | 1,568 | $0 |
| Wage / Income Gap (%) | 6,690 | 26.80% |
| Wage / Income Gap ($) | 6,690 | 73.20¢ per $1 |
| Gini / Inequality Index | 6,690 | 0.40 |
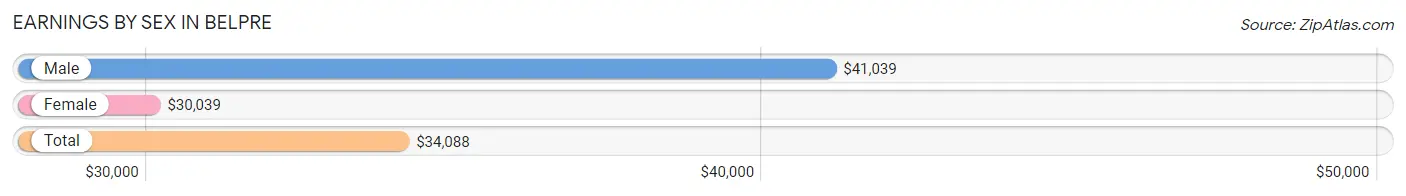
Earnings by Sex in Belpre
Average Earnings in Belpre are $34,088, $41,039 for men and $30,039 for women, a difference of 26.8%.
| Sex | Number | Average Earnings |
| Male | 1,645 (51.0%) | $41,039 |
| Female | 1,580 (49.0%) | $30,039 |
| Total | 3,225 (100.0%) | $34,088 |
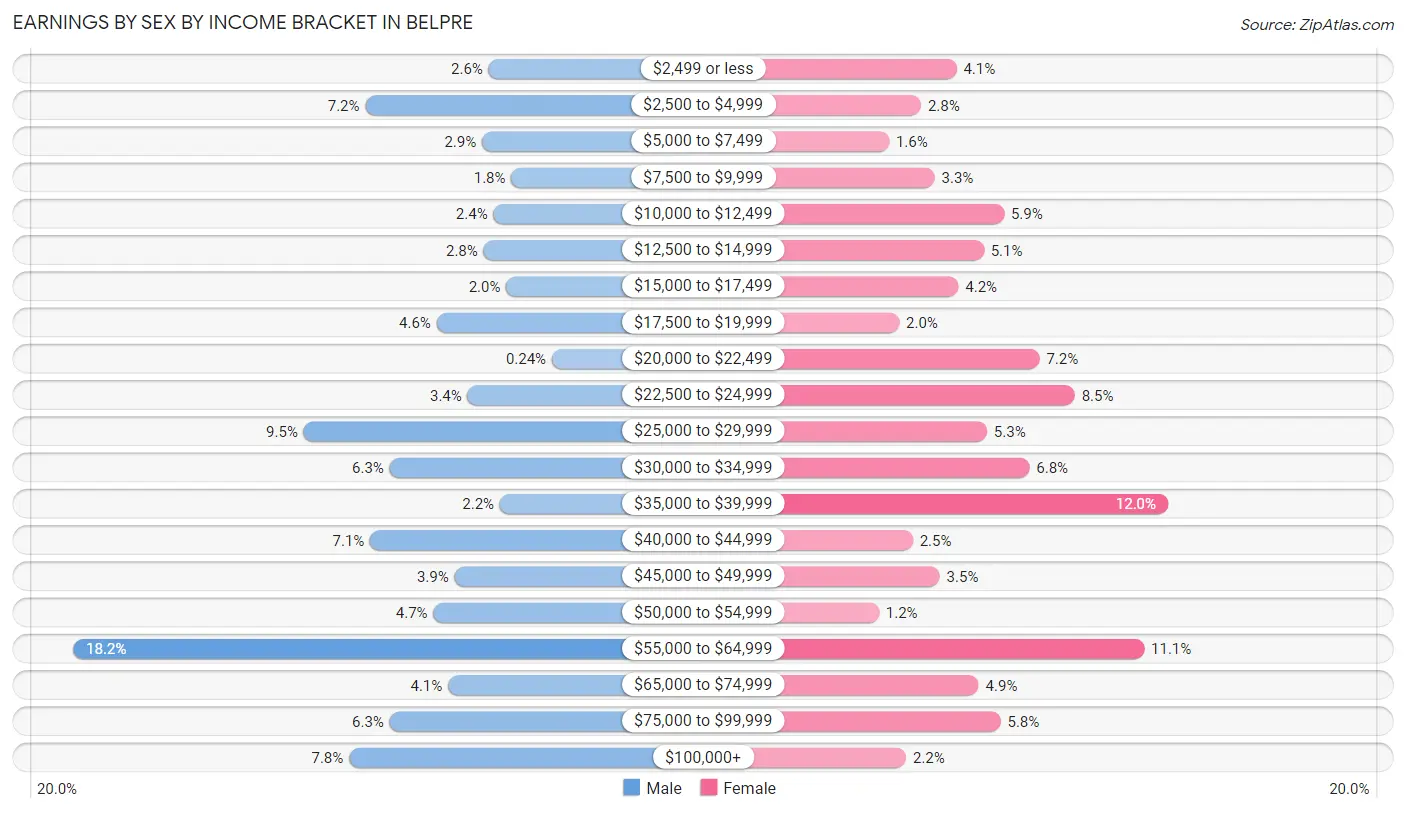
Earnings by Sex by Income Bracket in Belpre
The most common earnings brackets in Belpre are $55,000 to $64,999 for men (299 | 18.2%) and $35,000 to $39,999 for women (190 | 12.0%).
| Income | Male | Female |
| $2,499 or less | 43 (2.6%) | 65 (4.1%) |
| $2,500 to $4,999 | 119 (7.2%) | 44 (2.8%) |
| $5,000 to $7,499 | 47 (2.9%) | 25 (1.6%) |
| $7,500 to $9,999 | 29 (1.8%) | 52 (3.3%) |
| $10,000 to $12,499 | 40 (2.4%) | 93 (5.9%) |
| $12,500 to $14,999 | 46 (2.8%) | 81 (5.1%) |
| $15,000 to $17,499 | 32 (1.9%) | 66 (4.2%) |
| $17,500 to $19,999 | 75 (4.6%) | 31 (2.0%) |
| $20,000 to $22,499 | 4 (0.2%) | 114 (7.2%) |
| $22,500 to $24,999 | 56 (3.4%) | 135 (8.5%) |
| $25,000 to $29,999 | 157 (9.5%) | 83 (5.2%) |
| $30,000 to $34,999 | 104 (6.3%) | 108 (6.8%) |
| $35,000 to $39,999 | 36 (2.2%) | 190 (12.0%) |
| $40,000 to $44,999 | 116 (7.0%) | 39 (2.5%) |
| $45,000 to $49,999 | 64 (3.9%) | 55 (3.5%) |
| $50,000 to $54,999 | 77 (4.7%) | 19 (1.2%) |
| $55,000 to $64,999 | 299 (18.2%) | 176 (11.1%) |
| $65,000 to $74,999 | 68 (4.1%) | 78 (4.9%) |
| $75,000 to $99,999 | 104 (6.3%) | 91 (5.8%) |
| $100,000+ | 129 (7.8%) | 35 (2.2%) |
| Total | 1,645 (100.0%) | 1,580 (100.0%) |
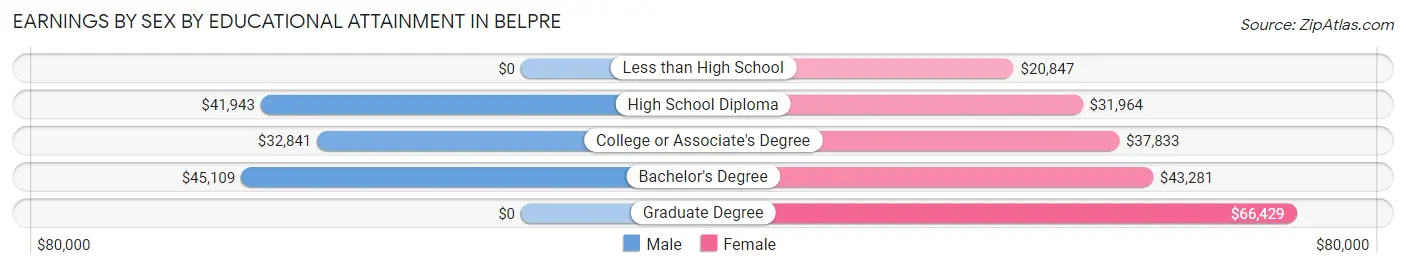
Earnings by Sex by Educational Attainment in Belpre
Average earnings in Belpre are $42,538 for men and $37,008 for women, a difference of 13.0%. Men with an educational attainment of bachelor's degree enjoy the highest average annual earnings of $45,109, while those with college or associate's degree education earn the least with $32,841. Women with an educational attainment of graduate degree earn the most with the average annual earnings of $66,429, while those with less than high school education have the smallest earnings of $20,847.
| Educational Attainment | Male Income | Female Income |
| Less than High School | - | - |
| High School Diploma | $41,943 | $31,964 |
| College or Associate's Degree | $32,841 | $37,833 |
| Bachelor's Degree | $45,109 | $43,281 |
| Graduate Degree | - | - |
| Total | $42,538 | $37,008 |
Family Income in Belpre
Family Income Brackets in Belpre
According to the Belpre family income data, there are 379 families falling into the $50,000 to $74,999 income range, which is the most common income bracket and makes up 24.2% of all families. Conversely, the $200,000+ income bracket is the least frequent group with only 27 families (1.7%) belonging to this category.
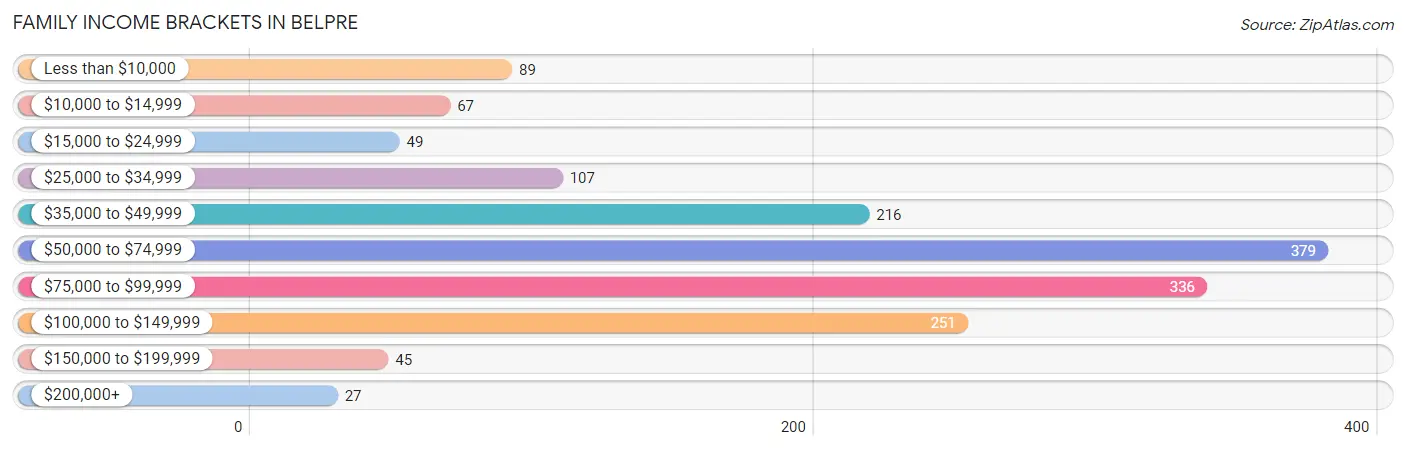
| Income Bracket | # Families | % Families |
| Less than $10,000 | 89 | 5.7% |
| $10,000 to $14,999 | 67 | 4.3% |
| $15,000 to $24,999 | 49 | 3.1% |
| $25,000 to $34,999 | 107 | 6.8% |
| $35,000 to $49,999 | 216 | 13.8% |
| $50,000 to $74,999 | 379 | 24.2% |
| $75,000 to $99,999 | 336 | 21.4% |
| $100,000 to $149,999 | 251 | 16.0% |
| $150,000 to $199,999 | 45 | 2.9% |
| $200,000+ | 27 | 1.7% |
Family Income by Famaliy Size in Belpre
4-person families (292 | 18.6%) account for the highest median family income in Belpre with $75,000 per family, while 2-person families (858 | 54.7%) have the highest median income of $33,962 per family member.
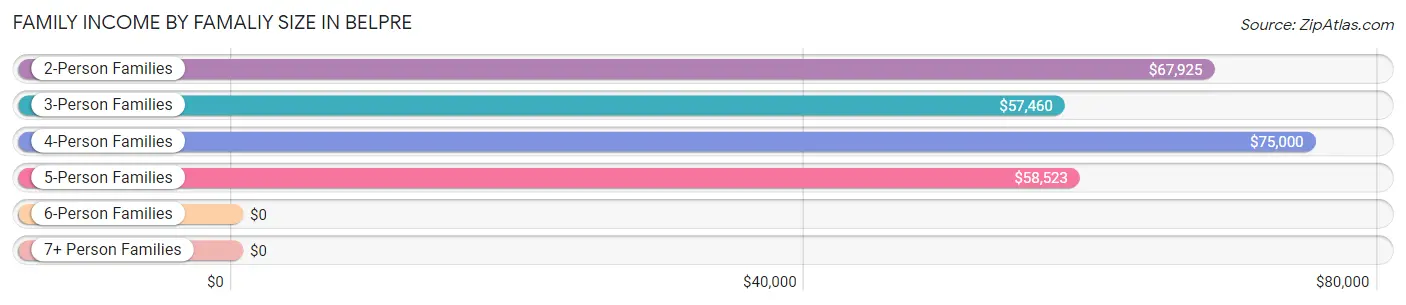
| Income Bracket | # Families | Median Income |
| 2-Person Families | 858 (54.7%) | $67,925 |
| 3-Person Families | 281 (17.9%) | $57,460 |
| 4-Person Families | 292 (18.6%) | $75,000 |
| 5-Person Families | 103 (6.6%) | $58,523 |
| 6-Person Families | 34 (2.2%) | $0 |
| 7+ Person Families | 0 (0.0%) | $0 |
| Total | 1,568 (100.0%) | $67,848 |
Family Income by Number of Earners in Belpre
The median family income in Belpre is $67,848, with families comprising 3+ earners (109) having the highest median family income of $102,422, while families with no earners (335) have the lowest median family income of $39,153, accounting for 7.0% and 21.4% of families, respectively.
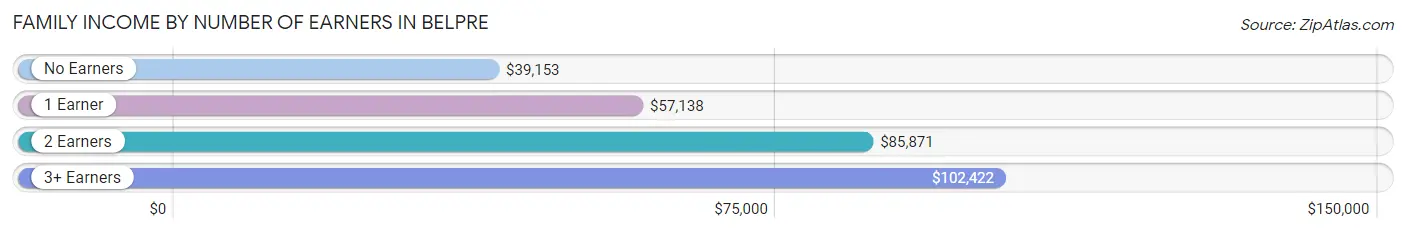
| Number of Earners | # Families | Median Income |
| No Earners | 335 (21.4%) | $39,153 |
| 1 Earner | 709 (45.2%) | $57,138 |
| 2 Earners | 415 (26.5%) | $85,871 |
| 3+ Earners | 109 (7.0%) | $102,422 |
| Total | 1,568 (100.0%) | $67,848 |
Household Income in Belpre
Household Income Brackets in Belpre
With 572 households falling in the category, the $50,000 to $74,999 income range is the most frequent in Belpre, accounting for 18.6% of all households. In contrast, only 46 households (1.5%) fall into the $200,000+ income bracket, making it the least populous group.
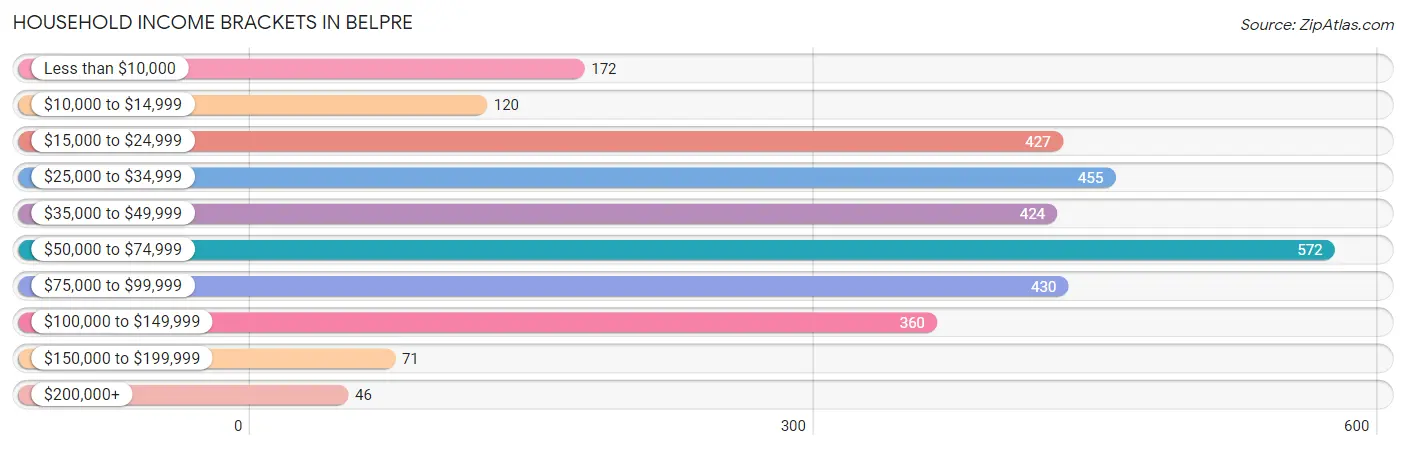
| Income Bracket | # Households | % Households |
| Less than $10,000 | 172 | 5.6% |
| $10,000 to $14,999 | 120 | 3.9% |
| $15,000 to $24,999 | 427 | 13.9% |
| $25,000 to $34,999 | 455 | 14.8% |
| $35,000 to $49,999 | 424 | 13.8% |
| $50,000 to $74,999 | 572 | 18.6% |
| $75,000 to $99,999 | 430 | 14.0% |
| $100,000 to $149,999 | 360 | 11.7% |
| $150,000 to $199,999 | 71 | 2.3% |
| $200,000+ | 46 | 1.5% |
Household Income by Householder Age in Belpre
The median household income in Belpre is $47,474, with the highest median household income of $66,295 found in the 45 to 64 years age bracket for the primary householder. A total of 1,127 households (36.7%) fall into this category. Meanwhile, the 65+ years age bracket for the primary householder has the lowest median household income of $31,688, with 1,081 households (35.2%) in this group.
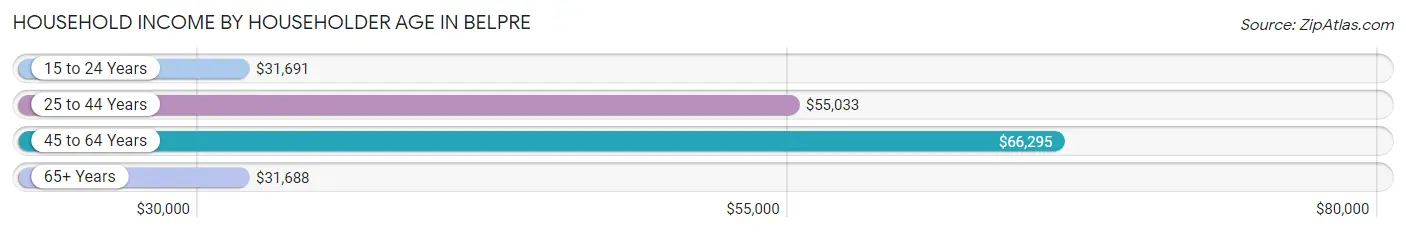
| Income Bracket | # Households | Median Income |
| 15 to 24 Years | 101 (3.3%) | $31,691 |
| 25 to 44 Years | 765 (24.9%) | $55,033 |
| 45 to 64 Years | 1,127 (36.7%) | $66,295 |
| 65+ Years | 1,081 (35.2%) | $31,688 |
| Total | 3,074 (100.0%) | $47,474 |
Poverty in Belpre
Income Below Poverty by Sex and Age in Belpre
With 16.3% poverty level for males and 19.3% for females among the residents of Belpre, 15 year old males and 16 and 17 year old females are the most vulnerable to poverty, with 40 males (46.5%) and 20 females (35.7%) in their respective age groups living below the poverty level.
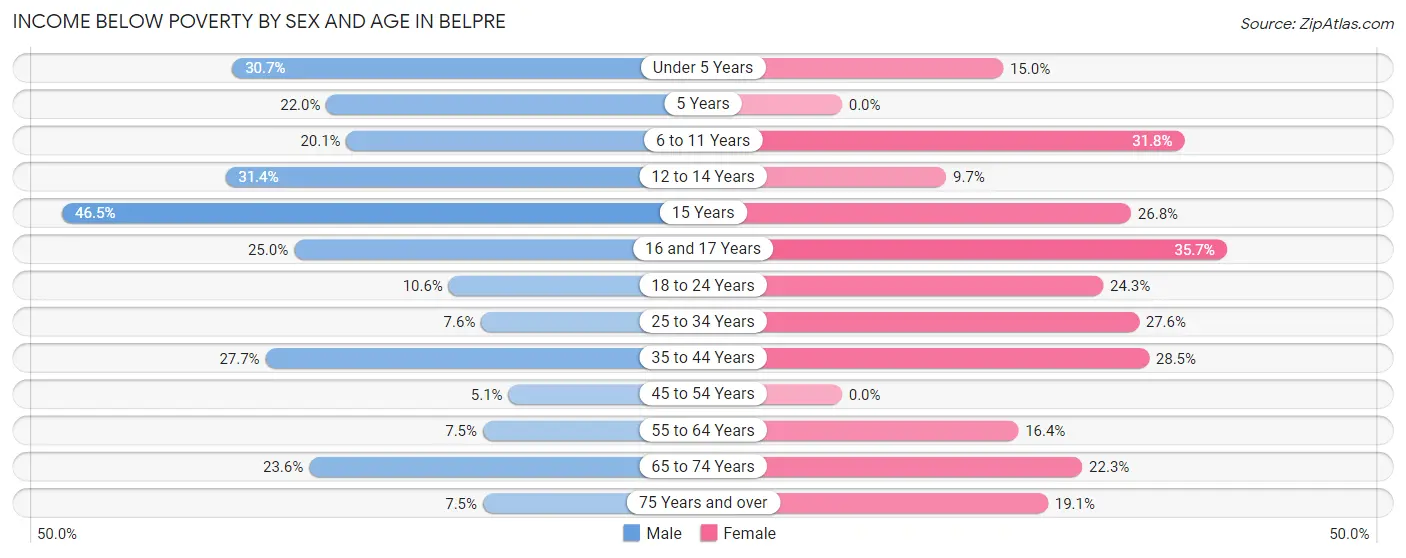
| Age Bracket | Male | Female |
| Under 5 Years | 55 (30.7%) | 19 (15.0%) |
| 5 Years | 11 (22.0%) | 0 (0.0%) |
| 6 to 11 Years | 32 (20.1%) | 55 (31.8%) |
| 12 to 14 Years | 48 (31.4%) | 12 (9.7%) |
| 15 Years | 40 (46.5%) | 11 (26.8%) |
| 16 and 17 Years | 24 (25.0%) | 20 (35.7%) |
| 18 to 24 Years | 20 (10.6%) | 73 (24.2%) |
| 25 to 34 Years | 40 (7.6%) | 78 (27.6%) |
| 35 to 44 Years | 94 (27.7%) | 110 (28.5%) |
| 45 to 54 Years | 20 (5.1%) | 0 (0.0%) |
| 55 to 64 Years | 33 (7.5%) | 73 (16.4%) |
| 65 to 74 Years | 93 (23.6%) | 139 (22.3%) |
| 75 Years and over | 18 (7.5%) | 65 (19.1%) |
| Total | 528 (16.3%) | 655 (19.3%) |
Income Above Poverty by Sex and Age in Belpre
According to the poverty statistics in Belpre, males aged 45 to 54 years and females aged 5 years are the age groups that are most secure financially, with 94.9% of males and 100.0% of females in these age groups living above the poverty line.
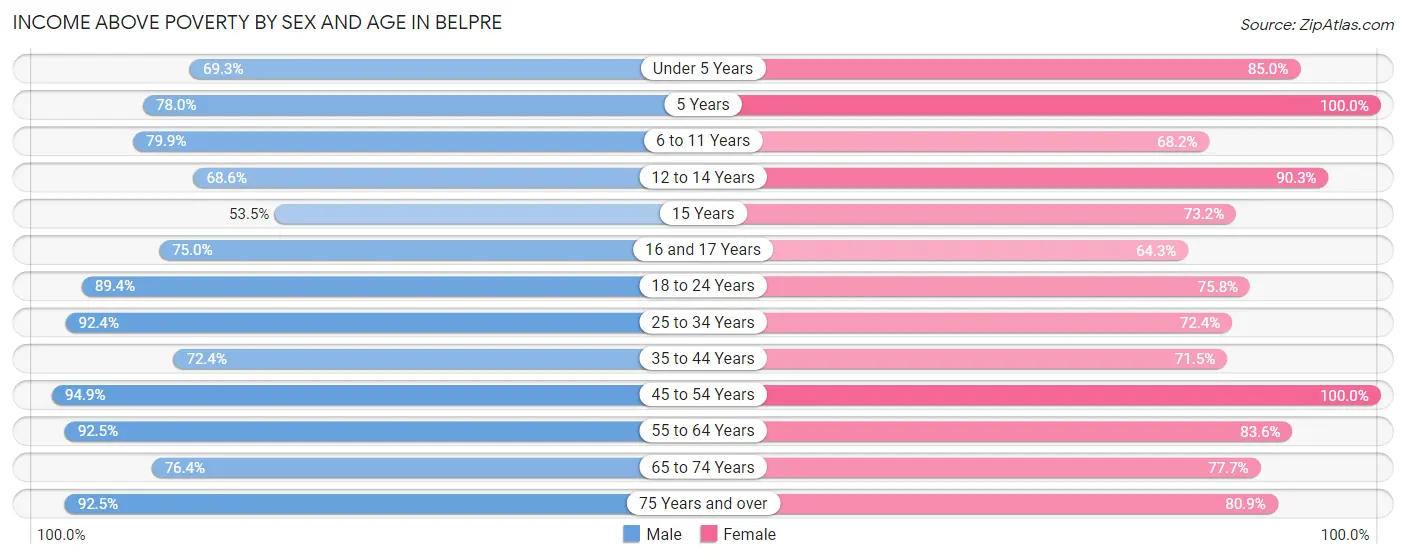
| Age Bracket | Male | Female |
| Under 5 Years | 124 (69.3%) | 108 (85.0%) |
| 5 Years | 39 (78.0%) | 9 (100.0%) |
| 6 to 11 Years | 127 (79.9%) | 118 (68.2%) |
| 12 to 14 Years | 105 (68.6%) | 112 (90.3%) |
| 15 Years | 46 (53.5%) | 30 (73.2%) |
| 16 and 17 Years | 72 (75.0%) | 36 (64.3%) |
| 18 to 24 Years | 168 (89.4%) | 228 (75.7%) |
| 25 to 34 Years | 485 (92.4%) | 205 (72.4%) |
| 35 to 44 Years | 246 (72.4%) | 276 (71.5%) |
| 45 to 54 Years | 372 (94.9%) | 488 (100.0%) |
| 55 to 64 Years | 409 (92.5%) | 373 (83.6%) |
| 65 to 74 Years | 301 (76.4%) | 484 (77.7%) |
| 75 Years and over | 223 (92.5%) | 275 (80.9%) |
| Total | 2,717 (83.7%) | 2,742 (80.7%) |
Income Below Poverty Among Married-Couple Families in Belpre
The poverty statistics for married-couple families in Belpre show that 7.0% or 82 of the total 1,176 families live below the poverty line. Families with 3 or 4 children have the highest poverty rate of 40.2%, comprising of 37 families. On the other hand, families with 1 or 2 children have the lowest poverty rate of 3.6%, which includes 12 families.
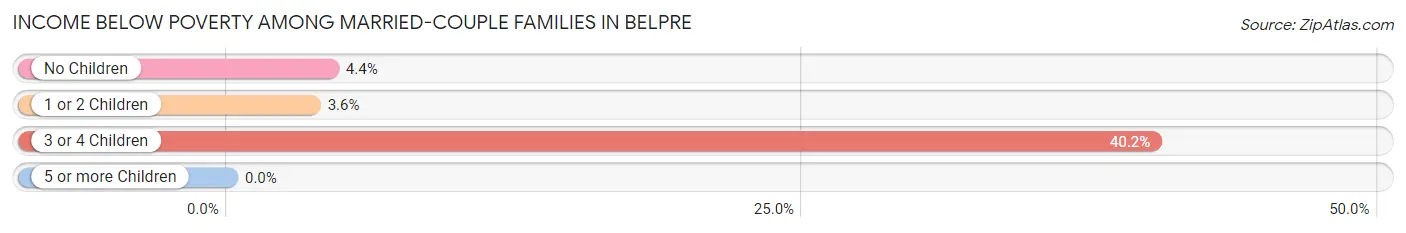
| Children | Above Poverty | Below Poverty |
| No Children | 718 (95.6%) | 33 (4.4%) |
| 1 or 2 Children | 321 (96.4%) | 12 (3.6%) |
| 3 or 4 Children | 55 (59.8%) | 37 (40.2%) |
| 5 or more Children | 0 (0.0%) | 0 (0.0%) |
| Total | 1,094 (93.0%) | 82 (7.0%) |
Income Below Poverty Among Single-Parent Households in Belpre
According to the poverty data in Belpre, 13.9% or 11 single-father households and 32.0% or 100 single-mother households are living below the poverty line. Among single-father households, those with 3 or 4 children have the highest poverty rate, with 11 households (61.1%) experiencing poverty. Likewise, among single-mother households, those with 1 or 2 children have the highest poverty rate, with 72 households (43.4%) falling below the poverty line.
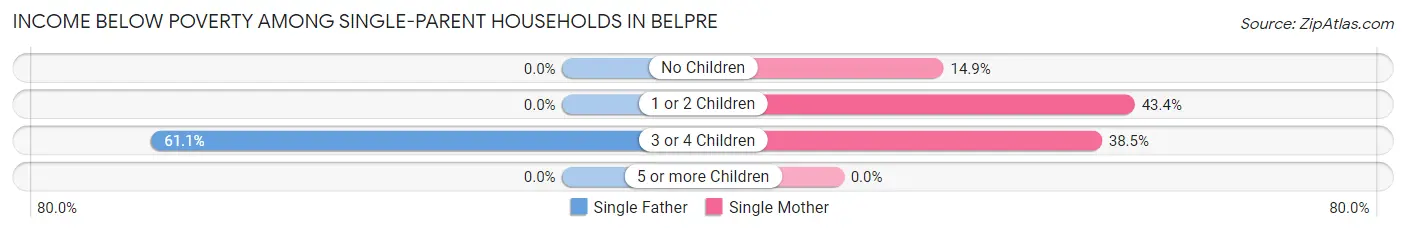
| Children | Single Father | Single Mother |
| No Children | 0 (0.0%) | 18 (14.9%) |
| 1 or 2 Children | 0 (0.0%) | 72 (43.4%) |
| 3 or 4 Children | 11 (61.1%) | 10 (38.5%) |
| 5 or more Children | 0 (0.0%) | 0 (0.0%) |
| Total | 11 (13.9%) | 100 (32.0%) |
Income Below Poverty Among Married-Couple vs Single-Parent Households in Belpre
The poverty data for Belpre shows that 82 of the married-couple family households (7.0%) and 111 of the single-parent households (28.3%) are living below the poverty level. Within the married-couple family households, those with 3 or 4 children have the highest poverty rate, with 37 households (40.2%) falling below the poverty line. Among the single-parent households, those with 3 or 4 children have the highest poverty rate, with 21 household (47.7%) living below poverty.
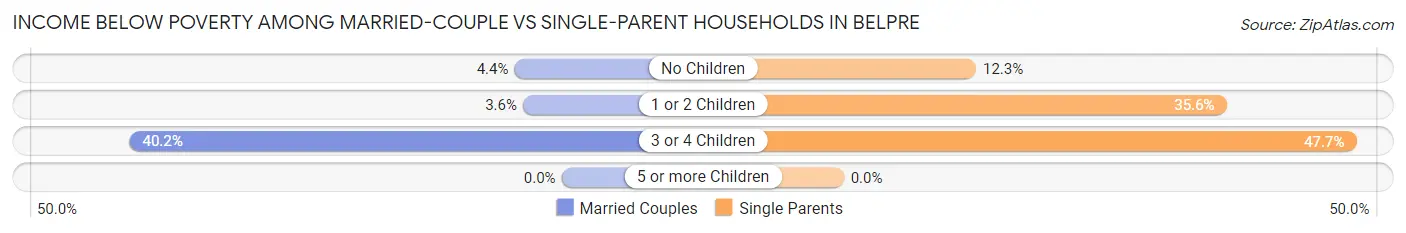
| Children | Married-Couple Families | Single-Parent Households |
| No Children | 33 (4.4%) | 18 (12.3%) |
| 1 or 2 Children | 12 (3.6%) | 72 (35.6%) |
| 3 or 4 Children | 37 (40.2%) | 21 (47.7%) |
| 5 or more Children | 0 (0.0%) | 0 (0.0%) |
| Total | 82 (7.0%) | 111 (28.3%) |
Race in Belpre
The most populous races in Belpre are White / Caucasian (6,299 | 94.2%), Two or more Races (206 | 3.1%), and Hispanic or Latino (181 | 2.7%).
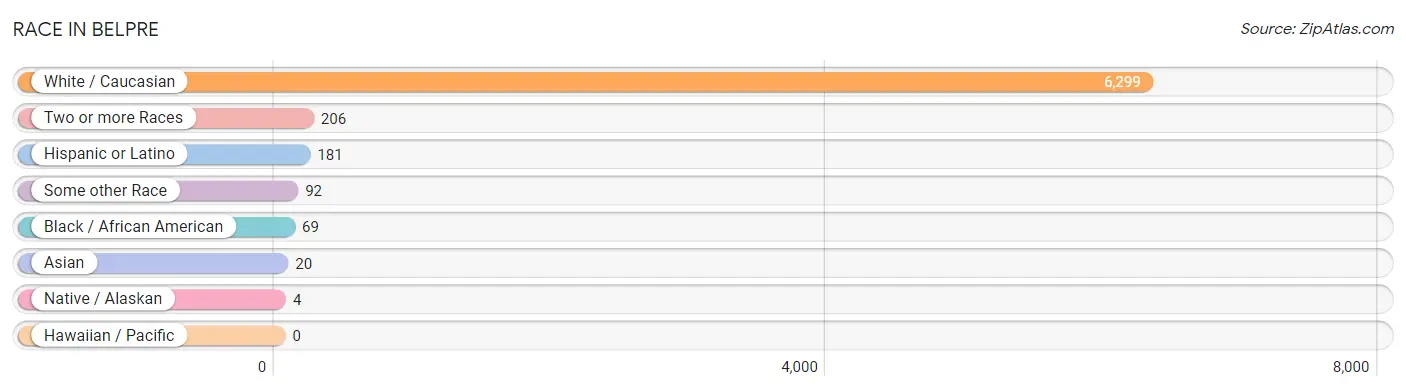
| Race | # Population | % Population |
| Asian | 20 | 0.3% |
| Black / African American | 69 | 1.0% |
| Hawaiian / Pacific | 0 | 0.0% |
| Hispanic or Latino | 181 | 2.7% |
| Native / Alaskan | 4 | 0.1% |
| White / Caucasian | 6,299 | 94.2% |
| Two or more Races | 206 | 3.1% |
| Some other Race | 92 | 1.4% |
| Total | 6,690 | 100.0% |
Ancestry in Belpre
The most populous ancestries reported in Belpre are English (1,068 | 16.0%), German (992 | 14.8%), Irish (941 | 14.1%), American (606 | 9.1%), and Scottish (229 | 3.4%), together accounting for 57.3% of all Belpre residents.
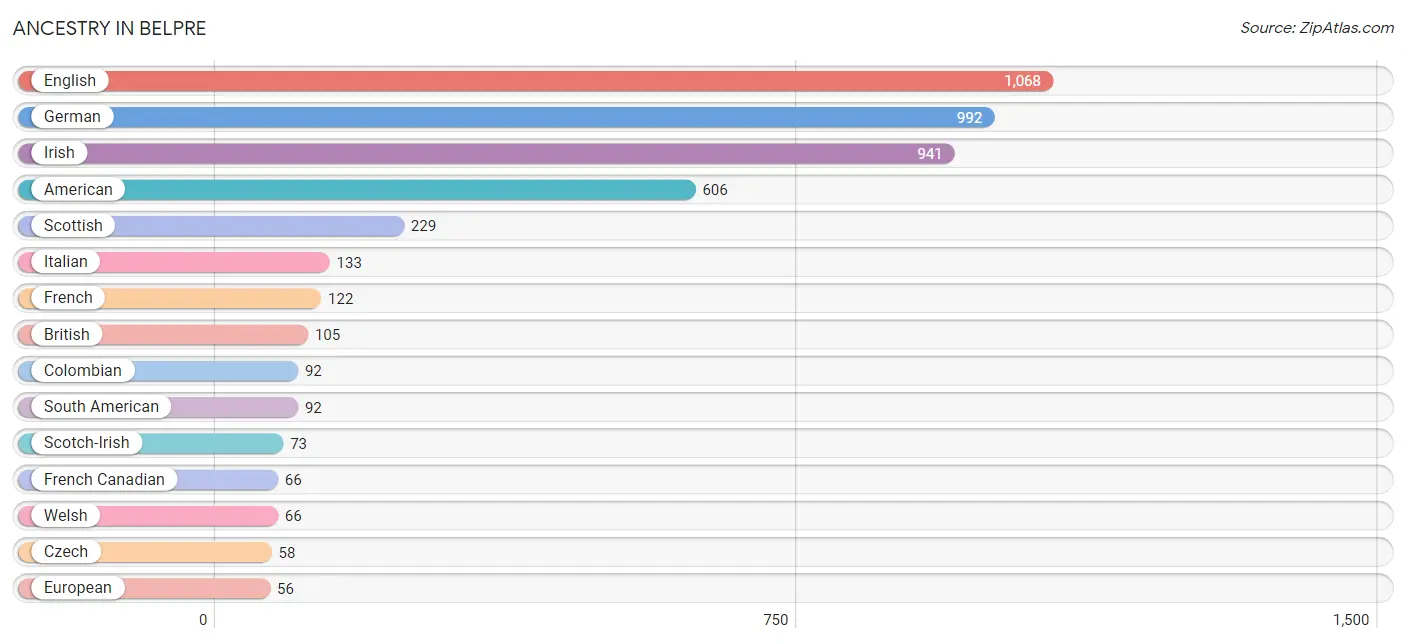
| Ancestry | # Population | % Population |
| American | 606 | 9.1% |
| Arab | 46 | 0.7% |
| Austrian | 10 | 0.2% |
| Blackfeet | 33 | 0.5% |
| British | 105 | 1.6% |
| Cherokee | 34 | 0.5% |
| Colombian | 92 | 1.4% |
| Croatian | 12 | 0.2% |
| Crow | 12 | 0.2% |
| Czech | 58 | 0.9% |
| Dutch | 55 | 0.8% |
| English | 1,068 | 16.0% |
| European | 56 | 0.8% |
| Finnish | 9 | 0.1% |
| French | 122 | 1.8% |
| French Canadian | 66 | 1.0% |
| German | 992 | 14.8% |
| Hungarian | 11 | 0.2% |
| Indian (Asian) | 29 | 0.4% |
| Irish | 941 | 14.1% |
| Italian | 133 | 2.0% |
| Korean | 20 | 0.3% |
| Mexican | 21 | 0.3% |
| Polish | 28 | 0.4% |
| Puerto Rican | 41 | 0.6% |
| Scandinavian | 31 | 0.5% |
| Scotch-Irish | 73 | 1.1% |
| Scottish | 229 | 3.4% |
| Sioux | 9 | 0.1% |
| South American | 92 | 1.4% |
| Swedish | 7 | 0.1% |
| Swiss | 10 | 0.2% |
| Syrian | 37 | 0.5% |
| Welsh | 66 | 1.0% | View All 34 Rows |
Immigrants in Belpre
The most numerous immigrant groups reported in Belpre came from Asia (29 | 0.4%), Colombia (20 | 0.3%), Latin America (20 | 0.3%), Philippines (20 | 0.3%), and South America (20 | 0.3%), together accounting for 1.6% of all Belpre residents.
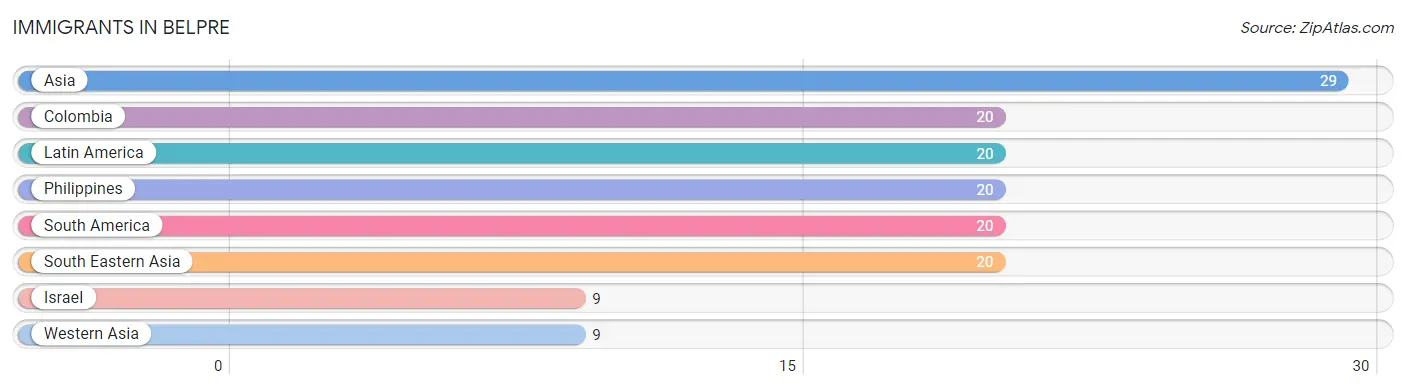
| Immigration Origin | # Population | % Population |
| Asia | 29 | 0.4% |
| Colombia | 20 | 0.3% |
| Israel | 9 | 0.1% |
| Latin America | 20 | 0.3% |
| Philippines | 20 | 0.3% |
| South America | 20 | 0.3% |
| South Eastern Asia | 20 | 0.3% |
| Western Asia | 9 | 0.1% | View All 8 Rows |
Sex and Age in Belpre
Sex and Age in Belpre
The most populous age groups in Belpre are 25 to 29 Years (303 | 9.3%) for men and 70 to 74 Years (373 | 10.9%) for women.
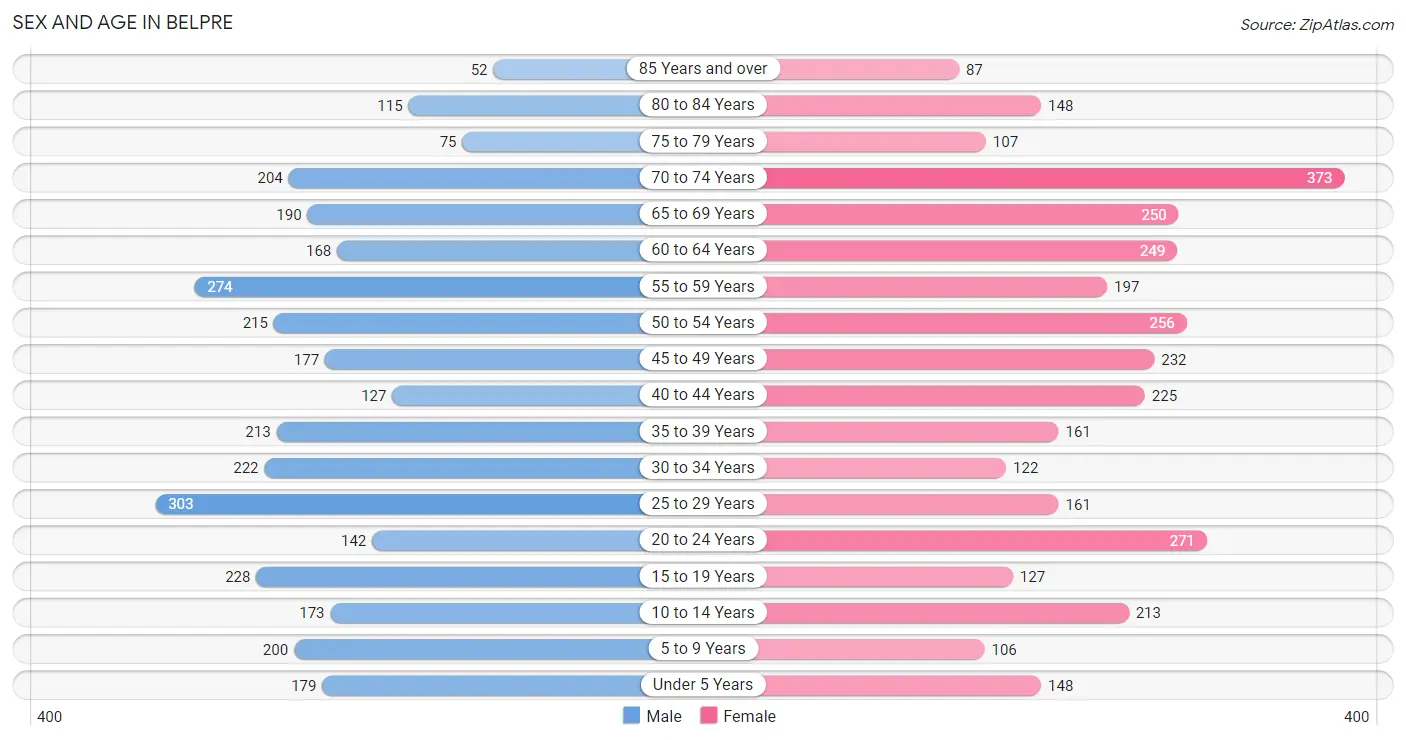
| Age Bracket | Male | Female |
| Under 5 Years | 179 (5.5%) | 148 (4.3%) |
| 5 to 9 Years | 200 (6.1%) | 106 (3.1%) |
| 10 to 14 Years | 173 (5.3%) | 213 (6.2%) |
| 15 to 19 Years | 228 (7.0%) | 127 (3.7%) |
| 20 to 24 Years | 142 (4.4%) | 271 (7.9%) |
| 25 to 29 Years | 303 (9.3%) | 161 (4.7%) |
| 30 to 34 Years | 222 (6.8%) | 122 (3.5%) |
| 35 to 39 Years | 213 (6.5%) | 161 (4.7%) |
| 40 to 44 Years | 127 (3.9%) | 225 (6.6%) |
| 45 to 49 Years | 177 (5.4%) | 232 (6.8%) |
| 50 to 54 Years | 215 (6.6%) | 256 (7.5%) |
| 55 to 59 Years | 274 (8.4%) | 197 (5.7%) |
| 60 to 64 Years | 168 (5.2%) | 249 (7.2%) |
| 65 to 69 Years | 190 (5.8%) | 250 (7.3%) |
| 70 to 74 Years | 204 (6.3%) | 373 (10.9%) |
| 75 to 79 Years | 75 (2.3%) | 107 (3.1%) |
| 80 to 84 Years | 115 (3.5%) | 148 (4.3%) |
| 85 Years and over | 52 (1.6%) | 87 (2.5%) |
| Total | 3,257 (100.0%) | 3,433 (100.0%) |
Families and Households in Belpre
Median Family Size in Belpre
The median family size in Belpre is 2.92 persons per family, with single male/father families (79 | 5.0%) accounting for the largest median family size of 3.09 persons per family. On the other hand, single female/mother families (313 | 20.0%) represent the smallest median family size with 2.75 persons per family.
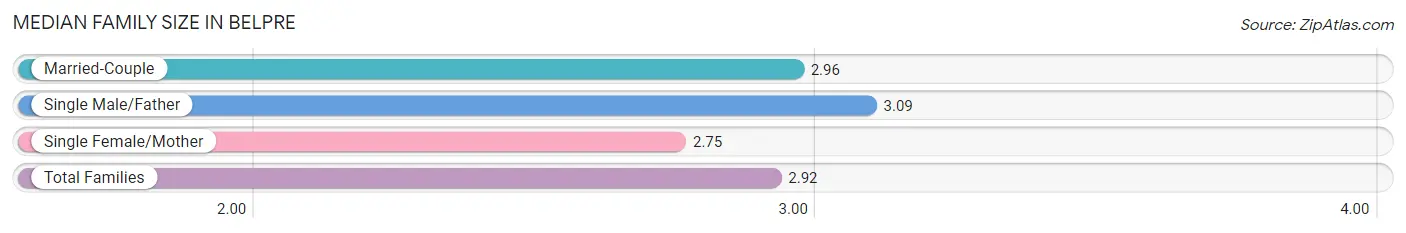
| Family Type | # Families | Family Size |
| Married-Couple | 1,176 (75.0%) | 2.96 |
| Single Male/Father | 79 (5.0%) | 3.09 |
| Single Female/Mother | 313 (20.0%) | 2.75 |
| Total Families | 1,568 (100.0%) | 2.92 |
Median Household Size in Belpre
The median household size in Belpre is 2.18 persons per household, with single male/father households (79 | 2.6%) accounting for the largest median household size of 3.58 persons per household. non-family households (1,506 | 49.0%) represent the smallest median household size with 1.32 persons per household.
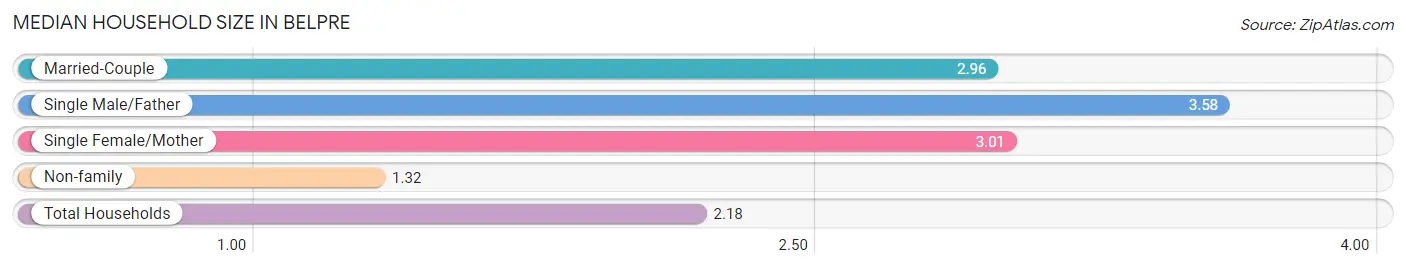
| Household Type | # Households | Household Size |
| Married-Couple | 1,176 (38.3%) | 2.96 |
| Single Male/Father | 79 (2.6%) | 3.58 |
| Single Female/Mother | 313 (10.2%) | 3.01 |
| Non-family | 1,506 (49.0%) | 1.32 |
| Total Households | 3,074 (100.0%) | 2.18 |
Household Size by Marriage Status in Belpre
Out of a total of 3,074 households in Belpre, 1,568 (51.0%) are family households, while 1,506 (49.0%) are nonfamily households. The most numerous type of family households are 2-person households, comprising 835, and the most common type of nonfamily households are 1-person households, comprising 1,182.
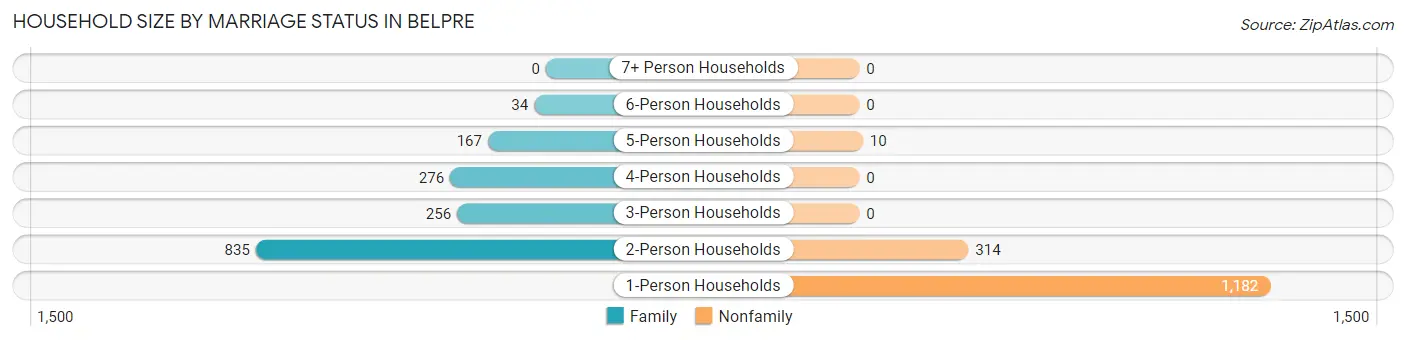
| Household Size | Family Households | Nonfamily Households |
| 1-Person Households | - | 1,182 (38.5%) |
| 2-Person Households | 835 (27.2%) | 314 (10.2%) |
| 3-Person Households | 256 (8.3%) | 0 (0.0%) |
| 4-Person Households | 276 (9.0%) | 0 (0.0%) |
| 5-Person Households | 167 (5.4%) | 10 (0.3%) |
| 6-Person Households | 34 (1.1%) | 0 (0.0%) |
| 7+ Person Households | 0 (0.0%) | 0 (0.0%) |
| Total | 1,568 (51.0%) | 1,506 (49.0%) |
Female Fertility in Belpre
Fertility by Age in Belpre
Average fertility rate in Belpre is 33.0 births per 1,000 women. Women in the age bracket of 20 to 34 years have the highest fertility rate with 79.0 births per 1,000 women. Women in the age bracket of 20 to 34 years acount for 100.0% of all women with births.
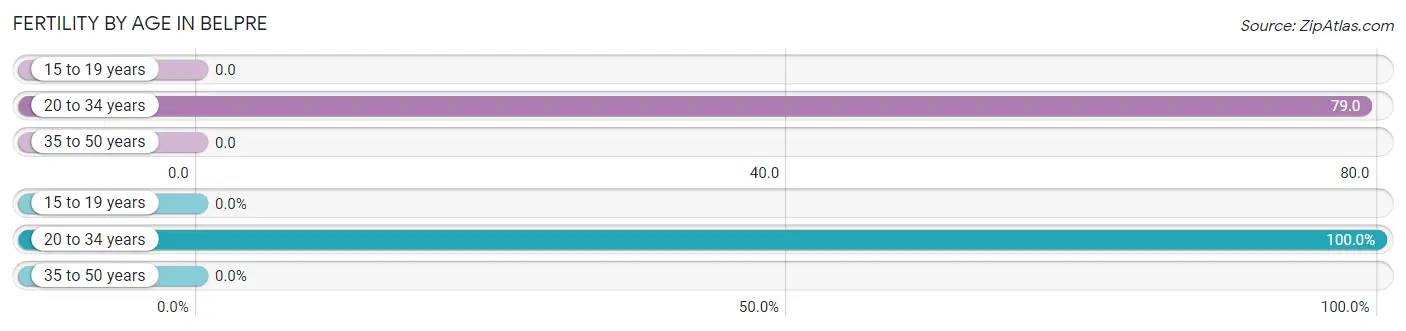
| Age Bracket | Women with Births | Births / 1,000 Women |
| 15 to 19 years | 0 (0.0%) | 0.0 |
| 20 to 34 years | 44 (100.0%) | 79.0 |
| 35 to 50 years | 0 (0.0%) | 0.0 |
| Total | 44 (100.0%) | 33.0 |
Fertility by Age by Marriage Status in Belpre
75.0% of women with births (44) in Belpre are married. The highest percentage of unmarried women with births falls into 20 to 34 years age bracket with 25.0% of them unmarried at the time of birth, while the lowest percentage of unmarried women with births belong to 20 to 34 years age bracket with 25.0% of them unmarried.
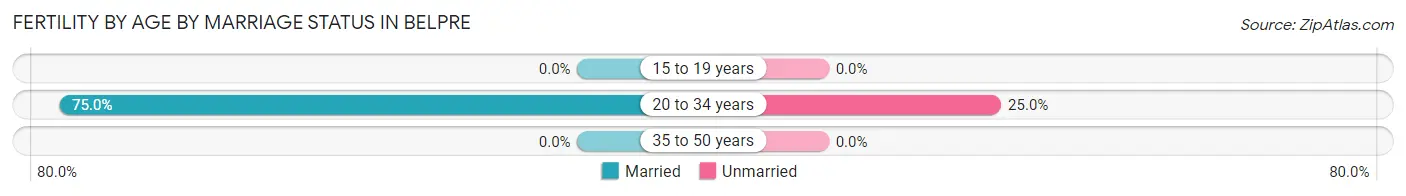
| Age Bracket | Married | Unmarried |
| 15 to 19 years | 0 (0.0%) | 0 (0.0%) |
| 20 to 34 years | 33 (75.0%) | 11 (25.0%) |
| 35 to 50 years | 0 (0.0%) | 0 (0.0%) |
| Total | 33 (75.0%) | 11 (25.0%) |
Fertility by Education in Belpre
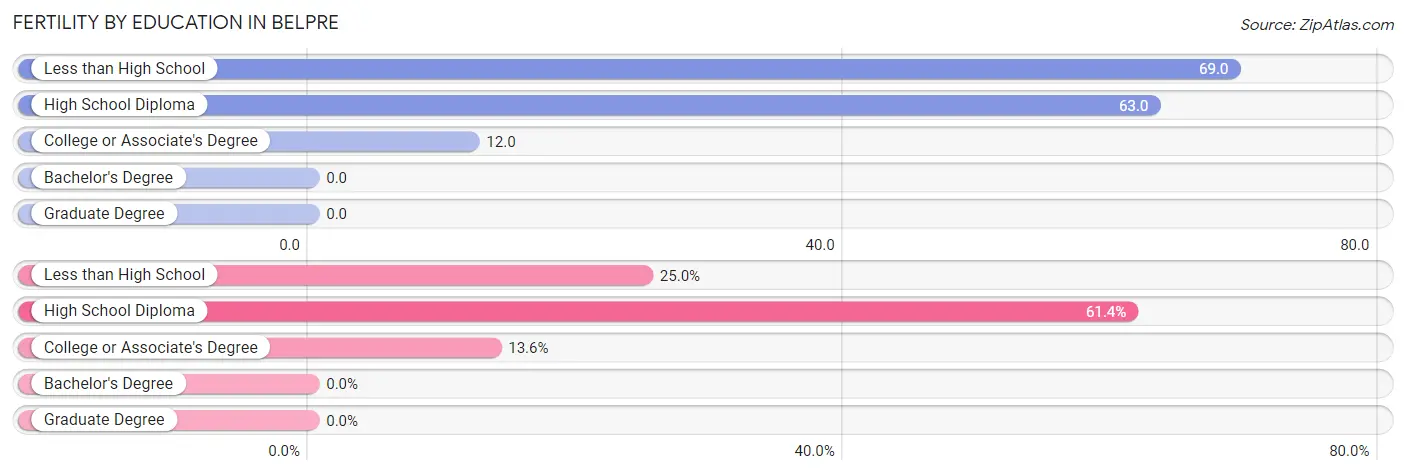
| Educational Attainment | Women with Births | Births / 1,000 Women |
| Less than High School | 11 (25.0%) | 69.0 |
| High School Diploma | 27 (61.4%) | 63.0 |
| College or Associate's Degree | 6 (13.6%) | 12.0 |
| Bachelor's Degree | 0 (0.0%) | 0.0 |
| Graduate Degree | 0 (0.0%) | 0.0 |
| Total | 44 (100.0%) | 33.0 |
Fertility by Education by Marriage Status in Belpre
25.0% of women with births in Belpre are unmarried. Women with the educational attainment of high school diploma are most likely to be married with 100.0% of them married at childbirth, while women with the educational attainment of less than high school are least likely to be married with 100.0% of them unmarried at childbirth.
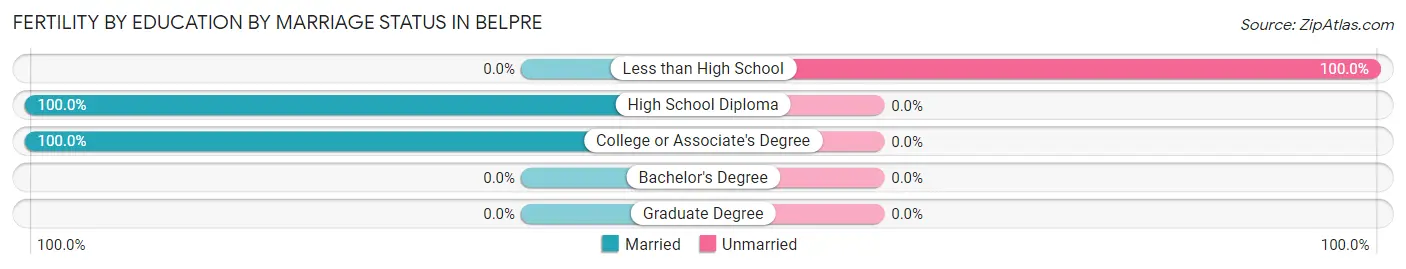
| Educational Attainment | Married | Unmarried |
| Less than High School | 0 (0.0%) | 11 (100.0%) |
| High School Diploma | 27 (100.0%) | 0 (0.0%) |
| College or Associate's Degree | 6 (100.0%) | 0 (0.0%) |
| Bachelor's Degree | 0 (0.0%) | 0 (0.0%) |
| Graduate Degree | 0 (0.0%) | 0 (0.0%) |
| Total | 33 (75.0%) | 11 (25.0%) |
Employment Characteristics in Belpre
Employment by Class of Employer in Belpre
Among the 2,921 employed individuals in Belpre, private company employees (2,052 | 70.3%), not-for-profit organizations (269 | 9.2%), and self-employed (not incorporated) (191 | 6.5%) make up the most common classes of employment.
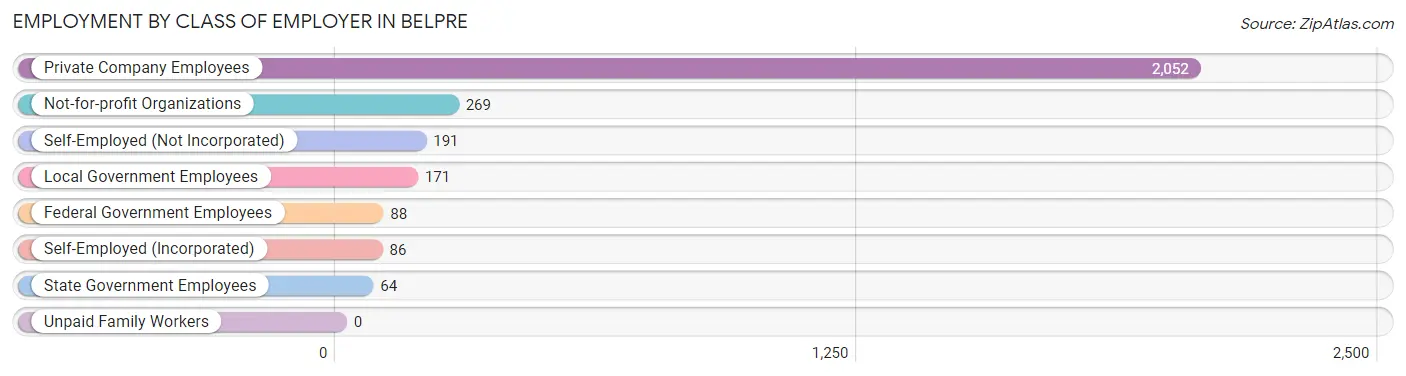
| Employer Class | # Employees | % Employees |
| Private Company Employees | 2,052 | 70.3% |
| Self-Employed (Incorporated) | 86 | 2.9% |
| Self-Employed (Not Incorporated) | 191 | 6.5% |
| Not-for-profit Organizations | 269 | 9.2% |
| Local Government Employees | 171 | 5.9% |
| State Government Employees | 64 | 2.2% |
| Federal Government Employees | 88 | 3.0% |
| Unpaid Family Workers | 0 | 0.0% |
| Total | 2,921 | 100.0% |
Employment Status by Age in Belpre
According to the labor force statistics for Belpre, out of the total population over 16 years of age (5,544), 55.8% or 3,094 individuals are in the labor force, with 3.9% or 121 of them unemployed. The age group with the highest labor force participation rate is 45 to 54 years, with 86.7% or 763 individuals in the labor force. Within the labor force, the 25 to 29 years age range has the highest percentage of unemployed individuals, with 14.3% or 54 of them being unemployed.
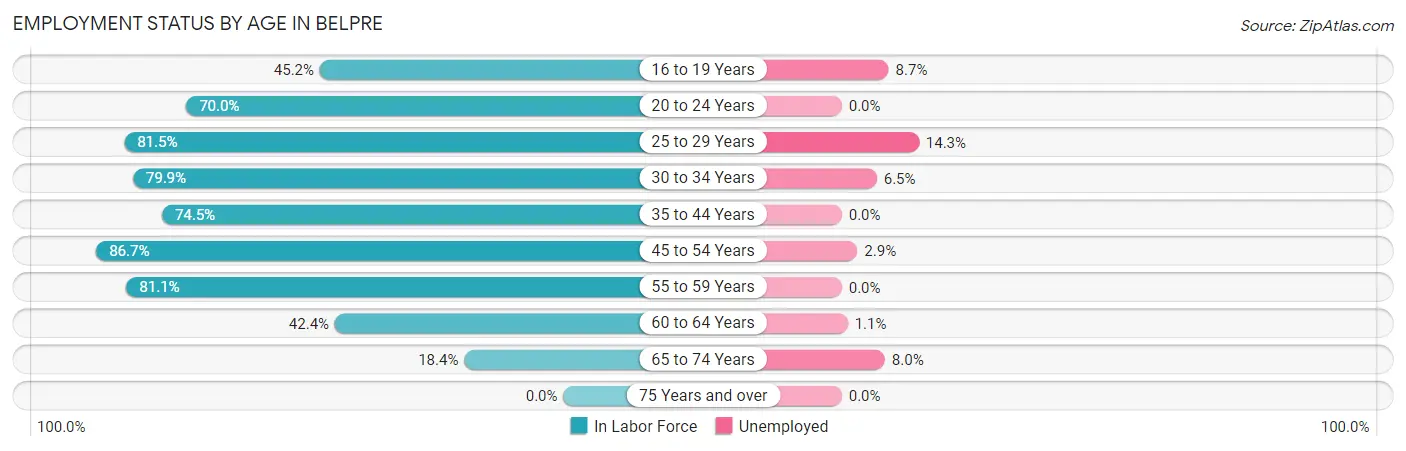
| Age Bracket | In Labor Force | Unemployed |
| 16 to 19 Years | 103 (45.2%) | 9 (8.7%) |
| 20 to 24 Years | 289 (70.0%) | 0 (0.0%) |
| 25 to 29 Years | 378 (81.5%) | 54 (14.3%) |
| 30 to 34 Years | 275 (79.9%) | 18 (6.5%) |
| 35 to 44 Years | 541 (74.5%) | 0 (0.0%) |
| 45 to 54 Years | 763 (86.7%) | 22 (2.9%) |
| 55 to 59 Years | 382 (81.1%) | 0 (0.0%) |
| 60 to 64 Years | 177 (42.4%) | 2 (1.1%) |
| 65 to 74 Years | 187 (18.4%) | 15 (8.0%) |
| 75 Years and over | 0 (0.0%) | 0 (0.0%) |
| Total | 3,094 (55.8%) | 121 (3.9%) |
Employment Status by Educational Attainment in Belpre
According to labor force statistics for Belpre, 76.2% of individuals (2,516) out of the total population between 25 and 64 years of age (3,302) are in the labor force, with 3.8% or 96 of them being unemployed. The group with the highest labor force participation rate are those with the educational attainment of bachelor's degree or higher, with 84.8% or 445 individuals in the labor force. Within the labor force, individuals with high school diploma education have the highest percentage of unemployment, with 8.9% or 87 of them being unemployed.
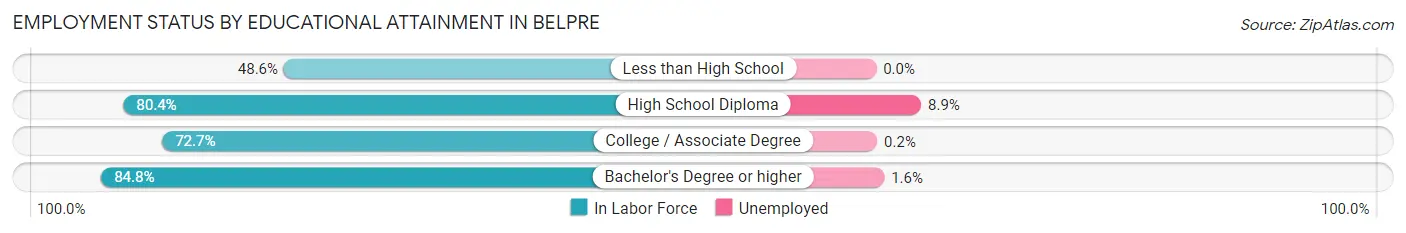
| Educational Attainment | In Labor Force | Unemployed |
| Less than High School | 84 (48.6%) | 0 (0.0%) |
| High School Diploma | 978 (80.4%) | 108 (8.9%) |
| College / Associate Degree | 1,009 (72.7%) | 3 (0.2%) |
| Bachelor's Degree or higher | 445 (84.8%) | 8 (1.6%) |
| Total | 2,516 (76.2%) | 125 (3.8%) |
Employment Occupations by Sex in Belpre
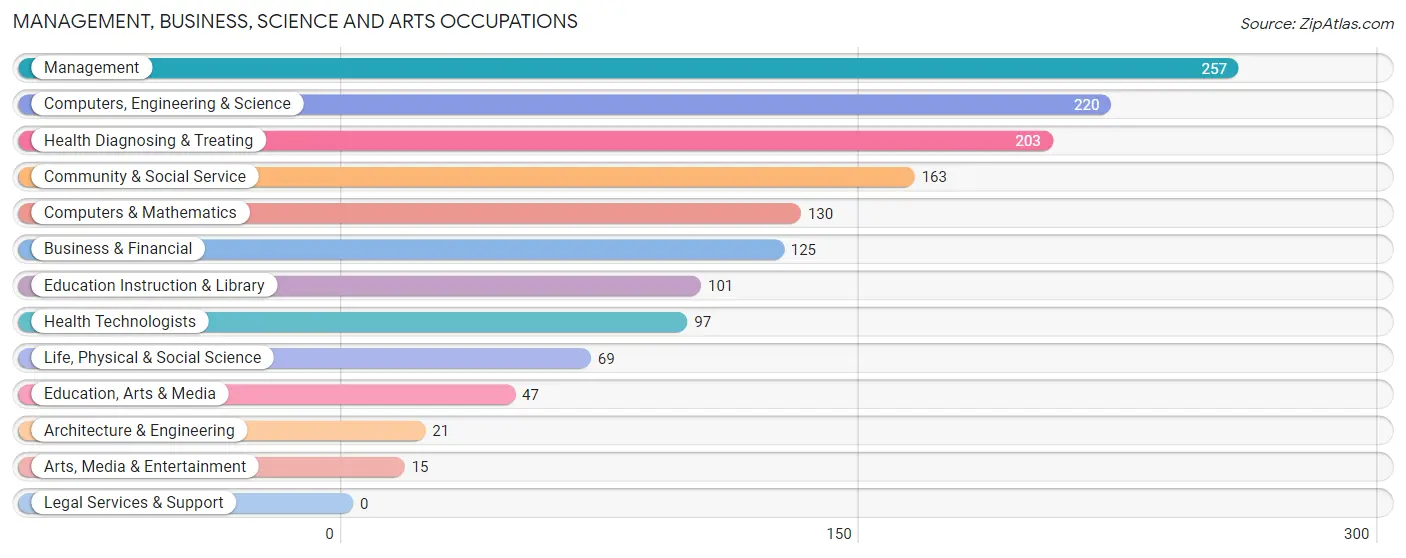
Management, Business, Science and Arts Occupations
The most common Management, Business, Science and Arts occupations in Belpre are Management (257 | 8.6%), Computers, Engineering & Science (220 | 7.4%), Health Diagnosing & Treating (203 | 6.8%), Community & Social Service (163 | 5.5%), and Computers & Mathematics (130 | 4.4%).
Management, Business, Science and Arts Occupations by Sex
Within the Management, Business, Science and Arts occupations in Belpre, the most male-oriented occupations are Architecture & Engineering (100.0%), Arts, Media & Entertainment (100.0%), and Education, Arts & Media (80.8%), while the most female-oriented occupations are Business & Financial (84.8%), Health Diagnosing & Treating (62.6%), and Life, Physical & Social Science (56.5%).

| Occupation | Male | Female |
| Management | 156 (60.7%) | 101 (39.3%) |
| Business & Financial | 19 (15.2%) | 106 (84.8%) |
| Computers, Engineering & Science | 133 (60.5%) | 87 (39.6%) |
| Computers & Mathematics | 82 (63.1%) | 48 (36.9%) |
| Architecture & Engineering | 21 (100.0%) | 0 (0.0%) |
| Life, Physical & Social Science | 30 (43.5%) | 39 (56.5%) |
| Community & Social Service | 100 (61.4%) | 63 (38.7%) |
| Education, Arts & Media | 38 (80.8%) | 9 (19.2%) |
| Legal Services & Support | 0 (0.0%) | 0 (0.0%) |
| Education Instruction & Library | 47 (46.5%) | 54 (53.5%) |
| Arts, Media & Entertainment | 15 (100.0%) | 0 (0.0%) |
| Health Diagnosing & Treating | 76 (37.4%) | 127 (62.6%) |
| Health Technologists | 45 (46.4%) | 52 (53.6%) |
| Total (Category) | 484 (50.0%) | 484 (50.0%) |
| Total (Overall) | 1,481 (49.8%) | 1,494 (50.2%) |
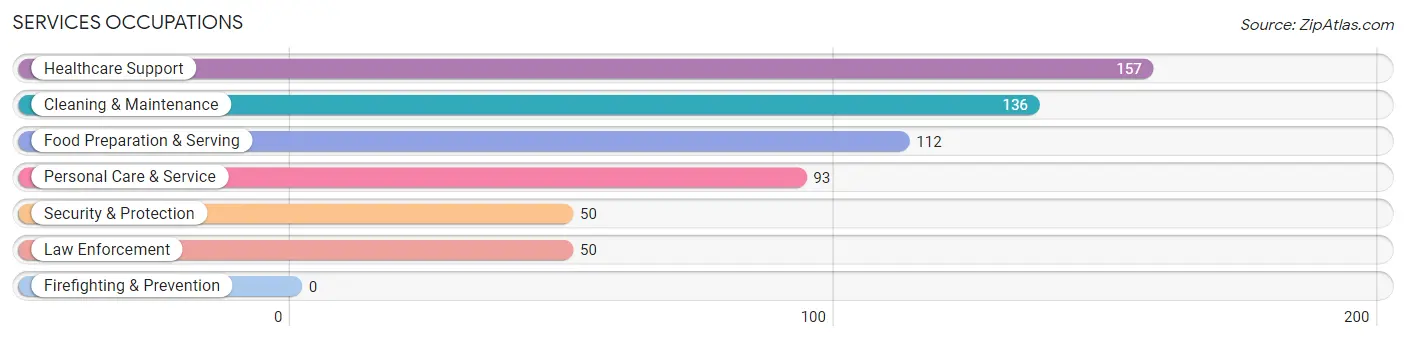
Services Occupations
The most common Services occupations in Belpre are Healthcare Support (157 | 5.3%), Cleaning & Maintenance (136 | 4.6%), Food Preparation & Serving (112 | 3.8%), Personal Care & Service (93 | 3.1%), and Security & Protection (50 | 1.7%).
Services Occupations by Sex
Within the Services occupations in Belpre, the most male-oriented occupations are Security & Protection (82.0%), Law Enforcement (82.0%), and Cleaning & Maintenance (58.1%), while the most female-oriented occupations are Personal Care & Service (86.0%), Healthcare Support (85.4%), and Food Preparation & Serving (83.9%).
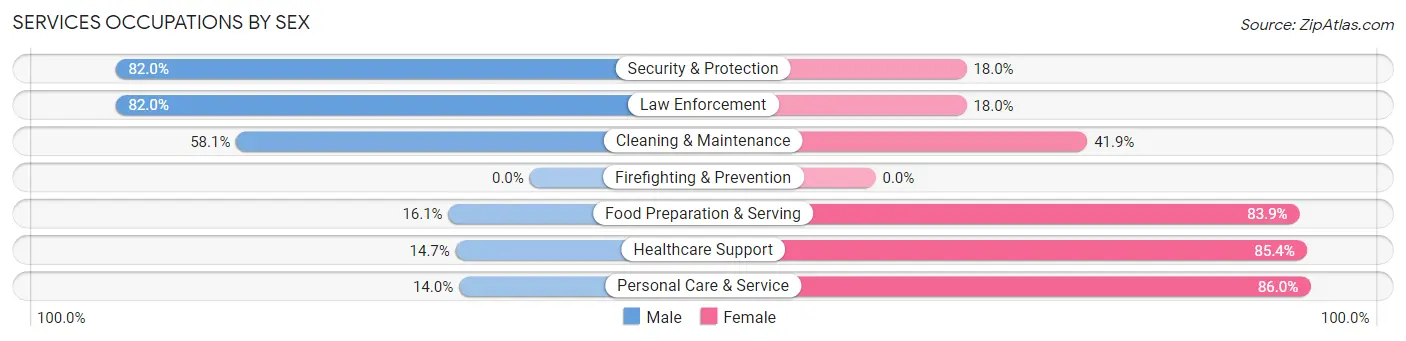
| Occupation | Male | Female |
| Healthcare Support | 23 (14.6%) | 134 (85.4%) |
| Security & Protection | 41 (82.0%) | 9 (18.0%) |
| Firefighting & Prevention | 0 (0.0%) | 0 (0.0%) |
| Law Enforcement | 41 (82.0%) | 9 (18.0%) |
| Food Preparation & Serving | 18 (16.1%) | 94 (83.9%) |
| Cleaning & Maintenance | 79 (58.1%) | 57 (41.9%) |
| Personal Care & Service | 13 (14.0%) | 80 (86.0%) |
| Total (Category) | 174 (31.8%) | 374 (68.2%) |
| Total (Overall) | 1,481 (49.8%) | 1,494 (50.2%) |
Sales and Office Occupations
The most common Sales and Office occupations in Belpre are Office & Administration (462 | 15.5%), and Sales & Related (265 | 8.9%).

Sales and Office Occupations by Sex

| Occupation | Male | Female |
| Sales & Related | 96 (36.2%) | 169 (63.8%) |
| Office & Administration | 22 (4.8%) | 440 (95.2%) |
| Total (Category) | 118 (16.2%) | 609 (83.8%) |
| Total (Overall) | 1,481 (49.8%) | 1,494 (50.2%) |
Natural Resources, Construction and Maintenance Occupations
The most common Natural Resources, Construction and Maintenance occupations in Belpre are Construction & Extraction (175 | 5.9%), and Installation, Maintenance & Repair (97 | 3.3%).
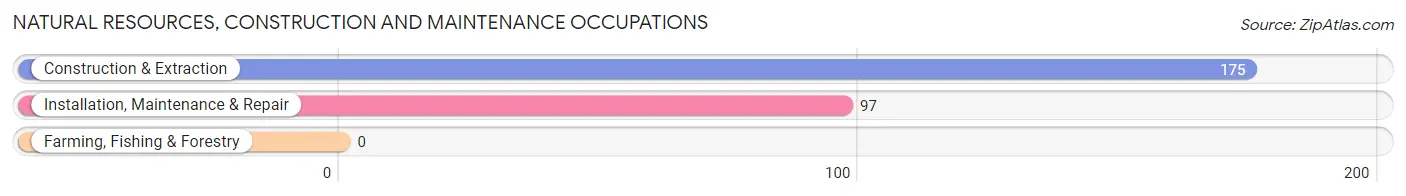
Natural Resources, Construction and Maintenance Occupations by Sex

| Occupation | Male | Female |
| Farming, Fishing & Forestry | 0 (0.0%) | 0 (0.0%) |
| Construction & Extraction | 175 (100.0%) | 0 (0.0%) |
| Installation, Maintenance & Repair | 97 (100.0%) | 0 (0.0%) |
| Total (Category) | 272 (100.0%) | 0 (0.0%) |
| Total (Overall) | 1,481 (49.8%) | 1,494 (50.2%) |
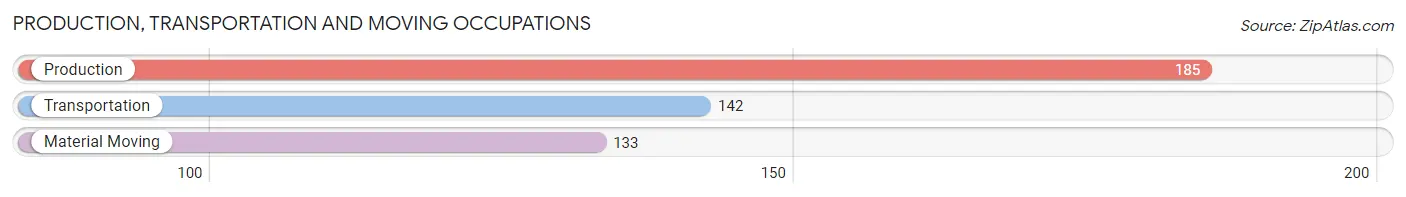
Production, Transportation and Moving Occupations
The most common Production, Transportation and Moving occupations in Belpre are Production (185 | 6.2%), Transportation (142 | 4.8%), and Material Moving (133 | 4.5%).
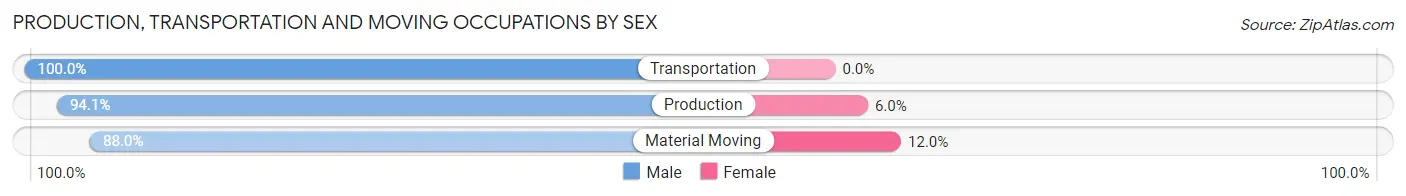
Production, Transportation and Moving Occupations by Sex
| Occupation | Male | Female |
| Production | 174 (94.1%) | 11 (5.9%) |
| Transportation | 142 (100.0%) | 0 (0.0%) |
| Material Moving | 117 (88.0%) | 16 (12.0%) |
| Total (Category) | 433 (94.1%) | 27 (5.9%) |
| Total (Overall) | 1,481 (49.8%) | 1,494 (50.2%) |
Employment Industries by Sex in Belpre
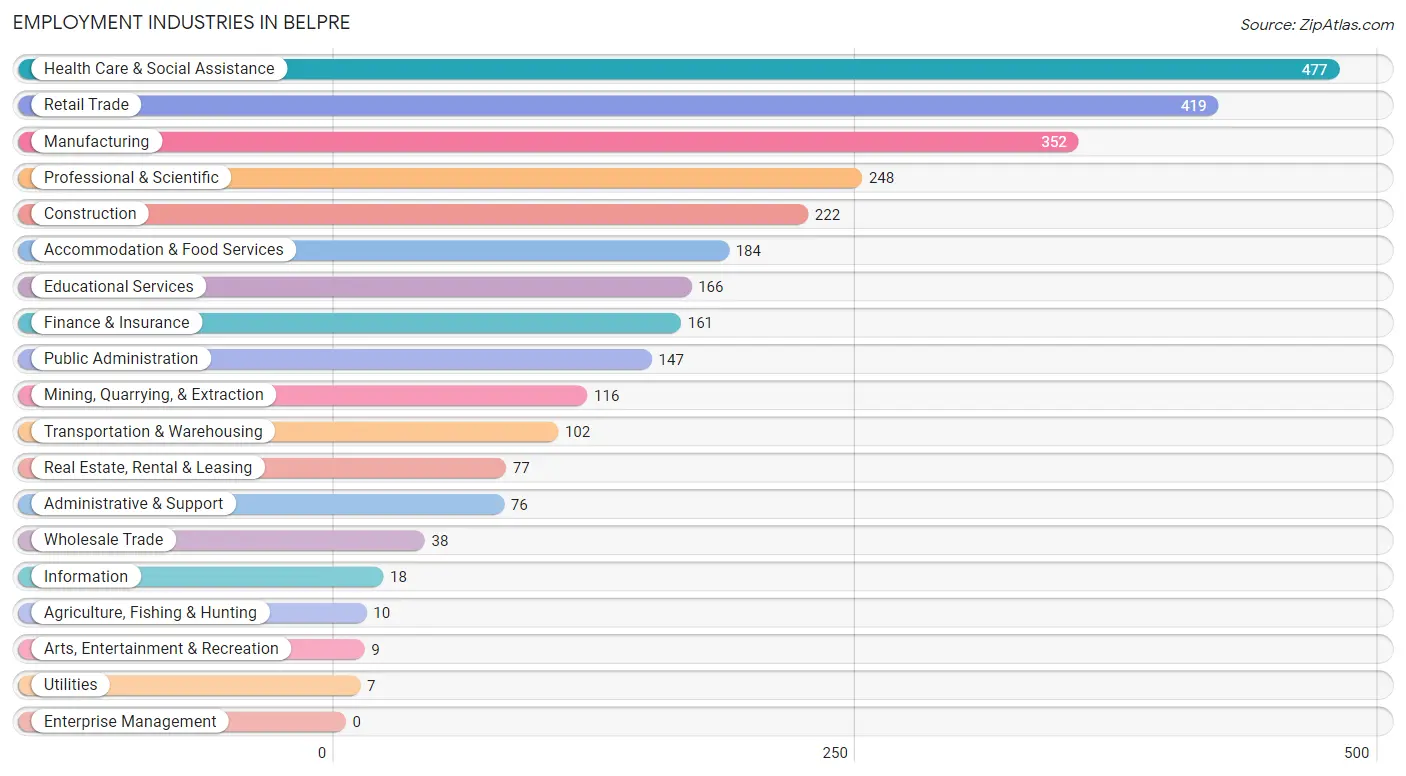
Employment Industries in Belpre
The major employment industries in Belpre include Health Care & Social Assistance (477 | 16.0%), Retail Trade (419 | 14.1%), Manufacturing (352 | 11.8%), Professional & Scientific (248 | 8.3%), and Construction (222 | 7.5%).
Employment Industries by Sex in Belpre
The Belpre industries that see more men than women are Agriculture, Fishing & Hunting (100.0%), Wholesale Trade (100.0%), and Utilities (100.0%), whereas the industries that tend to have a higher number of women are Finance & Insurance (89.4%), Real Estate, Rental & Leasing (85.7%), and Accommodation & Food Services (75.5%).
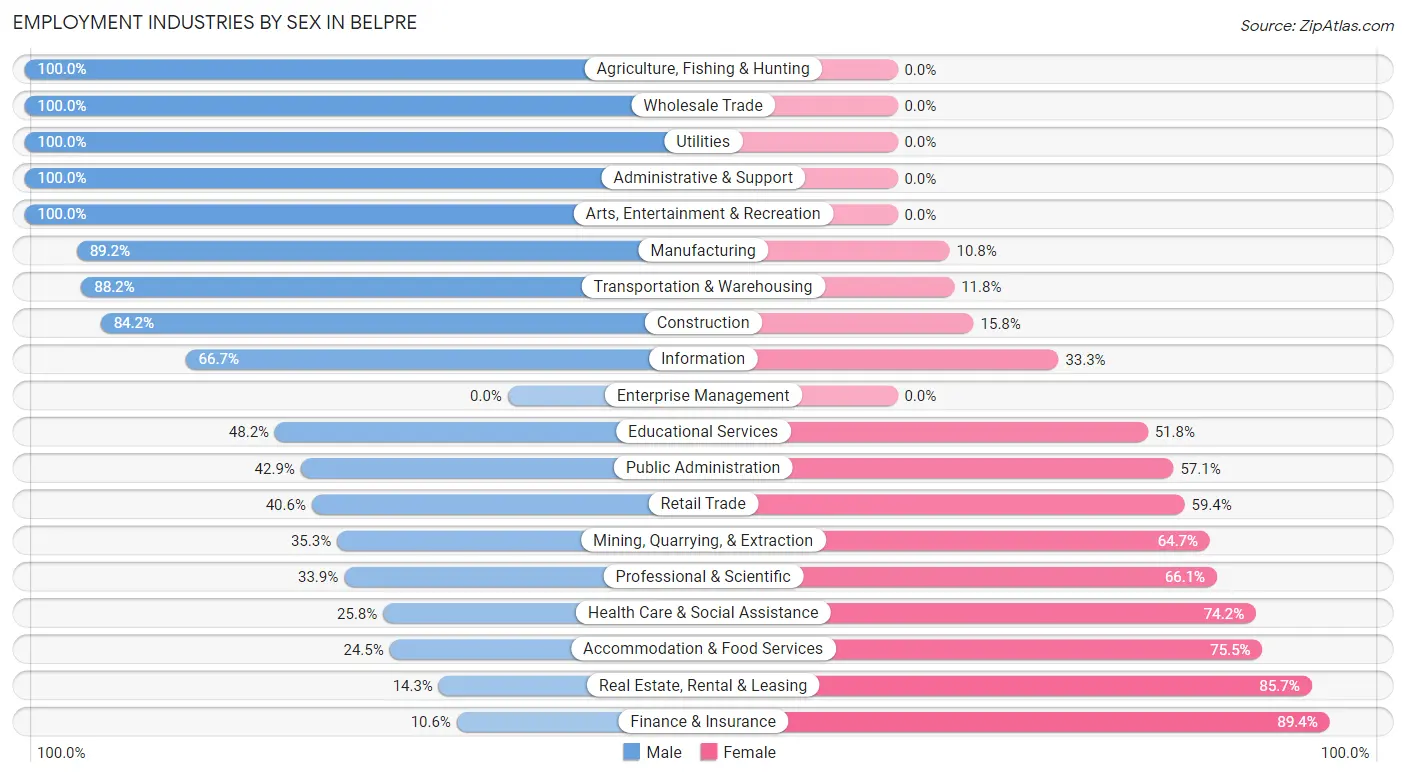
| Industry | Male | Female |
| Agriculture, Fishing & Hunting | 10 (100.0%) | 0 (0.0%) |
| Mining, Quarrying, & Extraction | 41 (35.3%) | 75 (64.7%) |
| Construction | 187 (84.2%) | 35 (15.8%) |
| Manufacturing | 314 (89.2%) | 38 (10.8%) |
| Wholesale Trade | 38 (100.0%) | 0 (0.0%) |
| Retail Trade | 170 (40.6%) | 249 (59.4%) |
| Transportation & Warehousing | 90 (88.2%) | 12 (11.8%) |
| Utilities | 7 (100.0%) | 0 (0.0%) |
| Information | 12 (66.7%) | 6 (33.3%) |
| Finance & Insurance | 17 (10.6%) | 144 (89.4%) |
| Real Estate, Rental & Leasing | 11 (14.3%) | 66 (85.7%) |
| Professional & Scientific | 84 (33.9%) | 164 (66.1%) |
| Enterprise Management | 0 (0.0%) | 0 (0.0%) |
| Administrative & Support | 76 (100.0%) | 0 (0.0%) |
| Educational Services | 80 (48.2%) | 86 (51.8%) |
| Health Care & Social Assistance | 123 (25.8%) | 354 (74.2%) |
| Arts, Entertainment & Recreation | 9 (100.0%) | 0 (0.0%) |
| Accommodation & Food Services | 45 (24.5%) | 139 (75.5%) |
| Public Administration | 63 (42.9%) | 84 (57.1%) |
| Total | 1,481 (49.8%) | 1,494 (50.2%) |
Education in Belpre
School Enrollment in Belpre
The most common levels of schooling among the 1,303 students in Belpre are high school (414 | 31.8%), middle school (317 | 24.3%), and elementary school (218 | 16.7%).
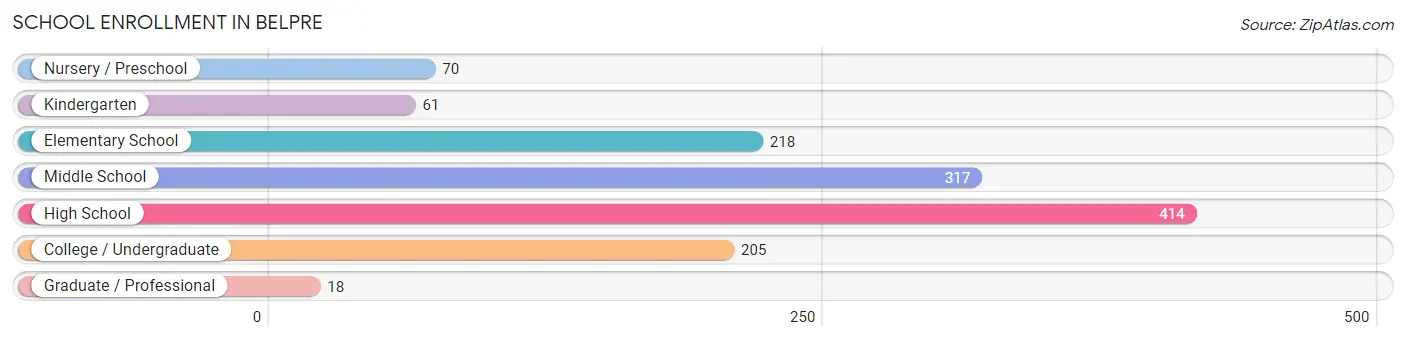
| School Level | # Students | % Students |
| Nursery / Preschool | 70 | 5.4% |
| Kindergarten | 61 | 4.7% |
| Elementary School | 218 | 16.7% |
| Middle School | 317 | 24.3% |
| High School | 414 | 31.8% |
| College / Undergraduate | 205 | 15.7% |
| Graduate / Professional | 18 | 1.4% |
| Total | 1,303 | 100.0% |
School Enrollment by Age by Funding Source in Belpre
Out of a total of 1,303 students who are enrolled in schools in Belpre, 40 (3.1%) attend a private institution, while the remaining 1,263 (96.9%) are enrolled in public schools. The age group of 3 to 4 year olds has the highest likelihood of being enrolled in private schools, with 14 (40.0% in the age bracket) enrolled. Conversely, the age group of 5 to 9 year old has the lowest likelihood of being enrolled in a private school, with 306 (100.0% in the age bracket) attending a public institution.
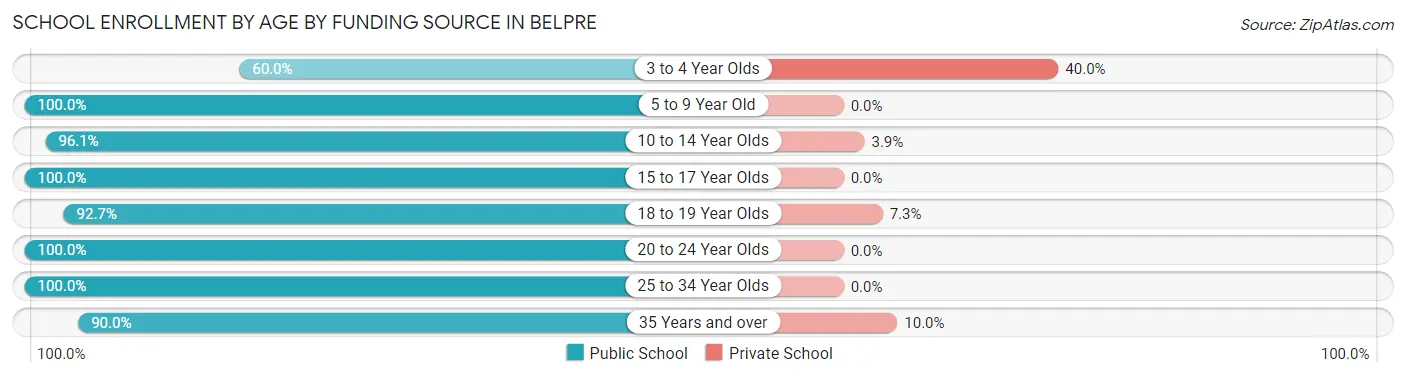
| Age Bracket | Public School | Private School |
| 3 to 4 Year Olds | 21 (60.0%) | 14 (40.0%) |
| 5 to 9 Year Old | 306 (100.0%) | 0 (0.0%) |
| 10 to 14 Year Olds | 371 (96.1%) | 15 (3.9%) |
| 15 to 17 Year Olds | 263 (100.0%) | 0 (0.0%) |
| 18 to 19 Year Olds | 51 (92.7%) | 4 (7.3%) |
| 20 to 24 Year Olds | 171 (100.0%) | 0 (0.0%) |
| 25 to 34 Year Olds | 17 (100.0%) | 0 (0.0%) |
| 35 Years and over | 63 (90.0%) | 7 (10.0%) |
| Total | 1,263 (96.9%) | 40 (3.1%) |
Educational Attainment by Field of Study in Belpre
Education (164 | 21.7%), business (161 | 21.3%), liberal arts & history (95 | 12.6%), science & technology (90 | 11.9%), and computers & mathematics (57 | 7.5%) are the most common fields of study among 756 individuals in Belpre who have obtained a bachelor's degree or higher.
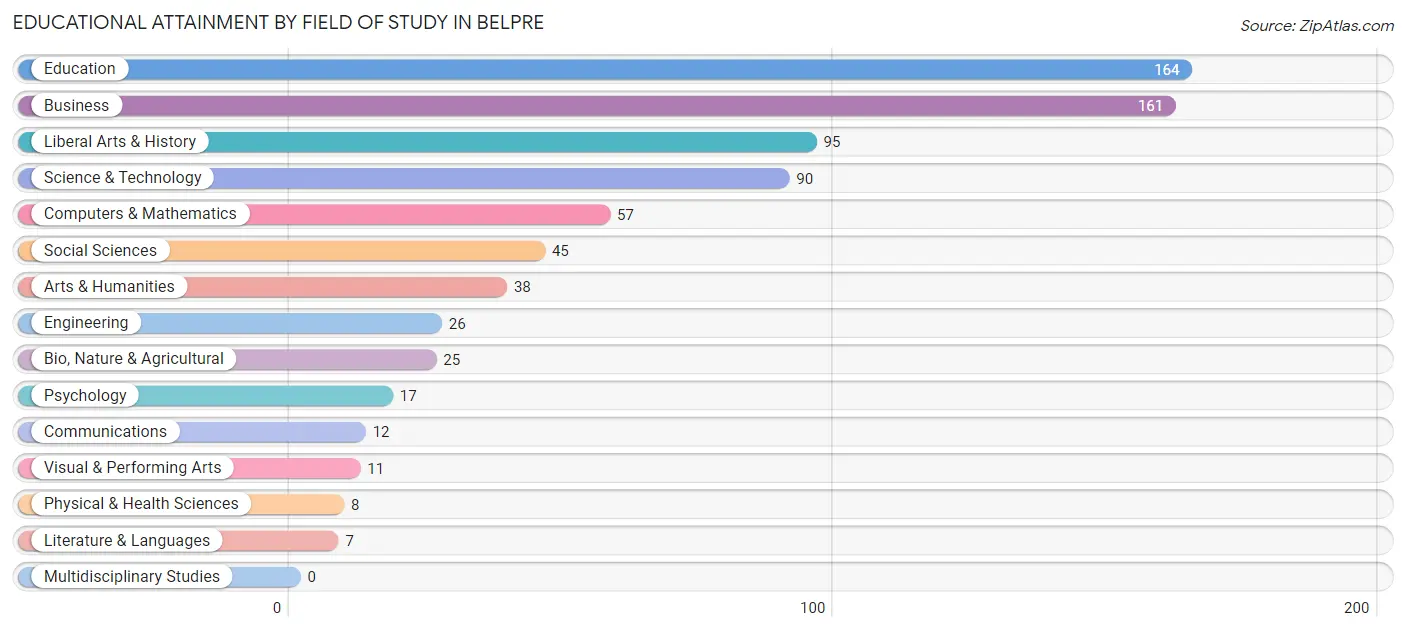
| Field of Study | # Graduates | % Graduates |
| Computers & Mathematics | 57 | 7.5% |
| Bio, Nature & Agricultural | 25 | 3.3% |
| Physical & Health Sciences | 8 | 1.1% |
| Psychology | 17 | 2.2% |
| Social Sciences | 45 | 5.9% |
| Engineering | 26 | 3.4% |
| Multidisciplinary Studies | 0 | 0.0% |
| Science & Technology | 90 | 11.9% |
| Business | 161 | 21.3% |
| Education | 164 | 21.7% |
| Literature & Languages | 7 | 0.9% |
| Liberal Arts & History | 95 | 12.6% |
| Visual & Performing Arts | 11 | 1.5% |
| Communications | 12 | 1.6% |
| Arts & Humanities | 38 | 5.0% |
| Total | 756 | 100.0% |
Transportation & Commute in Belpre
Vehicle Availability by Sex in Belpre
The most prevalent vehicle ownership categories in Belpre are males with 2 vehicles (644, accounting for 44.1%) and females with 2 vehicles (704, making up 44.1%).
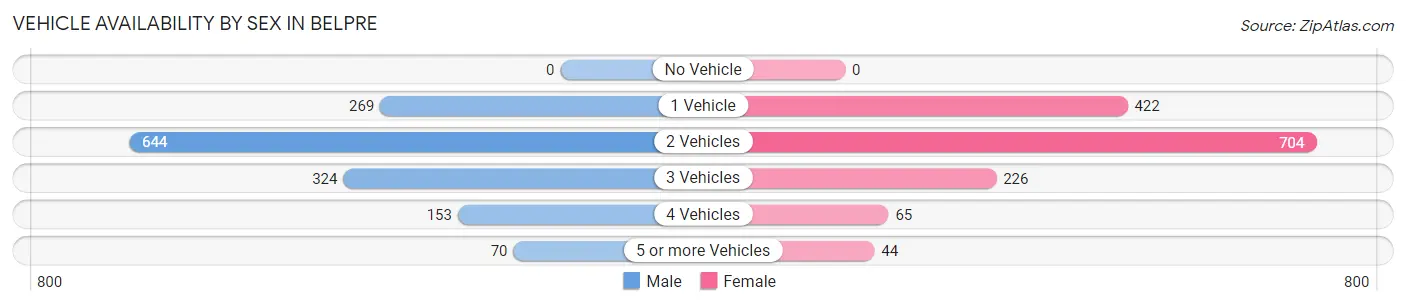
| Vehicles Available | Male | Female |
| No Vehicle | 0 (0.0%) | 0 (0.0%) |
| 1 Vehicle | 269 (18.4%) | 422 (28.9%) |
| 2 Vehicles | 644 (44.1%) | 704 (48.2%) |
| 3 Vehicles | 324 (22.2%) | 226 (15.5%) |
| 4 Vehicles | 153 (10.5%) | 65 (4.4%) |
| 5 or more Vehicles | 70 (4.8%) | 44 (3.0%) |
| Total | 1,460 (100.0%) | 1,461 (100.0%) |
Commute Time in Belpre
The most frequently occuring commute durations in Belpre are 15 to 19 minutes (647 commuters, 24.3%), 10 to 14 minutes (594 commuters, 22.3%), and 5 to 9 minutes (410 commuters, 15.4%).
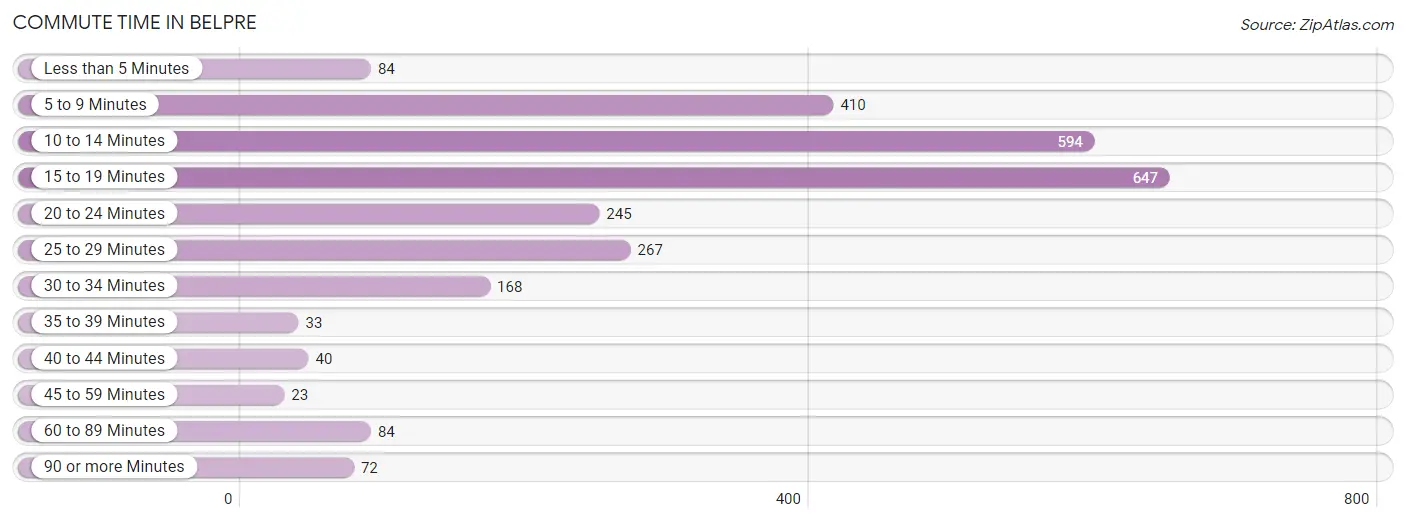
| Commute Time | # Commuters | % Commuters |
| Less than 5 Minutes | 84 | 3.2% |
| 5 to 9 Minutes | 410 | 15.4% |
| 10 to 14 Minutes | 594 | 22.3% |
| 15 to 19 Minutes | 647 | 24.3% |
| 20 to 24 Minutes | 245 | 9.2% |
| 25 to 29 Minutes | 267 | 10.0% |
| 30 to 34 Minutes | 168 | 6.3% |
| 35 to 39 Minutes | 33 | 1.2% |
| 40 to 44 Minutes | 40 | 1.5% |
| 45 to 59 Minutes | 23 | 0.9% |
| 60 to 89 Minutes | 84 | 3.2% |
| 90 or more Minutes | 72 | 2.7% |
Commute Time by Sex in Belpre
The most common commute times in Belpre are 10 to 14 minutes (309 commuters, 22.8%) for males and 15 to 19 minutes (385 commuters, 29.4%) for females.
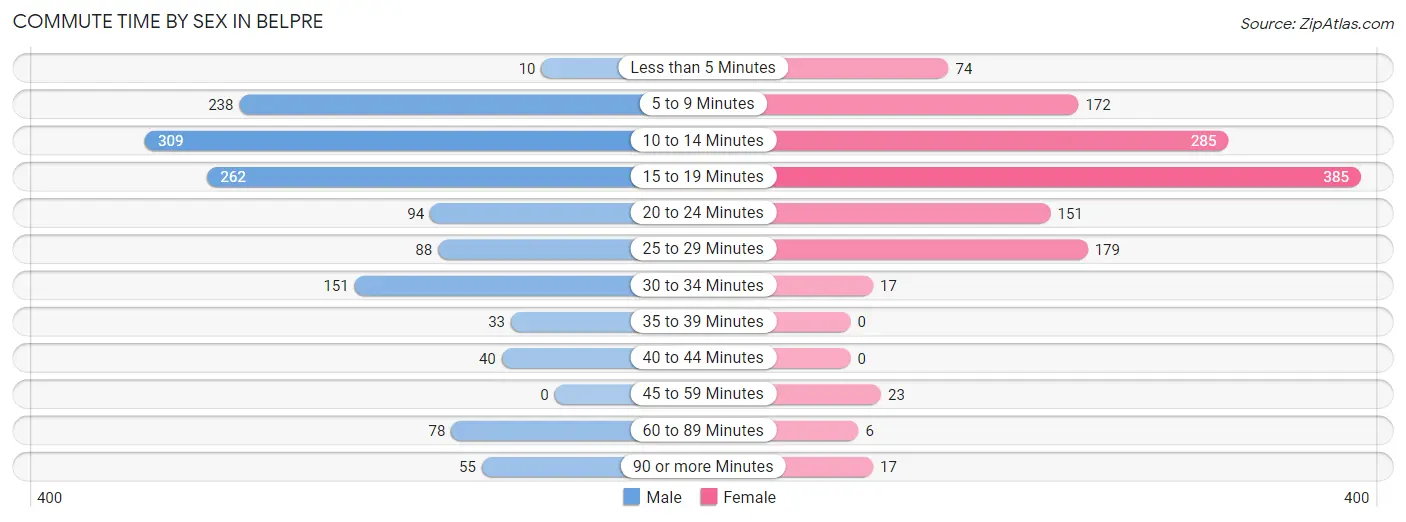
| Commute Time | Male | Female |
| Less than 5 Minutes | 10 (0.7%) | 74 (5.7%) |
| 5 to 9 Minutes | 238 (17.5%) | 172 (13.1%) |
| 10 to 14 Minutes | 309 (22.8%) | 285 (21.8%) |
| 15 to 19 Minutes | 262 (19.3%) | 385 (29.4%) |
| 20 to 24 Minutes | 94 (6.9%) | 151 (11.5%) |
| 25 to 29 Minutes | 88 (6.5%) | 179 (13.7%) |
| 30 to 34 Minutes | 151 (11.1%) | 17 (1.3%) |
| 35 to 39 Minutes | 33 (2.4%) | 0 (0.0%) |
| 40 to 44 Minutes | 40 (2.9%) | 0 (0.0%) |
| 45 to 59 Minutes | 0 (0.0%) | 23 (1.8%) |
| 60 to 89 Minutes | 78 (5.7%) | 6 (0.5%) |
| 90 or more Minutes | 55 (4.1%) | 17 (1.3%) |
Time of Departure to Work by Sex in Belpre
The most frequent times of departure to work in Belpre are 7:00 AM to 7:29 AM (220, 16.2%) for males and 6:30 AM to 6:59 AM (241, 18.4%) for females.
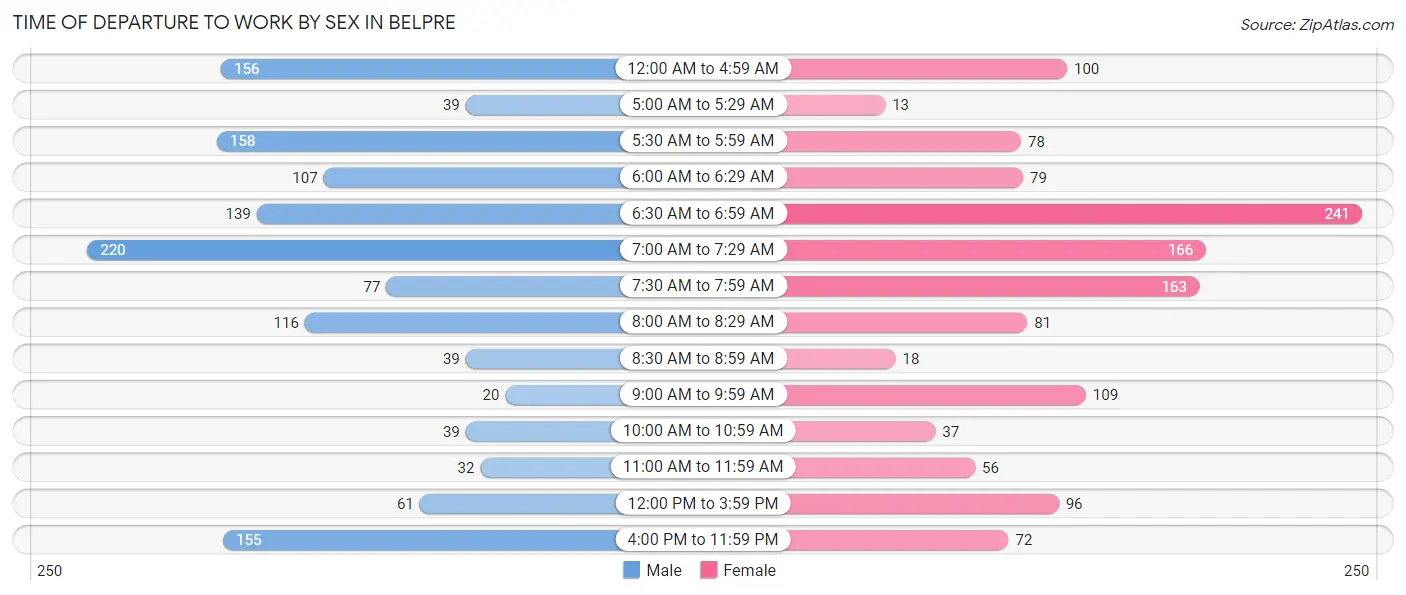
| Time of Departure | Male | Female |
| 12:00 AM to 4:59 AM | 156 (11.5%) | 100 (7.6%) |
| 5:00 AM to 5:29 AM | 39 (2.9%) | 13 (1.0%) |
| 5:30 AM to 5:59 AM | 158 (11.6%) | 78 (6.0%) |
| 6:00 AM to 6:29 AM | 107 (7.9%) | 79 (6.0%) |
| 6:30 AM to 6:59 AM | 139 (10.2%) | 241 (18.4%) |
| 7:00 AM to 7:29 AM | 220 (16.2%) | 166 (12.7%) |
| 7:30 AM to 7:59 AM | 77 (5.7%) | 163 (12.4%) |
| 8:00 AM to 8:29 AM | 116 (8.5%) | 81 (6.2%) |
| 8:30 AM to 8:59 AM | 39 (2.9%) | 18 (1.4%) |
| 9:00 AM to 9:59 AM | 20 (1.5%) | 109 (8.3%) |
| 10:00 AM to 10:59 AM | 39 (2.9%) | 37 (2.8%) |
| 11:00 AM to 11:59 AM | 32 (2.4%) | 56 (4.3%) |
| 12:00 PM to 3:59 PM | 61 (4.5%) | 96 (7.3%) |
| 4:00 PM to 11:59 PM | 155 (11.4%) | 72 (5.5%) |
| Total | 1,358 (100.0%) | 1,309 (100.0%) |
Housing Occupancy in Belpre
Occupancy by Ownership in Belpre
Of the total 3,074 dwellings in Belpre, owner-occupied units account for 1,834 (59.7%), while renter-occupied units make up 1,240 (40.3%).
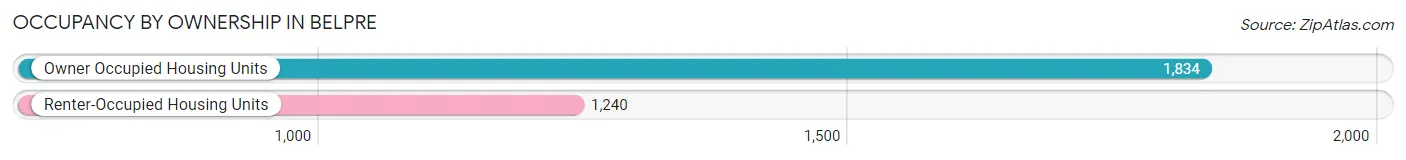
| Occupancy | # Housing Units | % Housing Units |
| Owner Occupied Housing Units | 1,834 | 59.7% |
| Renter-Occupied Housing Units | 1,240 | 40.3% |
| Total Occupied Housing Units | 3,074 | 100.0% |
Occupancy by Household Size in Belpre
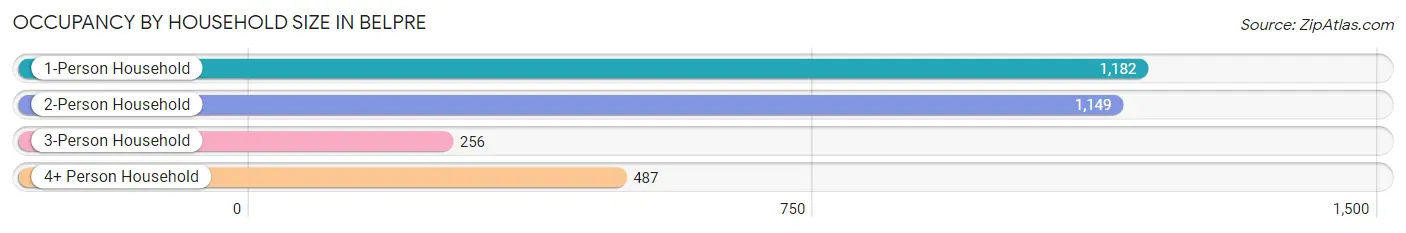
| Household Size | # Housing Units | % Housing Units |
| 1-Person Household | 1,182 | 38.5% |
| 2-Person Household | 1,149 | 37.4% |
| 3-Person Household | 256 | 8.3% |
| 4+ Person Household | 487 | 15.8% |
| Total Housing Units | 3,074 | 100.0% |
Occupancy by Ownership by Household Size in Belpre
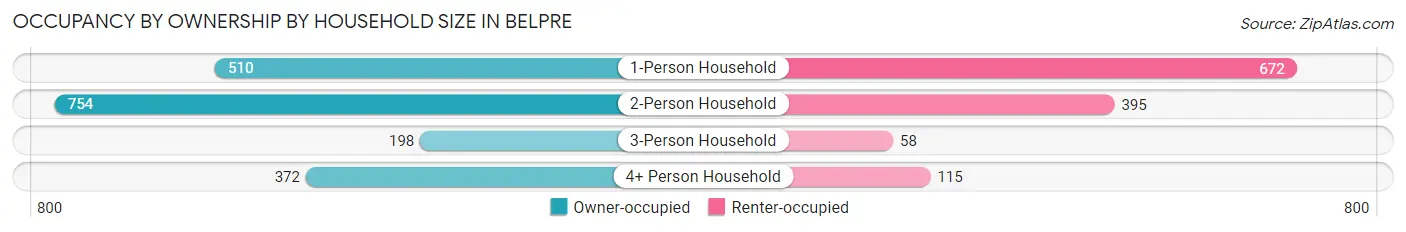
| Household Size | Owner-occupied | Renter-occupied |
| 1-Person Household | 510 (43.1%) | 672 (56.9%) |
| 2-Person Household | 754 (65.6%) | 395 (34.4%) |
| 3-Person Household | 198 (77.3%) | 58 (22.7%) |
| 4+ Person Household | 372 (76.4%) | 115 (23.6%) |
| Total Housing Units | 1,834 (59.7%) | 1,240 (40.3%) |
Occupancy by Educational Attainment in Belpre
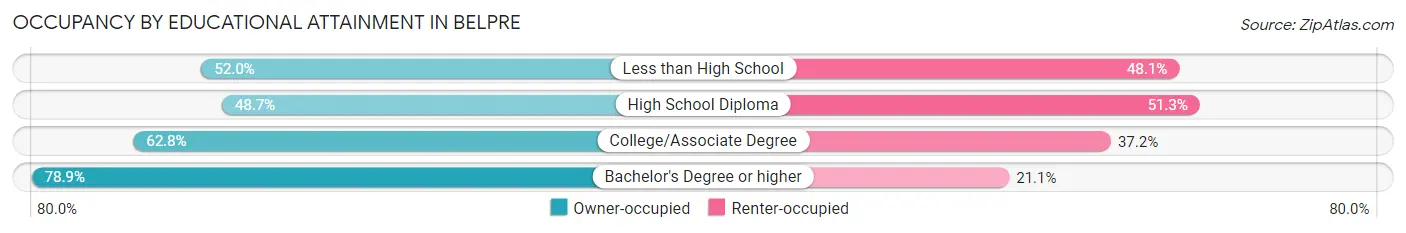
| Household Size | Owner-occupied | Renter-occupied |
| Less than High School | 120 (51.9%) | 111 (48.0%) |
| High School Diploma | 502 (48.7%) | 529 (51.3%) |
| College/Associate Degree | 846 (62.8%) | 502 (37.2%) |
| Bachelor's Degree or higher | 366 (78.9%) | 98 (21.1%) |
Occupancy by Age of Householder in Belpre
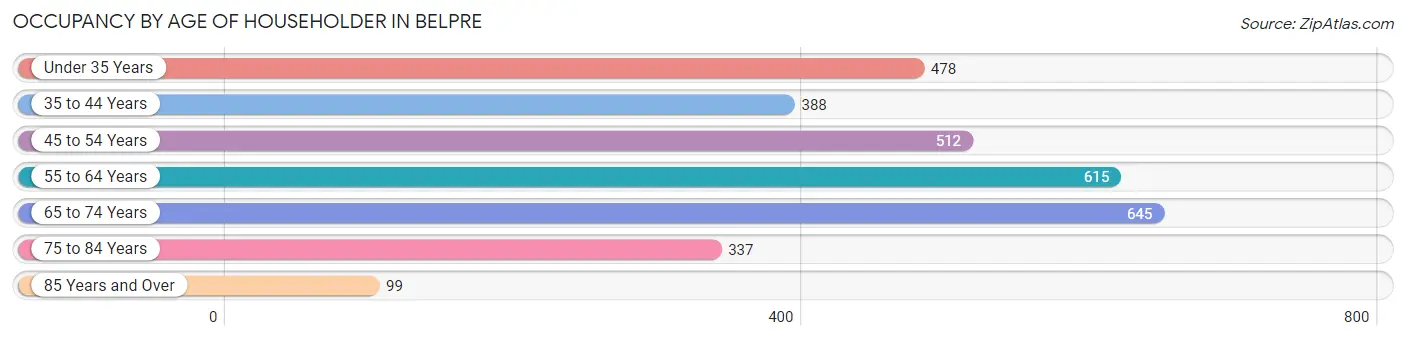
| Age Bracket | # Households | % Households |
| Under 35 Years | 478 | 15.5% |
| 35 to 44 Years | 388 | 12.6% |
| 45 to 54 Years | 512 | 16.7% |
| 55 to 64 Years | 615 | 20.0% |
| 65 to 74 Years | 645 | 21.0% |
| 75 to 84 Years | 337 | 11.0% |
| 85 Years and Over | 99 | 3.2% |
| Total | 3,074 | 100.0% |
Housing Finances in Belpre
Median Income by Occupancy in Belpre
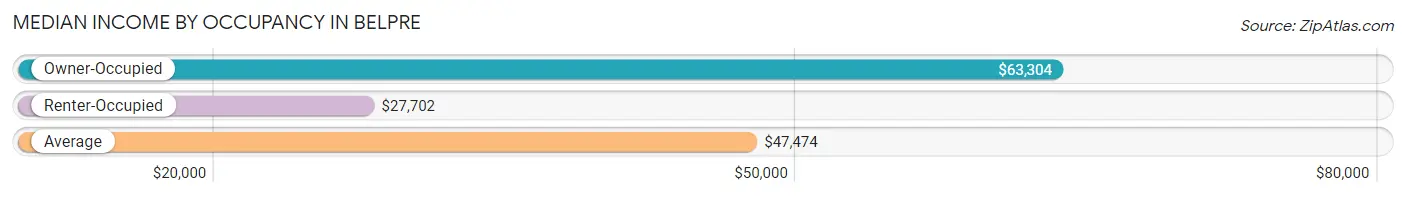
| Occupancy Type | # Households | Median Income |
| Owner-Occupied | 1,834 (59.7%) | $63,304 |
| Renter-Occupied | 1,240 (40.3%) | $27,702 |
| Average | 3,074 (100.0%) | $47,474 |
Occupancy by Householder Income Bracket in Belpre
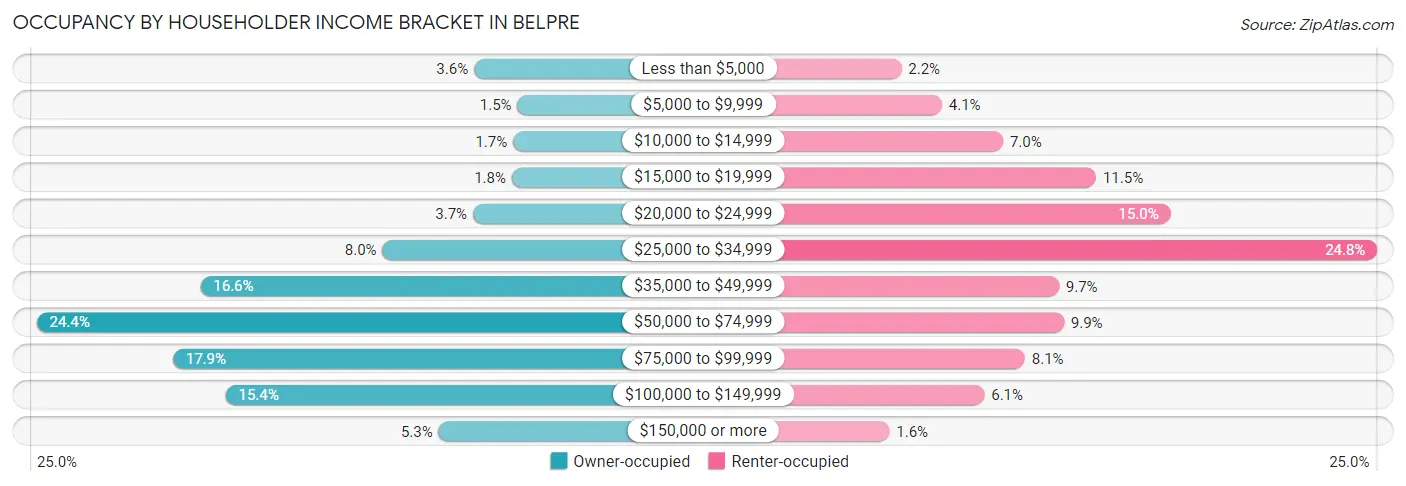
| Income Bracket | Owner-occupied | Renter-occupied |
| Less than $5,000 | 66 (3.6%) | 27 (2.2%) |
| $5,000 to $9,999 | 28 (1.5%) | 51 (4.1%) |
| $10,000 to $14,999 | 32 (1.7%) | 87 (7.0%) |
| $15,000 to $19,999 | 33 (1.8%) | 142 (11.5%) |
| $20,000 to $24,999 | 67 (3.6%) | 186 (15.0%) |
| $25,000 to $34,999 | 146 (8.0%) | 308 (24.8%) |
| $35,000 to $49,999 | 305 (16.6%) | 120 (9.7%) |
| $50,000 to $74,999 | 448 (24.4%) | 123 (9.9%) |
| $75,000 to $99,999 | 329 (17.9%) | 100 (8.1%) |
| $100,000 to $149,999 | 283 (15.4%) | 76 (6.1%) |
| $150,000 or more | 97 (5.3%) | 20 (1.6%) |
| Total | 1,834 (100.0%) | 1,240 (100.0%) |
Monthly Housing Cost Tiers in Belpre
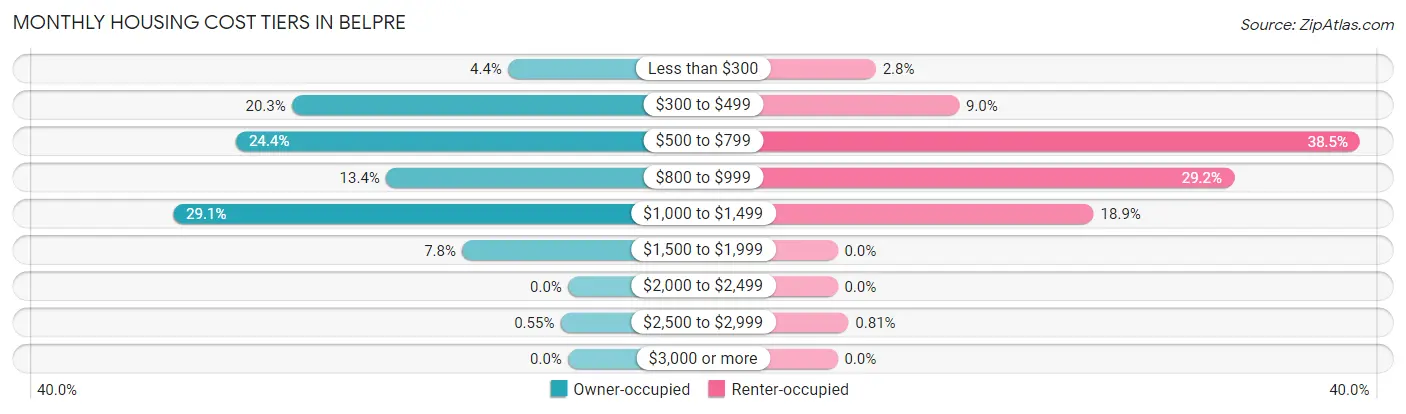
| Monthly Cost | Owner-occupied | Renter-occupied |
| Less than $300 | 81 (4.4%) | 35 (2.8%) |
| $300 to $499 | 373 (20.3%) | 111 (8.9%) |
| $500 to $799 | 448 (24.4%) | 477 (38.5%) |
| $800 to $999 | 246 (13.4%) | 362 (29.2%) |
| $1,000 to $1,499 | 533 (29.1%) | 234 (18.9%) |
| $1,500 to $1,999 | 143 (7.8%) | 0 (0.0%) |
| $2,000 to $2,499 | 0 (0.0%) | 0 (0.0%) |
| $2,500 to $2,999 | 10 (0.5%) | 10 (0.8%) |
| $3,000 or more | 0 (0.0%) | 0 (0.0%) |
| Total | 1,834 (100.0%) | 1,240 (100.0%) |
Physical Housing Characteristics in Belpre
Housing Structures in Belpre
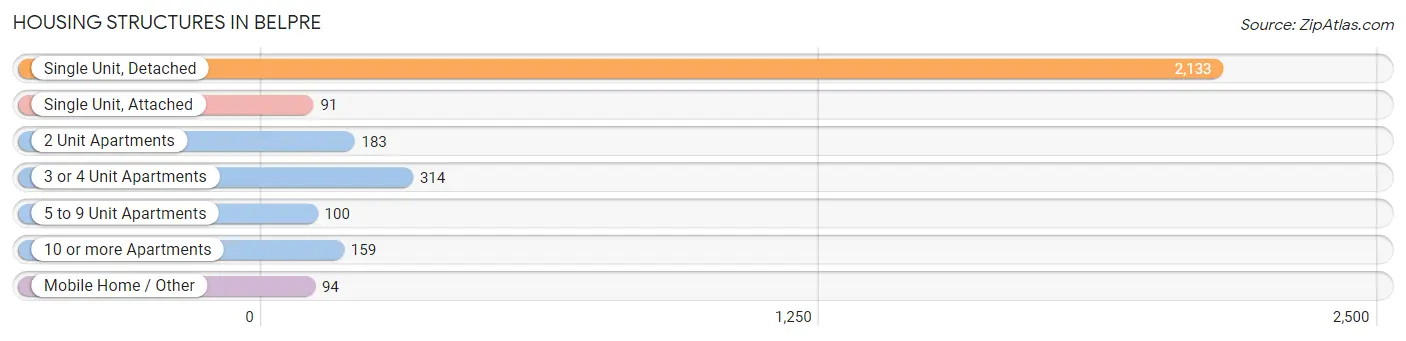
| Structure Type | # Housing Units | % Housing Units |
| Single Unit, Detached | 2,133 | 69.4% |
| Single Unit, Attached | 91 | 3.0% |
| 2 Unit Apartments | 183 | 5.9% |
| 3 or 4 Unit Apartments | 314 | 10.2% |
| 5 to 9 Unit Apartments | 100 | 3.3% |
| 10 or more Apartments | 159 | 5.2% |
| Mobile Home / Other | 94 | 3.1% |
| Total | 3,074 | 100.0% |
Housing Structures by Occupancy in Belpre
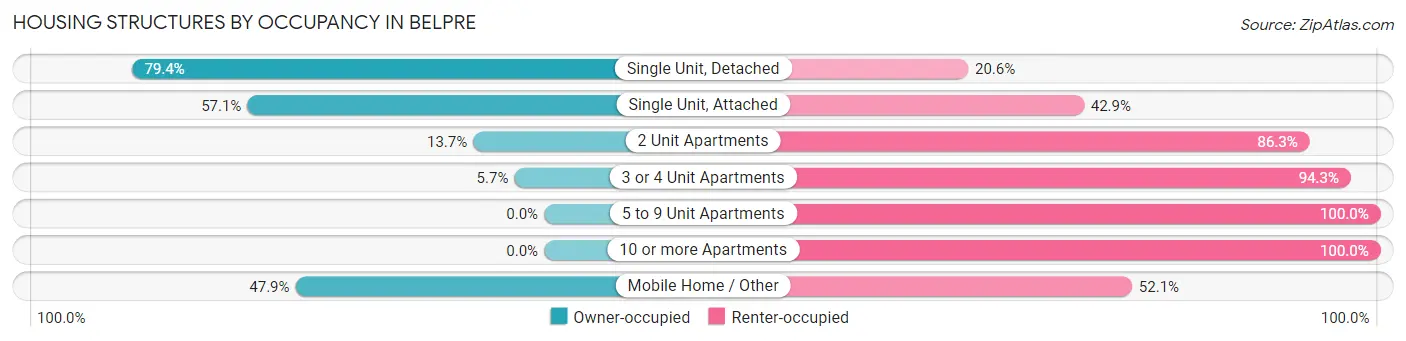
| Structure Type | Owner-occupied | Renter-occupied |
| Single Unit, Detached | 1,694 (79.4%) | 439 (20.6%) |
| Single Unit, Attached | 52 (57.1%) | 39 (42.9%) |
| 2 Unit Apartments | 25 (13.7%) | 158 (86.3%) |
| 3 or 4 Unit Apartments | 18 (5.7%) | 296 (94.3%) |
| 5 to 9 Unit Apartments | 0 (0.0%) | 100 (100.0%) |
| 10 or more Apartments | 0 (0.0%) | 159 (100.0%) |
| Mobile Home / Other | 45 (47.9%) | 49 (52.1%) |
| Total | 1,834 (59.7%) | 1,240 (40.3%) |
Housing Structures by Number of Rooms in Belpre
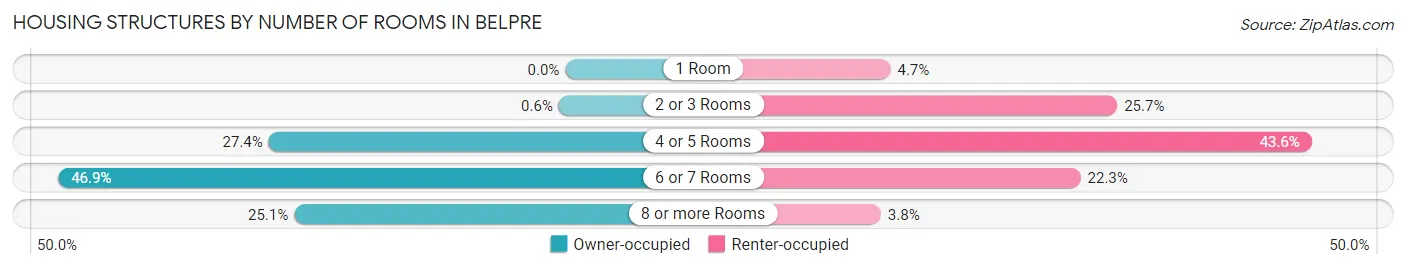
| Number of Rooms | Owner-occupied | Renter-occupied |
| 1 Room | 0 (0.0%) | 58 (4.7%) |
| 2 or 3 Rooms | 11 (0.6%) | 318 (25.7%) |
| 4 or 5 Rooms | 503 (27.4%) | 541 (43.6%) |
| 6 or 7 Rooms | 860 (46.9%) | 276 (22.3%) |
| 8 or more Rooms | 460 (25.1%) | 47 (3.8%) |
| Total | 1,834 (100.0%) | 1,240 (100.0%) |
Housing Structure by Heating Type in Belpre
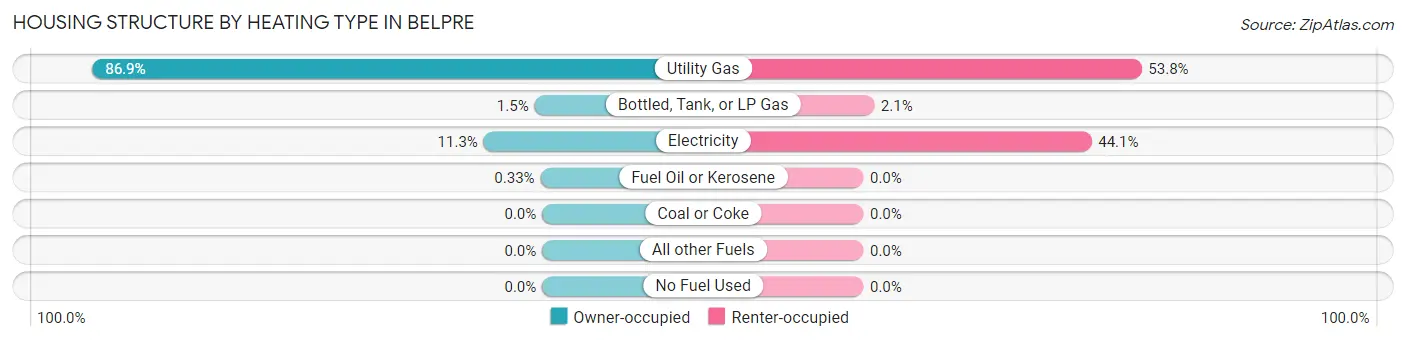
| Heating Type | Owner-occupied | Renter-occupied |
| Utility Gas | 1,594 (86.9%) | 667 (53.8%) |
| Bottled, Tank, or LP Gas | 27 (1.5%) | 26 (2.1%) |
| Electricity | 207 (11.3%) | 547 (44.1%) |
| Fuel Oil or Kerosene | 6 (0.3%) | 0 (0.0%) |
| Coal or Coke | 0 (0.0%) | 0 (0.0%) |
| All other Fuels | 0 (0.0%) | 0 (0.0%) |
| No Fuel Used | 0 (0.0%) | 0 (0.0%) |
| Total | 1,834 (100.0%) | 1,240 (100.0%) |
Household Vehicle Usage in Belpre
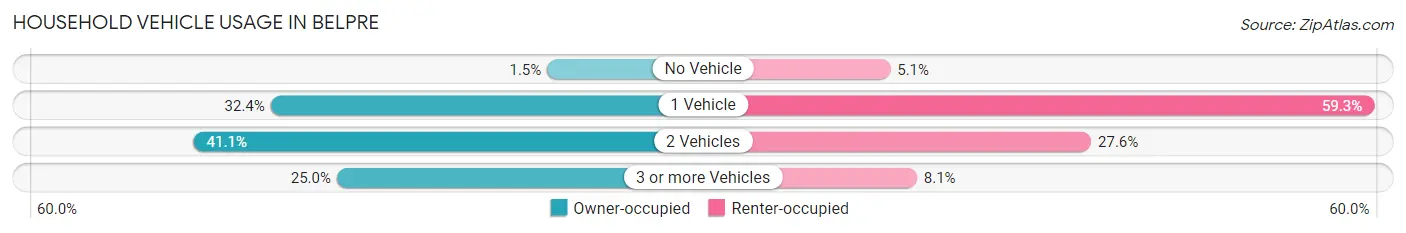
| Vehicles per Household | Owner-occupied | Renter-occupied |
| No Vehicle | 27 (1.5%) | 63 (5.1%) |
| 1 Vehicle | 595 (32.4%) | 735 (59.3%) |
| 2 Vehicles | 753 (41.1%) | 342 (27.6%) |
| 3 or more Vehicles | 459 (25.0%) | 100 (8.1%) |
| Total | 1,834 (100.0%) | 1,240 (100.0%) |
Real Estate & Mortgages in Belpre
Real Estate and Mortgage Overview in Belpre
| Characteristic | Without Mortgage | With Mortgage |
| Housing Units | 772 | 1,062 |
| Median Property Value | $156,500 | $130,400 |
| Median Household Income | $57,895 | $88 |
| Monthly Housing Costs | $474 | $0 |
| Real Estate Taxes | $1,576 | $24 |
Property Value by Mortgage Status in Belpre
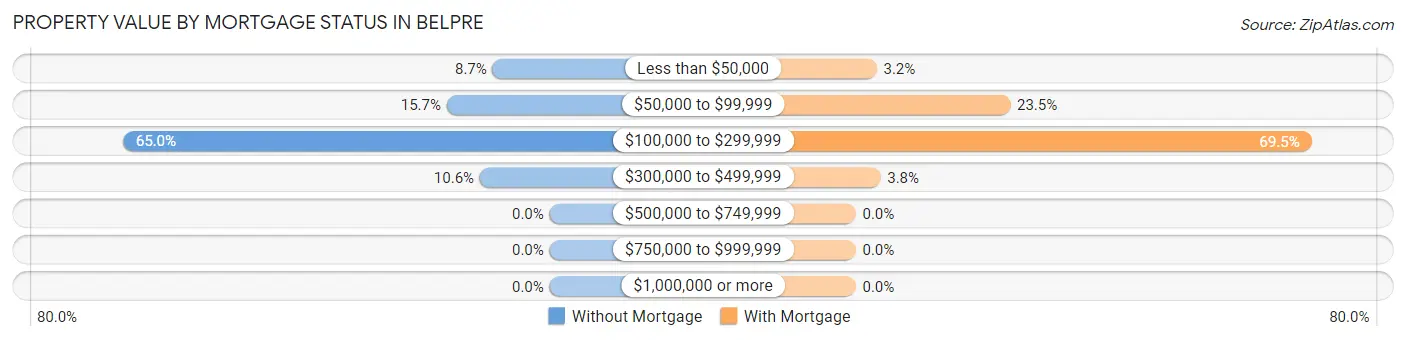
| Property Value | Without Mortgage | With Mortgage |
| Less than $50,000 | 67 (8.7%) | 34 (3.2%) |
| $50,000 to $99,999 | 121 (15.7%) | 250 (23.5%) |
| $100,000 to $299,999 | 502 (65.0%) | 738 (69.5%) |
| $300,000 to $499,999 | 82 (10.6%) | 40 (3.8%) |
| $500,000 to $749,999 | 0 (0.0%) | 0 (0.0%) |
| $750,000 to $999,999 | 0 (0.0%) | 0 (0.0%) |
| $1,000,000 or more | 0 (0.0%) | 0 (0.0%) |
| Total | 772 (100.0%) | 1,062 (100.0%) |
Household Income by Mortgage Status in Belpre
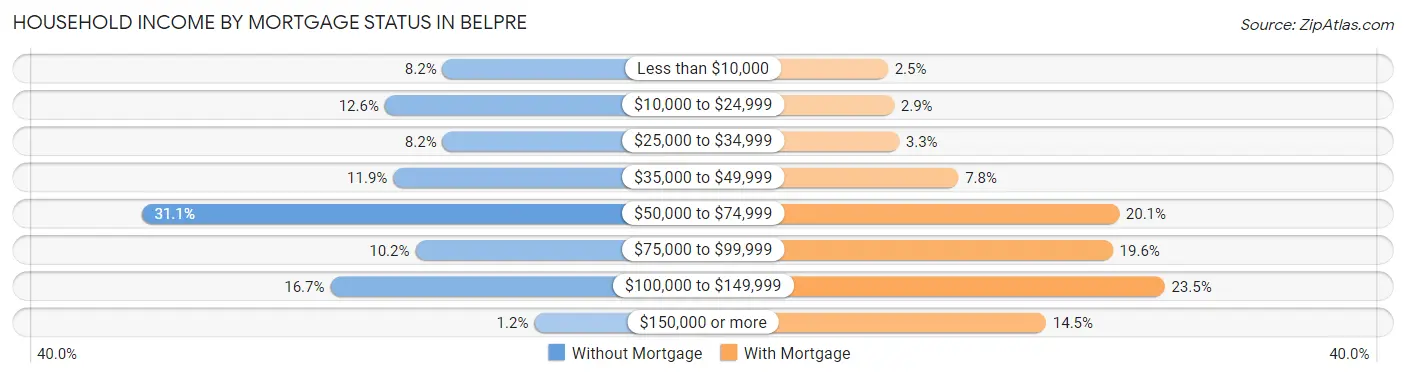
| Household Income | Without Mortgage | With Mortgage |
| Less than $10,000 | 63 (8.2%) | 26 (2.5%) |
| $10,000 to $24,999 | 97 (12.6%) | 31 (2.9%) |
| $25,000 to $34,999 | 63 (8.2%) | 35 (3.3%) |
| $35,000 to $49,999 | 92 (11.9%) | 83 (7.8%) |
| $50,000 to $74,999 | 240 (31.1%) | 213 (20.1%) |
| $75,000 to $99,999 | 79 (10.2%) | 208 (19.6%) |
| $100,000 to $149,999 | 129 (16.7%) | 250 (23.5%) |
| $150,000 or more | 9 (1.2%) | 154 (14.5%) |
| Total | 772 (100.0%) | 1,062 (100.0%) |
Property Value to Household Income Ratio in Belpre
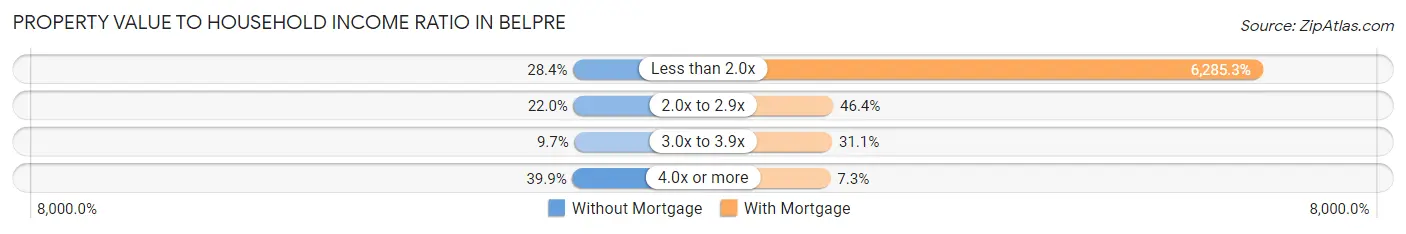
| Value-to-Income Ratio | Without Mortgage | With Mortgage |
| Less than 2.0x | 219 (28.4%) | 66,750 (6,285.3%) |
| 2.0x to 2.9x | 170 (22.0%) | 493 (46.4%) |
| 3.0x to 3.9x | 75 (9.7%) | 330 (31.1%) |
| 4.0x or more | 308 (39.9%) | 78 (7.3%) |
| Total | 772 (100.0%) | 1,062 (100.0%) |
Real Estate Taxes by Mortgage Status in Belpre
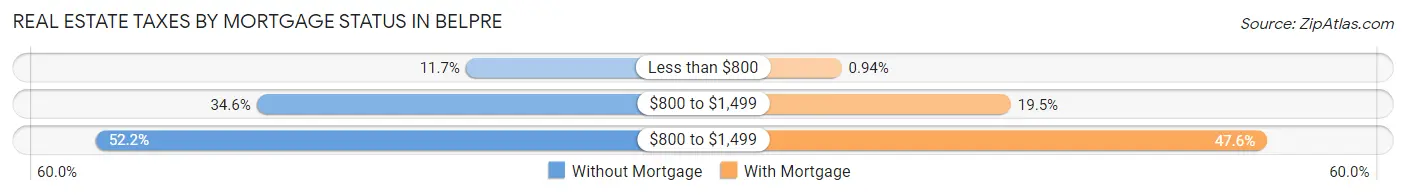
| Property Taxes | Without Mortgage | With Mortgage |
| Less than $800 | 90 (11.7%) | 10 (0.9%) |
| $800 to $1,499 | 267 (34.6%) | 207 (19.5%) |
| $800 to $1,499 | 403 (52.2%) | 505 (47.5%) |
| Total | 772 (100.0%) | 1,062 (100.0%) |
Health & Disability in Belpre
Health Insurance Coverage by Age in Belpre
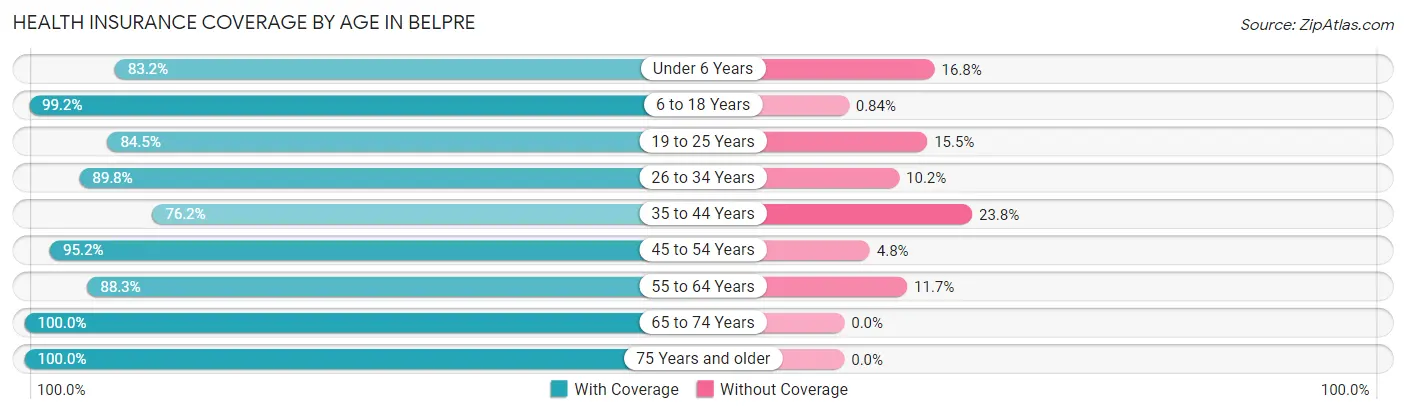
| Age Bracket | With Coverage | Without Coverage |
| Under 6 Years | 321 (83.2%) | 65 (16.8%) |
| 6 to 18 Years | 940 (99.2%) | 8 (0.8%) |
| 19 to 25 Years | 454 (84.5%) | 83 (15.5%) |
| 26 to 34 Years | 650 (89.8%) | 74 (10.2%) |
| 35 to 44 Years | 553 (76.2%) | 173 (23.8%) |
| 45 to 54 Years | 838 (95.2%) | 42 (4.8%) |
| 55 to 64 Years | 784 (88.3%) | 104 (11.7%) |
| 65 to 74 Years | 1,017 (100.0%) | 0 (0.0%) |
| 75 Years and older | 581 (100.0%) | 0 (0.0%) |
| Total | 6,138 (91.8%) | 549 (8.2%) |
Health Insurance Coverage by Citizenship Status in Belpre
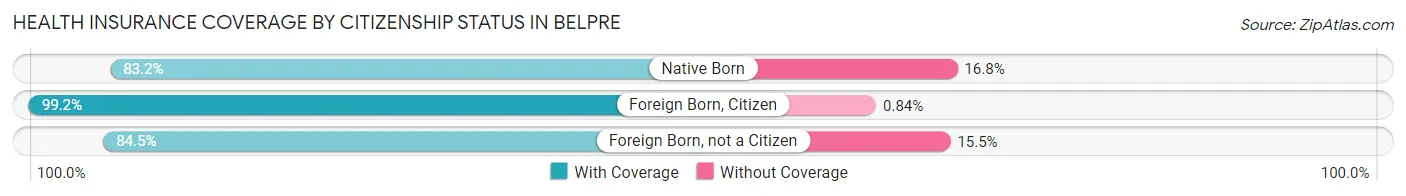
| Citizenship Status | With Coverage | Without Coverage |
| Native Born | 321 (83.2%) | 65 (16.8%) |
| Foreign Born, Citizen | 940 (99.2%) | 8 (0.8%) |
| Foreign Born, not a Citizen | 454 (84.5%) | 83 (15.5%) |
Health Insurance Coverage by Household Income in Belpre
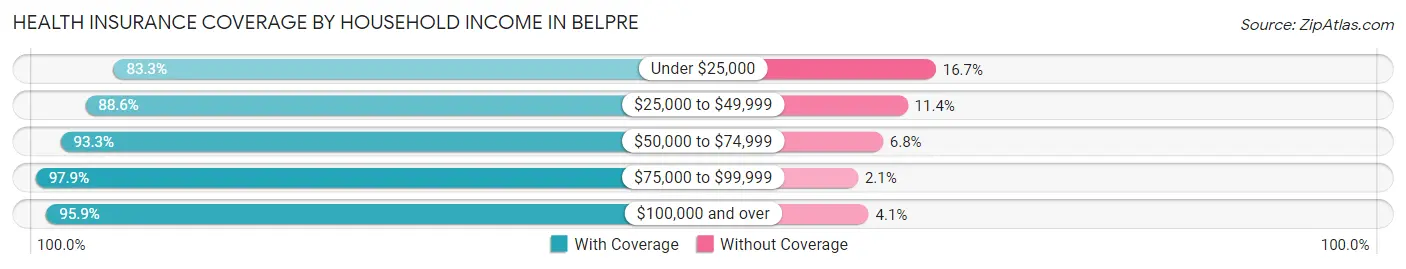
| Household Income | With Coverage | Without Coverage |
| Under $25,000 | 929 (83.3%) | 186 (16.7%) |
| $25,000 to $49,999 | 1,485 (88.6%) | 191 (11.4%) |
| $50,000 to $74,999 | 1,284 (93.2%) | 93 (6.8%) |
| $75,000 to $99,999 | 1,173 (97.9%) | 25 (2.1%) |
| $100,000 and over | 1,267 (95.9%) | 54 (4.1%) |
Public vs Private Health Insurance Coverage by Age in Belpre
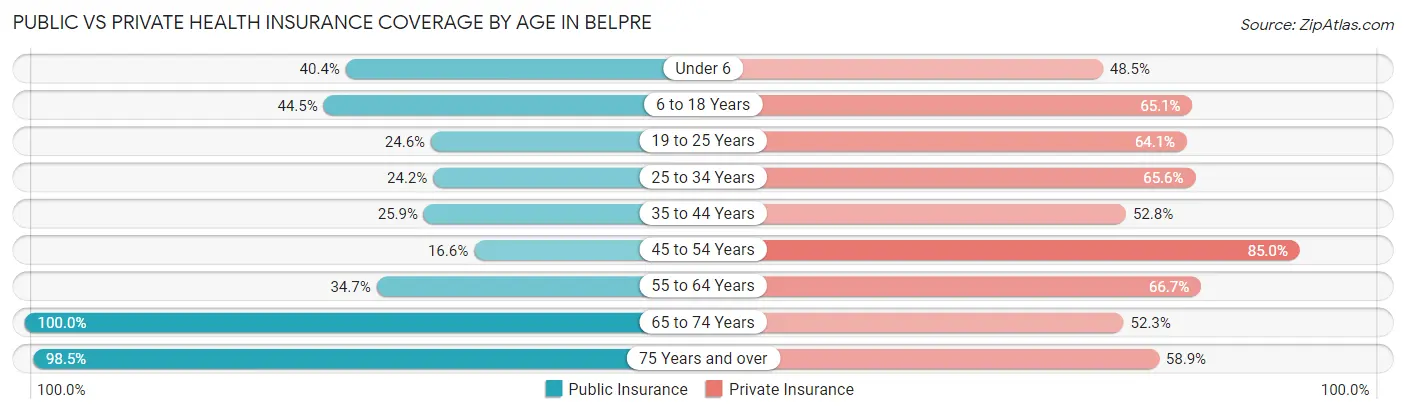
| Age Bracket | Public Insurance | Private Insurance |
| Under 6 | 156 (40.4%) | 187 (48.4%) |
| 6 to 18 Years | 422 (44.5%) | 617 (65.1%) |
| 19 to 25 Years | 132 (24.6%) | 344 (64.1%) |
| 25 to 34 Years | 175 (24.2%) | 475 (65.6%) |
| 35 to 44 Years | 188 (25.9%) | 383 (52.7%) |
| 45 to 54 Years | 146 (16.6%) | 748 (85.0%) |
| 55 to 64 Years | 308 (34.7%) | 592 (66.7%) |
| 65 to 74 Years | 1,017 (100.0%) | 532 (52.3%) |
| 75 Years and over | 572 (98.5%) | 342 (58.9%) |
| Total | 3,116 (46.6%) | 4,220 (63.1%) |
Disability Status by Sex by Age in Belpre
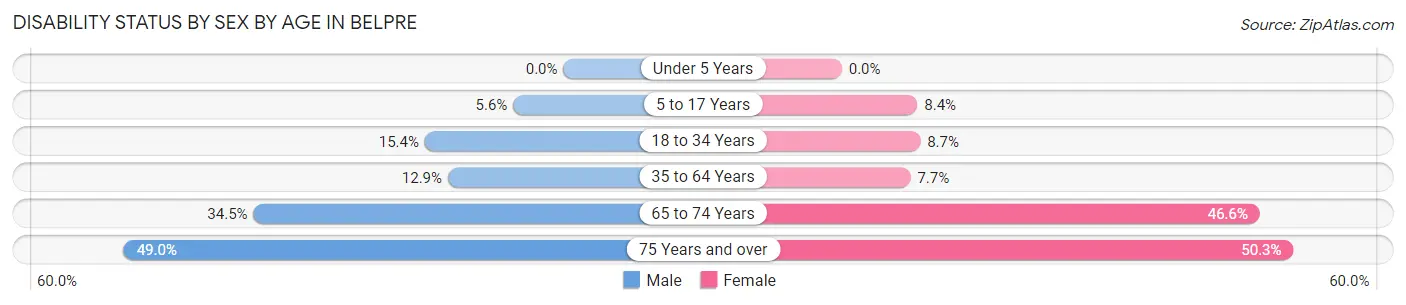
| Age Bracket | Male | Female |
| Under 5 Years | 0 (0.0%) | 0 (0.0%) |
| 5 to 17 Years | 31 (5.6%) | 35 (8.4%) |
| 18 to 34 Years | 110 (15.4%) | 51 (8.7%) |
| 35 to 64 Years | 151 (12.9%) | 101 (7.6%) |
| 65 to 74 Years | 136 (34.5%) | 290 (46.6%) |
| 75 Years and over | 118 (49.0%) | 171 (50.3%) |
Disability Class by Sex by Age in Belpre
Disability Class: Hearing Difficulty
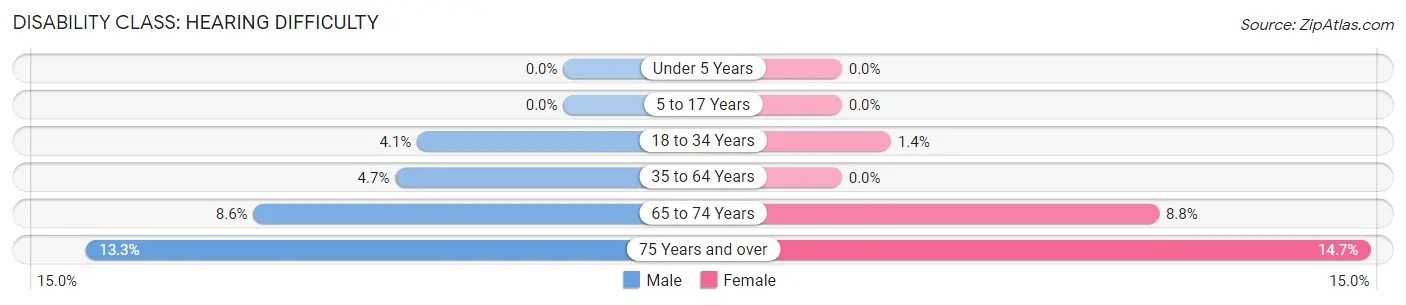
| Age Bracket | Male | Female |
| Under 5 Years | 0 (0.0%) | 0 (0.0%) |
| 5 to 17 Years | 0 (0.0%) | 0 (0.0%) |
| 18 to 34 Years | 29 (4.1%) | 8 (1.4%) |
| 35 to 64 Years | 55 (4.7%) | 0 (0.0%) |
| 65 to 74 Years | 34 (8.6%) | 55 (8.8%) |
| 75 Years and over | 32 (13.3%) | 50 (14.7%) |
Disability Class: Vision Difficulty
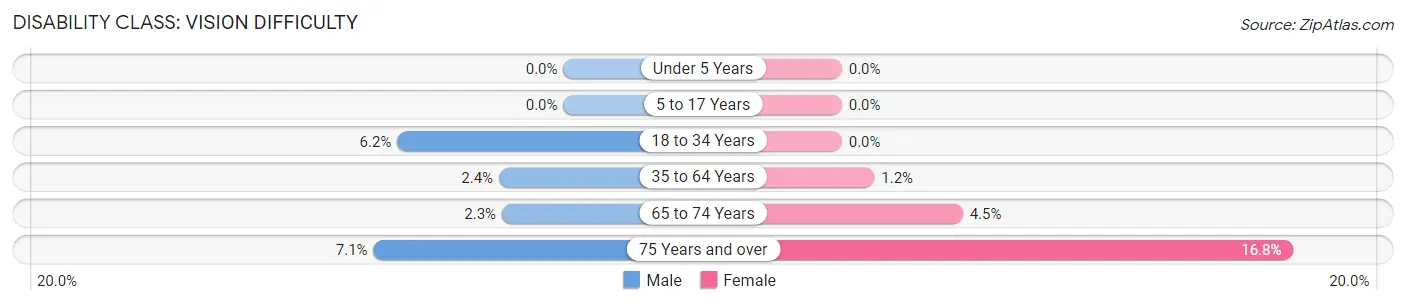
| Age Bracket | Male | Female |
| Under 5 Years | 0 (0.0%) | 0 (0.0%) |
| 5 to 17 Years | 0 (0.0%) | 0 (0.0%) |
| 18 to 34 Years | 44 (6.2%) | 0 (0.0%) |
| 35 to 64 Years | 28 (2.4%) | 16 (1.2%) |
| 65 to 74 Years | 9 (2.3%) | 28 (4.5%) |
| 75 Years and over | 17 (7.0%) | 57 (16.8%) |
Disability Class: Cognitive Difficulty
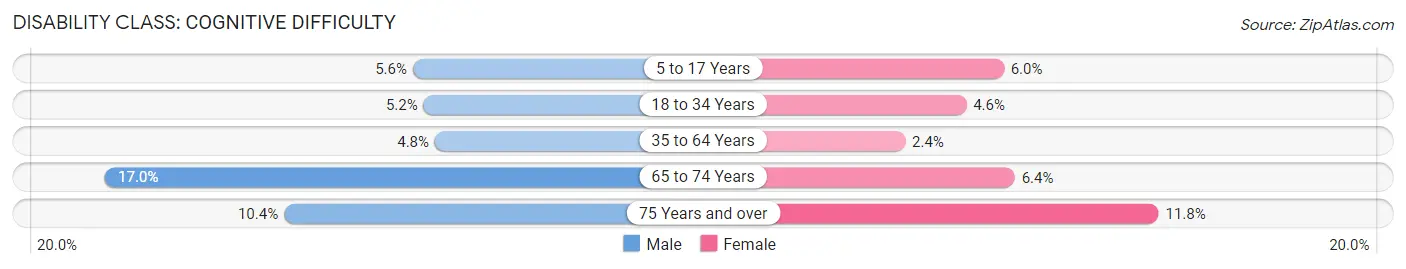
| Age Bracket | Male | Female |
| 5 to 17 Years | 31 (5.6%) | 25 (6.0%) |
| 18 to 34 Years | 37 (5.2%) | 27 (4.6%) |
| 35 to 64 Years | 56 (4.8%) | 31 (2.4%) |
| 65 to 74 Years | 67 (17.0%) | 40 (6.4%) |
| 75 Years and over | 25 (10.4%) | 40 (11.8%) |
Disability Class: Ambulatory Difficulty
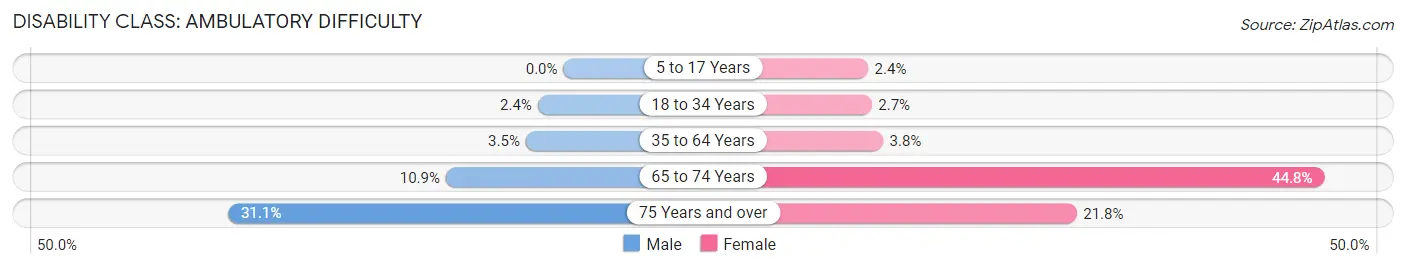
| Age Bracket | Male | Female |
| 5 to 17 Years | 0 (0.0%) | 10 (2.4%) |
| 18 to 34 Years | 17 (2.4%) | 16 (2.7%) |
| 35 to 64 Years | 41 (3.5%) | 50 (3.8%) |
| 65 to 74 Years | 43 (10.9%) | 279 (44.8%) |
| 75 Years and over | 75 (31.1%) | 74 (21.8%) |
Disability Class: Self-Care Difficulty
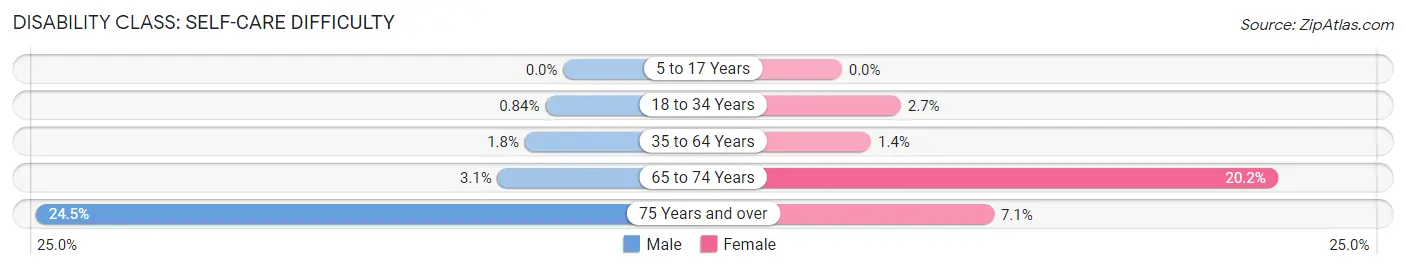
| Age Bracket | Male | Female |
| 5 to 17 Years | 0 (0.0%) | 0 (0.0%) |
| 18 to 34 Years | 6 (0.8%) | 16 (2.7%) |
| 35 to 64 Years | 21 (1.8%) | 18 (1.4%) |
| 65 to 74 Years | 12 (3.0%) | 126 (20.2%) |
| 75 Years and over | 59 (24.5%) | 24 (7.1%) |
Technology Access in Belpre
Computing Device Access in Belpre
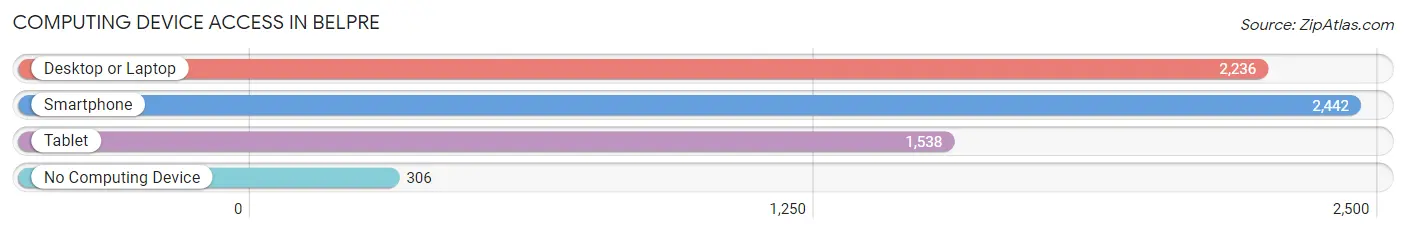
| Device Type | # Households | % Households |
| Desktop or Laptop | 2,236 | 72.7% |
| Smartphone | 2,442 | 79.4% |
| Tablet | 1,538 | 50.0% |
| No Computing Device | 306 | 10.0% |
| Total | 3,074 | 100.0% |
Internet Access in Belpre
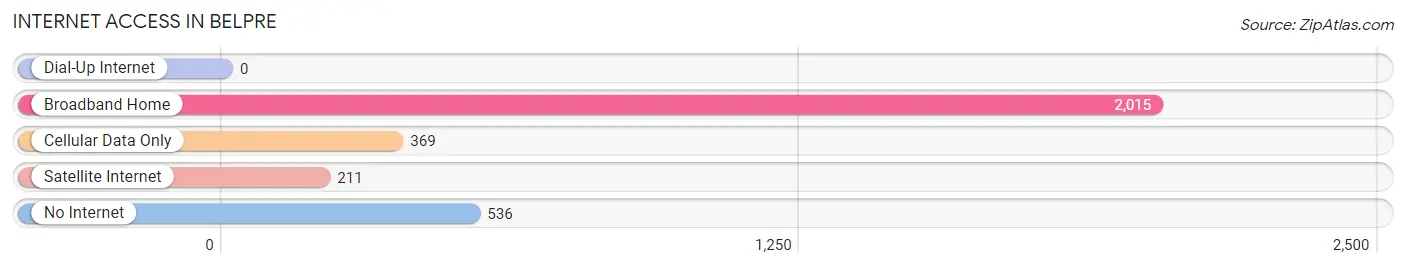
| Internet Type | # Households | % Households |
| Dial-Up Internet | 0 | 0.0% |
| Broadband Home | 2,015 | 65.5% |
| Cellular Data Only | 369 | 12.0% |
| Satellite Internet | 211 | 6.9% |
| No Internet | 536 | 17.4% |
| Total | 3,074 | 100.0% |
Belpre Summary
Belpre, Ohio is a small city located in Washington County, Ohio, United States. It is situated along the Ohio River, just across from Parkersburg, West Virginia. The city has a population of approximately 5,000 people and is part of the Parkersburg-Marietta-Vienna Metropolitan Statistical Area.
History
Belpre was founded in 1790 by a group of settlers from Pennsylvania. The town was named after the French phrase “belle pre” which means “beautiful meadow”. The town was originally a farming community and was known for its production of apples, peaches, and other fruits.
In 1820, the Ohio and Erie Canal was built through Belpre, connecting the town to the rest of the state. This allowed for increased trade and commerce, and Belpre soon became a thriving river port. The town was also home to several industries, including a woolen mill, a paper mill, and a sawmill.
In the late 19th century, Belpre experienced a period of growth and development. The town was incorporated in 1867 and the first mayor was elected in 1868. The town also saw the construction of several churches, schools, and other public buildings.
Geography
Belpre is located in southeastern Ohio, along the Ohio River. It is situated approximately 25 miles south of Marietta and 40 miles west of Parkersburg, West Virginia. The city covers an area of 4.2 square miles and has an elevation of 645 feet.
The climate in Belpre is humid continental, with hot summers and cold winters. The average annual temperature is 54 degrees Fahrenheit and the average annual precipitation is 40 inches.
Economy
Belpre’s economy is largely based on manufacturing and services. The city is home to several manufacturing companies, including a paper mill, a plastics plant, and a metal fabrication plant. The city also has a number of retail stores, restaurants, and other businesses.
The city is also home to several educational institutions, including Belpre High School, Belpre Middle School, and Belpre Elementary School. The city is also home to the Washington County Career Center, which provides vocational and technical training.
Demographics
As of the 2010 census, Belpre had a population of 5,000 people. The racial makeup of the city was 95.3% White, 1.2% African American, 0.3% Native American, 0.7% Asian, 0.1% Pacific Islander, and 1.4% from other races. Hispanic or Latino of any race were 2.2% of the population.
The median household income in Belpre was $37,917 and the median family income was $45,938. The per capita income was $19,945. About 11.3% of families and 14.2% of the population were below the poverty line.
Belpre is a small city with a rich history and a diverse economy. The city is home to several manufacturing companies, educational institutions, and other businesses. The city also has a diverse population, with a mix of races and ethnicities. Belpre is a great place to live and work, and is a great example of a small city with a lot to offer.
Common Questions
What is Per Capita Income in Belpre?
Per Capita income in Belpre is $28,122.
What is the Median Family Income in Belpre?
Median Family Income in Belpre is $67,848.
What is the Median Household income in Belpre?
Median Household Income in Belpre is $47,474.
What is Income or Wage Gap in Belpre?
Income or Wage Gap in Belpre is 26.8%.
Women in Belpre earn 73.2 cents for every dollar earned by a man.
What is Inequality or Gini Index in Belpre?
Inequality or Gini Index in Belpre is 0.40.
What is the Total Population of Belpre?
Total Population of Belpre is 6,690.
What is the Total Male Population of Belpre?
Total Male Population of Belpre is 3,257.
What is the Total Female Population of Belpre?
Total Female Population of Belpre is 3,433.
What is the Ratio of Males per 100 Females in Belpre?
There are 94.87 Males per 100 Females in Belpre.
What is the Ratio of Females per 100 Males in Belpre?
There are 105.40 Females per 100 Males in Belpre.
What is the Median Population Age in Belpre?
Median Population Age in Belpre is 45.4 Years.
What is the Average Family Size in Belpre
Average Family Size in Belpre is 2.9 People.
What is the Average Household Size in Belpre
Average Household Size in Belpre is 2.2 People.
How Large is the Labor Force in Belpre?
There are 3,094 People in the Labor Forcein in Belpre.
What is the Percentage of People in the Labor Force in Belpre?
55.8% of People are in the Labor Force in Belpre.
What is the Unemployment Rate in Belpre?
Unemployment Rate in Belpre is 3.9%.