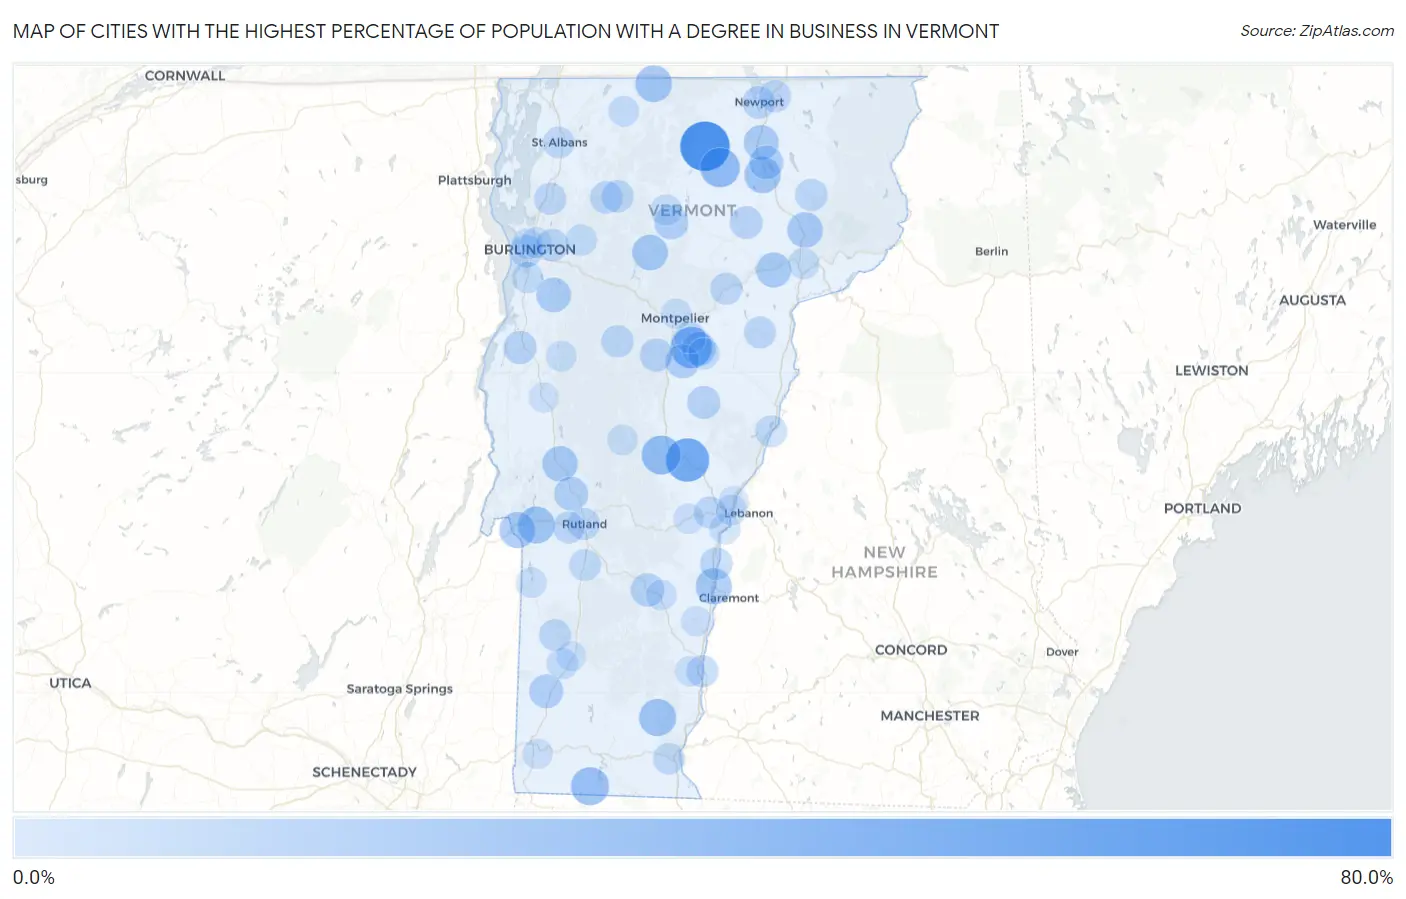
Cities with the Highest Percentage of Population with a Degree in Business in Vermont
RELATED REPORTS & OPTIONS
Business
Vermont
Compare Cities
Map of Cities with the Highest Percentage of Population with a Degree in Business in Vermont
0.0%
80.0%
Cities with the Highest Percentage of Population with a Degree in Business in Vermont
| City | % Graduates | vs State | vs National | |
| 1. | Lowell | 75.0% | 10.8%(+64.2)#1 | 19.5%(+55.5)#409 |
| 2. | East Dorset | 71.6% | 10.8%(+60.7)#2 | 19.5%(+52.1)#453 |
| 3. | South Royalton | 52.9% | 10.8%(+42.1)#3 | 19.5%(+33.4)#904 |
| 4. | South Barre | 45.8% | 10.8%(+35.0)#4 | 19.5%(+26.3)#1,352 |
| 5. | Bolton | 42.9% | 10.8%(+32.1)#5 | 19.5%(+23.4)#1,564 |
| 6. | Albany | 38.5% | 10.8%(+27.7)#6 | 19.5%(+19.0)#2,054 |
| 7. | Bolton Valley | 37.5% | 10.8%(+26.7)#7 | 19.5%(+18.0)#2,185 |
| 8. | Bethel | 37.0% | 10.8%(+26.2)#8 | 19.5%(+17.5)#2,251 |
| 9. | Readsboro | 33.3% | 10.8%(+22.5)#9 | 19.5%(+13.8)#2,919 |
| 10. | Hanksville | 31.6% | 10.8%(+20.8)#10 | 19.5%(+12.1)#3,437 |
| 11. | Newfane | 30.2% | 10.8%(+19.4)#11 | 19.5%(+10.7)#3,836 |
| 12. | Castleton | 29.6% | 10.8%(+18.8)#12 | 19.5%(+10.1)#4,016 |
| 13. | Richford | 28.5% | 10.8%(+17.7)#13 | 19.5%(+8.99)#4,479 |
| 14. | St. George | 27.8% | 10.8%(+17.0)#14 | 19.5%(+8.28)#4,774 |
| 15. | Killington | 27.7% | 10.8%(+16.9)#15 | 19.5%(+8.24)#4,800 |
| 16. | Glover | 27.5% | 10.8%(+16.7)#16 | 19.5%(+8.04)#4,914 |
| 17. | Ascutney | 26.7% | 10.8%(+15.9)#17 | 19.5%(+7.17)#5,401 |
| 18. | Fair Haven | 26.5% | 10.8%(+15.7)#18 | 19.5%(+6.96)#5,521 |
| 19. | Proctor | 25.4% | 10.8%(+14.6)#19 | 19.5%(+5.89)#6,166 |
| 20. | Stowe | 24.9% | 10.8%(+14.1)#20 | 19.5%(+5.36)#6,619 |
| 21. | Lyndonville | 24.6% | 10.8%(+13.8)#21 | 19.5%(+5.15)#6,748 |
| 22. | Brandon | 24.0% | 10.8%(+13.2)#22 | 19.5%(+4.45)#7,245 |
| 23. | Westford | 22.8% | 10.8%(+12.0)#23 | 19.5%(+3.33)#8,212 |
| 24. | Orleans | 22.8% | 10.8%(+12.0)#24 | 19.5%(+3.29)#8,238 |
| 25. | Danville | 22.6% | 10.8%(+11.8)#25 | 19.5%(+3.10)#8,432 |
| 26. | West Charlotte | 21.7% | 10.8%(+10.9)#26 | 19.5%(+2.17)#9,326 |
| 27. | Hinesburg | 21.4% | 10.8%(+10.6)#27 | 19.5%(+1.87)#9,634 |
| 28. | Middletown Springs | 20.5% | 10.8%(+9.65)#28 | 19.5%(+0.956)#10,554 |
| 29. | Websterville | 19.4% | 10.8%(+8.64)#29 | 19.5%(-0.055)#11,651 |
| 30. | Pittsford | 19.3% | 10.8%(+8.50)#30 | 19.5%(-0.201)#11,811 |
| 31. | Williamstown | 19.3% | 10.8%(+8.48)#31 | 19.5%(-0.213)#11,826 |
| 32. | Morrisville | 19.3% | 10.8%(+8.46)#32 | 19.5%(-0.234)#11,848 |
| 33. | Arlington | 19.2% | 10.8%(+8.44)#33 | 19.5%(-0.261)#11,880 |
| 34. | Barton | 19.0% | 10.8%(+8.25)#34 | 19.5%(-0.451)#12,079 |
| 35. | East Charlotte | 18.9% | 10.8%(+8.12)#35 | 19.5%(-0.580)#12,233 |
| 36. | Ludlow | 17.6% | 10.8%(+6.82)#36 | 19.5%(-1.88)#13,658 |
| 37. | Stamford | 16.8% | 10.8%(+5.98)#37 | 19.5%(-2.72)#14,541 |
| 38. | Vergennes | 16.3% | 10.8%(+5.54)#38 | 19.5%(-3.16)#15,081 |
| 39. | Chelsea | 16.1% | 10.8%(+5.29)#39 | 19.5%(-3.41)#15,366 |
| 40. | Northfield | 16.0% | 10.8%(+5.23)#40 | 19.5%(-3.47)#15,419 |
| 41. | Greensboro Bend | 15.3% | 10.8%(+4.45)#41 | 19.5%(-4.24)#16,278 |
| 42. | South Lincoln | 15.1% | 10.8%(+4.29)#42 | 19.5%(-4.40)#16,411 |
| 43. | Newport | 14.9% | 10.8%(+4.06)#43 | 19.5%(-4.64)#16,651 |
| 44. | South Burlington | 14.5% | 10.8%(+3.74)#44 | 19.5%(-4.96)#16,973 |
| 45. | North Pownal | 14.5% | 10.8%(+3.66)#45 | 19.5%(-5.04)#17,044 |
| 46. | Cambridge | 14.3% | 10.8%(+3.48)#46 | 19.5%(-5.21)#17,267 |
| 47. | Windsor | 14.1% | 10.8%(+3.32)#47 | 19.5%(-5.37)#17,451 |
| 48. | Essex Junction | 13.9% | 10.8%(+3.05)#48 | 19.5%(-5.65)#17,698 |
| 49. | Waitsfield | 13.8% | 10.8%(+2.97)#49 | 19.5%(-5.73)#17,778 |
| 50. | Castleton Four Corners | 13.7% | 10.8%(+2.88)#50 | 19.5%(-5.81)#17,866 |
| 51. | Jeffersonville | 13.6% | 10.8%(+2.79)#51 | 19.5%(-5.91)#17,974 |
| 52. | Townshend | 13.5% | 10.8%(+2.71)#52 | 19.5%(-5.99)#18,042 |
| 53. | West Burke | 13.3% | 10.8%(+2.53)#53 | 19.5%(-6.17)#18,238 |
| 54. | Harmonyville | 13.2% | 10.8%(+2.43)#54 | 19.5%(-6.26)#18,315 |
| 55. | Rutland | 13.2% | 10.8%(+2.38)#55 | 19.5%(-6.32)#18,356 |
| 56. | Derby Center | 13.0% | 10.8%(+2.16)#56 | 19.5%(-6.54)#18,546 |
| 57. | Milton | 12.9% | 10.8%(+2.08)#57 | 19.5%(-6.62)#18,635 |
| 58. | Bellows Falls | 12.7% | 10.8%(+1.94)#58 | 19.5%(-6.75)#18,732 |
| 59. | Groton | 12.5% | 10.8%(+1.70)#59 | 19.5%(-7.00)#18,949 |
| 60. | Lunenburg | 12.5% | 10.8%(+1.70)#60 | 19.5%(-7.00)#18,971 |
| 61. | Marshfield | 12.4% | 10.8%(+1.59)#61 | 19.5%(-7.11)#19,102 |
| 62. | West Rutland | 12.4% | 10.8%(+1.59)#62 | 19.5%(-7.11)#19,103 |
| 63. | Quechee | 12.3% | 10.8%(+1.49)#63 | 19.5%(-7.20)#19,173 |
| 64. | Dorset | 12.2% | 10.8%(+1.39)#64 | 19.5%(-7.30)#19,259 |
| 65. | Fairlee | 12.0% | 10.8%(+1.20)#65 | 19.5%(-7.50)#19,423 |
| 66. | Pawlet | 11.8% | 10.8%(+0.963)#66 | 19.5%(-7.73)#19,611 |
| 67. | St Albans | 11.6% | 10.8%(+0.844)#67 | 19.5%(-7.85)#19,700 |
| 68. | Wallingford | 11.6% | 10.8%(+0.786)#68 | 19.5%(-7.91)#19,748 |
| 69. | Barre | 11.3% | 10.8%(+0.522)#69 | 19.5%(-8.18)#19,981 |
| 70. | West Brattleboro | 11.1% | 10.8%(+0.274)#70 | 19.5%(-8.42)#20,229 |
| 71. | Jericho | 10.7% | 10.8%(-0.081)#71 | 19.5%(-8.78)#20,478 |
| 72. | Hyde Park | 10.7% | 10.8%(-0.135)#72 | 19.5%(-8.83)#20,520 |
| 73. | East Barre | 10.6% | 10.8%(-0.233)#73 | 19.5%(-8.93)#20,598 |
| 74. | Manchester | 10.2% | 10.8%(-0.553)#74 | 19.5%(-9.25)#20,832 |
| 75. | Shelburne | 10.0% | 10.8%(-0.785)#75 | 19.5%(-9.48)#20,958 |
| 76. | St Johnsbury | 9.5% | 10.8%(-1.32)#76 | 19.5%(-10.0)#21,379 |
| 77. | North Hartland | 9.0% | 10.8%(-1.79)#77 | 19.5%(-10.5)#21,709 |
| 78. | Burlington | 9.0% | 10.8%(-1.85)#78 | 19.5%(-10.5)#21,736 |
| 79. | West Woodstock | 8.7% | 10.8%(-2.11)#79 | 19.5%(-10.8)#21,912 |
| 80. | Wolcott | 8.7% | 10.8%(-2.11)#80 | 19.5%(-10.8)#21,925 |
| 81. | Enosburg Falls | 8.7% | 10.8%(-2.14)#81 | 19.5%(-10.8)#21,936 |
| 82. | Lyndon Center | 8.6% | 10.8%(-2.16)#82 | 19.5%(-10.9)#21,959 |
| 83. | Winooski | 8.2% | 10.8%(-2.62)#83 | 19.5%(-11.3)#22,245 |
| 84. | Bristol | 8.1% | 10.8%(-2.73)#84 | 19.5%(-11.4)#22,315 |
| 85. | White River Junction | 8.0% | 10.8%(-2.80)#85 | 19.5%(-11.5)#22,340 |
| 86. | Wells | 7.8% | 10.8%(-2.96)#86 | 19.5%(-11.7)#22,447 |
| 87. | Proctorsville | 7.8% | 10.8%(-2.96)#87 | 19.5%(-11.7)#22,448 |
| 88. | Rochester | 7.8% | 10.8%(-2.98)#88 | 19.5%(-11.7)#22,454 |
| 89. | Bakersfield | 7.5% | 10.8%(-3.30)#89 | 19.5%(-12.0)#22,638 |
| 90. | Huntington | 7.4% | 10.8%(-3.38)#90 | 19.5%(-12.1)#22,678 |
| 91. | Woodstock | 7.4% | 10.8%(-3.42)#91 | 19.5%(-12.1)#22,710 |
| 92. | Springfield | 6.8% | 10.8%(-3.99)#92 | 19.5%(-12.7)#23,003 |
| 93. | Montpelier | 6.8% | 10.8%(-4.01)#93 | 19.5%(-12.7)#23,012 |
| 94. | Bennington | 6.7% | 10.8%(-4.07)#94 | 19.5%(-12.8)#23,045 |
| 95. | Saxtons River | 6.7% | 10.8%(-4.07)#95 | 19.5%(-12.8)#23,048 |
| 96. | Danby | 6.7% | 10.8%(-4.14)#96 | 19.5%(-12.8)#23,096 |
| 97. | Middlebury | 6.1% | 10.8%(-4.69)#97 | 19.5%(-13.4)#23,356 |
| 98. | Wilder | 6.1% | 10.8%(-4.70)#98 | 19.5%(-13.4)#23,360 |
| 99. | Manchester Center | 6.0% | 10.8%(-4.80)#99 | 19.5%(-13.5)#23,408 |
| 100. | Lincoln | 5.7% | 10.8%(-5.05)#100 | 19.5%(-13.8)#23,529 |
1
2Common Questions
What are the Top 10 Cities with the Highest Percentage of Population with a Degree in Business in Vermont?
Top 10 Cities with the Highest Percentage of Population with a Degree in Business in Vermont are:
#1
75.0%
#2
52.9%
#3
45.8%
#4
38.5%
#5
37.0%
#6
33.3%
#7
30.2%
#8
29.6%
#9
28.5%
#10
27.5%
What city has the Highest Percentage of Population with a Degree in Business in Vermont?
Lowell has the Highest Percentage of Population with a Degree in Business in Vermont with 75.0%.
What is the Percentage of Population with a Degree in Business in the State of Vermont?
Percentage of Population with a Degree in Business in Vermont is 10.8%.
What is the Percentage of Population with a Degree in Business in the United States?
Percentage of Population with a Degree in Business in the United States is 19.5%.