Avon, NY Map & Demographics
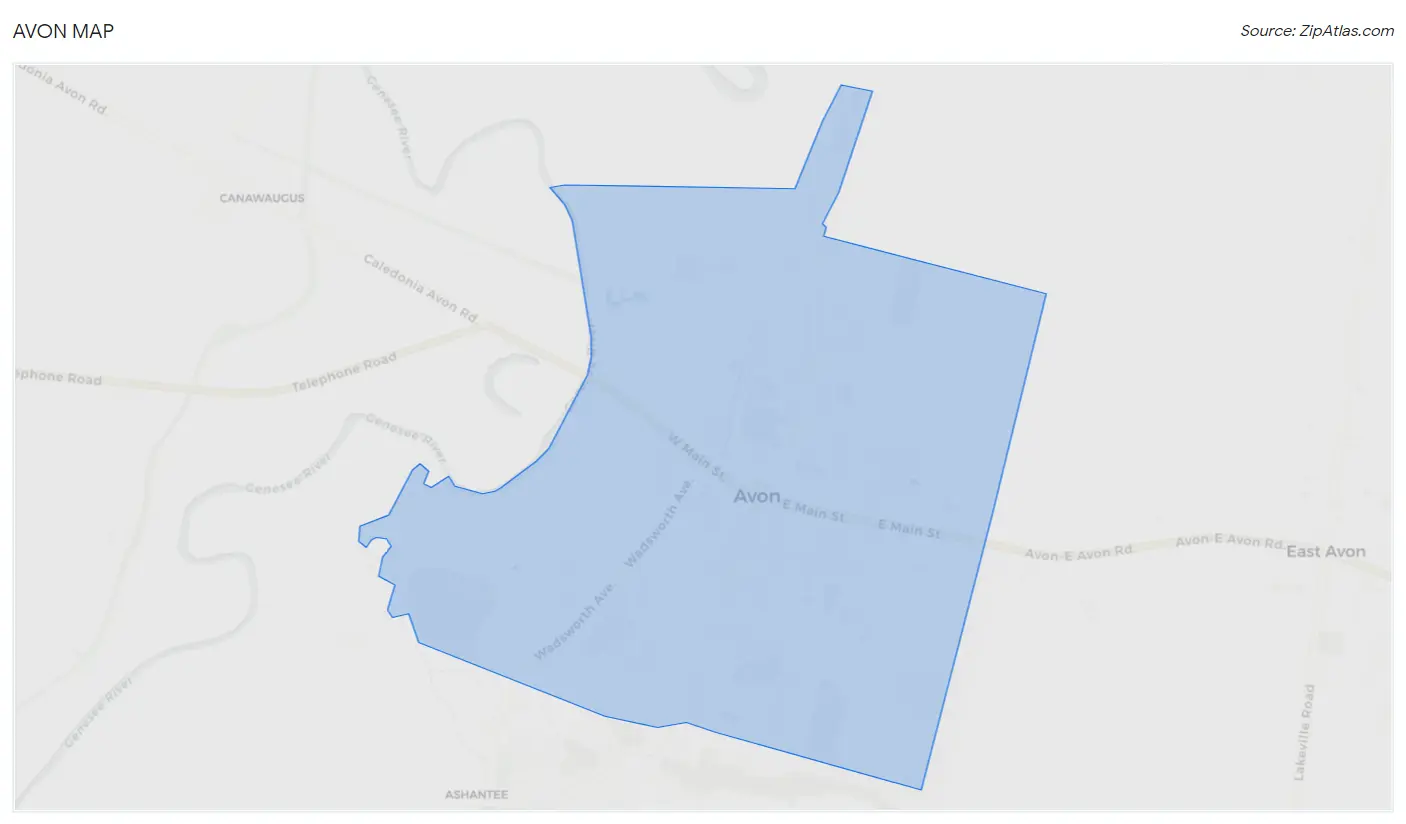
Avon Map
Avon Overview
$38,307
PER CAPITA INCOME
$92,256
AVG FAMILY INCOME
$71,958
AVG HOUSEHOLD INCOME
44.2%
WAGE / INCOME GAP [ % ]
55.8¢/ $1
WAGE / INCOME GAP [ $ ]
0.39
INEQUALITY / GINI INDEX
3,388
TOTAL POPULATION
1,660
MALE POPULATION
1,728
FEMALE POPULATION
96.06
MALES / 100 FEMALES
104.10
FEMALES / 100 MALES
43.9
MEDIAN AGE
2.8
AVG FAMILY SIZE
2.3
AVG HOUSEHOLD SIZE
1,735
LABOR FORCE [ PEOPLE ]
62.8%
PERCENT IN LABOR FORCE
3.1%
UNEMPLOYMENT RATE
Avon Zip Codes
Avon Area Codes
Income in Avon
Income Overview in Avon
Per Capita Income in Avon is $38,307, while median incomes of families and households are $92,256 and $71,958 respectively.
| Characteristic | Number | Measure |
| Per Capita Income | 3,388 | $38,307 |
| Median Family Income | 910 | $92,256 |
| Mean Family Income | 910 | $105,118 |
| Median Household Income | 1,453 | $71,958 |
| Mean Household Income | 1,453 | $87,508 |
| Income Deficit | 910 | $0 |
| Wage / Income Gap (%) | 3,388 | 44.17% |
| Wage / Income Gap ($) | 3,388 | 55.83¢ per $1 |
| Gini / Inequality Index | 3,388 | 0.39 |
Earnings by Sex in Avon
Average Earnings in Avon are $41,795, $54,511 for men and $30,431 for women, a difference of 44.2%.
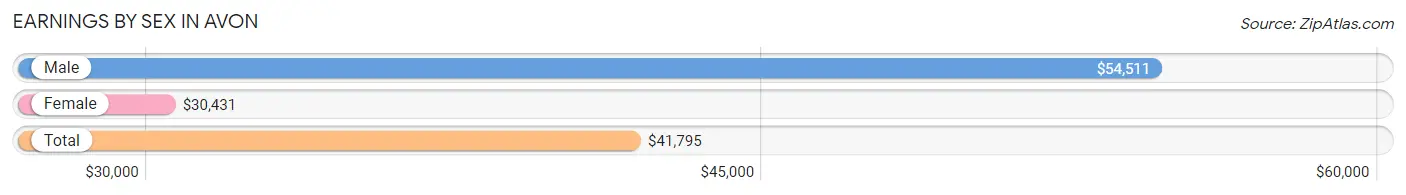
| Sex | Number | Average Earnings |
| Male | 986 (55.5%) | $54,511 |
| Female | 790 (44.5%) | $30,431 |
| Total | 1,776 (100.0%) | $41,795 |
Earnings by Sex by Income Bracket in Avon
The most common earnings brackets in Avon are $100,000+ for men (157 | 15.9%) and $100,000+ for women (110 | 13.9%).
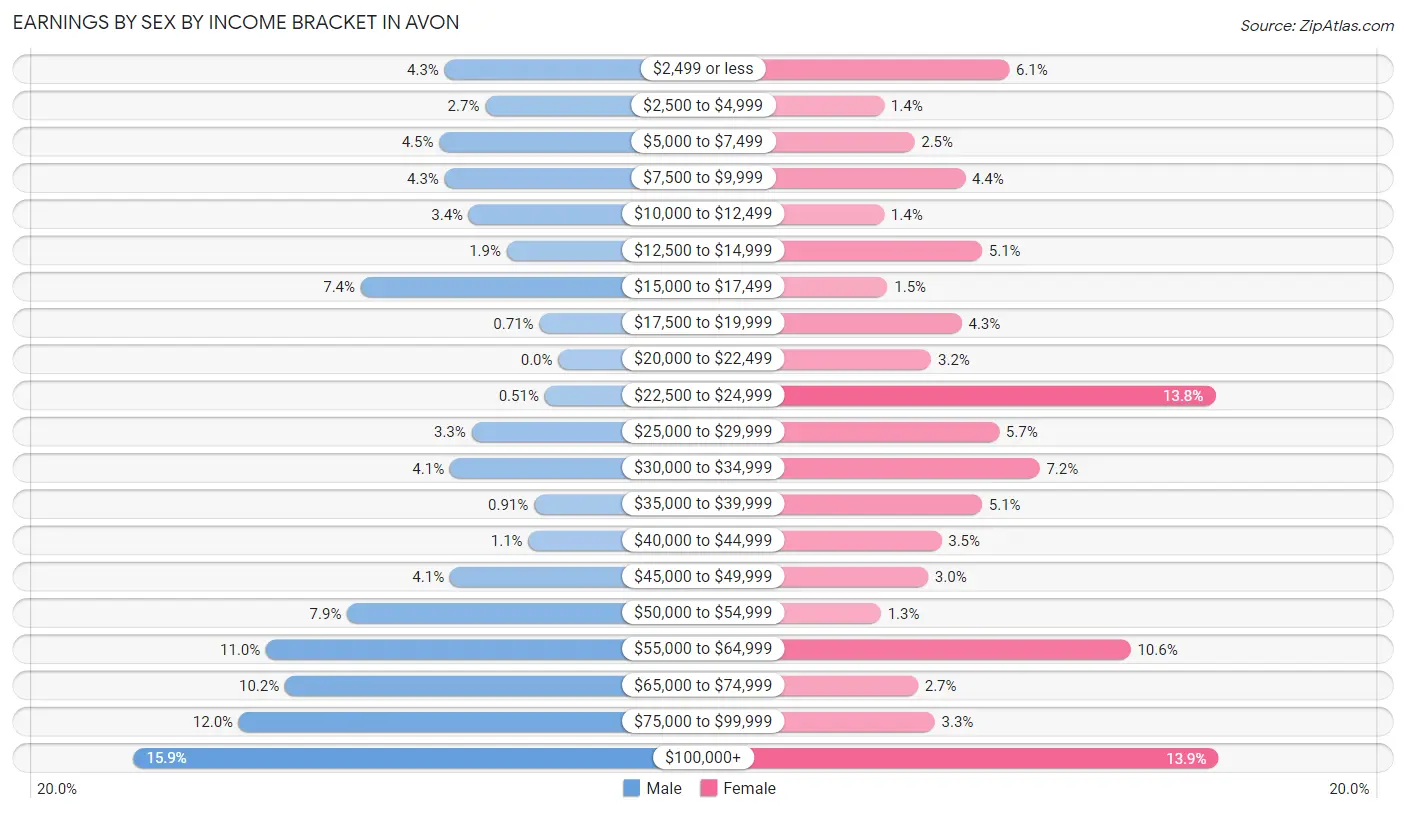
| Income | Male | Female |
| $2,499 or less | 42 (4.3%) | 48 (6.1%) |
| $2,500 to $4,999 | 27 (2.7%) | 11 (1.4%) |
| $5,000 to $7,499 | 44 (4.5%) | 20 (2.5%) |
| $7,500 to $9,999 | 42 (4.3%) | 35 (4.4%) |
| $10,000 to $12,499 | 33 (3.4%) | 11 (1.4%) |
| $12,500 to $14,999 | 19 (1.9%) | 40 (5.1%) |
| $15,000 to $17,499 | 73 (7.4%) | 12 (1.5%) |
| $17,500 to $19,999 | 7 (0.7%) | 34 (4.3%) |
| $20,000 to $22,499 | 0 (0.0%) | 25 (3.2%) |
| $22,500 to $24,999 | 5 (0.5%) | 109 (13.8%) |
| $25,000 to $29,999 | 32 (3.3%) | 45 (5.7%) |
| $30,000 to $34,999 | 40 (4.1%) | 57 (7.2%) |
| $35,000 to $39,999 | 9 (0.9%) | 40 (5.1%) |
| $40,000 to $44,999 | 11 (1.1%) | 28 (3.5%) |
| $45,000 to $49,999 | 40 (4.1%) | 24 (3.0%) |
| $50,000 to $54,999 | 78 (7.9%) | 10 (1.3%) |
| $55,000 to $64,999 | 108 (11.0%) | 84 (10.6%) |
| $65,000 to $74,999 | 101 (10.2%) | 21 (2.7%) |
| $75,000 to $99,999 | 118 (12.0%) | 26 (3.3%) |
| $100,000+ | 157 (15.9%) | 110 (13.9%) |
| Total | 986 (100.0%) | 790 (100.0%) |
Earnings by Sex by Educational Attainment in Avon
Average earnings in Avon are $57,367 for men and $38,380 for women, a difference of 33.1%. Men with an educational attainment of bachelor's degree enjoy the highest average annual earnings of $90,313, while those with high school diploma education earn the least with $53,200. Women with an educational attainment of college or associate's degree earn the most with the average annual earnings of $34,028, while those with high school diploma education have the smallest earnings of $31,705.
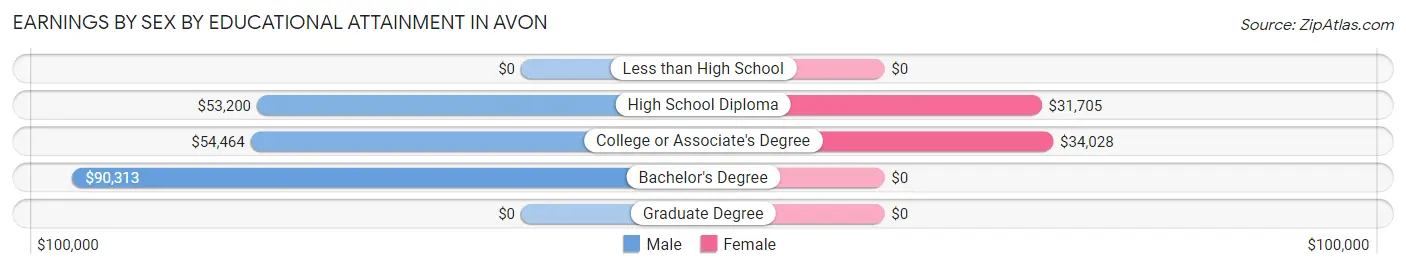
| Educational Attainment | Male Income | Female Income |
| Less than High School | - | - |
| High School Diploma | $53,200 | $31,705 |
| College or Associate's Degree | $54,464 | $34,028 |
| Bachelor's Degree | $90,313 | $0 |
| Graduate Degree | - | - |
| Total | $57,367 | $38,380 |
Family Income in Avon
Family Income Brackets in Avon
According to the Avon family income data, there are 249 families falling into the $100,000 to $149,999 income range, which is the most common income bracket and makes up 27.4% of all families. Conversely, the less than $10,000 income bracket is the least frequent group with only 6 families (0.7%) belonging to this category.
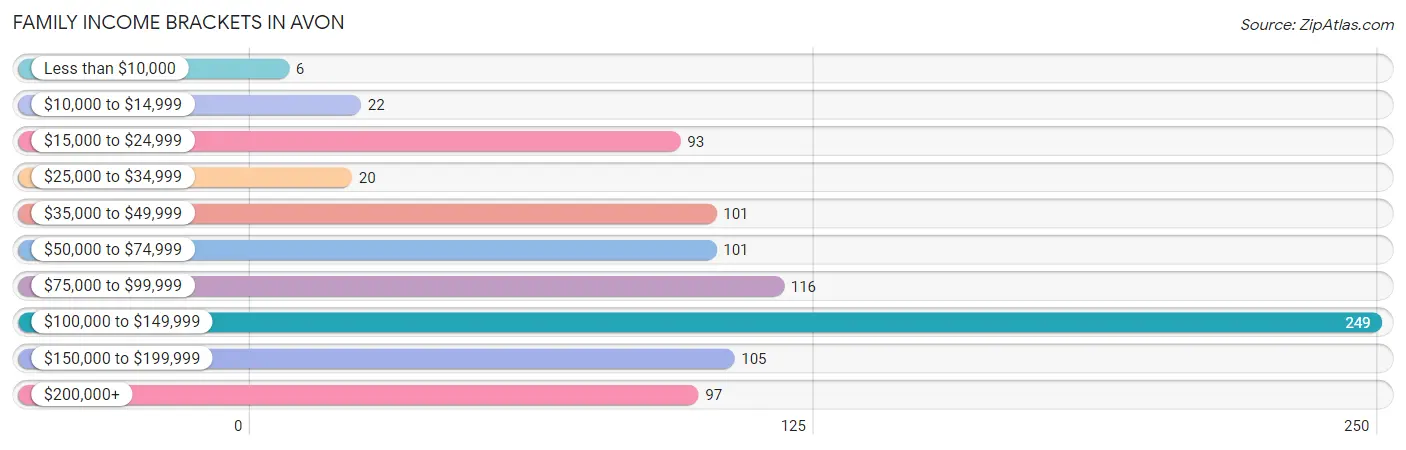
| Income Bracket | # Families | % Families |
| Less than $10,000 | 6 | 0.7% |
| $10,000 to $14,999 | 22 | 2.4% |
| $15,000 to $24,999 | 93 | 10.2% |
| $25,000 to $34,999 | 20 | 2.2% |
| $35,000 to $49,999 | 101 | 11.1% |
| $50,000 to $74,999 | 101 | 11.1% |
| $75,000 to $99,999 | 116 | 12.7% |
| $100,000 to $149,999 | 249 | 27.4% |
| $150,000 to $199,999 | 105 | 11.5% |
| $200,000+ | 97 | 10.7% |
Family Income by Famaliy Size in Avon
5-person families (33 | 3.6%) account for the highest median family income in Avon with $178,125 per family, while 2-person families (559 | 61.4%) have the highest median income of $42,330 per family member.
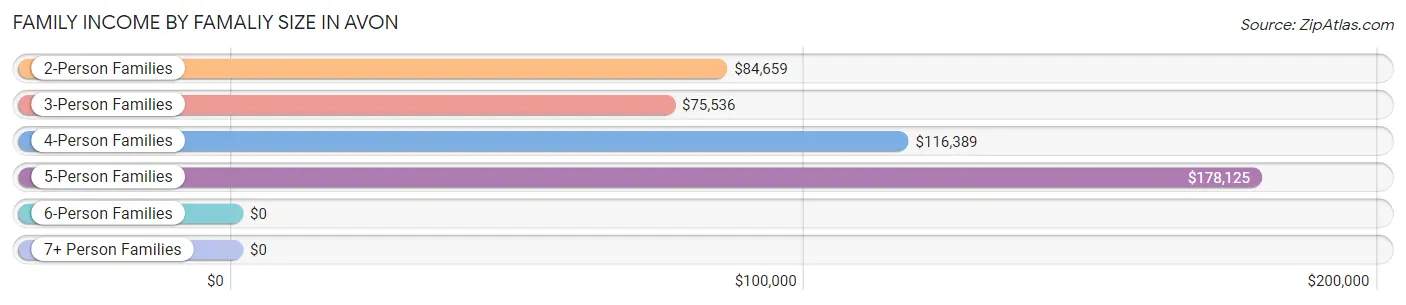
| Income Bracket | # Families | Median Income |
| 2-Person Families | 559 (61.4%) | $84,659 |
| 3-Person Families | 185 (20.3%) | $75,536 |
| 4-Person Families | 120 (13.2%) | $116,389 |
| 5-Person Families | 33 (3.6%) | $178,125 |
| 6-Person Families | 8 (0.9%) | $0 |
| 7+ Person Families | 5 (0.5%) | $0 |
| Total | 910 (100.0%) | $92,256 |
Family Income by Number of Earners in Avon
The median family income in Avon is $92,256, with families comprising 2 earners (393) having the highest median family income of $128,750, while families with no earners (173) have the lowest median family income of $41,089, accounting for 43.2% and 19.0% of families, respectively.
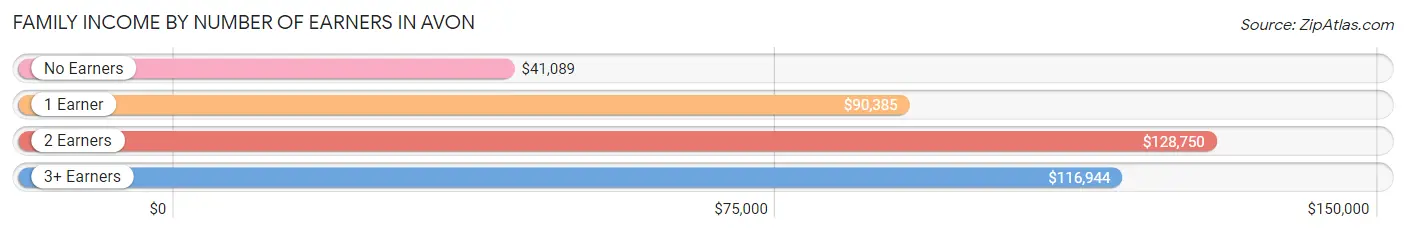
| Number of Earners | # Families | Median Income |
| No Earners | 173 (19.0%) | $41,089 |
| 1 Earner | 314 (34.5%) | $90,385 |
| 2 Earners | 393 (43.2%) | $128,750 |
| 3+ Earners | 30 (3.3%) | $116,944 |
| Total | 910 (100.0%) | $92,256 |
Household Income in Avon
Household Income Brackets in Avon
With 307 households falling in the category, the $100,000 to $149,999 income range is the most frequent in Avon, accounting for 21.1% of all households. In contrast, only 26 households (1.8%) fall into the less than $10,000 income bracket, making it the least populous group.
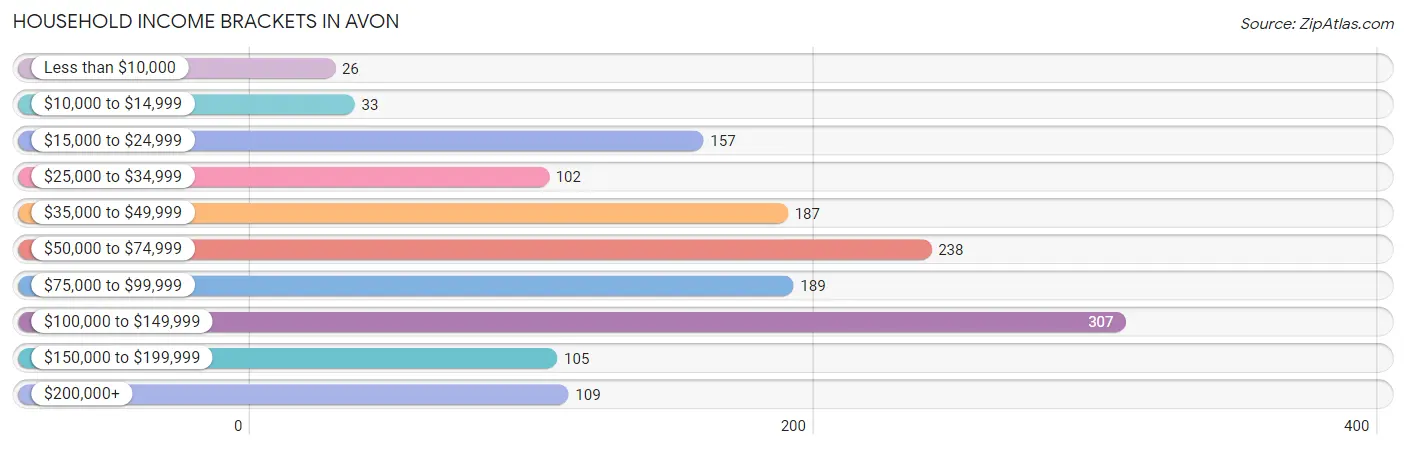
| Income Bracket | # Households | % Households |
| Less than $10,000 | 26 | 1.8% |
| $10,000 to $14,999 | 33 | 2.3% |
| $15,000 to $24,999 | 157 | 10.8% |
| $25,000 to $34,999 | 102 | 7.0% |
| $35,000 to $49,999 | 187 | 12.9% |
| $50,000 to $74,999 | 238 | 16.4% |
| $75,000 to $99,999 | 189 | 13.0% |
| $100,000 to $149,999 | 307 | 21.1% |
| $150,000 to $199,999 | 105 | 7.2% |
| $200,000+ | 109 | 7.5% |
Household Income by Householder Age in Avon
The median household income in Avon is $71,958, with the highest median household income of $95,938 found in the 45 to 64 years age bracket for the primary householder. A total of 459 households (31.6%) fall into this category. Meanwhile, the 15 to 24 years age bracket for the primary householder has the lowest median household income of $0, with 63 households (4.3%) in this group.
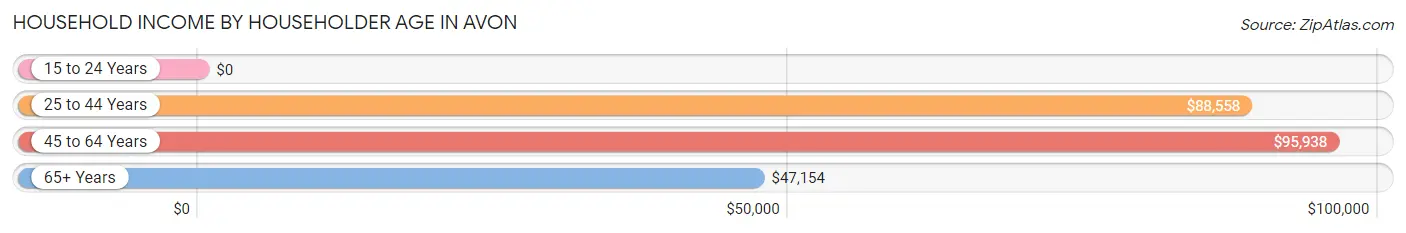
| Income Bracket | # Households | Median Income |
| 15 to 24 Years | 63 (4.3%) | $0 |
| 25 to 44 Years | 421 (29.0%) | $88,558 |
| 45 to 64 Years | 459 (31.6%) | $95,938 |
| 65+ Years | 510 (35.1%) | $47,154 |
| Total | 1,453 (100.0%) | $71,958 |
Poverty in Avon
Income Below Poverty by Sex and Age in Avon
With 11.9% poverty level for males and 14.5% for females among the residents of Avon, 18 to 24 year old males and under 5 year old females are the most vulnerable to poverty, with 42 males (38.2%) and 16 females (36.4%) in their respective age groups living below the poverty level.
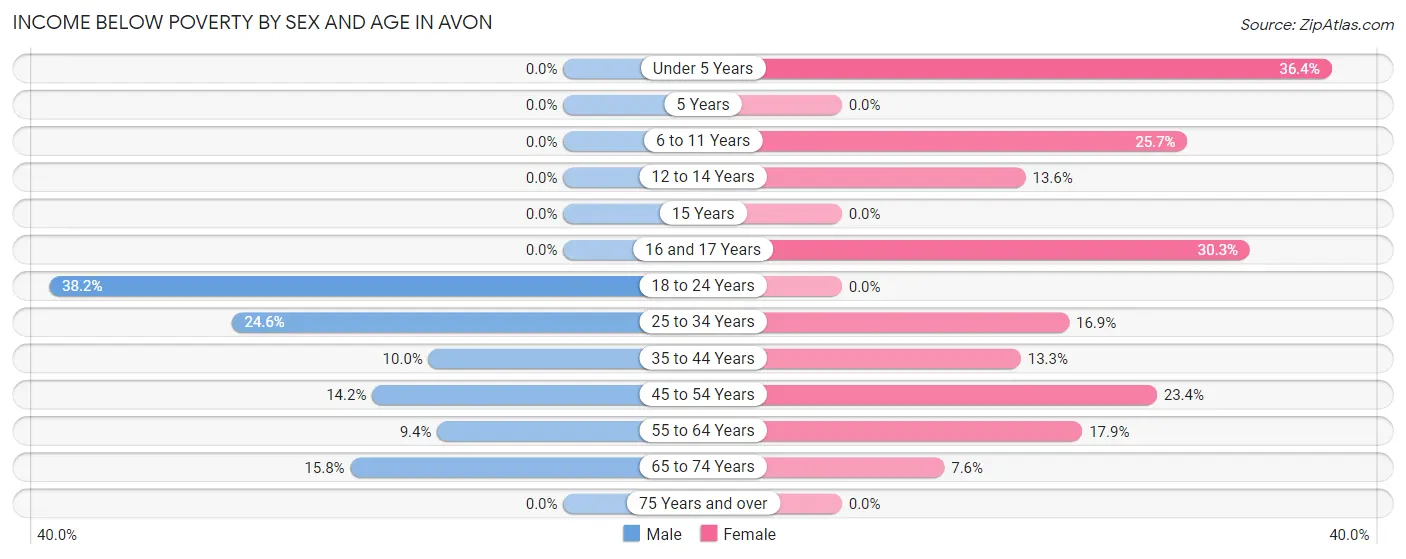
| Age Bracket | Male | Female |
| Under 5 Years | 0 (0.0%) | 16 (36.4%) |
| 5 Years | 0 (0.0%) | 0 (0.0%) |
| 6 to 11 Years | 0 (0.0%) | 39 (25.7%) |
| 12 to 14 Years | 0 (0.0%) | 9 (13.6%) |
| 15 Years | 0 (0.0%) | 0 (0.0%) |
| 16 and 17 Years | 0 (0.0%) | 20 (30.3%) |
| 18 to 24 Years | 42 (38.2%) | 0 (0.0%) |
| 25 to 34 Years | 52 (24.6%) | 28 (16.9%) |
| 35 to 44 Years | 23 (10.0%) | 19 (13.3%) |
| 45 to 54 Years | 21 (14.2%) | 40 (23.4%) |
| 55 to 64 Years | 22 (9.4%) | 53 (17.8%) |
| 65 to 74 Years | 37 (15.8%) | 21 (7.6%) |
| 75 Years and over | 0 (0.0%) | 0 (0.0%) |
| Total | 197 (11.9%) | 245 (14.5%) |
Income Above Poverty by Sex and Age in Avon
According to the poverty statistics in Avon, males aged under 5 years and females aged 5 years are the age groups that are most secure financially, with 100.0% of males and 100.0% of females in these age groups living above the poverty line.
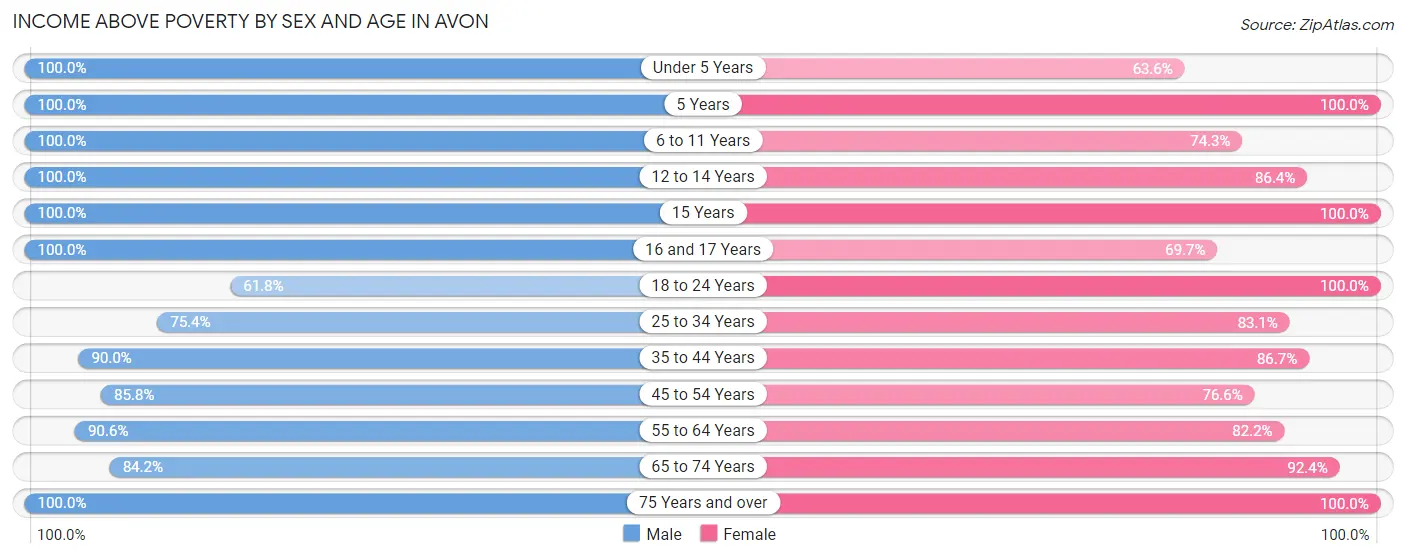
| Age Bracket | Male | Female |
| Under 5 Years | 125 (100.0%) | 28 (63.6%) |
| 5 Years | 11 (100.0%) | 16 (100.0%) |
| 6 to 11 Years | 113 (100.0%) | 113 (74.3%) |
| 12 to 14 Years | 14 (100.0%) | 57 (86.4%) |
| 15 Years | 47 (100.0%) | 29 (100.0%) |
| 16 and 17 Years | 49 (100.0%) | 46 (69.7%) |
| 18 to 24 Years | 68 (61.8%) | 121 (100.0%) |
| 25 to 34 Years | 159 (75.4%) | 138 (83.1%) |
| 35 to 44 Years | 207 (90.0%) | 124 (86.7%) |
| 45 to 54 Years | 127 (85.8%) | 131 (76.6%) |
| 55 to 64 Years | 213 (90.6%) | 244 (82.2%) |
| 65 to 74 Years | 197 (84.2%) | 255 (92.4%) |
| 75 Years and over | 125 (100.0%) | 147 (100.0%) |
| Total | 1,455 (88.1%) | 1,449 (85.5%) |
Income Below Poverty Among Married-Couple Families in Avon
The poverty statistics for married-couple families in Avon show that 4.0% or 28 of the total 700 families live below the poverty line. Families with no children have the highest poverty rate of 5.6%, comprising of 28 families. On the other hand, families with 1 or 2 children have the lowest poverty rate of 0.0%, which includes 0 families.
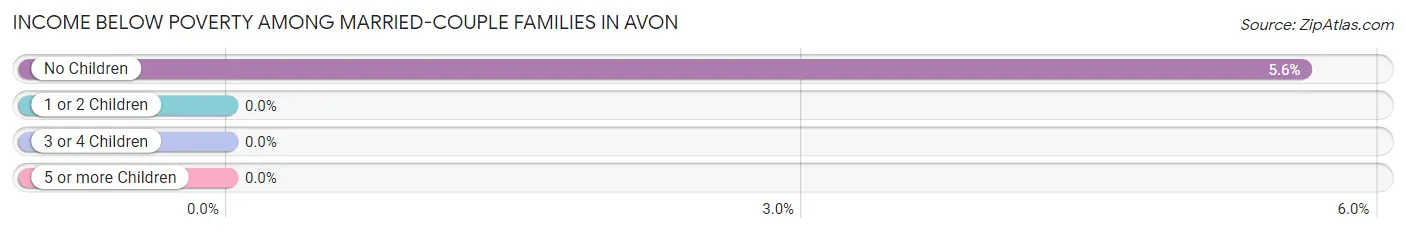
| Children | Above Poverty | Below Poverty |
| No Children | 471 (94.4%) | 28 (5.6%) |
| 1 or 2 Children | 159 (100.0%) | 0 (0.0%) |
| 3 or 4 Children | 42 (100.0%) | 0 (0.0%) |
| 5 or more Children | 0 (0.0%) | 0 (0.0%) |
| Total | 672 (96.0%) | 28 (4.0%) |
Income Below Poverty Among Single-Parent Households in Avon
According to the poverty data in Avon, 11.5% or 10 single-father households and 59.4% or 73 single-mother households are living below the poverty line. Among single-father households, those with 1 or 2 children have the highest poverty rate, with 10 households (18.9%) experiencing poverty. Likewise, among single-mother households, those with no children have the highest poverty rate, with 37 households (75.5%) falling below the poverty line.
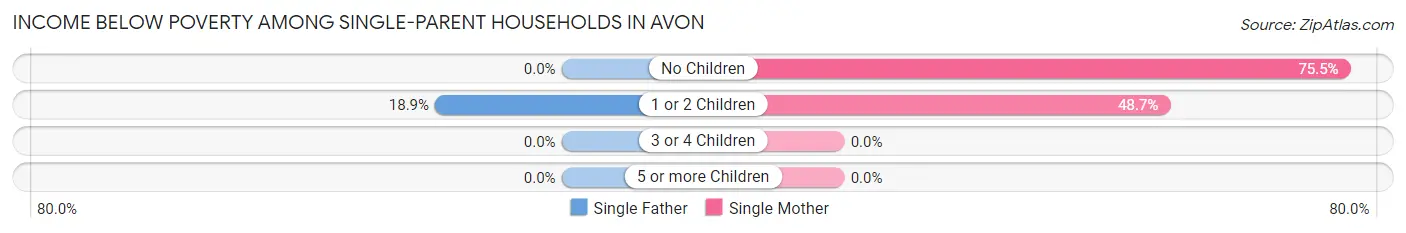
| Children | Single Father | Single Mother |
| No Children | 0 (0.0%) | 37 (75.5%) |
| 1 or 2 Children | 10 (18.9%) | 36 (48.6%) |
| 3 or 4 Children | 0 (0.0%) | 0 (0.0%) |
| 5 or more Children | 0 (0.0%) | 0 (0.0%) |
| Total | 10 (11.5%) | 73 (59.4%) |
Income Below Poverty Among Married-Couple vs Single-Parent Households in Avon
The poverty data for Avon shows that 28 of the married-couple family households (4.0%) and 83 of the single-parent households (39.5%) are living below the poverty level. Within the married-couple family households, those with no children have the highest poverty rate, with 28 households (5.6%) falling below the poverty line. Among the single-parent households, those with no children have the highest poverty rate, with 37 household (64.9%) living below poverty.
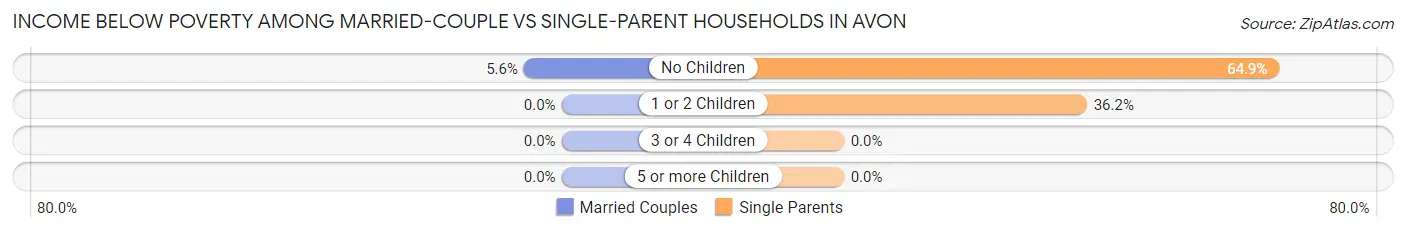
| Children | Married-Couple Families | Single-Parent Households |
| No Children | 28 (5.6%) | 37 (64.9%) |
| 1 or 2 Children | 0 (0.0%) | 46 (36.2%) |
| 3 or 4 Children | 0 (0.0%) | 0 (0.0%) |
| 5 or more Children | 0 (0.0%) | 0 (0.0%) |
| Total | 28 (4.0%) | 83 (39.5%) |
Race in Avon
The most populous races in Avon are White / Caucasian (3,292 | 97.2%), Hispanic or Latino (128 | 3.8%), and Two or more Races (64 | 1.9%).
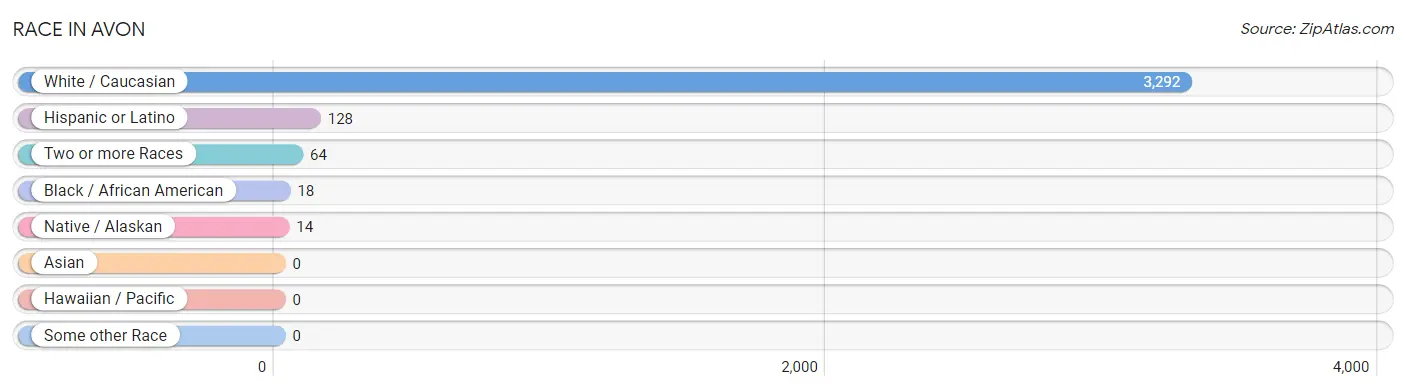
| Race | # Population | % Population |
| Asian | 0 | 0.0% |
| Black / African American | 18 | 0.5% |
| Hawaiian / Pacific | 0 | 0.0% |
| Hispanic or Latino | 128 | 3.8% |
| Native / Alaskan | 14 | 0.4% |
| White / Caucasian | 3,292 | 97.2% |
| Two or more Races | 64 | 1.9% |
| Some other Race | 0 | 0.0% |
| Total | 3,388 | 100.0% |
Ancestry in Avon
The most populous ancestries reported in Avon are German (813 | 24.0%), Irish (783 | 23.1%), English (600 | 17.7%), Italian (411 | 12.1%), and American (233 | 6.9%), together accounting for 83.8% of all Avon residents.
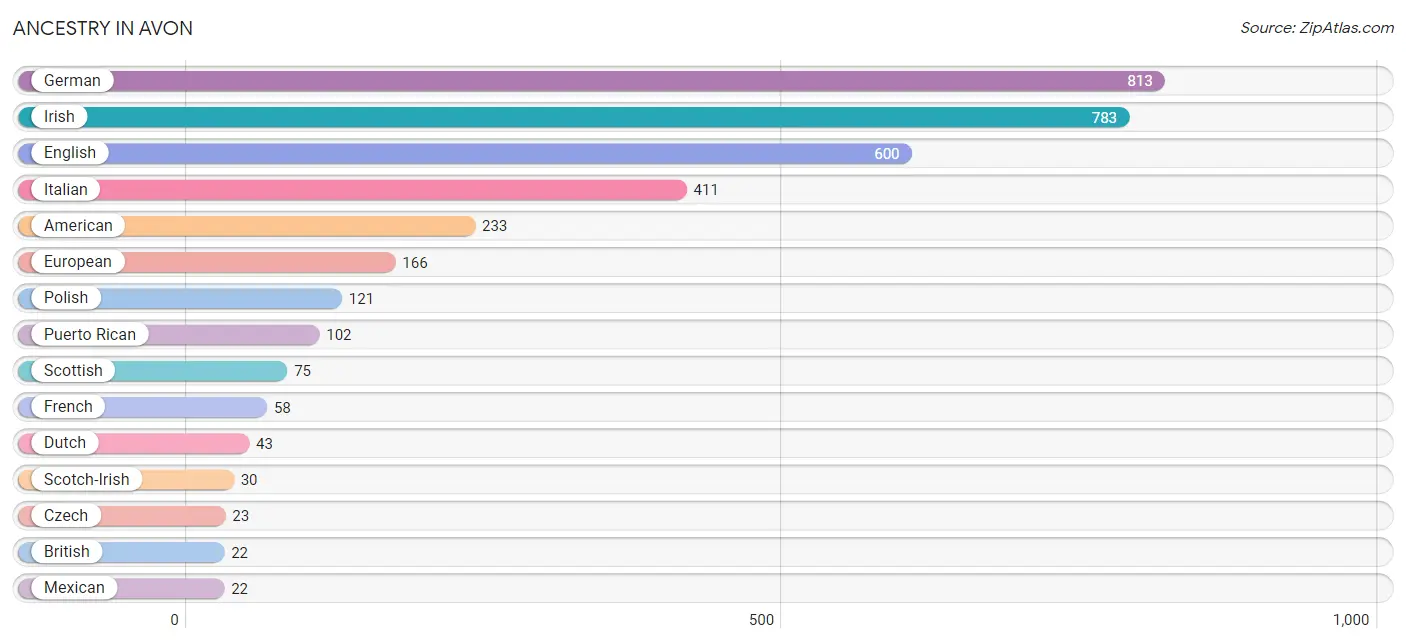
| Ancestry | # Population | % Population |
| American | 233 | 6.9% |
| Arab | 11 | 0.3% |
| Belgian | 10 | 0.3% |
| British | 22 | 0.6% |
| Burmese | 5 | 0.2% |
| Central American | 4 | 0.1% |
| Czech | 23 | 0.7% |
| Czechoslovakian | 18 | 0.5% |
| Danish | 12 | 0.4% |
| Dutch | 43 | 1.3% |
| Eastern European | 3 | 0.1% |
| English | 600 | 17.7% |
| European | 166 | 4.9% |
| French | 58 | 1.7% |
| French Canadian | 10 | 0.3% |
| German | 813 | 24.0% |
| Guatemalan | 4 | 0.1% |
| Hungarian | 11 | 0.3% |
| Irish | 783 | 23.1% |
| Iroquois | 15 | 0.4% |
| Italian | 411 | 12.1% |
| Lebanese | 11 | 0.3% |
| Mexican | 22 | 0.6% |
| Norwegian | 8 | 0.2% |
| Polish | 121 | 3.6% |
| Puerto Rican | 102 | 3.0% |
| Scotch-Irish | 30 | 0.9% |
| Scottish | 75 | 2.2% |
| Swedish | 10 | 0.3% |
| Swiss | 12 | 0.4% |
| Welsh | 20 | 0.6% | View All 31 Rows |
Immigrants in Avon
The most numerous immigrant groups reported in Avon came from Europe (27 | 0.8%), Canada (15 | 0.4%), Netherlands (11 | 0.3%), Western Europe (11 | 0.3%), and England (8 | 0.2%), together accounting for 2.1% of all Avon residents.
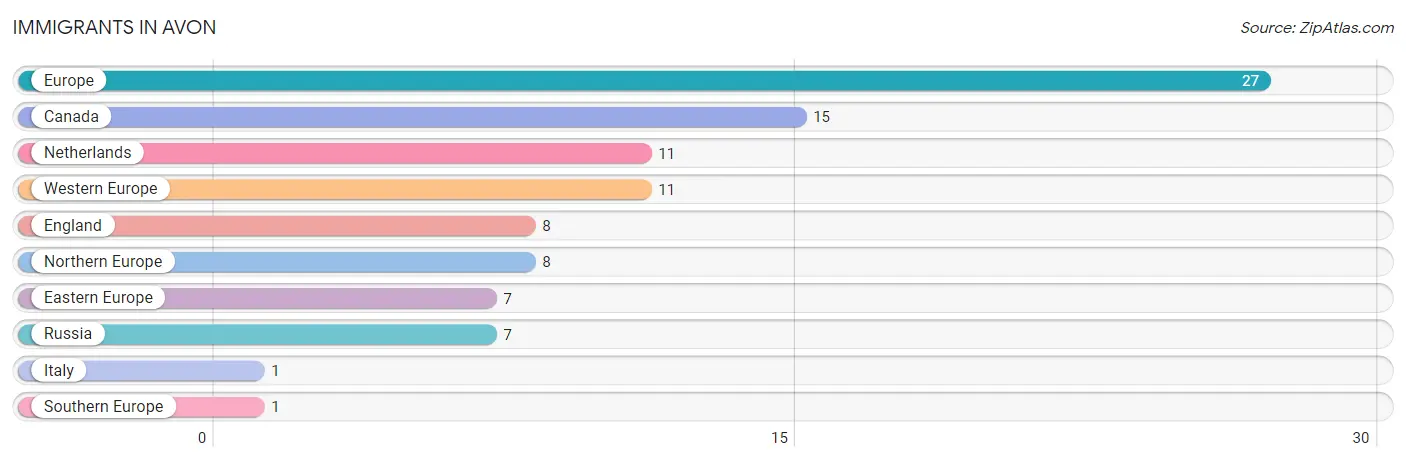
| Immigration Origin | # Population | % Population |
| Canada | 15 | 0.4% |
| Eastern Europe | 7 | 0.2% |
| England | 8 | 0.2% |
| Europe | 27 | 0.8% |
| Italy | 1 | 0.0% |
| Netherlands | 11 | 0.3% |
| Northern Europe | 8 | 0.2% |
| Russia | 7 | 0.2% |
| Southern Europe | 1 | 0.0% |
| Western Europe | 11 | 0.3% | View All 10 Rows |
Sex and Age in Avon
Sex and Age in Avon
The most populous age groups in Avon are 30 to 34 Years (166 | 10.0%) for men and 65 to 69 Years (201 | 11.6%) for women.
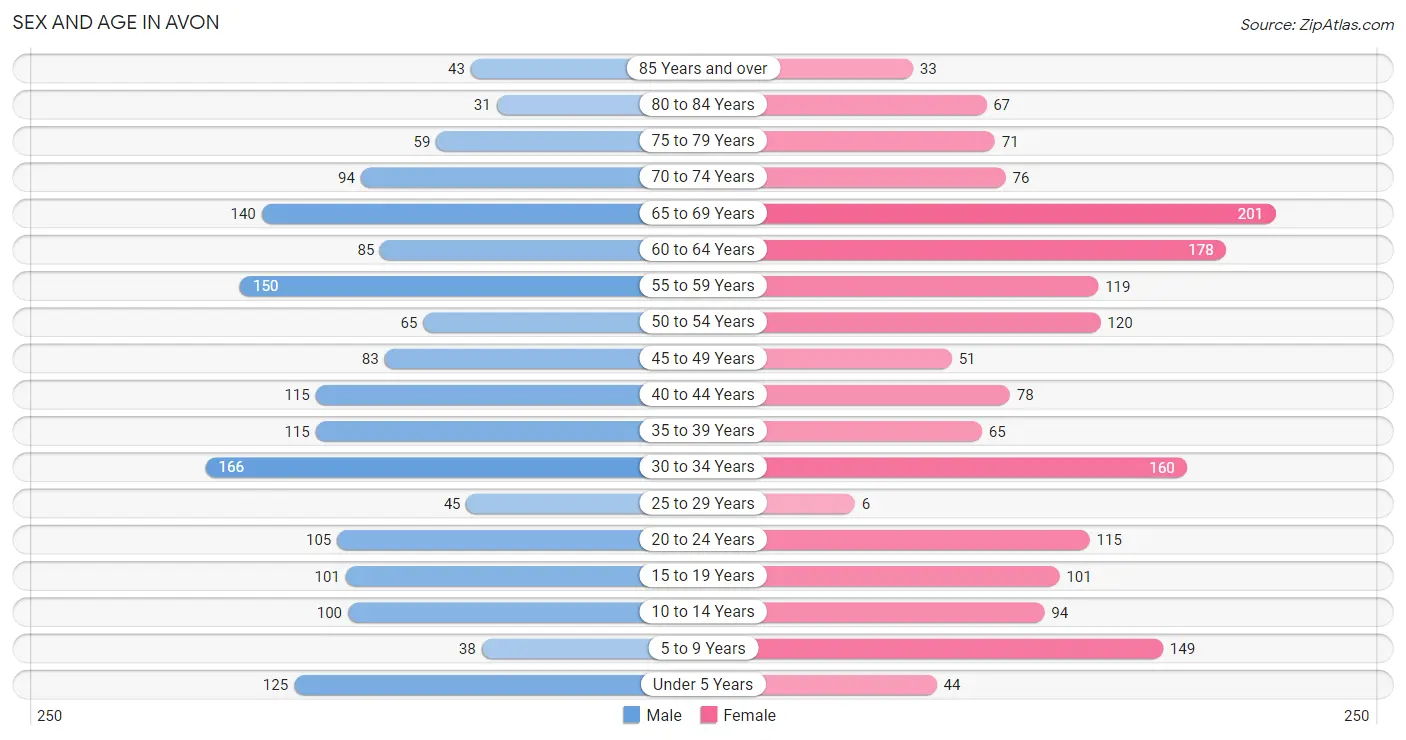
| Age Bracket | Male | Female |
| Under 5 Years | 125 (7.5%) | 44 (2.5%) |
| 5 to 9 Years | 38 (2.3%) | 149 (8.6%) |
| 10 to 14 Years | 100 (6.0%) | 94 (5.4%) |
| 15 to 19 Years | 101 (6.1%) | 101 (5.8%) |
| 20 to 24 Years | 105 (6.3%) | 115 (6.7%) |
| 25 to 29 Years | 45 (2.7%) | 6 (0.4%) |
| 30 to 34 Years | 166 (10.0%) | 160 (9.3%) |
| 35 to 39 Years | 115 (6.9%) | 65 (3.8%) |
| 40 to 44 Years | 115 (6.9%) | 78 (4.5%) |
| 45 to 49 Years | 83 (5.0%) | 51 (2.9%) |
| 50 to 54 Years | 65 (3.9%) | 120 (6.9%) |
| 55 to 59 Years | 150 (9.0%) | 119 (6.9%) |
| 60 to 64 Years | 85 (5.1%) | 178 (10.3%) |
| 65 to 69 Years | 140 (8.4%) | 201 (11.6%) |
| 70 to 74 Years | 94 (5.7%) | 76 (4.4%) |
| 75 to 79 Years | 59 (3.5%) | 71 (4.1%) |
| 80 to 84 Years | 31 (1.9%) | 67 (3.9%) |
| 85 Years and over | 43 (2.6%) | 33 (1.9%) |
| Total | 1,660 (100.0%) | 1,728 (100.0%) |
Families and Households in Avon
Median Family Size in Avon
The median family size in Avon is 2.75 persons per family, with single male/father families (87 | 9.6%) accounting for the largest median family size of 3.36 persons per family. On the other hand, single female/mother families (123 | 13.5%) represent the smallest median family size with 2.43 persons per family.
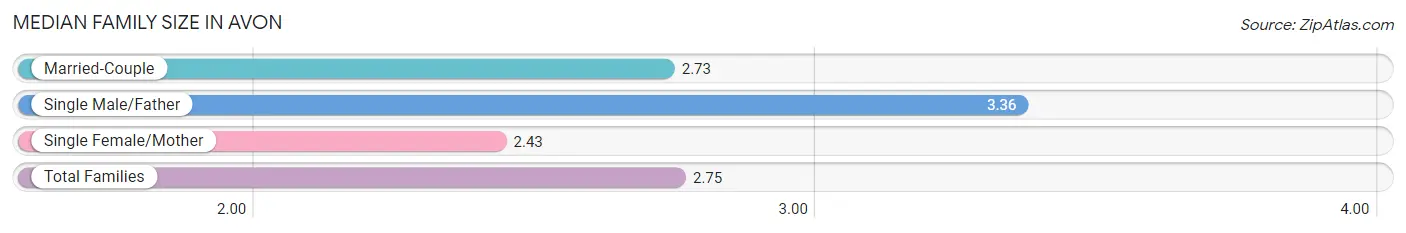
| Family Type | # Families | Family Size |
| Married-Couple | 700 (76.9%) | 2.73 |
| Single Male/Father | 87 (9.6%) | 3.36 |
| Single Female/Mother | 123 (13.5%) | 2.43 |
| Total Families | 910 (100.0%) | 2.75 |
Median Household Size in Avon
The median household size in Avon is 2.29 persons per household, with single male/father households (87 | 6.0%) accounting for the largest median household size of 3.6 persons per household. non-family households (543 | 37.4%) represent the smallest median household size with 1.41 persons per household.
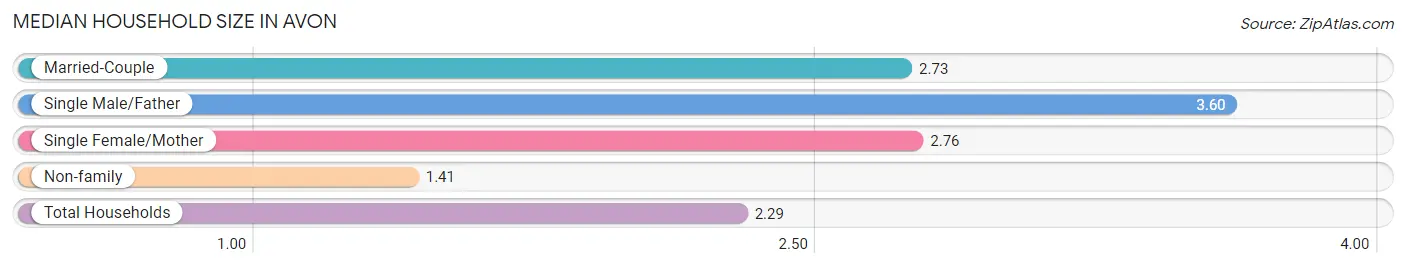
| Household Type | # Households | Household Size |
| Married-Couple | 700 (48.2%) | 2.73 |
| Single Male/Father | 87 (6.0%) | 3.60 |
| Single Female/Mother | 123 (8.5%) | 2.76 |
| Non-family | 543 (37.4%) | 1.41 |
| Total Households | 1,453 (100.0%) | 2.29 |
Household Size by Marriage Status in Avon
Out of a total of 1,453 households in Avon, 910 (62.6%) are family households, while 543 (37.4%) are nonfamily households. The most numerous type of family households are 2-person households, comprising 536, and the most common type of nonfamily households are 1-person households, comprising 405.
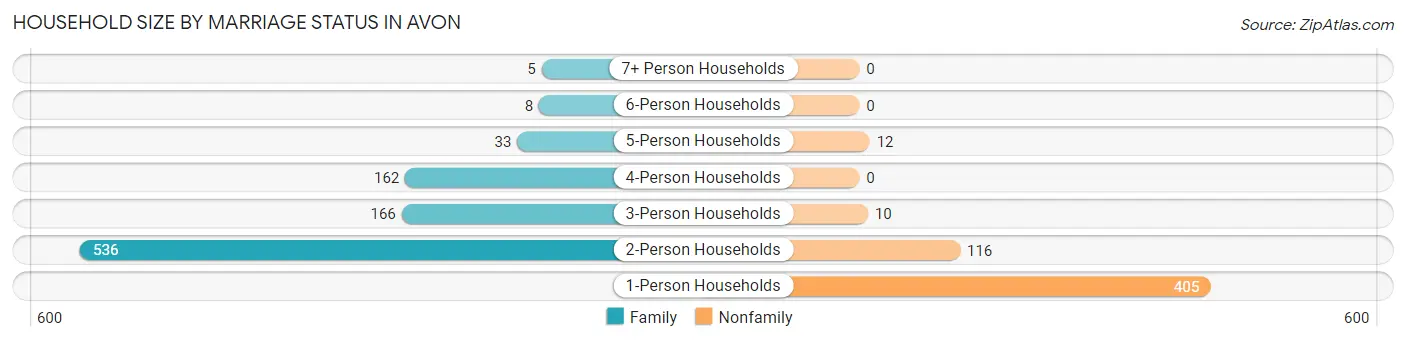
| Household Size | Family Households | Nonfamily Households |
| 1-Person Households | - | 405 (27.9%) |
| 2-Person Households | 536 (36.9%) | 116 (8.0%) |
| 3-Person Households | 166 (11.4%) | 10 (0.7%) |
| 4-Person Households | 162 (11.2%) | 0 (0.0%) |
| 5-Person Households | 33 (2.3%) | 12 (0.8%) |
| 6-Person Households | 8 (0.5%) | 0 (0.0%) |
| 7+ Person Households | 5 (0.3%) | 0 (0.0%) |
| Total | 910 (62.6%) | 543 (37.4%) |
Female Fertility in Avon
Fertility by Age in Avon
Average fertility rate in Avon is 77.0 births per 1,000 women. Women in the age bracket of 20 to 34 years have the highest fertility rate with 164.0 births per 1,000 women. Women in the age bracket of 20 to 34 years acount for 100.0% of all women with births.
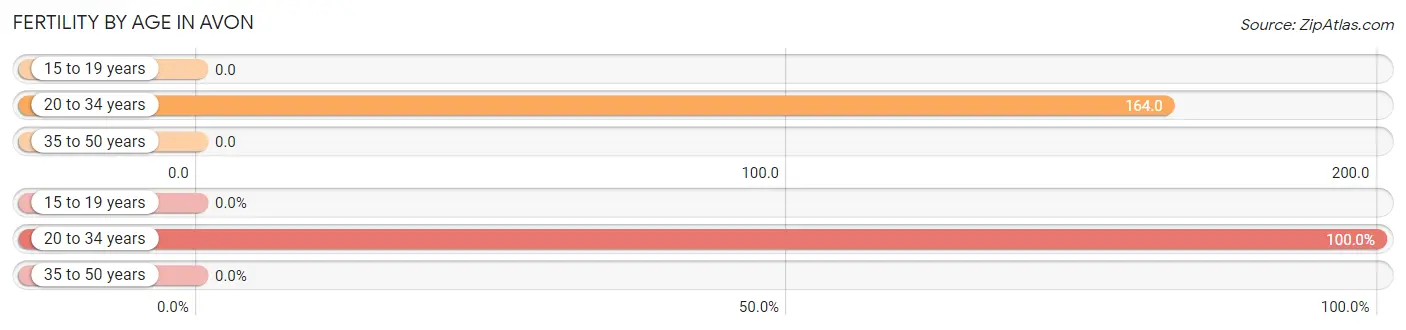
| Age Bracket | Women with Births | Births / 1,000 Women |
| 15 to 19 years | 0 (0.0%) | 0.0 |
| 20 to 34 years | 46 (100.0%) | 164.0 |
| 35 to 50 years | 0 (0.0%) | 0.0 |
| Total | 46 (100.0%) | 77.0 |
Fertility by Age by Marriage Status in Avon
69.6% of women with births (46) in Avon are married. The highest percentage of unmarried women with births falls into 20 to 34 years age bracket with 30.4% of them unmarried at the time of birth, while the lowest percentage of unmarried women with births belong to 20 to 34 years age bracket with 30.4% of them unmarried.
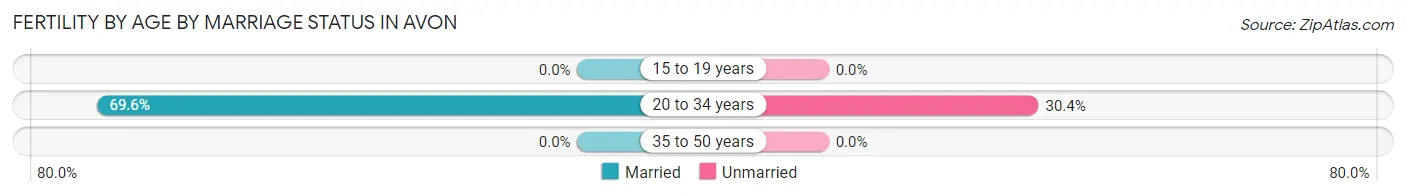
| Age Bracket | Married | Unmarried |
| 15 to 19 years | 0 (0.0%) | 0 (0.0%) |
| 20 to 34 years | 32 (69.6%) | 14 (30.4%) |
| 35 to 50 years | 0 (0.0%) | 0 (0.0%) |
| Total | 32 (69.6%) | 14 (30.4%) |
Fertility by Education in Avon
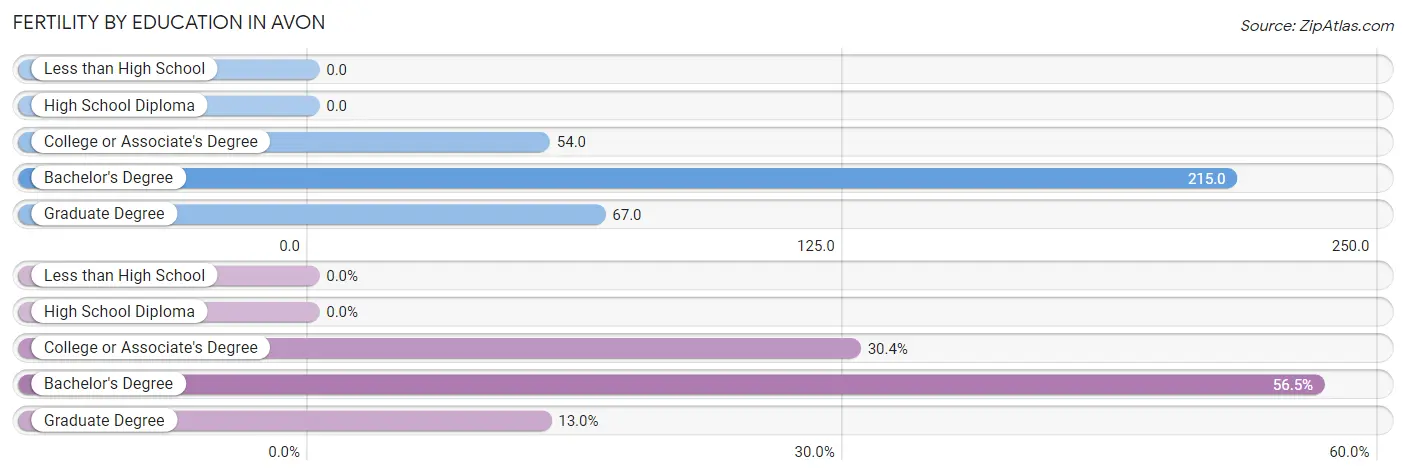
| Educational Attainment | Women with Births | Births / 1,000 Women |
| Less than High School | 0 (0.0%) | 0.0 |
| High School Diploma | 0 (0.0%) | 0.0 |
| College or Associate's Degree | 14 (30.4%) | 54.0 |
| Bachelor's Degree | 26 (56.5%) | 215.0 |
| Graduate Degree | 6 (13.0%) | 67.0 |
| Total | 46 (100.0%) | 77.0 |
Fertility by Education by Marriage Status in Avon
30.4% of women with births in Avon are unmarried. Women with the educational attainment of bachelor's degree are most likely to be married with 100.0% of them married at childbirth, while women with the educational attainment of college or associate's degree are least likely to be married with 100.0% of them unmarried at childbirth.
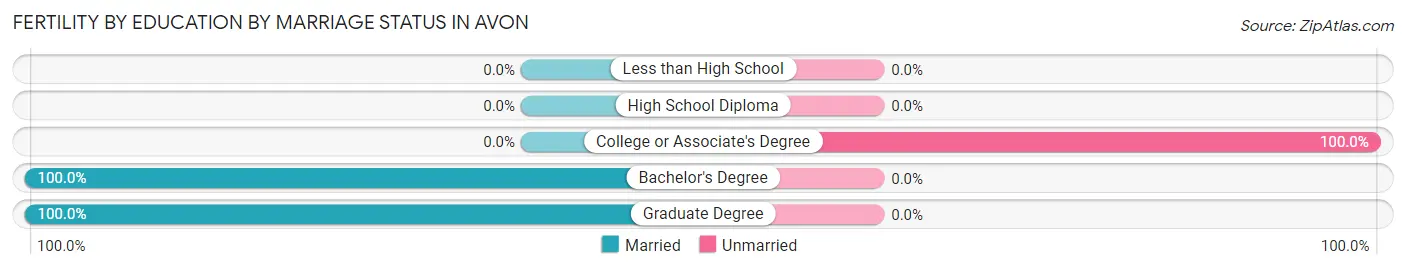
| Educational Attainment | Married | Unmarried |
| Less than High School | 0 (0.0%) | 0 (0.0%) |
| High School Diploma | 0 (0.0%) | 0 (0.0%) |
| College or Associate's Degree | 0 (0.0%) | 14 (100.0%) |
| Bachelor's Degree | 26 (100.0%) | 0 (0.0%) |
| Graduate Degree | 6 (100.0%) | 0 (0.0%) |
| Total | 32 (69.6%) | 14 (30.4%) |
Employment Characteristics in Avon
Employment by Class of Employer in Avon
Among the 1,674 employed individuals in Avon, private company employees (1,103 | 65.9%), local government employees (207 | 12.4%), and not-for-profit organizations (166 | 9.9%) make up the most common classes of employment.
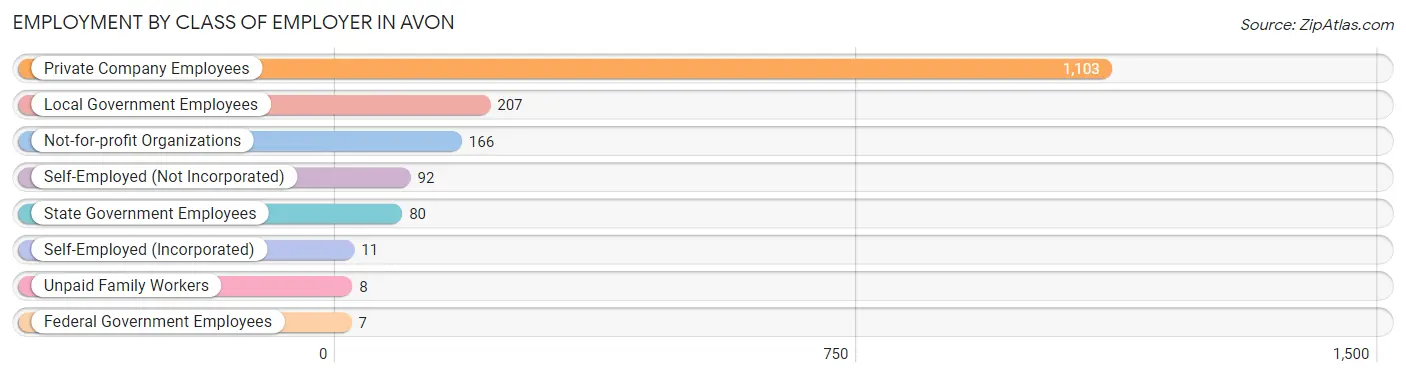
| Employer Class | # Employees | % Employees |
| Private Company Employees | 1,103 | 65.9% |
| Self-Employed (Incorporated) | 11 | 0.7% |
| Self-Employed (Not Incorporated) | 92 | 5.5% |
| Not-for-profit Organizations | 166 | 9.9% |
| Local Government Employees | 207 | 12.4% |
| State Government Employees | 80 | 4.8% |
| Federal Government Employees | 7 | 0.4% |
| Unpaid Family Workers | 8 | 0.5% |
| Total | 1,674 | 100.0% |
Employment Status by Age in Avon
According to the labor force statistics for Avon, out of the total population over 16 years of age (2,762), 62.8% or 1,735 individuals are in the labor force, with 3.1% or 54 of them unemployed. The age group with the highest labor force participation rate is 20 to 24 years, with 100.0% or 220 individuals in the labor force. Within the labor force, the 75 years and over age range has the highest percentage of unemployed individuals, with 36.7% or 11 of them being unemployed.
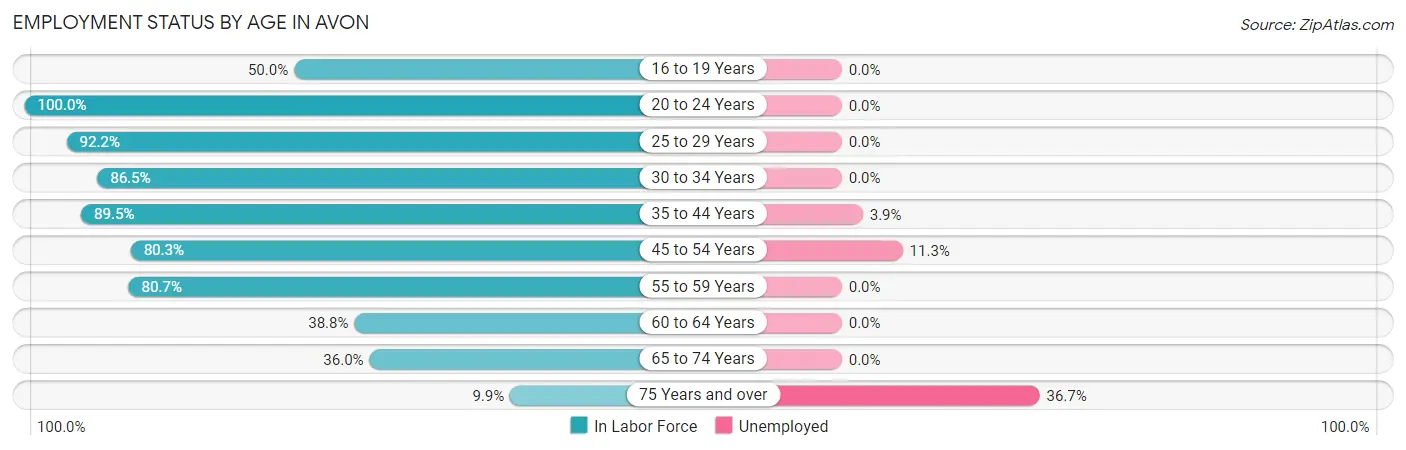
| Age Bracket | In Labor Force | Unemployed |
| 16 to 19 Years | 63 (50.0%) | 0 (0.0%) |
| 20 to 24 Years | 220 (100.0%) | 0 (0.0%) |
| 25 to 29 Years | 47 (92.2%) | 0 (0.0%) |
| 30 to 34 Years | 282 (86.5%) | 0 (0.0%) |
| 35 to 44 Years | 334 (89.5%) | 13 (3.9%) |
| 45 to 54 Years | 256 (80.3%) | 29 (11.3%) |
| 55 to 59 Years | 217 (80.7%) | 0 (0.0%) |
| 60 to 64 Years | 102 (38.8%) | 0 (0.0%) |
| 65 to 74 Years | 184 (36.0%) | 0 (0.0%) |
| 75 Years and over | 30 (9.9%) | 11 (36.7%) |
| Total | 1,735 (62.8%) | 54 (3.1%) |
Employment Status by Educational Attainment in Avon
According to labor force statistics for Avon, 77.3% of individuals (1,238) out of the total population between 25 and 64 years of age (1,601) are in the labor force, with 3.4% or 42 of them being unemployed. The group with the highest labor force participation rate are those with the educational attainment of bachelor's degree or higher, with 88.2% or 502 individuals in the labor force. Within the labor force, individuals with high school diploma education have the highest percentage of unemployment, with 10.0% or 29 of them being unemployed.
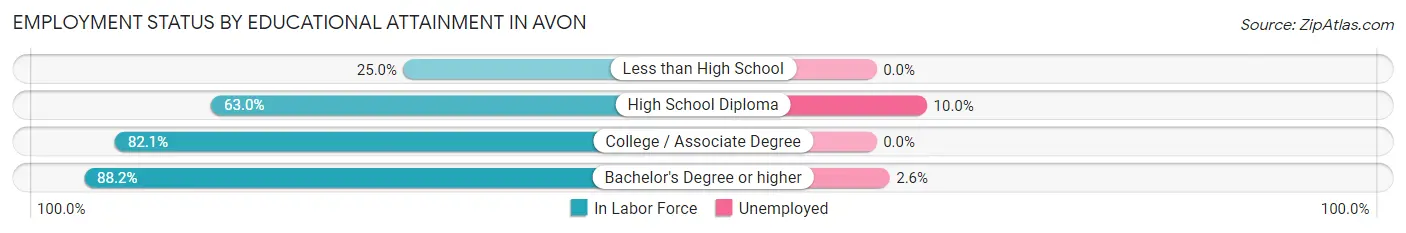
| Educational Attainment | In Labor Force | Unemployed |
| Less than High School | 10 (25.0%) | 0 (0.0%) |
| High School Diploma | 291 (63.0%) | 46 (10.0%) |
| College / Associate Degree | 435 (82.1%) | 0 (0.0%) |
| Bachelor's Degree or higher | 502 (88.2%) | 15 (2.6%) |
| Total | 1,238 (77.3%) | 54 (3.4%) |
Employment Occupations by Sex in Avon
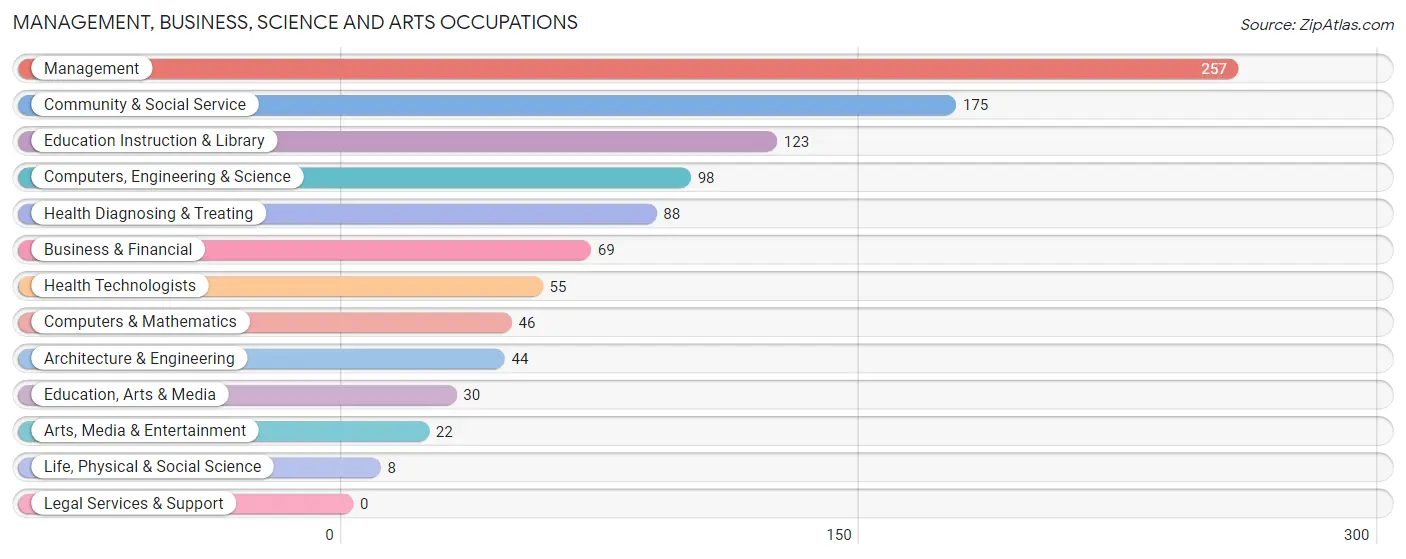
Management, Business, Science and Arts Occupations
The most common Management, Business, Science and Arts occupations in Avon are Management (257 | 15.3%), Community & Social Service (175 | 10.4%), Education Instruction & Library (123 | 7.3%), Computers, Engineering & Science (98 | 5.8%), and Health Diagnosing & Treating (88 | 5.2%).
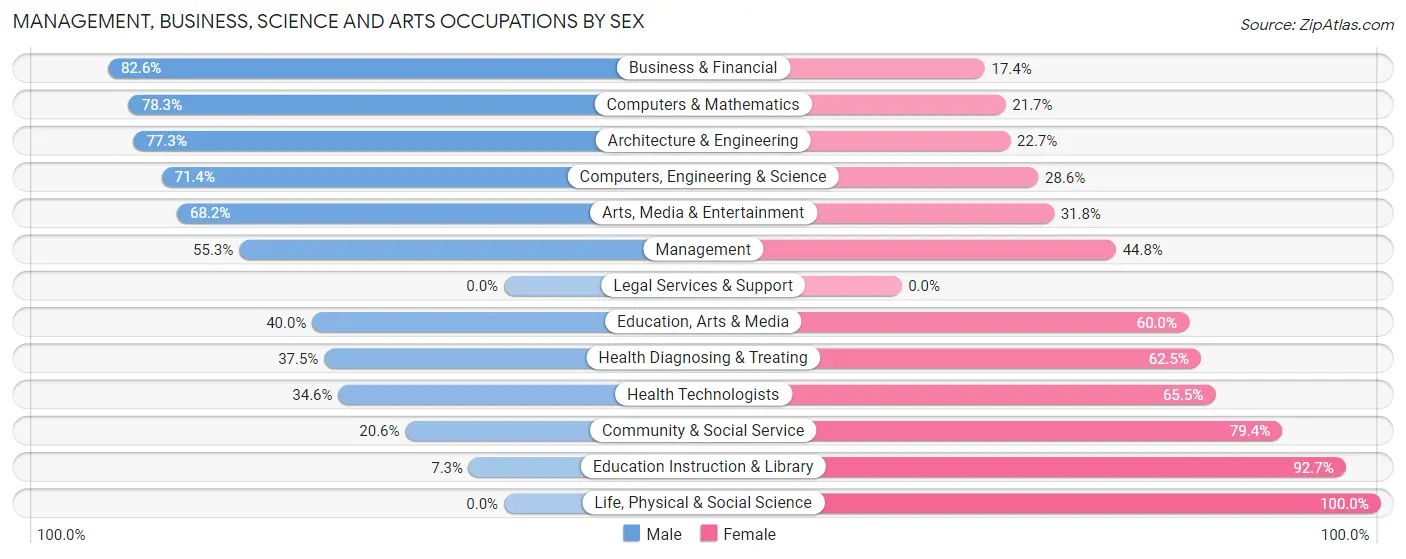
Management, Business, Science and Arts Occupations by Sex
Within the Management, Business, Science and Arts occupations in Avon, the most male-oriented occupations are Business & Financial (82.6%), Computers & Mathematics (78.3%), and Architecture & Engineering (77.3%), while the most female-oriented occupations are Life, Physical & Social Science (100.0%), Education Instruction & Library (92.7%), and Community & Social Service (79.4%).
| Occupation | Male | Female |
| Management | 142 (55.2%) | 115 (44.8%) |
| Business & Financial | 57 (82.6%) | 12 (17.4%) |
| Computers, Engineering & Science | 70 (71.4%) | 28 (28.6%) |
| Computers & Mathematics | 36 (78.3%) | 10 (21.7%) |
| Architecture & Engineering | 34 (77.3%) | 10 (22.7%) |
| Life, Physical & Social Science | 0 (0.0%) | 8 (100.0%) |
| Community & Social Service | 36 (20.6%) | 139 (79.4%) |
| Education, Arts & Media | 12 (40.0%) | 18 (60.0%) |
| Legal Services & Support | 0 (0.0%) | 0 (0.0%) |
| Education Instruction & Library | 9 (7.3%) | 114 (92.7%) |
| Arts, Media & Entertainment | 15 (68.2%) | 7 (31.8%) |
| Health Diagnosing & Treating | 33 (37.5%) | 55 (62.5%) |
| Health Technologists | 19 (34.5%) | 36 (65.4%) |
| Total (Category) | 338 (49.2%) | 349 (50.8%) |
| Total (Overall) | 959 (57.0%) | 723 (43.0%) |
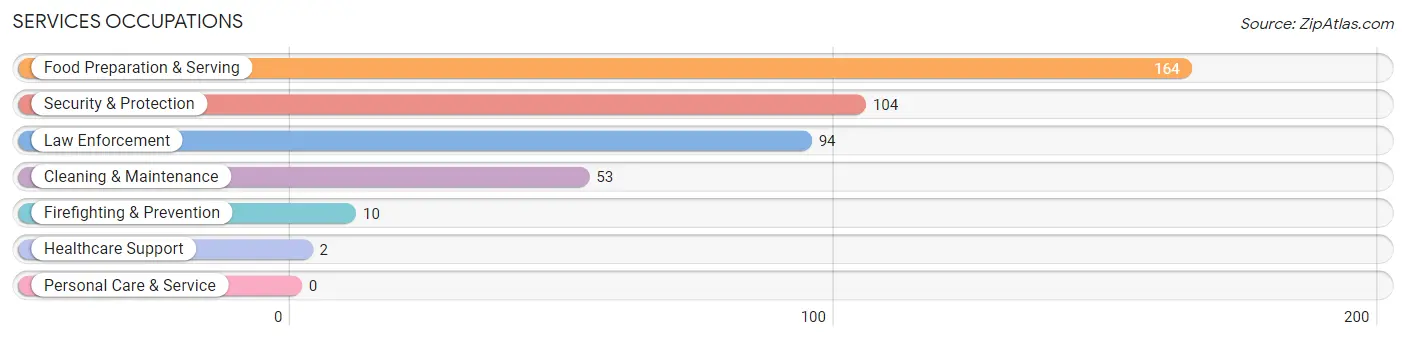
Services Occupations
The most common Services occupations in Avon are Food Preparation & Serving (164 | 9.8%), Security & Protection (104 | 6.2%), Law Enforcement (94 | 5.6%), Cleaning & Maintenance (53 | 3.2%), and Firefighting & Prevention (10 | 0.6%).
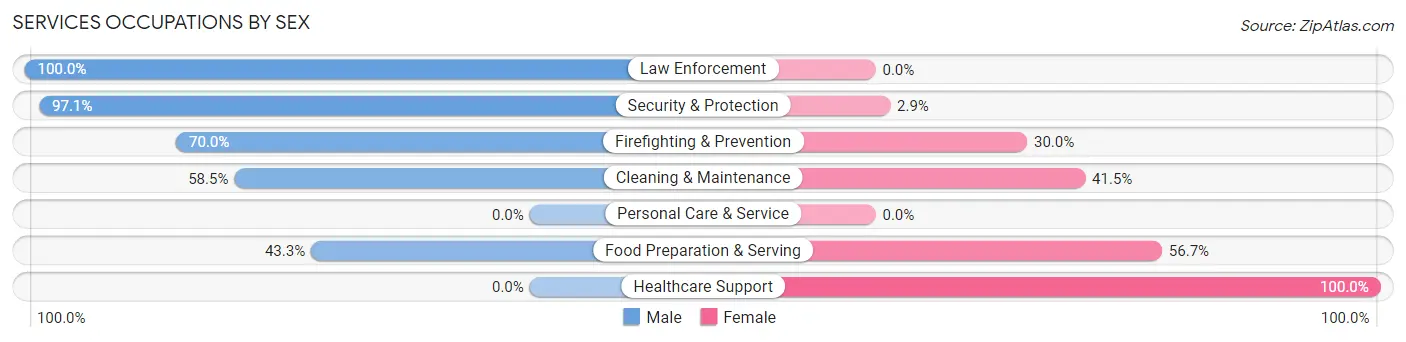
Services Occupations by Sex
Within the Services occupations in Avon, the most male-oriented occupations are Law Enforcement (100.0%), Security & Protection (97.1%), and Firefighting & Prevention (70.0%), while the most female-oriented occupations are Healthcare Support (100.0%), Food Preparation & Serving (56.7%), and Cleaning & Maintenance (41.5%).
| Occupation | Male | Female |
| Healthcare Support | 0 (0.0%) | 2 (100.0%) |
| Security & Protection | 101 (97.1%) | 3 (2.9%) |
| Firefighting & Prevention | 7 (70.0%) | 3 (30.0%) |
| Law Enforcement | 94 (100.0%) | 0 (0.0%) |
| Food Preparation & Serving | 71 (43.3%) | 93 (56.7%) |
| Cleaning & Maintenance | 31 (58.5%) | 22 (41.5%) |
| Personal Care & Service | 0 (0.0%) | 0 (0.0%) |
| Total (Category) | 203 (62.8%) | 120 (37.1%) |
| Total (Overall) | 959 (57.0%) | 723 (43.0%) |
Sales and Office Occupations
The most common Sales and Office occupations in Avon are Office & Administration (182 | 10.8%), and Sales & Related (172 | 10.2%).
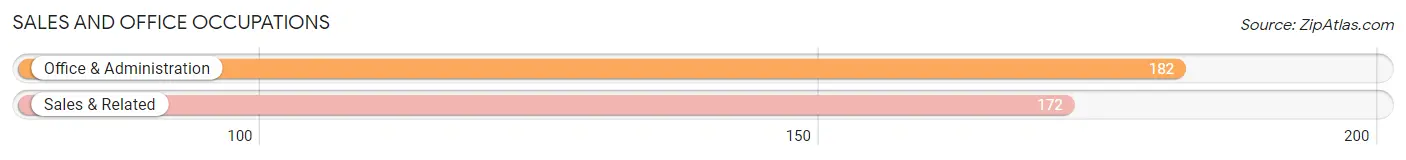
Sales and Office Occupations by Sex
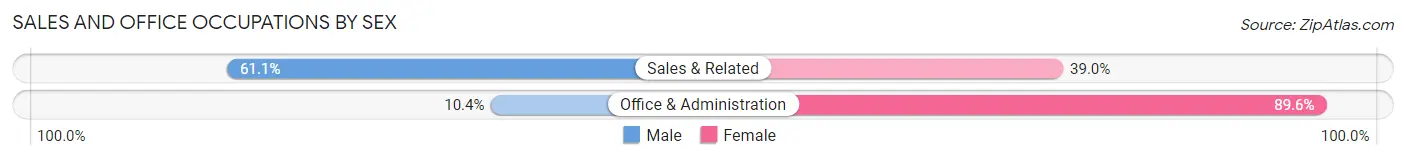
| Occupation | Male | Female |
| Sales & Related | 105 (61.1%) | 67 (39.0%) |
| Office & Administration | 19 (10.4%) | 163 (89.6%) |
| Total (Category) | 124 (35.0%) | 230 (65.0%) |
| Total (Overall) | 959 (57.0%) | 723 (43.0%) |
Natural Resources, Construction and Maintenance Occupations
The most common Natural Resources, Construction and Maintenance occupations in Avon are Construction & Extraction (104 | 6.2%), and Installation, Maintenance & Repair (18 | 1.1%).
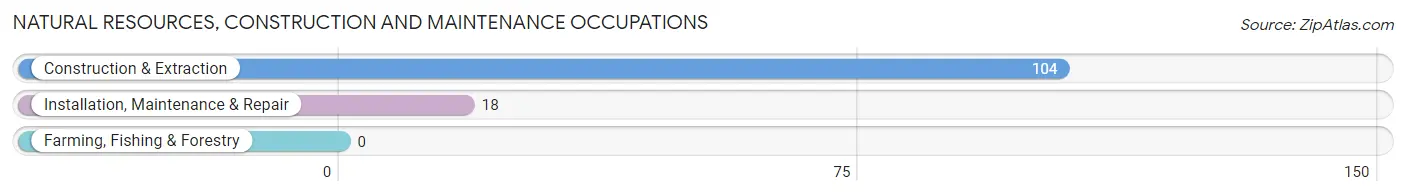
Natural Resources, Construction and Maintenance Occupations by Sex
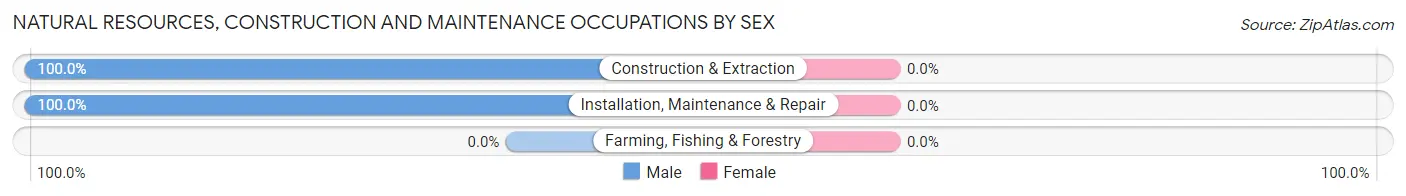
| Occupation | Male | Female |
| Farming, Fishing & Forestry | 0 (0.0%) | 0 (0.0%) |
| Construction & Extraction | 104 (100.0%) | 0 (0.0%) |
| Installation, Maintenance & Repair | 18 (100.0%) | 0 (0.0%) |
| Total (Category) | 122 (100.0%) | 0 (0.0%) |
| Total (Overall) | 959 (57.0%) | 723 (43.0%) |
Production, Transportation and Moving Occupations
The most common Production, Transportation and Moving occupations in Avon are Transportation (77 | 4.6%), Production (62 | 3.7%), and Material Moving (57 | 3.4%).
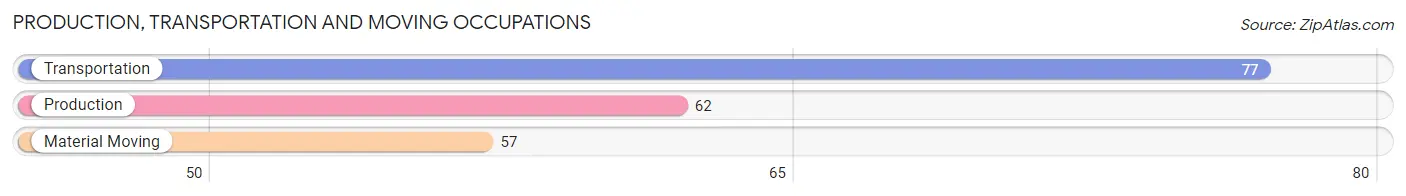
Production, Transportation and Moving Occupations by Sex
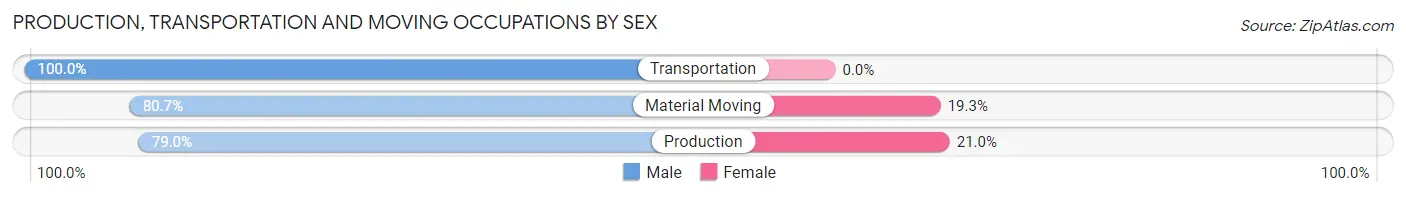
| Occupation | Male | Female |
| Production | 49 (79.0%) | 13 (21.0%) |
| Transportation | 77 (100.0%) | 0 (0.0%) |
| Material Moving | 46 (80.7%) | 11 (19.3%) |
| Total (Category) | 172 (87.8%) | 24 (12.2%) |
| Total (Overall) | 959 (57.0%) | 723 (43.0%) |
Employment Industries by Sex in Avon
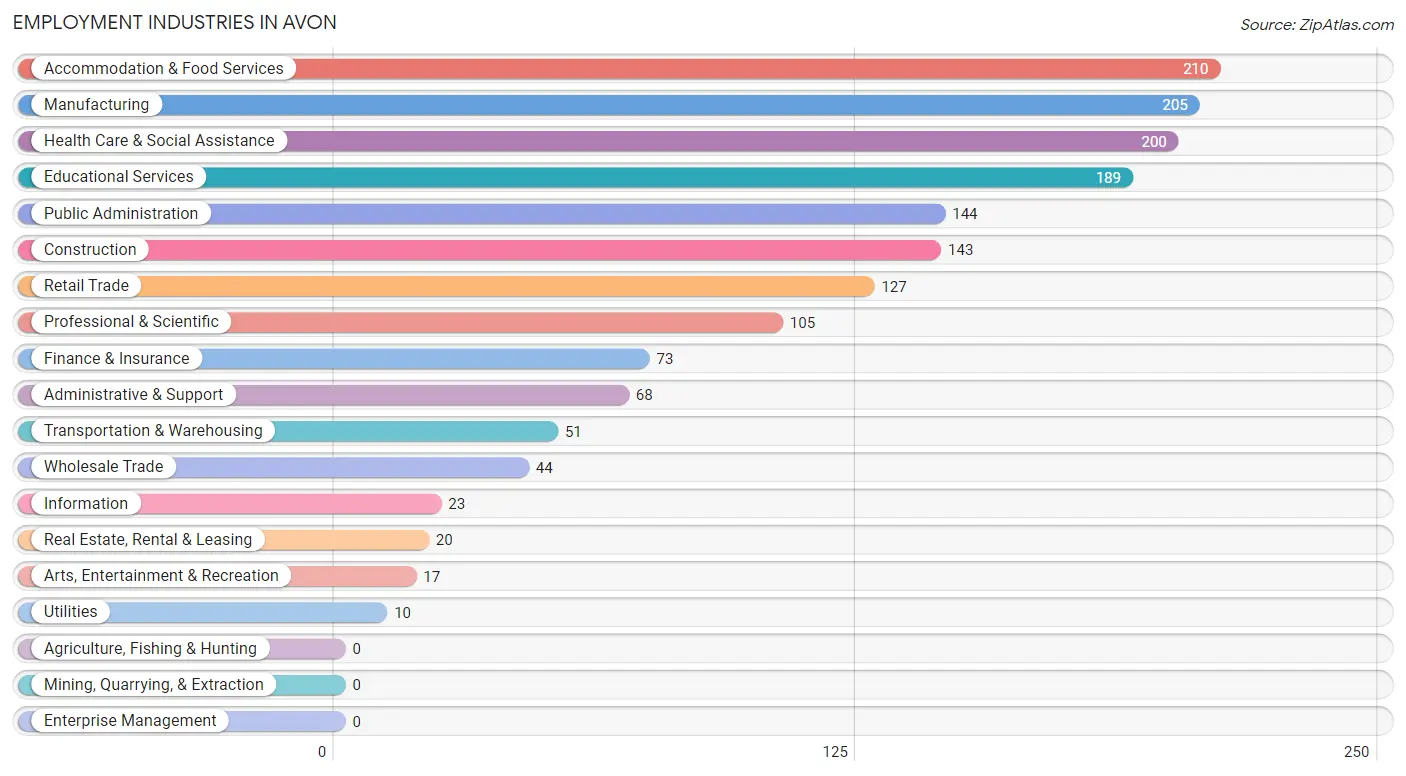
Employment Industries in Avon
The major employment industries in Avon include Accommodation & Food Services (210 | 12.5%), Manufacturing (205 | 12.2%), Health Care & Social Assistance (200 | 11.9%), Educational Services (189 | 11.2%), and Public Administration (144 | 8.6%).
Employment Industries by Sex in Avon
The Avon industries that see more men than women are Transportation & Warehousing (100.0%), Construction (97.2%), and Finance & Insurance (86.3%), whereas the industries that tend to have a higher number of women are Utilities (100.0%), Real Estate, Rental & Leasing (100.0%), and Educational Services (78.3%).
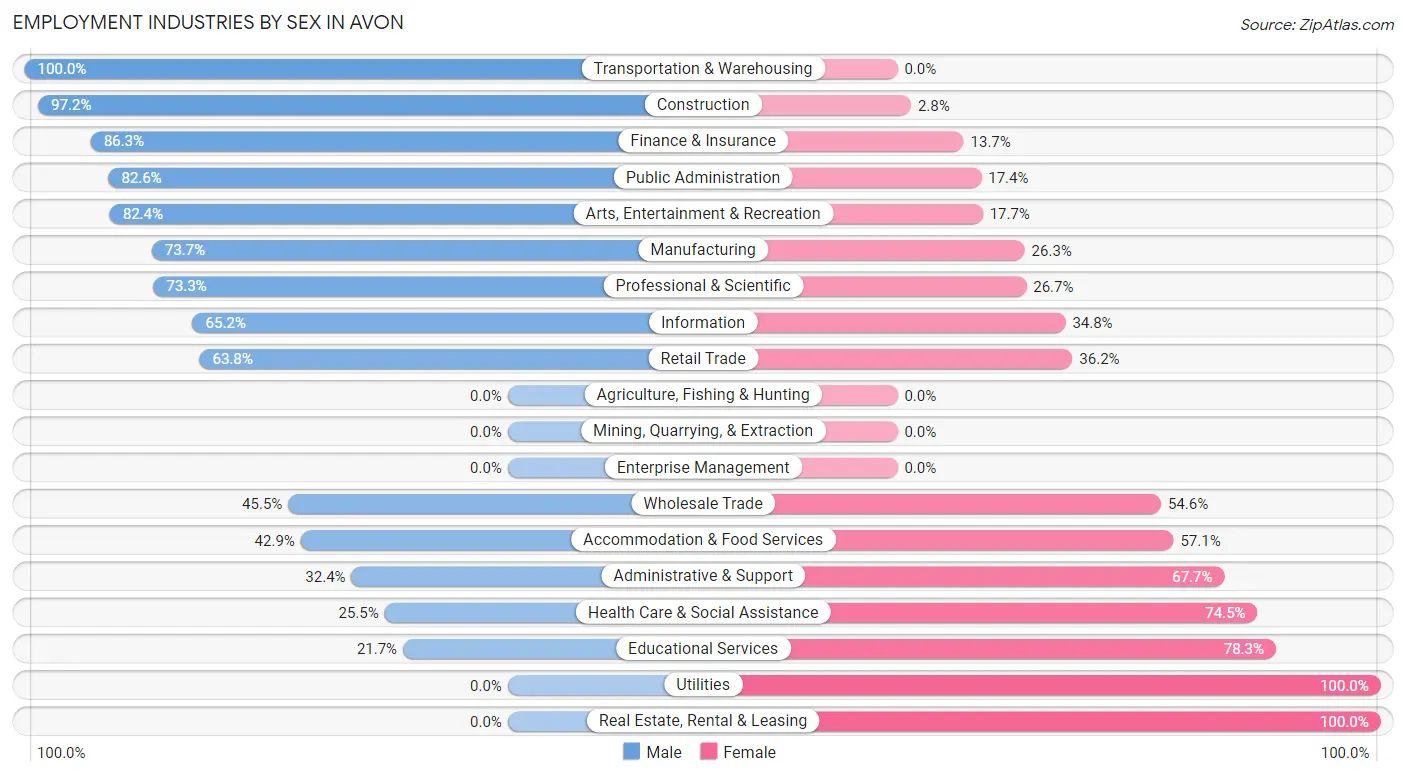
| Industry | Male | Female |
| Agriculture, Fishing & Hunting | 0 (0.0%) | 0 (0.0%) |
| Mining, Quarrying, & Extraction | 0 (0.0%) | 0 (0.0%) |
| Construction | 139 (97.2%) | 4 (2.8%) |
| Manufacturing | 151 (73.7%) | 54 (26.3%) |
| Wholesale Trade | 20 (45.5%) | 24 (54.5%) |
| Retail Trade | 81 (63.8%) | 46 (36.2%) |
| Transportation & Warehousing | 51 (100.0%) | 0 (0.0%) |
| Utilities | 0 (0.0%) | 10 (100.0%) |
| Information | 15 (65.2%) | 8 (34.8%) |
| Finance & Insurance | 63 (86.3%) | 10 (13.7%) |
| Real Estate, Rental & Leasing | 0 (0.0%) | 20 (100.0%) |
| Professional & Scientific | 77 (73.3%) | 28 (26.7%) |
| Enterprise Management | 0 (0.0%) | 0 (0.0%) |
| Administrative & Support | 22 (32.4%) | 46 (67.6%) |
| Educational Services | 41 (21.7%) | 148 (78.3%) |
| Health Care & Social Assistance | 51 (25.5%) | 149 (74.5%) |
| Arts, Entertainment & Recreation | 14 (82.4%) | 3 (17.6%) |
| Accommodation & Food Services | 90 (42.9%) | 120 (57.1%) |
| Public Administration | 119 (82.6%) | 25 (17.4%) |
| Total | 959 (57.0%) | 723 (43.0%) |
Education in Avon
School Enrollment in Avon
The most common levels of schooling among the 670 students in Avon are high school (177 | 26.4%), elementary school (147 | 21.9%), and middle school (136 | 20.3%).
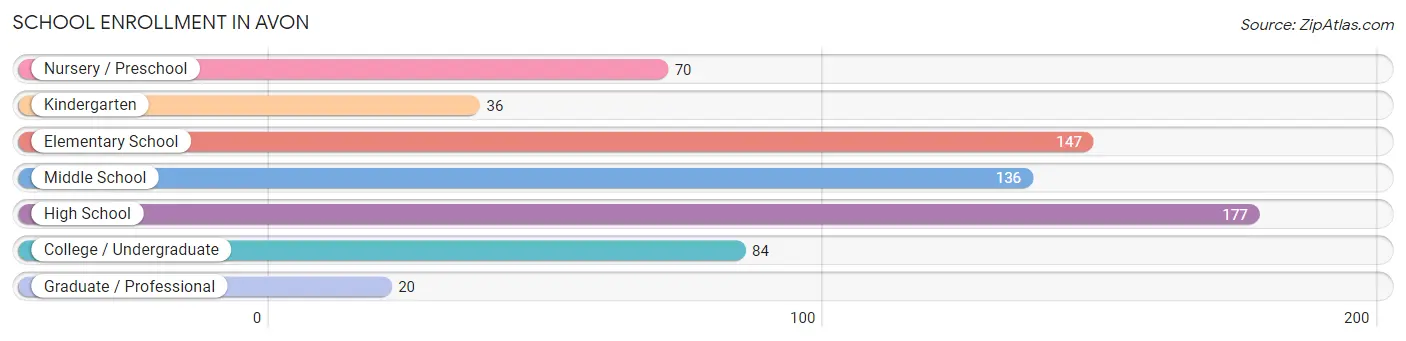
| School Level | # Students | % Students |
| Nursery / Preschool | 70 | 10.4% |
| Kindergarten | 36 | 5.4% |
| Elementary School | 147 | 21.9% |
| Middle School | 136 | 20.3% |
| High School | 177 | 26.4% |
| College / Undergraduate | 84 | 12.5% |
| Graduate / Professional | 20 | 3.0% |
| Total | 670 | 100.0% |
School Enrollment by Age by Funding Source in Avon
Out of a total of 670 students who are enrolled in schools in Avon, 98 (14.6%) attend a private institution, while the remaining 572 (85.4%) are enrolled in public schools. The age group of 3 to 4 year olds has the highest likelihood of being enrolled in private schools, with 70 (100.0% in the age bracket) enrolled. Conversely, the age group of 15 to 17 year olds has the lowest likelihood of being enrolled in a private school, with 182 (100.0% in the age bracket) attending a public institution.
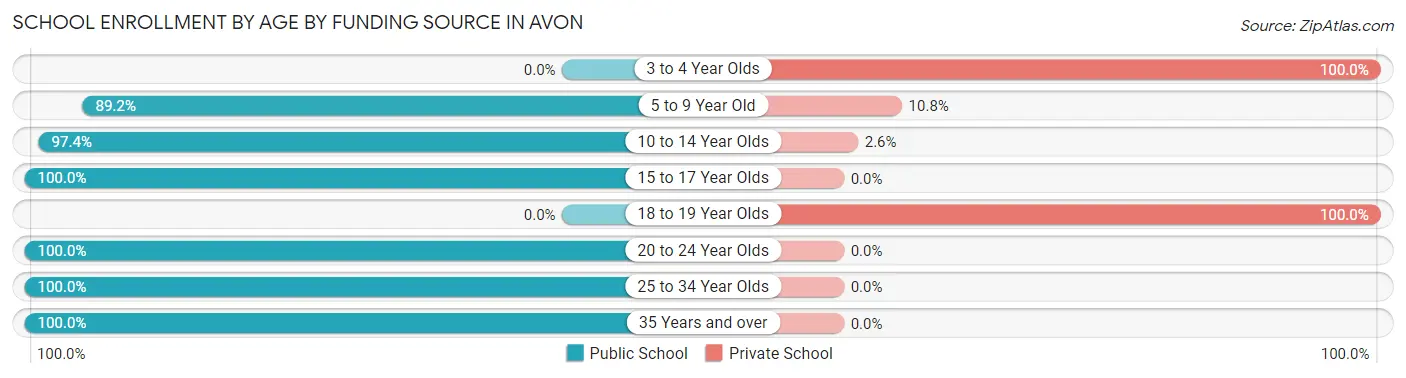
| Age Bracket | Public School | Private School |
| 3 to 4 Year Olds | 0 (0.0%) | 70 (100.0%) |
| 5 to 9 Year Old | 157 (89.2%) | 19 (10.8%) |
| 10 to 14 Year Olds | 111 (97.4%) | 3 (2.6%) |
| 15 to 17 Year Olds | 182 (100.0%) | 0 (0.0%) |
| 18 to 19 Year Olds | 0 (0.0%) | 6 (100.0%) |
| 20 to 24 Year Olds | 42 (100.0%) | 0 (0.0%) |
| 25 to 34 Year Olds | 42 (100.0%) | 0 (0.0%) |
| 35 Years and over | 38 (100.0%) | 0 (0.0%) |
| Total | 572 (85.4%) | 98 (14.6%) |
Educational Attainment by Field of Study in Avon
Business (306 | 35.3%), education (115 | 13.3%), engineering (64 | 7.4%), bio, nature & agricultural (56 | 6.5%), and arts & humanities (56 | 6.5%) are the most common fields of study among 867 individuals in Avon who have obtained a bachelor's degree or higher.
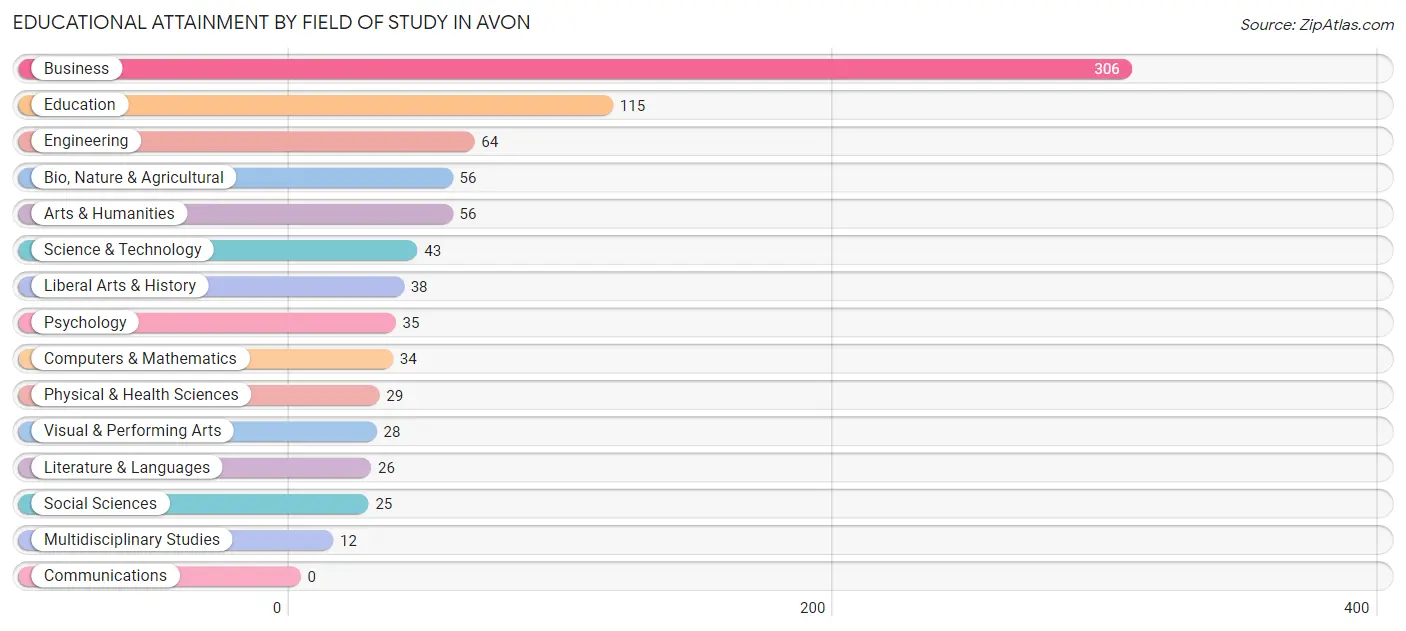
| Field of Study | # Graduates | % Graduates |
| Computers & Mathematics | 34 | 3.9% |
| Bio, Nature & Agricultural | 56 | 6.5% |
| Physical & Health Sciences | 29 | 3.3% |
| Psychology | 35 | 4.0% |
| Social Sciences | 25 | 2.9% |
| Engineering | 64 | 7.4% |
| Multidisciplinary Studies | 12 | 1.4% |
| Science & Technology | 43 | 5.0% |
| Business | 306 | 35.3% |
| Education | 115 | 13.3% |
| Literature & Languages | 26 | 3.0% |
| Liberal Arts & History | 38 | 4.4% |
| Visual & Performing Arts | 28 | 3.2% |
| Communications | 0 | 0.0% |
| Arts & Humanities | 56 | 6.5% |
| Total | 867 | 100.0% |
Transportation & Commute in Avon
Vehicle Availability by Sex in Avon
The most prevalent vehicle ownership categories in Avon are males with 2 vehicles (532, accounting for 55.5%) and females with 2 vehicles (362, making up 74.4%).
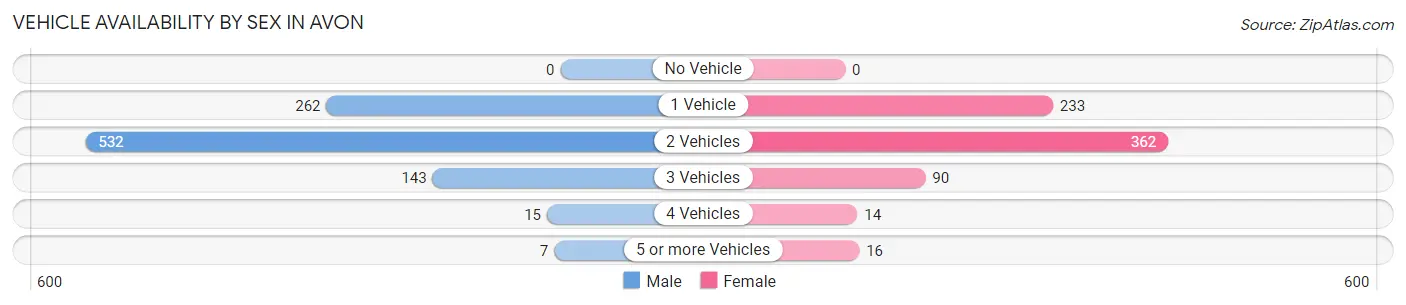
| Vehicles Available | Male | Female |
| No Vehicle | 0 (0.0%) | 0 (0.0%) |
| 1 Vehicle | 262 (27.3%) | 233 (32.6%) |
| 2 Vehicles | 532 (55.5%) | 362 (50.6%) |
| 3 Vehicles | 143 (14.9%) | 90 (12.6%) |
| 4 Vehicles | 15 (1.6%) | 14 (2.0%) |
| 5 or more Vehicles | 7 (0.7%) | 16 (2.2%) |
| Total | 959 (100.0%) | 715 (100.0%) |
Commute Time in Avon
The most frequently occuring commute durations in Avon are 20 to 24 minutes (306 commuters, 19.6%), 5 to 9 minutes (228 commuters, 14.6%), and 10 to 14 minutes (217 commuters, 13.9%).
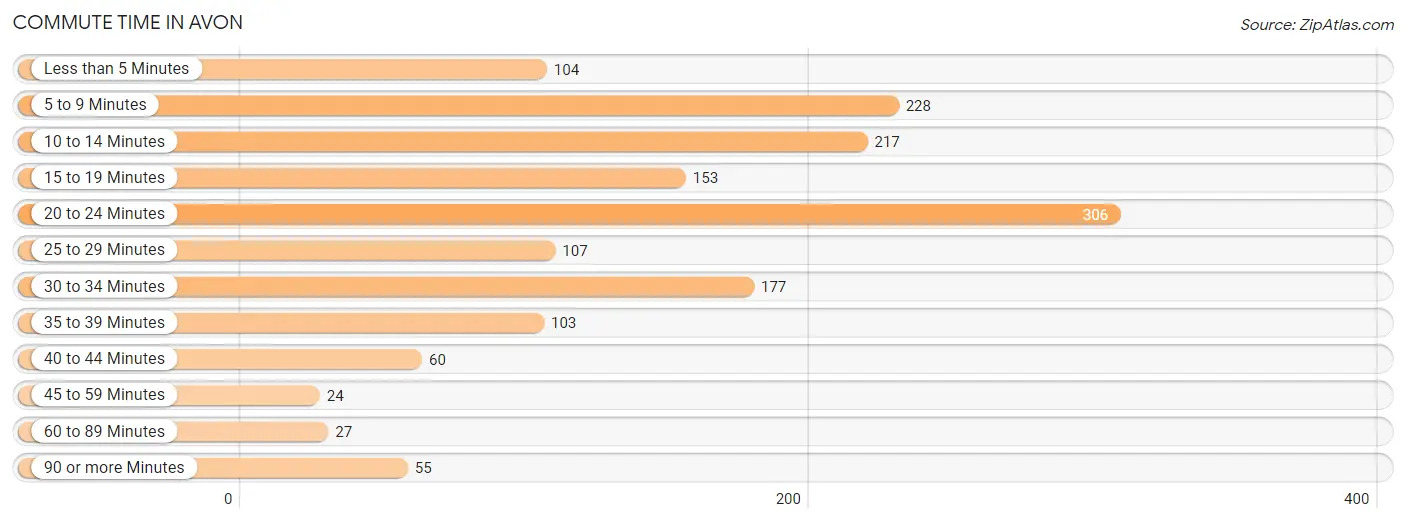
| Commute Time | # Commuters | % Commuters |
| Less than 5 Minutes | 104 | 6.7% |
| 5 to 9 Minutes | 228 | 14.6% |
| 10 to 14 Minutes | 217 | 13.9% |
| 15 to 19 Minutes | 153 | 9.8% |
| 20 to 24 Minutes | 306 | 19.6% |
| 25 to 29 Minutes | 107 | 6.9% |
| 30 to 34 Minutes | 177 | 11.3% |
| 35 to 39 Minutes | 103 | 6.6% |
| 40 to 44 Minutes | 60 | 3.8% |
| 45 to 59 Minutes | 24 | 1.5% |
| 60 to 89 Minutes | 27 | 1.7% |
| 90 or more Minutes | 55 | 3.5% |
Commute Time by Sex in Avon
The most common commute times in Avon are 5 to 9 minutes (186 commuters, 21.1%) for males and 20 to 24 minutes (167 commuters, 24.5%) for females.
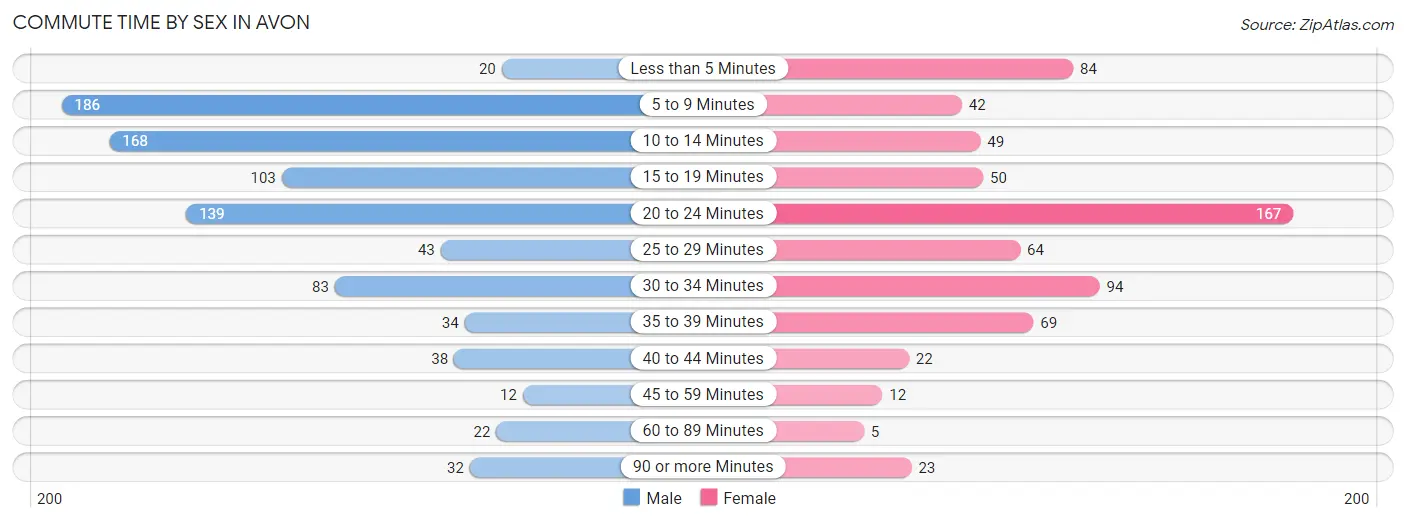
| Commute Time | Male | Female |
| Less than 5 Minutes | 20 (2.3%) | 84 (12.3%) |
| 5 to 9 Minutes | 186 (21.1%) | 42 (6.2%) |
| 10 to 14 Minutes | 168 (19.1%) | 49 (7.2%) |
| 15 to 19 Minutes | 103 (11.7%) | 50 (7.3%) |
| 20 to 24 Minutes | 139 (15.8%) | 167 (24.5%) |
| 25 to 29 Minutes | 43 (4.9%) | 64 (9.4%) |
| 30 to 34 Minutes | 83 (9.4%) | 94 (13.8%) |
| 35 to 39 Minutes | 34 (3.9%) | 69 (10.1%) |
| 40 to 44 Minutes | 38 (4.3%) | 22 (3.2%) |
| 45 to 59 Minutes | 12 (1.4%) | 12 (1.8%) |
| 60 to 89 Minutes | 22 (2.5%) | 5 (0.7%) |
| 90 or more Minutes | 32 (3.6%) | 23 (3.4%) |
Time of Departure to Work by Sex in Avon
The most frequent times of departure to work in Avon are 6:00 AM to 6:29 AM (187, 21.2%) for males and 7:30 AM to 7:59 AM (222, 32.6%) for females.
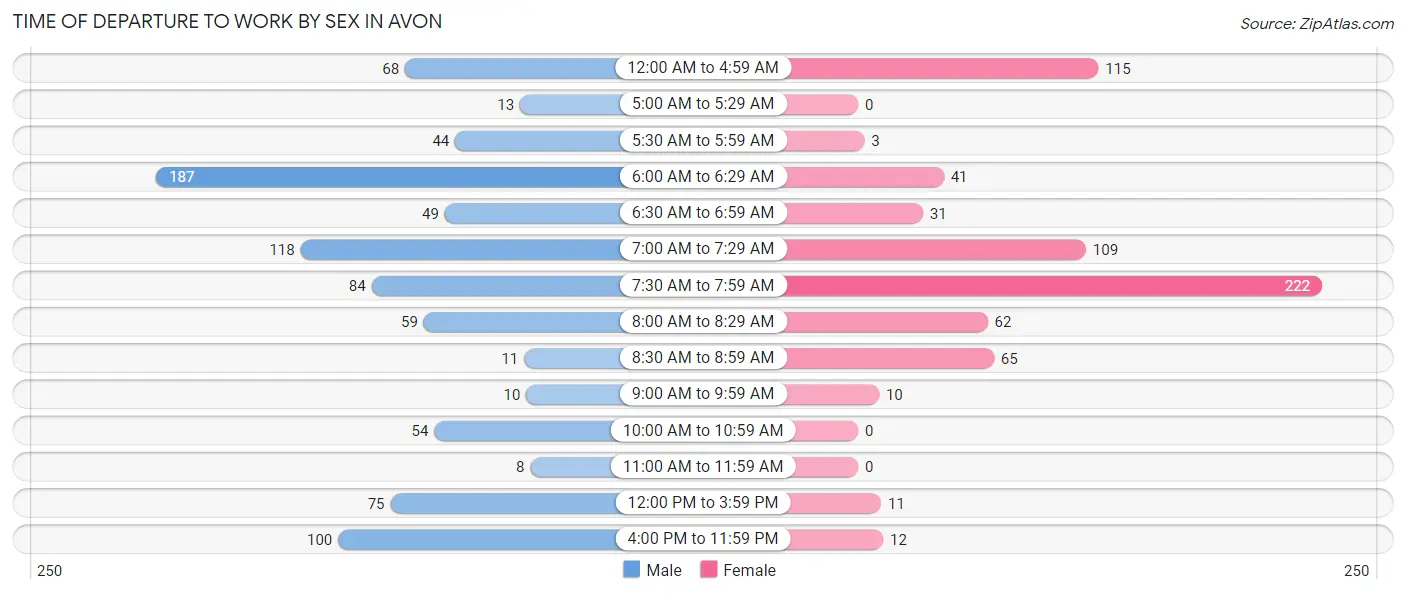
| Time of Departure | Male | Female |
| 12:00 AM to 4:59 AM | 68 (7.7%) | 115 (16.9%) |
| 5:00 AM to 5:29 AM | 13 (1.5%) | 0 (0.0%) |
| 5:30 AM to 5:59 AM | 44 (5.0%) | 3 (0.4%) |
| 6:00 AM to 6:29 AM | 187 (21.2%) | 41 (6.0%) |
| 6:30 AM to 6:59 AM | 49 (5.6%) | 31 (4.5%) |
| 7:00 AM to 7:29 AM | 118 (13.4%) | 109 (16.0%) |
| 7:30 AM to 7:59 AM | 84 (9.6%) | 222 (32.6%) |
| 8:00 AM to 8:29 AM | 59 (6.7%) | 62 (9.1%) |
| 8:30 AM to 8:59 AM | 11 (1.3%) | 65 (9.5%) |
| 9:00 AM to 9:59 AM | 10 (1.1%) | 10 (1.5%) |
| 10:00 AM to 10:59 AM | 54 (6.1%) | 0 (0.0%) |
| 11:00 AM to 11:59 AM | 8 (0.9%) | 0 (0.0%) |
| 12:00 PM to 3:59 PM | 75 (8.5%) | 11 (1.6%) |
| 4:00 PM to 11:59 PM | 100 (11.4%) | 12 (1.8%) |
| Total | 880 (100.0%) | 681 (100.0%) |
Housing Occupancy in Avon
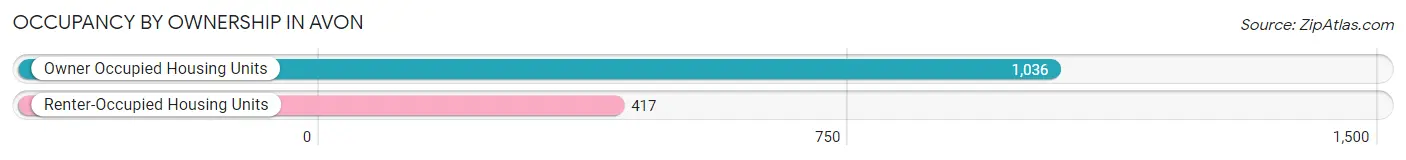
Occupancy by Ownership in Avon
Of the total 1,453 dwellings in Avon, owner-occupied units account for 1,036 (71.3%), while renter-occupied units make up 417 (28.7%).
| Occupancy | # Housing Units | % Housing Units |
| Owner Occupied Housing Units | 1,036 | 71.3% |
| Renter-Occupied Housing Units | 417 | 28.7% |
| Total Occupied Housing Units | 1,453 | 100.0% |
Occupancy by Household Size in Avon
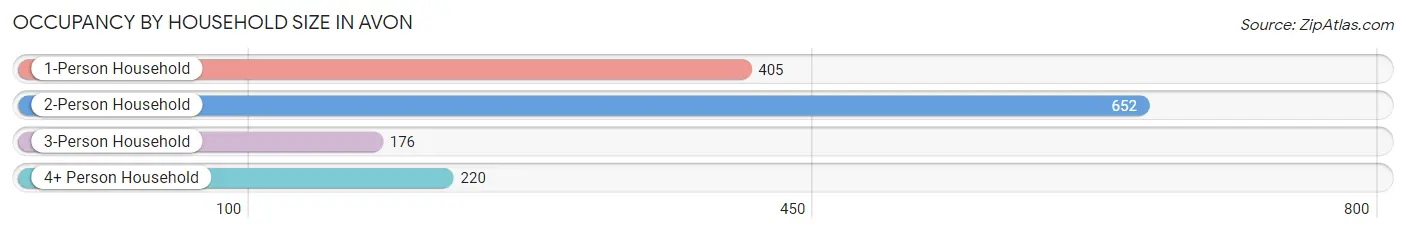
| Household Size | # Housing Units | % Housing Units |
| 1-Person Household | 405 | 27.9% |
| 2-Person Household | 652 | 44.9% |
| 3-Person Household | 176 | 12.1% |
| 4+ Person Household | 220 | 15.1% |
| Total Housing Units | 1,453 | 100.0% |
Occupancy by Ownership by Household Size in Avon
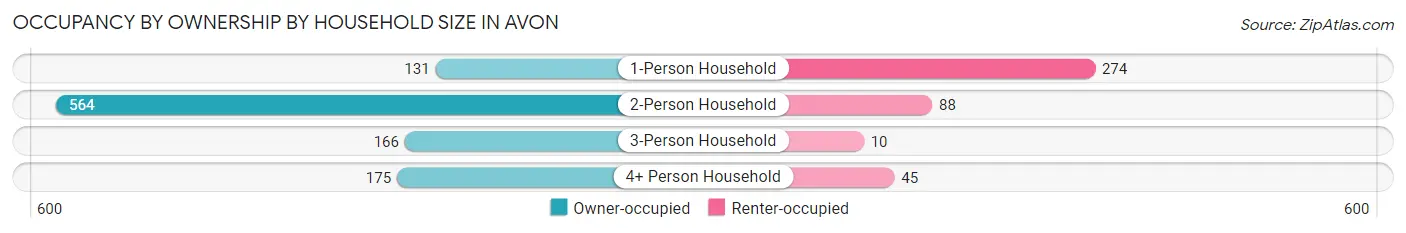
| Household Size | Owner-occupied | Renter-occupied |
| 1-Person Household | 131 (32.4%) | 274 (67.6%) |
| 2-Person Household | 564 (86.5%) | 88 (13.5%) |
| 3-Person Household | 166 (94.3%) | 10 (5.7%) |
| 4+ Person Household | 175 (79.5%) | 45 (20.4%) |
| Total Housing Units | 1,036 (71.3%) | 417 (28.7%) |
Occupancy by Educational Attainment in Avon
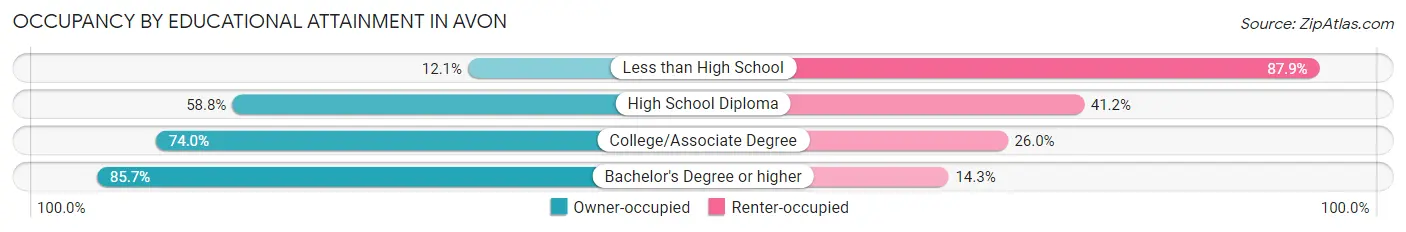
| Household Size | Owner-occupied | Renter-occupied |
| Less than High School | 8 (12.1%) | 58 (87.9%) |
| High School Diploma | 233 (58.8%) | 163 (41.2%) |
| College/Associate Degree | 341 (74.0%) | 120 (26.0%) |
| Bachelor's Degree or higher | 454 (85.7%) | 76 (14.3%) |
Occupancy by Age of Householder in Avon
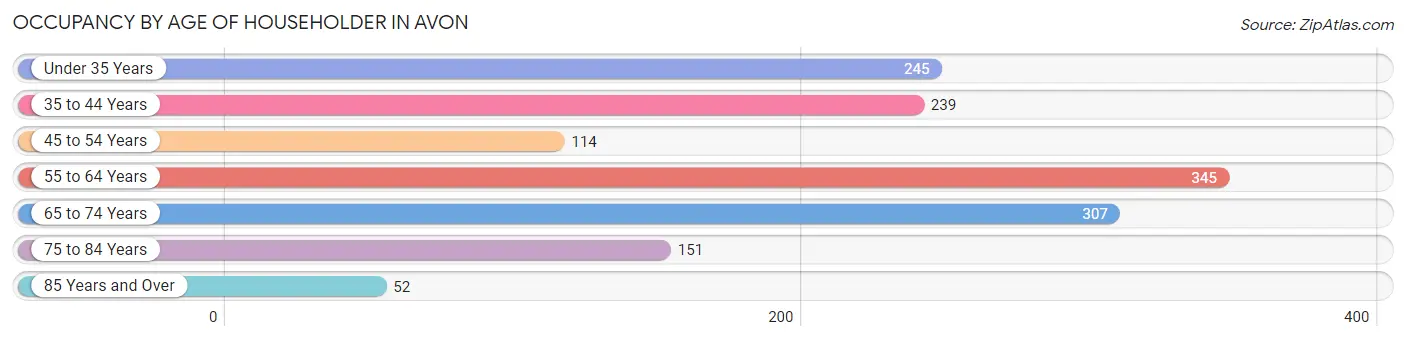
| Age Bracket | # Households | % Households |
| Under 35 Years | 245 | 16.9% |
| 35 to 44 Years | 239 | 16.5% |
| 45 to 54 Years | 114 | 7.9% |
| 55 to 64 Years | 345 | 23.7% |
| 65 to 74 Years | 307 | 21.1% |
| 75 to 84 Years | 151 | 10.4% |
| 85 Years and Over | 52 | 3.6% |
| Total | 1,453 | 100.0% |
Housing Finances in Avon
Median Income by Occupancy in Avon
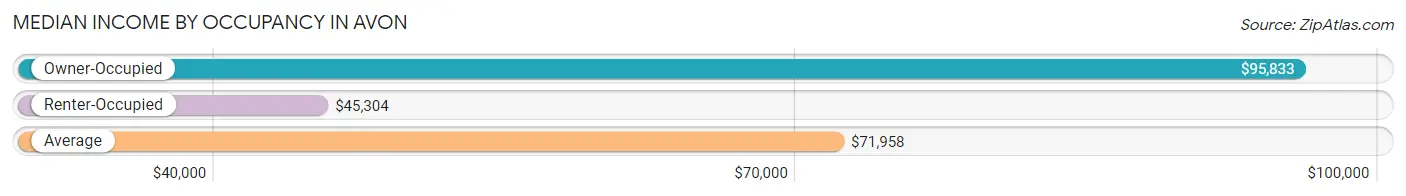
| Occupancy Type | # Households | Median Income |
| Owner-Occupied | 1,036 (71.3%) | $95,833 |
| Renter-Occupied | 417 (28.7%) | $45,304 |
| Average | 1,453 (100.0%) | $71,958 |
Occupancy by Householder Income Bracket in Avon
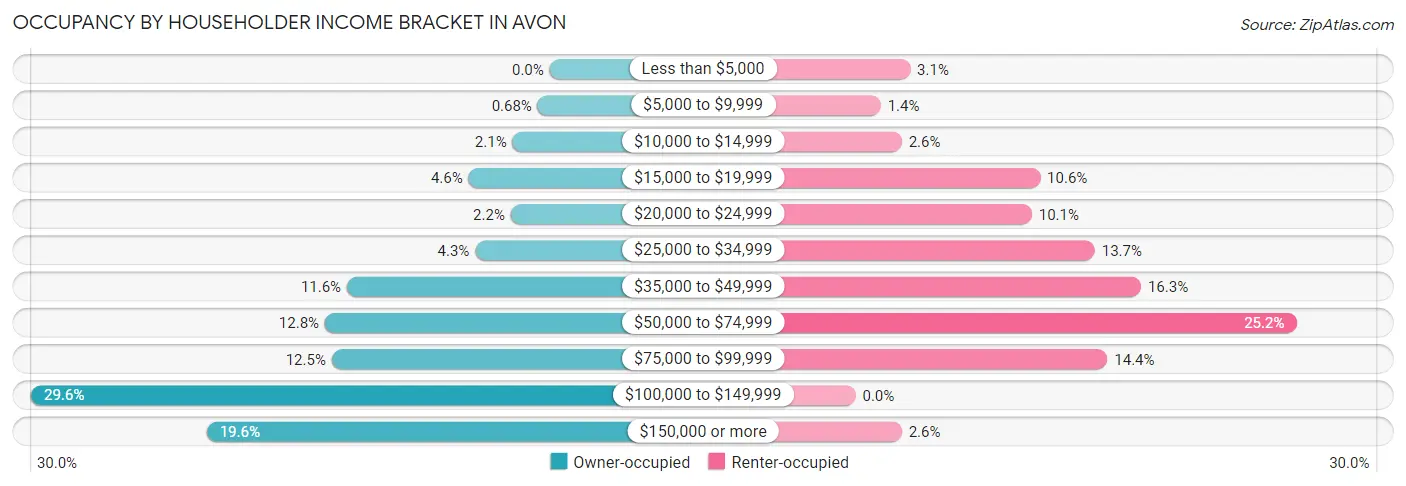
| Income Bracket | Owner-occupied | Renter-occupied |
| Less than $5,000 | 0 (0.0%) | 13 (3.1%) |
| $5,000 to $9,999 | 7 (0.7%) | 6 (1.4%) |
| $10,000 to $14,999 | 22 (2.1%) | 11 (2.6%) |
| $15,000 to $19,999 | 48 (4.6%) | 44 (10.5%) |
| $20,000 to $24,999 | 23 (2.2%) | 42 (10.1%) |
| $25,000 to $34,999 | 44 (4.3%) | 57 (13.7%) |
| $35,000 to $49,999 | 120 (11.6%) | 68 (16.3%) |
| $50,000 to $74,999 | 133 (12.8%) | 105 (25.2%) |
| $75,000 to $99,999 | 129 (12.4%) | 60 (14.4%) |
| $100,000 to $149,999 | 307 (29.6%) | 0 (0.0%) |
| $150,000 or more | 203 (19.6%) | 11 (2.6%) |
| Total | 1,036 (100.0%) | 417 (100.0%) |
Monthly Housing Cost Tiers in Avon
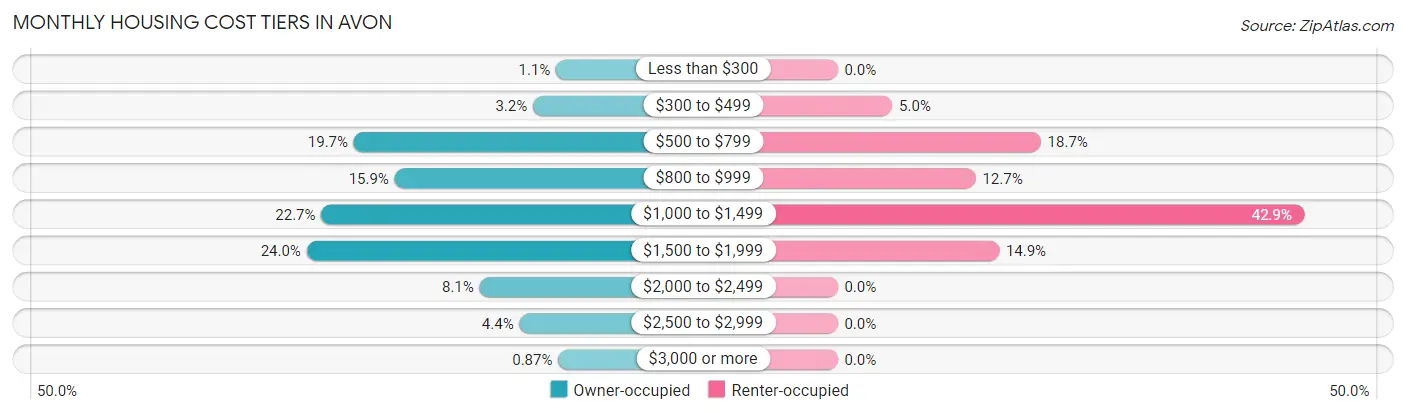
| Monthly Cost | Owner-occupied | Renter-occupied |
| Less than $300 | 11 (1.1%) | 0 (0.0%) |
| $300 to $499 | 33 (3.2%) | 21 (5.0%) |
| $500 to $799 | 204 (19.7%) | 78 (18.7%) |
| $800 to $999 | 165 (15.9%) | 53 (12.7%) |
| $1,000 to $1,499 | 235 (22.7%) | 179 (42.9%) |
| $1,500 to $1,999 | 249 (24.0%) | 62 (14.9%) |
| $2,000 to $2,499 | 84 (8.1%) | 0 (0.0%) |
| $2,500 to $2,999 | 46 (4.4%) | 0 (0.0%) |
| $3,000 or more | 9 (0.9%) | 0 (0.0%) |
| Total | 1,036 (100.0%) | 417 (100.0%) |
Physical Housing Characteristics in Avon
Housing Structures in Avon
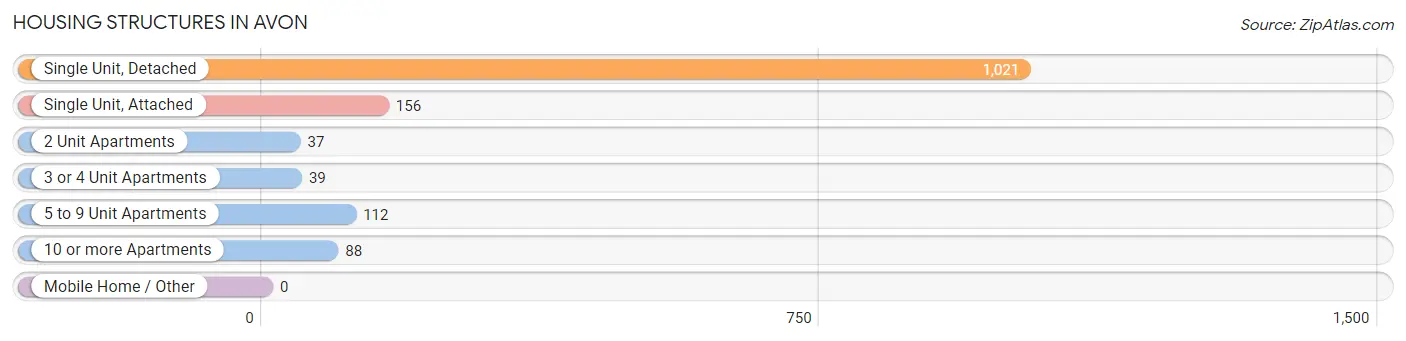
| Structure Type | # Housing Units | % Housing Units |
| Single Unit, Detached | 1,021 | 70.3% |
| Single Unit, Attached | 156 | 10.7% |
| 2 Unit Apartments | 37 | 2.5% |
| 3 or 4 Unit Apartments | 39 | 2.7% |
| 5 to 9 Unit Apartments | 112 | 7.7% |
| 10 or more Apartments | 88 | 6.1% |
| Mobile Home / Other | 0 | 0.0% |
| Total | 1,453 | 100.0% |
Housing Structures by Occupancy in Avon
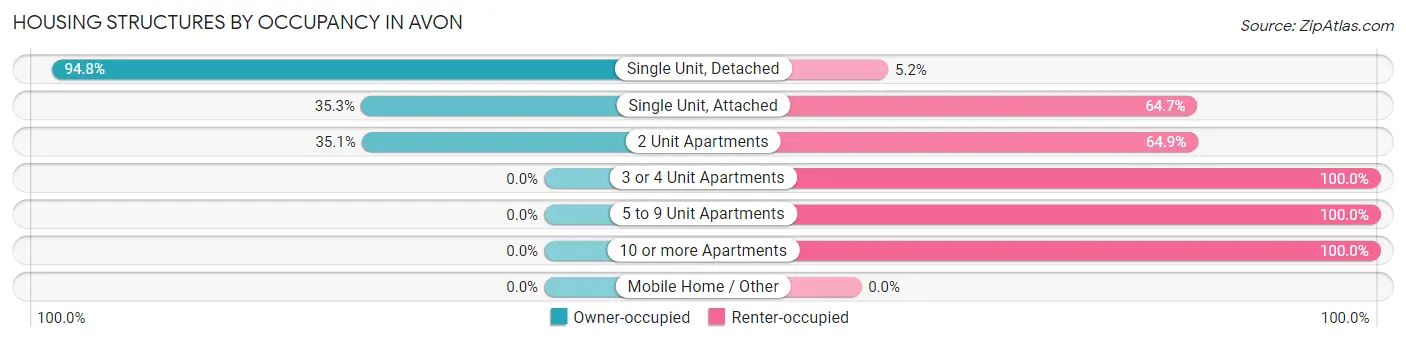
| Structure Type | Owner-occupied | Renter-occupied |
| Single Unit, Detached | 968 (94.8%) | 53 (5.2%) |
| Single Unit, Attached | 55 (35.3%) | 101 (64.7%) |
| 2 Unit Apartments | 13 (35.1%) | 24 (64.9%) |
| 3 or 4 Unit Apartments | 0 (0.0%) | 39 (100.0%) |
| 5 to 9 Unit Apartments | 0 (0.0%) | 112 (100.0%) |
| 10 or more Apartments | 0 (0.0%) | 88 (100.0%) |
| Mobile Home / Other | 0 (0.0%) | 0 (0.0%) |
| Total | 1,036 (71.3%) | 417 (28.7%) |
Housing Structures by Number of Rooms in Avon
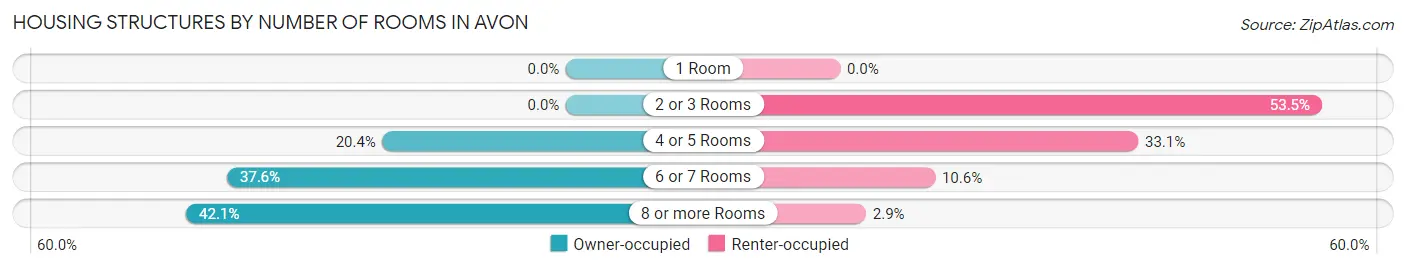
| Number of Rooms | Owner-occupied | Renter-occupied |
| 1 Room | 0 (0.0%) | 0 (0.0%) |
| 2 or 3 Rooms | 0 (0.0%) | 223 (53.5%) |
| 4 or 5 Rooms | 211 (20.4%) | 138 (33.1%) |
| 6 or 7 Rooms | 389 (37.6%) | 44 (10.5%) |
| 8 or more Rooms | 436 (42.1%) | 12 (2.9%) |
| Total | 1,036 (100.0%) | 417 (100.0%) |
Housing Structure by Heating Type in Avon
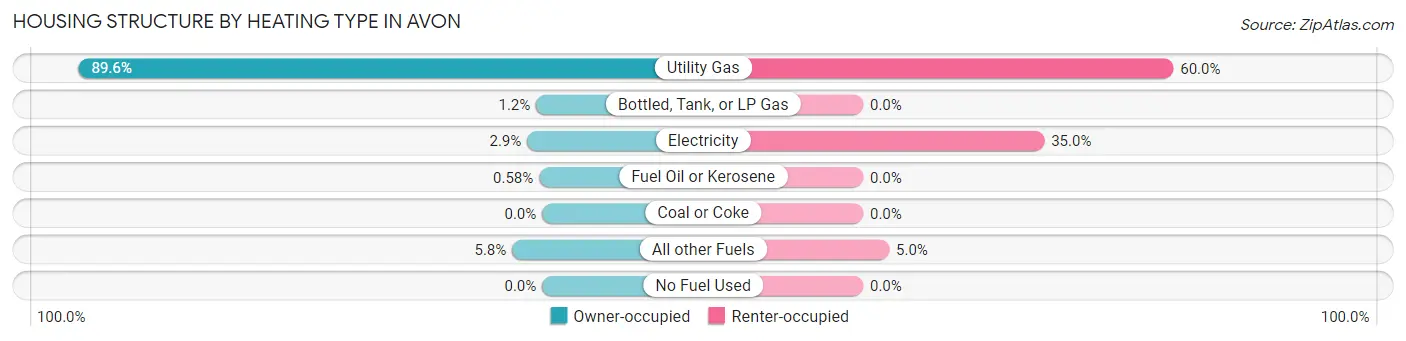
| Heating Type | Owner-occupied | Renter-occupied |
| Utility Gas | 928 (89.6%) | 250 (60.0%) |
| Bottled, Tank, or LP Gas | 12 (1.2%) | 0 (0.0%) |
| Electricity | 30 (2.9%) | 146 (35.0%) |
| Fuel Oil or Kerosene | 6 (0.6%) | 0 (0.0%) |
| Coal or Coke | 0 (0.0%) | 0 (0.0%) |
| All other Fuels | 60 (5.8%) | 21 (5.0%) |
| No Fuel Used | 0 (0.0%) | 0 (0.0%) |
| Total | 1,036 (100.0%) | 417 (100.0%) |
Household Vehicle Usage in Avon
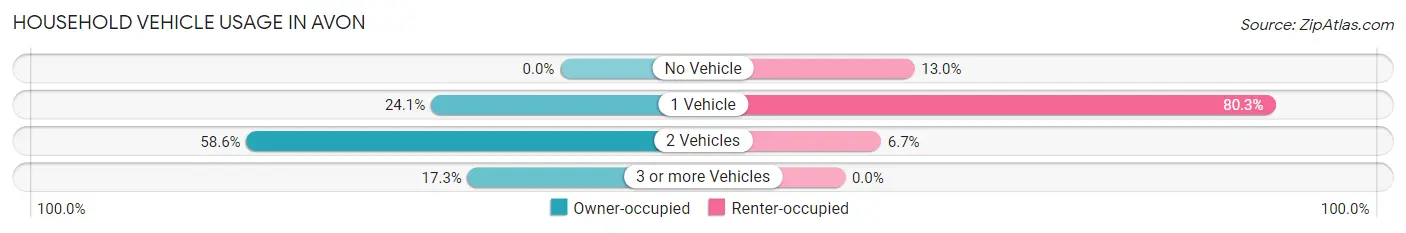
| Vehicles per Household | Owner-occupied | Renter-occupied |
| No Vehicle | 0 (0.0%) | 54 (13.0%) |
| 1 Vehicle | 250 (24.1%) | 335 (80.3%) |
| 2 Vehicles | 607 (58.6%) | 28 (6.7%) |
| 3 or more Vehicles | 179 (17.3%) | 0 (0.0%) |
| Total | 1,036 (100.0%) | 417 (100.0%) |
Real Estate & Mortgages in Avon
Real Estate and Mortgage Overview in Avon
| Characteristic | Without Mortgage | With Mortgage |
| Housing Units | 349 | 687 |
| Median Property Value | $180,200 | $176,800 |
| Median Household Income | $63,523 | $171 |
| Monthly Housing Costs | $704 | $9 |
| Real Estate Taxes | $5,212 | $0 |
Property Value by Mortgage Status in Avon
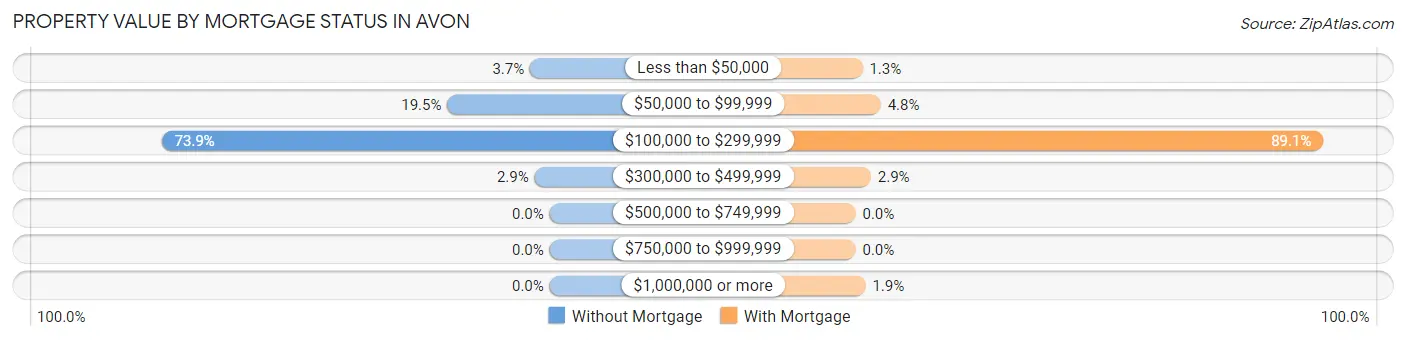
| Property Value | Without Mortgage | With Mortgage |
| Less than $50,000 | 13 (3.7%) | 9 (1.3%) |
| $50,000 to $99,999 | 68 (19.5%) | 33 (4.8%) |
| $100,000 to $299,999 | 258 (73.9%) | 612 (89.1%) |
| $300,000 to $499,999 | 10 (2.9%) | 20 (2.9%) |
| $500,000 to $749,999 | 0 (0.0%) | 0 (0.0%) |
| $750,000 to $999,999 | 0 (0.0%) | 0 (0.0%) |
| $1,000,000 or more | 0 (0.0%) | 13 (1.9%) |
| Total | 349 (100.0%) | 687 (100.0%) |
Household Income by Mortgage Status in Avon
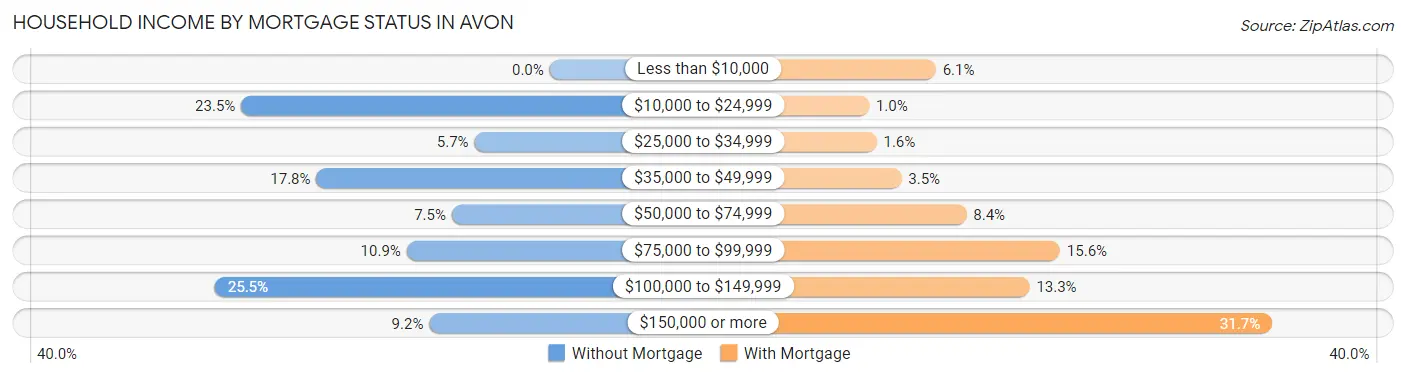
| Household Income | Without Mortgage | With Mortgage |
| Less than $10,000 | 0 (0.0%) | 42 (6.1%) |
| $10,000 to $24,999 | 82 (23.5%) | 7 (1.0%) |
| $25,000 to $34,999 | 20 (5.7%) | 11 (1.6%) |
| $35,000 to $49,999 | 62 (17.8%) | 24 (3.5%) |
| $50,000 to $74,999 | 26 (7.4%) | 58 (8.4%) |
| $75,000 to $99,999 | 38 (10.9%) | 107 (15.6%) |
| $100,000 to $149,999 | 89 (25.5%) | 91 (13.3%) |
| $150,000 or more | 32 (9.2%) | 218 (31.7%) |
| Total | 349 (100.0%) | 687 (100.0%) |
Property Value to Household Income Ratio in Avon
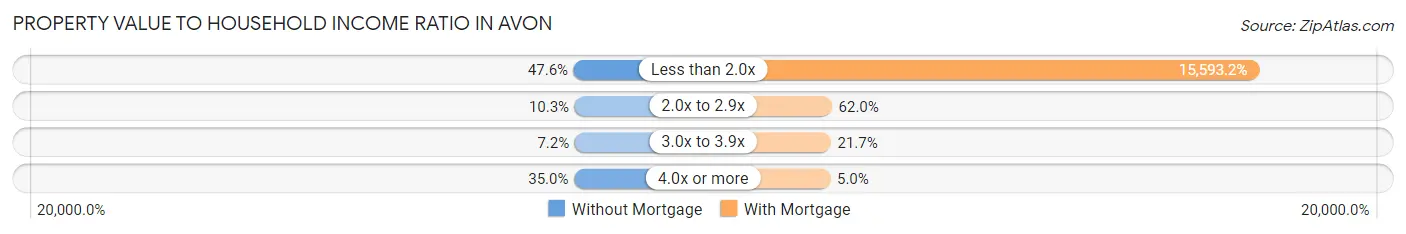
| Value-to-Income Ratio | Without Mortgage | With Mortgage |
| Less than 2.0x | 166 (47.6%) | 107,125 (15,593.2%) |
| 2.0x to 2.9x | 36 (10.3%) | 426 (62.0%) |
| 3.0x to 3.9x | 25 (7.2%) | 149 (21.7%) |
| 4.0x or more | 122 (35.0%) | 34 (5.0%) |
| Total | 349 (100.0%) | 687 (100.0%) |
Real Estate Taxes by Mortgage Status in Avon
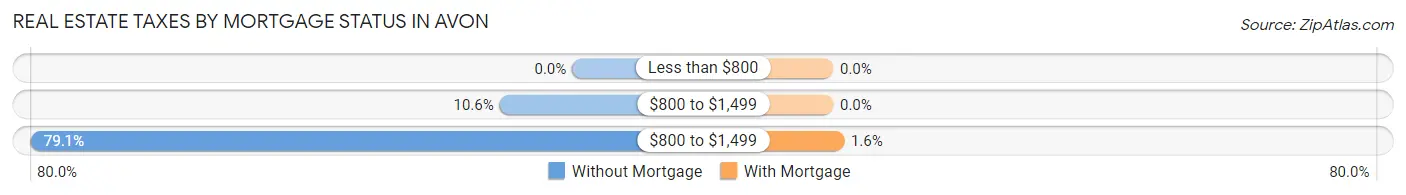
| Property Taxes | Without Mortgage | With Mortgage |
| Less than $800 | 0 (0.0%) | 0 (0.0%) |
| $800 to $1,499 | 37 (10.6%) | 0 (0.0%) |
| $800 to $1,499 | 276 (79.1%) | 11 (1.6%) |
| Total | 349 (100.0%) | 687 (100.0%) |
Health & Disability in Avon
Health Insurance Coverage by Age in Avon
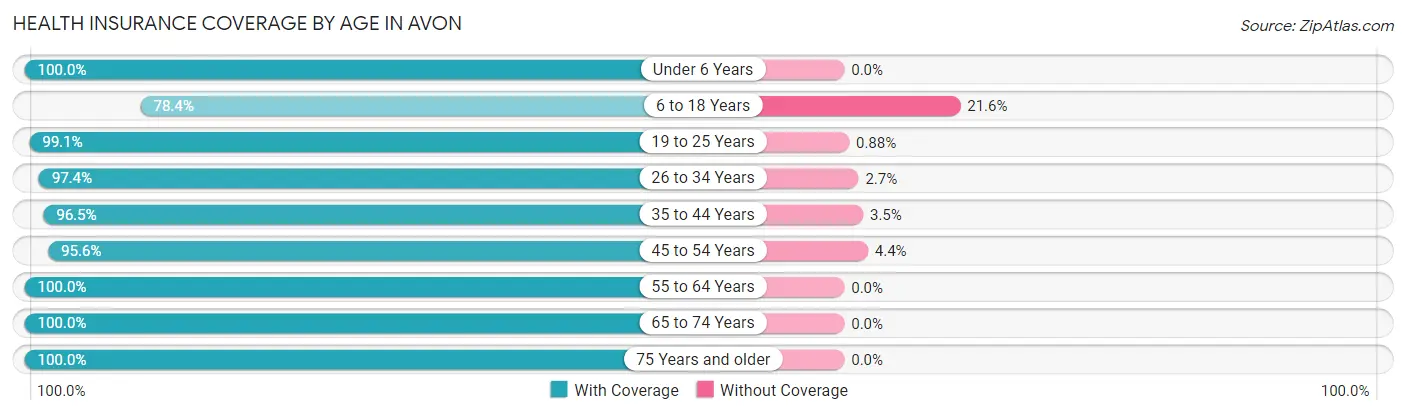
| Age Bracket | With Coverage | Without Coverage |
| Under 6 Years | 205 (100.0%) | 0 (0.0%) |
| 6 to 18 Years | 424 (78.4%) | 117 (21.6%) |
| 19 to 25 Years | 224 (99.1%) | 2 (0.9%) |
| 26 to 34 Years | 367 (97.4%) | 10 (2.6%) |
| 35 to 44 Years | 360 (96.5%) | 13 (3.5%) |
| 45 to 54 Years | 305 (95.6%) | 14 (4.4%) |
| 55 to 64 Years | 532 (100.0%) | 0 (0.0%) |
| 65 to 74 Years | 510 (100.0%) | 0 (0.0%) |
| 75 Years and older | 272 (100.0%) | 0 (0.0%) |
| Total | 3,199 (95.4%) | 156 (4.6%) |
Health Insurance Coverage by Citizenship Status in Avon
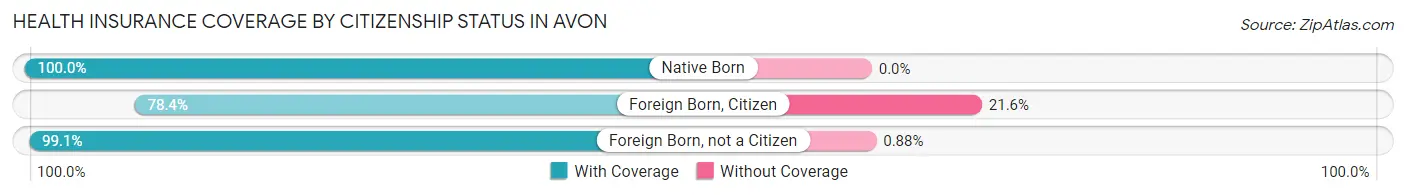
| Citizenship Status | With Coverage | Without Coverage |
| Native Born | 205 (100.0%) | 0 (0.0%) |
| Foreign Born, Citizen | 424 (78.4%) | 117 (21.6%) |
| Foreign Born, not a Citizen | 224 (99.1%) | 2 (0.9%) |
Health Insurance Coverage by Household Income in Avon
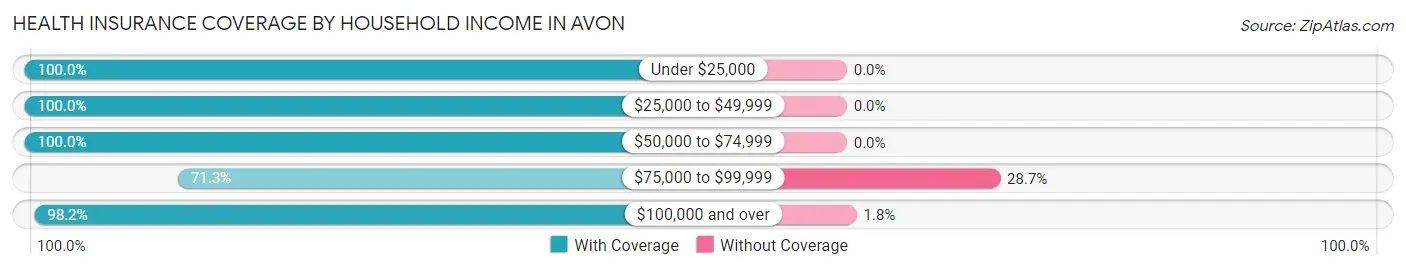
| Household Income | With Coverage | Without Coverage |
| Under $25,000 | 359 (100.0%) | 0 (0.0%) |
| $25,000 to $49,999 | 515 (100.0%) | 0 (0.0%) |
| $50,000 to $74,999 | 440 (100.0%) | 0 (0.0%) |
| $75,000 to $99,999 | 315 (71.3%) | 127 (28.7%) |
| $100,000 and over | 1,543 (98.2%) | 29 (1.8%) |
Public vs Private Health Insurance Coverage by Age in Avon
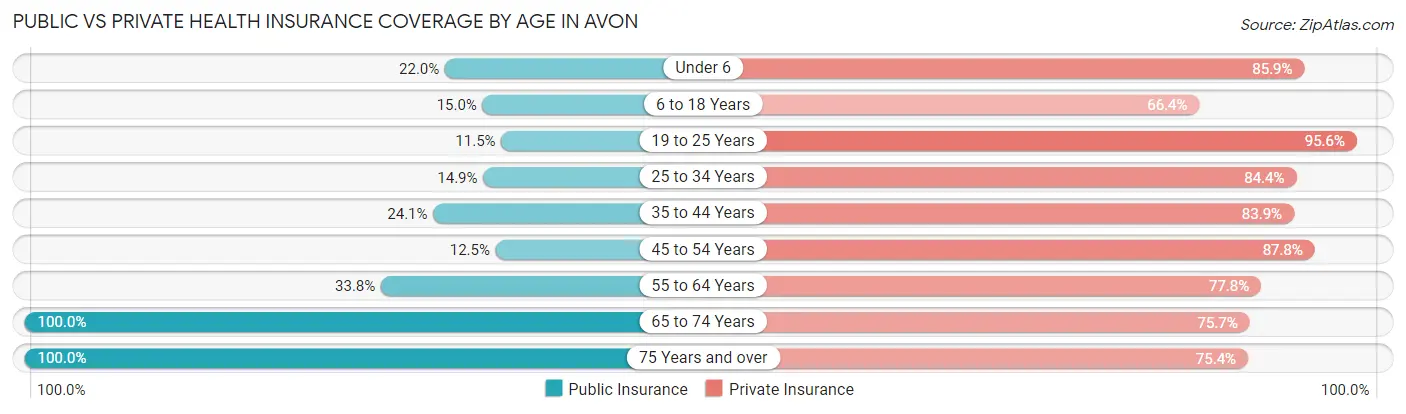
| Age Bracket | Public Insurance | Private Insurance |
| Under 6 | 45 (22.0%) | 176 (85.9%) |
| 6 to 18 Years | 81 (15.0%) | 359 (66.4%) |
| 19 to 25 Years | 26 (11.5%) | 216 (95.6%) |
| 25 to 34 Years | 56 (14.8%) | 318 (84.4%) |
| 35 to 44 Years | 90 (24.1%) | 313 (83.9%) |
| 45 to 54 Years | 40 (12.5%) | 280 (87.8%) |
| 55 to 64 Years | 180 (33.8%) | 414 (77.8%) |
| 65 to 74 Years | 510 (100.0%) | 386 (75.7%) |
| 75 Years and over | 272 (100.0%) | 205 (75.4%) |
| Total | 1,300 (38.8%) | 2,667 (79.5%) |
Disability Status by Sex by Age in Avon
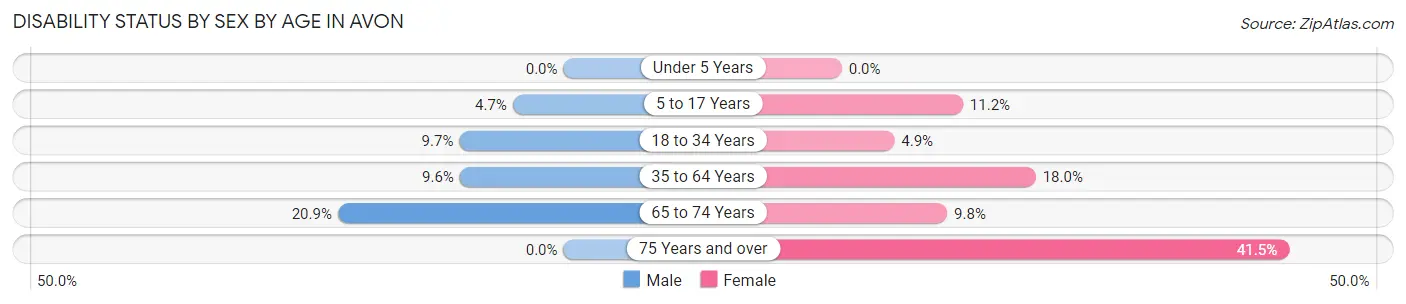
| Age Bracket | Male | Female |
| Under 5 Years | 0 (0.0%) | 0 (0.0%) |
| 5 to 17 Years | 11 (4.7%) | 38 (11.2%) |
| 18 to 34 Years | 31 (9.7%) | 14 (4.9%) |
| 35 to 64 Years | 59 (9.6%) | 110 (18.0%) |
| 65 to 74 Years | 49 (20.9%) | 27 (9.8%) |
| 75 Years and over | 0 (0.0%) | 61 (41.5%) |
Disability Class by Sex by Age in Avon
Disability Class: Hearing Difficulty
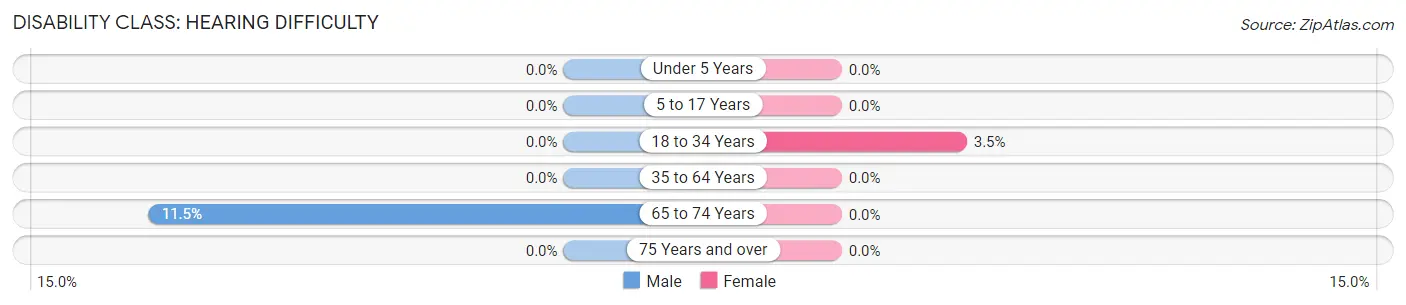
| Age Bracket | Male | Female |
| Under 5 Years | 0 (0.0%) | 0 (0.0%) |
| 5 to 17 Years | 0 (0.0%) | 0 (0.0%) |
| 18 to 34 Years | 0 (0.0%) | 10 (3.5%) |
| 35 to 64 Years | 0 (0.0%) | 0 (0.0%) |
| 65 to 74 Years | 27 (11.5%) | 0 (0.0%) |
| 75 Years and over | 0 (0.0%) | 0 (0.0%) |
Disability Class: Vision Difficulty
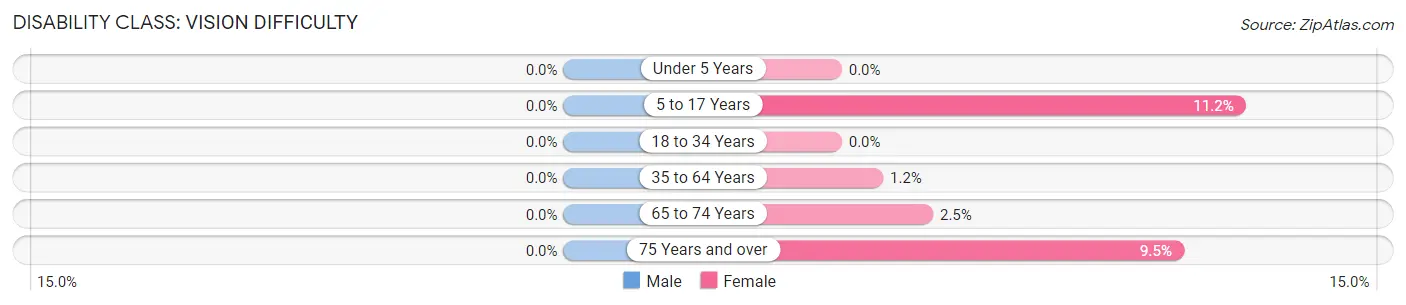
| Age Bracket | Male | Female |
| Under 5 Years | 0 (0.0%) | 0 (0.0%) |
| 5 to 17 Years | 0 (0.0%) | 38 (11.2%) |
| 18 to 34 Years | 0 (0.0%) | 0 (0.0%) |
| 35 to 64 Years | 0 (0.0%) | 7 (1.1%) |
| 65 to 74 Years | 0 (0.0%) | 7 (2.5%) |
| 75 Years and over | 0 (0.0%) | 14 (9.5%) |
Disability Class: Cognitive Difficulty
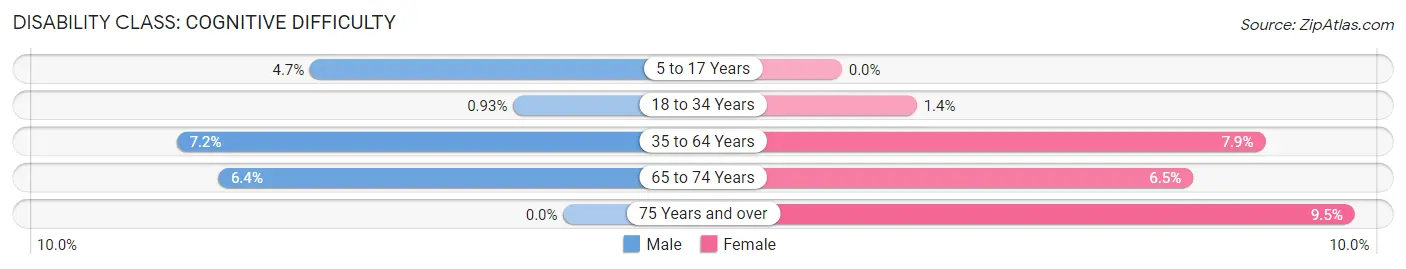
| Age Bracket | Male | Female |
| 5 to 17 Years | 11 (4.7%) | 0 (0.0%) |
| 18 to 34 Years | 3 (0.9%) | 4 (1.4%) |
| 35 to 64 Years | 44 (7.2%) | 48 (7.9%) |
| 65 to 74 Years | 15 (6.4%) | 18 (6.5%) |
| 75 Years and over | 0 (0.0%) | 14 (9.5%) |
Disability Class: Ambulatory Difficulty
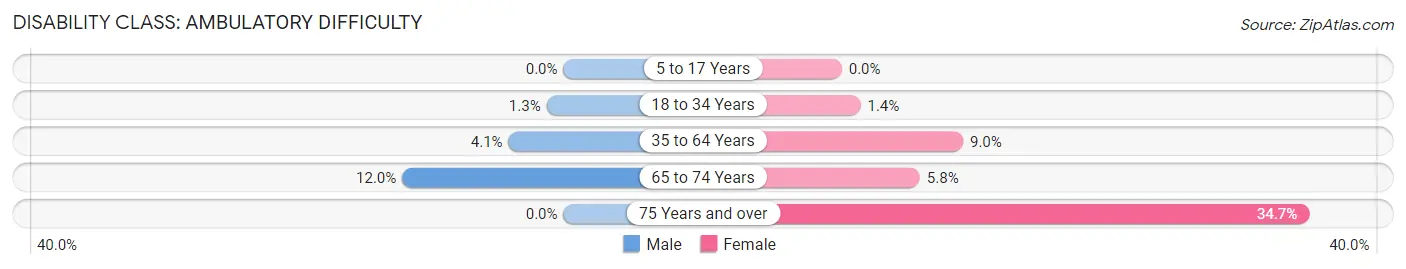
| Age Bracket | Male | Female |
| 5 to 17 Years | 0 (0.0%) | 0 (0.0%) |
| 18 to 34 Years | 4 (1.3%) | 4 (1.4%) |
| 35 to 64 Years | 25 (4.1%) | 55 (9.0%) |
| 65 to 74 Years | 28 (12.0%) | 16 (5.8%) |
| 75 Years and over | 0 (0.0%) | 51 (34.7%) |
Disability Class: Self-Care Difficulty
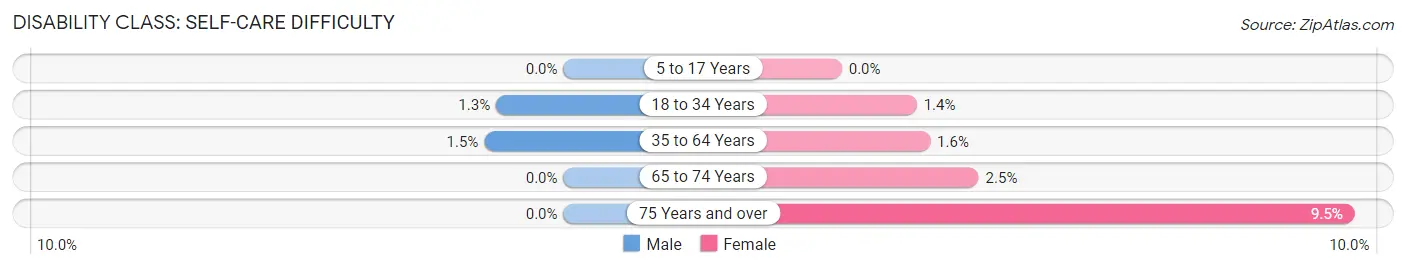
| Age Bracket | Male | Female |
| 5 to 17 Years | 0 (0.0%) | 0 (0.0%) |
| 18 to 34 Years | 4 (1.3%) | 4 (1.4%) |
| 35 to 64 Years | 9 (1.5%) | 10 (1.6%) |
| 65 to 74 Years | 0 (0.0%) | 7 (2.5%) |
| 75 Years and over | 0 (0.0%) | 14 (9.5%) |
Technology Access in Avon
Computing Device Access in Avon
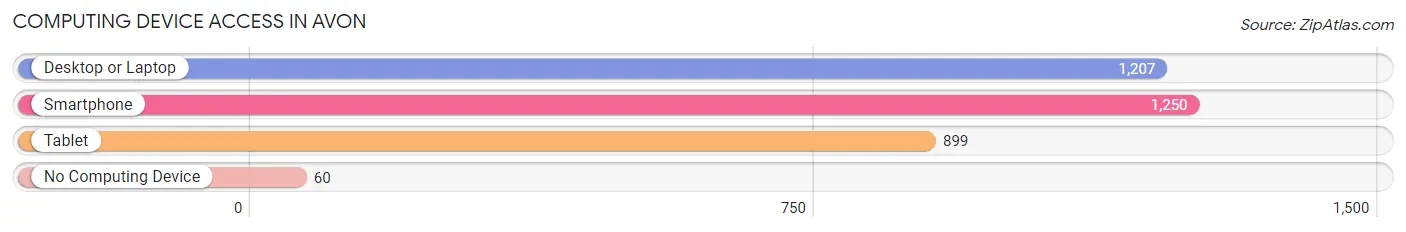
| Device Type | # Households | % Households |
| Desktop or Laptop | 1,207 | 83.1% |
| Smartphone | 1,250 | 86.0% |
| Tablet | 899 | 61.9% |
| No Computing Device | 60 | 4.1% |
| Total | 1,453 | 100.0% |
Internet Access in Avon
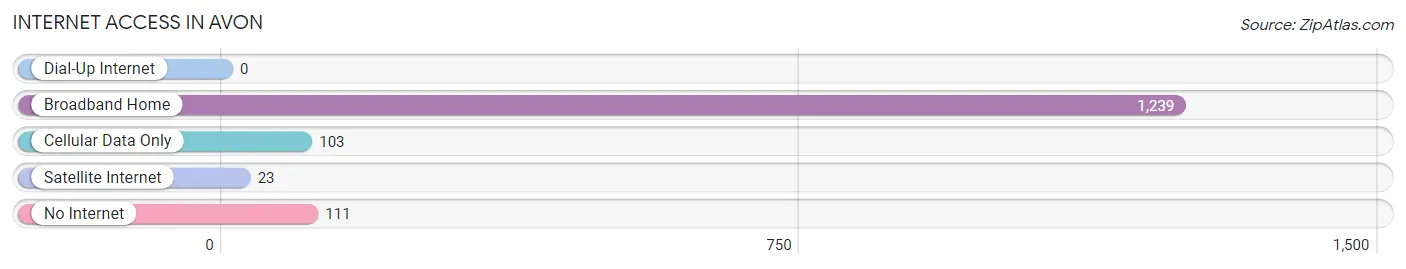
| Internet Type | # Households | % Households |
| Dial-Up Internet | 0 | 0.0% |
| Broadband Home | 1,239 | 85.3% |
| Cellular Data Only | 103 | 7.1% |
| Satellite Internet | 23 | 1.6% |
| No Internet | 111 | 7.6% |
| Total | 1,453 | 100.0% |
Avon Summary
Avon, New York is a small town located in Livingston County, New York. It is situated on the east side of the Genesee River, about 25 miles south of Rochester. The town was first settled in 1810 and was incorporated in 1845. As of the 2010 census, the population of Avon was 5,443.
Geography
Avon is located at 42°58'N 77°45'W (42.967, -77.75). According to the United States Census Bureau, the town has a total area of 8.2 square miles, of which 8.1 square miles is land and 0.1 square miles (1.25%) is water.
Avon is bordered by the towns of Lima to the north, Caledonia to the east, Geneseo to the south, and Livonia to the west. The Genesee River flows through the town, and the town is home to several small lakes, including Avon Lake, Mud Lake, and Long Pond.
Economy
Avon is a small, rural town with a primarily agricultural economy. The town is home to several farms, including dairy farms, vegetable farms, and fruit farms. The town is also home to several small businesses, including restaurants, retail stores, and service providers.
Avon is home to several manufacturing companies, including Avon Products, Inc., a cosmetics company, and Avon Automotive, a manufacturer of automotive parts. The town is also home to several small technology companies, including Avon Technologies, Inc., a software development company, and Avon Robotics, a robotics engineering firm.
Demographics
As of the 2010 census, there were 5,443 people, 2,072 households, and 1,521 families residing in the town. The population density was 668.2 people per square mile. There were 2,213 housing units at an average density of 273.7 per square mile. The racial makeup of the town was 97.2% White, 0.7% African American, 0.2% Native American, 0.5% Asian, 0.1% Pacific Islander, 0.4% from other races, and 0.9% from two or more races. Hispanic or Latino of any race were 1.7% of the population.
There were 2,072 households, out of which 33.2% had children under the age of 18 living with them, 57.2% were married couples living together, 10.2% had a female householder with no husband present, and 28.2% were non-families. 22.7% of all households were made up of individuals, and 9.2% had someone living alone who was 65 years of age or older. The average household size was 2.62 and the average family size was 3.06.
In the town, the population was spread out, with 25.7% under the age of 18, 6.7% from 18 to 24, 28.2% from 25 to 44, 25.3% from 45 to 64, and 14.1% who were 65 years of age or older. The median age was 38 years. For every 100 females, there were 97.2 males. For every 100 females age 18 and over, there were 94.2 males.
The median income for a household in the town was $45,938, and the median income for a family was $51,964. Males had a median income of $37,917 versus $27,917 for females. The per capita income for the town was $20,945. About 4.2% of families and 6.2% of the population were below the poverty line, including 8.2% of those under age 18 and 5.2% of those age 65 or over.
Common Questions
What is Per Capita Income in Avon?
Per Capita income in Avon is $38,307.
What is the Median Family Income in Avon?
Median Family Income in Avon is $92,256.
What is the Median Household income in Avon?
Median Household Income in Avon is $71,958.
What is Income or Wage Gap in Avon?
Income or Wage Gap in Avon is 44.2%.
Women in Avon earn 55.8 cents for every dollar earned by a man.
What is Inequality or Gini Index in Avon?
Inequality or Gini Index in Avon is 0.39.
What is the Total Population of Avon?
Total Population of Avon is 3,388.
What is the Total Male Population of Avon?
Total Male Population of Avon is 1,660.
What is the Total Female Population of Avon?
Total Female Population of Avon is 1,728.
What is the Ratio of Males per 100 Females in Avon?
There are 96.06 Males per 100 Females in Avon.
What is the Ratio of Females per 100 Males in Avon?
There are 104.10 Females per 100 Males in Avon.
What is the Median Population Age in Avon?
Median Population Age in Avon is 43.9 Years.
What is the Average Family Size in Avon
Average Family Size in Avon is 2.8 People.
What is the Average Household Size in Avon
Average Household Size in Avon is 2.3 People.
How Large is the Labor Force in Avon?
There are 1,735 People in the Labor Forcein in Avon.
What is the Percentage of People in the Labor Force in Avon?
62.8% of People are in the Labor Force in Avon.
What is the Unemployment Rate in Avon?
Unemployment Rate in Avon is 3.1%.