Cities with the Highest Percentage of Population with a Degree in Business in Alaska
RELATED REPORTS & OPTIONS
Business
Alaska
Compare Cities
Map of Cities with the Highest Percentage of Population with a Degree in Business in Alaska
0.0%
100.0%
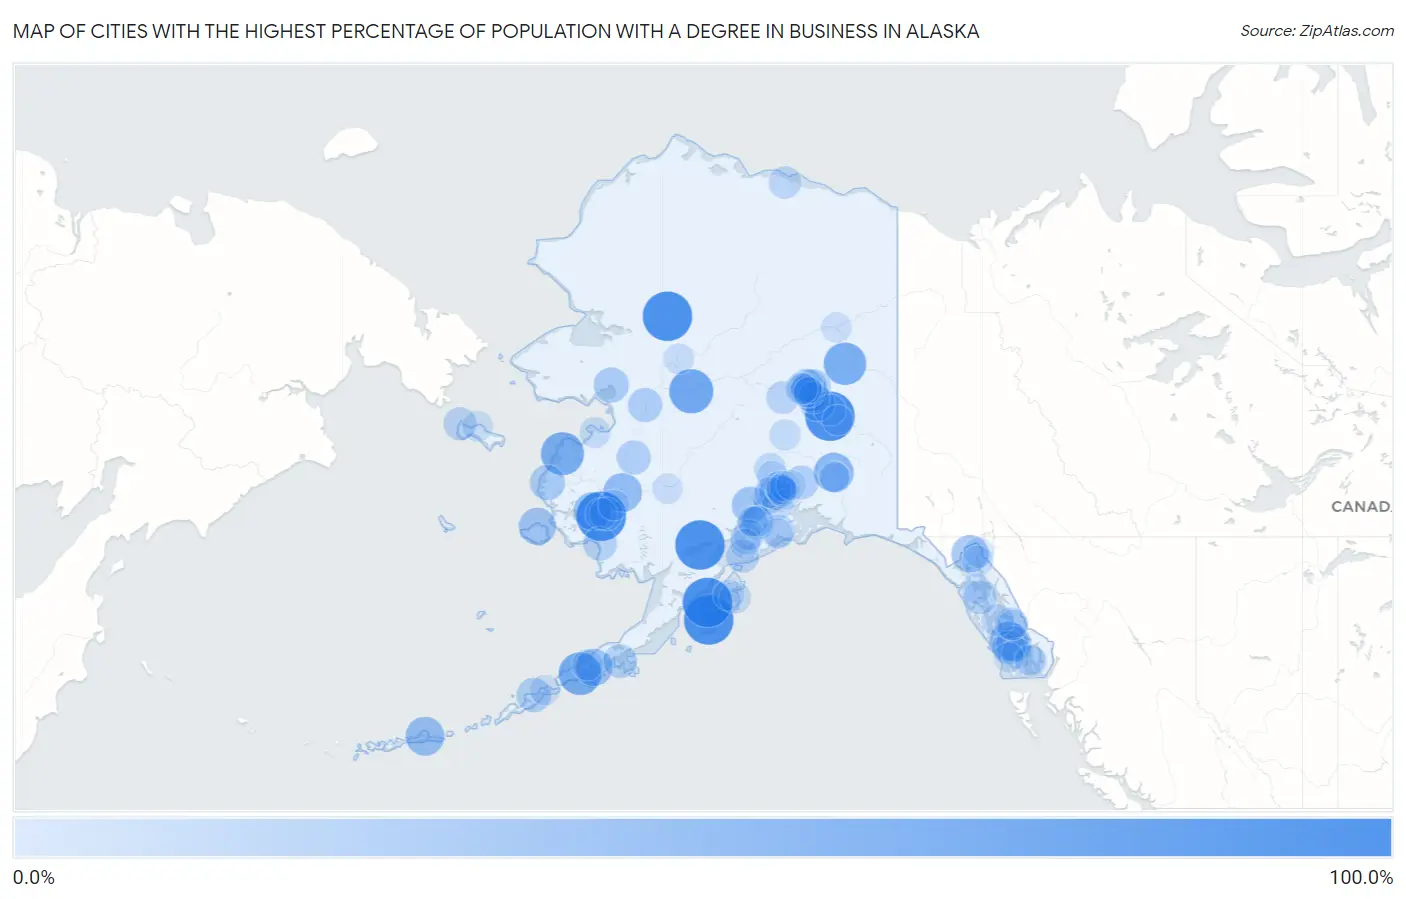
Cities with the Highest Percentage of Population with a Degree in Business in Alaska
| City | % Graduates | vs State | vs National | |
| 1. | Shungnak | 100.0% | 14.0% (+86.0)#1 | 19.5% (+80.5)#75 |
| 2. | Fort Greely | 100.0% | 14.0% (+86.0)#2 | 19.5% (+80.5)#135 |
| 3. | Akhiok | 100.0% | 14.0% (+86.0)#3 | 19.5% (+80.5)#186 |
| 4. | Newhalen | 100.0% | 14.0% (+86.0)#4 | 19.5% (+80.5)#191 |
| 5. | Oscarville | 100.0% | 14.0% (+86.0)#5 | 19.5% (+80.5)#197 |
| 6. | Karluk | 100.0% | 14.0% (+86.0)#6 | 19.5% (+80.5)#263 |
| 7. | Ruby | 75.0% | 14.0% (+61.0)#7 | 19.5% (+55.5)#411 |
| 8. | Emmonak | 69.4% | 14.0% (+55.4)#8 | 19.5% (+49.9)#480 |
| 9. | False Pass | 68.4% | 14.0% (+54.5)#9 | 19.5% (+48.9)#496 |
| 10. | Central | 66.7% | 14.0% (+52.7)#10 | 19.5% (+47.2)#550 |
| 11. | Gulkana | 53.8% | 14.0% (+39.9)#11 | 19.5% (+34.3)#875 |
| 12. | Lower Kalskag | 50.0% | 14.0% (+36.0)#12 | 19.5% (+30.5)#1,041 |
| 13. | Whale Pass | 50.0% | 14.0% (+36.0)#13 | 19.5% (+30.5)#1,103 |
| 14. | Atka | 50.0% | 14.0% (+36.0)#14 | 19.5% (+30.5)#1,147 |
| 15. | Nunapitchuk | 46.2% | 14.0% (+32.2)#15 | 19.5% (+26.7)#1,320 |
| 16. | King Cove | 43.5% | 14.0% (+29.6)#16 | 19.5% (+24.0)#1,491 |
| 17. | Mekoryuk | 42.9% | 14.0% (+28.9)#17 | 19.5% (+23.4)#1,538 |
| 18. | Klukwan | 42.9% | 14.0% (+28.9)#18 | 19.5% (+23.4)#1,560 |
| 19. | Tyonek | 40.0% | 14.0% (+26.0)#19 | 19.5% (+20.5)#1,821 |
| 20. | Coffman Cove | 34.8% | 14.0% (+20.8)#20 | 19.5% (+15.3)#2,594 |
| 21. | Eielson Afb | 33.9% | 14.0% (+20.0)#21 | 19.5% (+14.4)#2,765 |
| 22. | Scammon Bay | 33.3% | 14.0% (+19.4)#22 | 19.5% (+13.8)#2,878 |
| 23. | Koyuk | 33.3% | 14.0% (+19.4)#23 | 19.5% (+13.8)#2,913 |
| 24. | Harding Birch Lakes | 32.1% | 14.0% (+18.2)#24 | 19.5% (+12.6)#3,281 |
| 25. | Unalaska | 30.4% | 14.0% (+16.5)#25 | 19.5% (+10.9)#3,774 |
| 26. | Kaltag | 30.0% | 14.0% (+16.0)#26 | 19.5% (+10.5)#3,908 |
| 27. | Shageluk | 28.6% | 14.0% (+14.6)#27 | 19.5% (+9.07)#4,455 |
| 28. | Glacier View | 28.4% | 14.0% (+14.4)#28 | 19.5% (+8.88)#4,515 |
| 29. | Pleasant Valley | 27.9% | 14.0% (+13.9)#29 | 19.5% (+8.40)#4,725 |
| 30. | Quinhagak | 27.8% | 14.0% (+13.8)#30 | 19.5% (+8.28)#4,768 |
| 31. | Sand Point | 27.7% | 14.0% (+13.7)#31 | 19.5% (+8.16)#4,840 |
| 32. | Two Rivers | 27.5% | 14.0% (+13.6)#32 | 19.5% (+8.04)#4,913 |
| 33. | Funny River | 27.4% | 14.0% (+13.5)#33 | 19.5% (+7.92)#4,976 |
| 34. | Tenakee Springs | 26.5% | 14.0% (+12.6)#34 | 19.5% (+7.03)#5,479 |
| 35. | Naukati Bay | 26.3% | 14.0% (+12.3)#35 | 19.5% (+6.82)#5,620 |
| 36. | Gambell | 25.0% | 14.0% (+11.0)#36 | 19.5% (+5.50)#6,431 |
| 37. | Nanwalek | 24.0% | 14.0% (+10.0)#37 | 19.5% (+4.50)#7,215 |
| 38. | Gateway | 23.9% | 14.0% (+9.90)#38 | 19.5% (+4.37)#7,307 |
| 39. | Kwethluk | 23.8% | 14.0% (+9.84)#39 | 19.5% (+4.31)#7,352 |
| 40. | South Lakes | 23.7% | 14.0% (+9.70)#40 | 19.5% (+4.17)#7,474 |
| 41. | Point Mackenzie | 23.4% | 14.0% (+9.44)#41 | 19.5% (+3.91)#7,696 |
| 42. | Nenana | 22.2% | 14.0% (+8.26)#42 | 19.5% (+2.72)#8,752 |
| 43. | Kupreanof | 22.2% | 14.0% (+8.26)#43 | 19.5% (+2.72)#8,812 |
| 44. | Prudhoe Bay | 22.0% | 14.0% (+8.07)#44 | 19.5% (+2.53)#8,976 |
| 45. | Steele Creek | 21.3% | 14.0% (+7.36)#45 | 19.5% (+1.82)#9,681 |
| 46. | Bear Creek | 21.2% | 14.0% (+7.24)#46 | 19.5% (+1.71)#9,789 |
| 47. | South Van Horn | 20.8% | 14.0% (+6.87)#47 | 19.5% (+1.33)#10,140 |
| 48. | Knik Fairview | 20.7% | 14.0% (+6.73)#48 | 19.5% (+1.20)#10,278 |
| 49. | Kake | 20.3% | 14.0% (+6.37)#49 | 19.5% (+0.840)#10,676 |
| 50. | Kodiak | 18.8% | 14.0% (+4.83)#50 | 19.5% (-0.706)#12,351 |
| 51. | Salcha | 18.5% | 14.0% (+4.55)#51 | 19.5% (-0.981)#12,664 |
| 52. | Meadow Lakes | 17.9% | 14.0% (+3.92)#52 | 19.5% (-1.61)#13,359 |
| 53. | North Pole | 17.9% | 14.0% (+3.91)#53 | 19.5% (-1.62)#13,371 |
| 54. | Talkeetna | 17.9% | 14.0% (+3.90)#54 | 19.5% (-1.63)#13,380 |
| 55. | Happy Valley | 17.4% | 14.0% (+3.39)#55 | 19.5% (-2.14)#13,966 |
| 56. | Big Delta | 16.2% | 14.0% (+2.23)#56 | 19.5% (-3.30)#15,243 |
| 57. | Cantwell | 16.0% | 14.0% (+2.03)#57 | 19.5% (-3.50)#15,469 |
| 58. | Bethel | 15.9% | 14.0% (+1.90)#58 | 19.5% (-3.63)#15,583 |
| 59. | Knik River | 15.8% | 14.0% (+1.82)#59 | 19.5% (-3.71)#15,670 |
| 60. | Susitna North | 15.7% | 14.0% (+1.73)#60 | 19.5% (-3.80)#15,784 |
| 61. | Anchorage | 15.5% | 14.0% (+1.57)#61 | 19.5% (-3.96)#15,952 |
| 62. | Saxman | 15.4% | 14.0% (+1.42)#62 | 19.5% (-4.11)#16,129 |
| 63. | Mud Bay | 15.4% | 14.0% (+1.42)#63 | 19.5% (-4.11)#16,161 |
| 64. | Soldotna | 15.3% | 14.0% (+1.36)#64 | 19.5% (-4.18)#16,198 |
| 65. | Thorne Bay | 15.2% | 14.0% (+1.25)#65 | 19.5% (-4.28)#16,303 |
| 66. | Cold Bay | 15.1% | 14.0% (+1.15)#66 | 19.5% (-4.38)#16,394 |
| 67. | Stebbins | 15.0% | 14.0% (+1.03)#67 | 19.5% (-4.50)#16,493 |
| 68. | North Lakes | 14.9% | 14.0% (+0.962)#68 | 19.5% (-4.57)#16,581 |
| 69. | Big Lake | 14.7% | 14.0% (+0.758)#69 | 19.5% (-4.77)#16,792 |
| 70. | Fishhook | 14.6% | 14.0% (+0.601)#70 | 19.5% (-4.93)#16,953 |
| 71. | Badger | 14.4% | 14.0% (+0.396)#71 | 19.5% (-5.14)#17,127 |
| 72. | Savoonga | 14.3% | 14.0% (+0.319)#72 | 19.5% (-5.21)#17,204 |
| 73. | Tuluksak | 14.3% | 14.0% (+0.319)#73 | 19.5% (-5.21)#17,223 |
| 74. | Port Lions | 14.3% | 14.0% (+0.319)#74 | 19.5% (-5.21)#17,286 |
| 75. | Ketchikan | 14.2% | 14.0% (+0.211)#75 | 19.5% (-5.32)#17,394 |
| 76. | Fairbanks | 14.0% | 14.0% (+0.064)#76 | 19.5% (-5.47)#17,537 |
| 77. | Eareckson Station | 13.9% | 14.0% (-0.078)#77 | 19.5% (-5.61)#17,671 |
| 78. | Seward | 13.8% | 14.0% (-0.169)#78 | 19.5% (-5.70)#17,739 |
| 79. | Sterling | 13.7% | 14.0% (-0.234)#79 | 19.5% (-5.77)#17,810 |
| 80. | Palmer | 13.7% | 14.0% (-0.302)#80 | 19.5% (-5.83)#17,885 |
| 81. | Ninilchik | 13.6% | 14.0% (-0.358)#81 | 19.5% (-5.89)#17,961 |
| 82. | Huslia | 13.3% | 14.0% (-0.634)#82 | 19.5% (-6.17)#18,237 |
| 83. | Petersburg | 13.0% | 14.0% (-0.930)#83 | 19.5% (-6.46)#18,486 |
| 84. | Tazlina | 12.7% | 14.0% (-1.27)#84 | 19.5% (-6.80)#18,786 |
| 85. | Skagway | 12.5% | 14.0% (-1.42)#85 | 19.5% (-6.95)#18,891 |
| 86. | Akutan | 12.5% | 14.0% (-1.47)#86 | 19.5% (-7.00)#18,938 |
| 87. | Sleetmute | 12.5% | 14.0% (-1.47)#87 | 19.5% (-7.00)#19,032 |
| 88. | Anchor Point | 12.4% | 14.0% (-1.61)#88 | 19.5% (-7.15)#19,127 |
| 89. | Hoonah | 12.2% | 14.0% (-1.72)#89 | 19.5% (-7.25)#19,218 |
| 90. | Moose Creek | 12.2% | 14.0% (-1.72)#90 | 19.5% (-7.25)#19,221 |
| 91. | Fort Yukon | 12.2% | 14.0% (-1.72)#91 | 19.5% (-7.25)#19,222 |
| 92. | Juneau City And Borough | 12.1% | 14.0% (-1.88)#92 | 19.5% (-7.41)#19,342 |
| 93. | Deltana | 12.1% | 14.0% (-1.90)#93 | 19.5% (-7.43)#19,350 |
| 94. | Silver Springs | 11.9% | 14.0% (-2.06)#94 | 19.5% (-7.59)#19,502 |
| 95. | Butte | 11.8% | 14.0% (-2.12)#95 | 19.5% (-7.65)#19,540 |
| 96. | Sutton Alpine | 11.8% | 14.0% (-2.20)#96 | 19.5% (-7.73)#19,594 |
| 97. | Farm Loop | 11.6% | 14.0% (-2.37)#97 | 19.5% (-7.90)#19,734 |
| 98. | Craig | 11.6% | 14.0% (-2.39)#98 | 19.5% (-7.92)#19,754 |
| 99. | Kenai | 11.4% | 14.0% (-2.52)#99 | 19.5% (-8.05)#19,862 |
| 100. | Chickaloon | 11.1% | 14.0% (-2.86)#100 | 19.5% (-8.39)#20,174 |
Common Questions
What are the Top 10 Cities with the Highest Percentage of Population with a Degree in Business in Alaska?
Top 10 Cities with the Highest Percentage of Population with a Degree in Business in Alaska are:
#1
100.0%
#2
100.0%
#3
100.0%
#4
100.0%
#5
100.0%
#6
100.0%
#7
75.0%
#8
69.4%
#9
68.4%
#10
66.7%
What city has the Highest Percentage of Population with a Degree in Business in Alaska?
Shungnak has the Highest Percentage of Population with a Degree in Business in Alaska with 100.0%.
What is the Percentage of Population with a Degree in Business in the State of Alaska?
Percentage of Population with a Degree in Business in Alaska is 14.0%.
What is the Percentage of Population with a Degree in Business in the United States?
Percentage of Population with a Degree in Business in the United States is 19.5%.