Zip Codes with the Highest Percentage of Households Heated by Fuel Oil / Kerosene in New York
RELATED REPORTS & OPTIONS
Fuel Oil Heating
New York
Compare Zip Codes
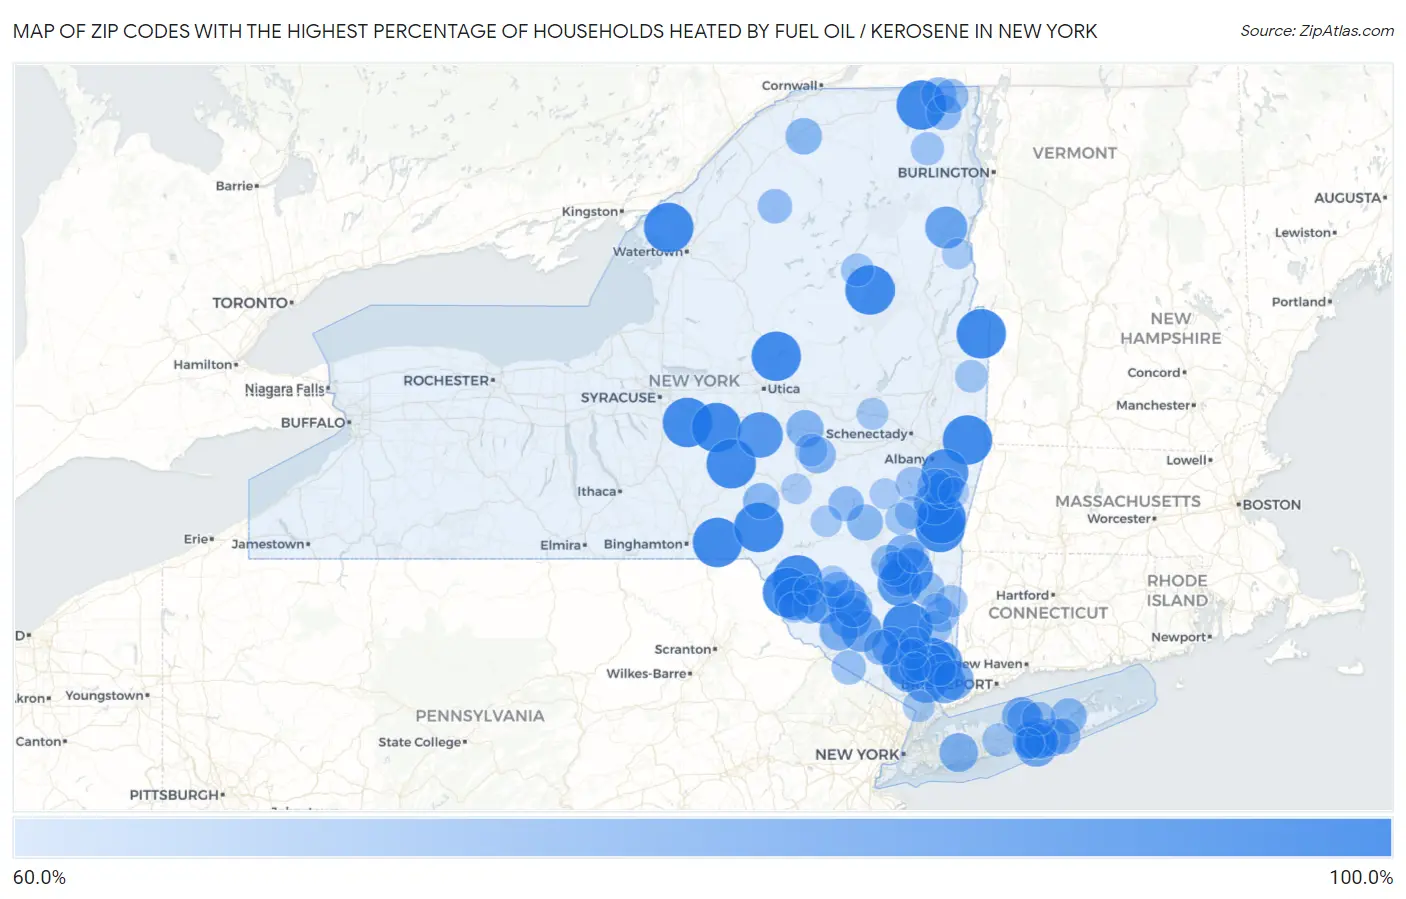
Map of Zip Codes with the Highest Percentage of Households Heated by Fuel Oil / Kerosene in New York
60.0%
100.0%
Zip Codes with the Highest Percentage of Households Heated by Fuel Oil / Kerosene in New York
| Zip Code | Fuel Oil Heating | vs State | vs National | |
| 1. | 10527 | 100.0% | 17.9%(+82.1)#1 | 4.2%(+95.8)#4 |
| 2. | 12530 | 100.0% | 17.9%(+82.1)#2 | 4.2%(+95.8)#12 |
| 3. | 12512 | 100.0% | 17.9%(+82.1)#3 | 4.2%(+95.8)#23 |
| 4. | 13632 | 100.0% | 17.9%(+82.1)#4 | 4.2%(+95.8)#33 |
| 5. | 12854 | 100.0% | 17.9%(+82.1)#5 | 4.2%(+95.8)#37 |
| 6. | 13826 | 100.0% | 17.9%(+82.1)#6 | 4.2%(+95.8)#38 |
| 7. | 12724 | 100.0% | 17.9%(+82.1)#7 | 4.2%(+95.8)#45 |
| 8. | 13051 | 100.0% | 17.9%(+82.1)#8 | 4.2%(+95.8)#60 |
| 9. | 12544 | 100.0% | 17.9%(+82.1)#9 | 4.2%(+95.8)#64 |
| 10. | 13484 | 100.0% | 17.9%(+82.1)#11 | 4.2%(+95.8)#70 |
| 11. | 13352 | 100.0% | 17.9%(+82.1)#12 | 4.2%(+95.8)#71 |
| 12. | 12933 | 100.0% | 17.9%(+82.1)#13 | 4.2%(+95.8)#76 |
| 13. | 13814 | 100.0% | 17.9%(+82.1)#14 | 4.2%(+95.8)#85 |
| 14. | 13847 | 100.0% | 17.9%(+82.1)#15 | 4.2%(+95.8)#87 |
| 15. | 12864 | 100.0% | 17.9%(+82.1)#16 | 4.2%(+95.8)#94 |
| 16. | 12745 | 100.0% | 17.9%(+82.1)#17 | 4.2%(+95.8)#95 |
| 17. | 12082 | 100.0% | 17.9%(+82.1)#18 | 4.2%(+95.8)#97 |
| 18. | 12063 | 95.7% | 17.9%(+77.8)#19 | 4.2%(+91.5)#117 |
| 19. | 10922 | 94.8% | 17.9%(+76.9)#20 | 4.2%(+90.6)#123 |
| 20. | 12574 | 94.1% | 17.9%(+76.2)#21 | 4.2%(+89.9)#129 |
| 21. | 13364 | 93.9% | 17.9%(+76.0)#22 | 4.2%(+89.7)#133 |
| 22. | 12471 | 92.5% | 17.9%(+74.6)#23 | 4.2%(+88.3)#139 |
| 23. | 10546 | 89.7% | 17.9%(+71.8)#24 | 4.2%(+85.5)#161 |
| 24. | 12750 | 89.3% | 17.9%(+71.4)#25 | 4.2%(+85.1)#168 |
| 25. | 10578 | 88.8% | 17.9%(+70.9)#26 | 4.2%(+84.6)#171 |
| 26. | 12742 | 88.6% | 17.9%(+70.7)#27 | 4.2%(+84.4)#172 |
| 27. | 12781 | 88.4% | 17.9%(+70.5)#28 | 4.2%(+84.2)#176 |
| 28. | 12964 | 88.2% | 17.9%(+70.3)#29 | 4.2%(+84.0)#177 |
| 29. | 10501 | 88.0% | 17.9%(+70.1)#30 | 4.2%(+83.8)#179 |
| 30. | 12174 | 87.9% | 17.9%(+70.0)#31 | 4.2%(+83.7)#181 |
| 31. | 10506 | 87.0% | 17.9%(+69.1)#32 | 4.2%(+82.8)#191 |
| 32. | 10919 | 87.0% | 17.9%(+69.1)#33 | 4.2%(+82.8)#192 |
| 33. | 11951 | 86.5% | 17.9%(+68.6)#34 | 4.2%(+82.3)#197 |
| 34. | 12435 | 85.4% | 17.9%(+67.5)#35 | 4.2%(+81.2)#205 |
| 35. | 11950 | 85.3% | 17.9%(+67.4)#36 | 4.2%(+81.1)#207 |
| 36. | 10576 | 84.6% | 17.9%(+66.7)#37 | 4.2%(+80.4)#217 |
| 37. | 10596 | 83.5% | 17.9%(+65.6)#38 | 4.2%(+79.3)#222 |
| 38. | 11756 | 83.1% | 17.9%(+65.2)#39 | 4.2%(+78.9)#223 |
| 39. | 12577 | 82.8% | 17.9%(+64.9)#40 | 4.2%(+78.6)#225 |
| 40. | 12785 | 82.7% | 17.9%(+64.8)#41 | 4.2%(+78.5)#229 |
| 41. | 12456 | 82.6% | 17.9%(+64.7)#42 | 4.2%(+78.4)#230 |
| 42. | 11789 | 82.5% | 17.9%(+64.6)#43 | 4.2%(+78.3)#232 |
| 43. | 12411 | 82.3% | 17.9%(+64.4)#44 | 4.2%(+78.1)#234 |
| 44. | 11972 | 81.8% | 17.9%(+63.9)#45 | 4.2%(+77.6)#240 |
| 45. | 13468 | 80.8% | 17.9%(+62.9)#46 | 4.2%(+76.6)#251 |
| 46. | 11967 | 80.6% | 17.9%(+62.7)#47 | 4.2%(+76.4)#252 |
| 47. | 12483 | 80.5% | 17.9%(+62.6)#48 | 4.2%(+76.3)#256 |
| 48. | 13488 | 79.7% | 17.9%(+61.8)#49 | 4.2%(+75.5)#266 |
| 49. | 13859 | 79.4% | 17.9%(+61.5)#50 | 4.2%(+75.2)#272 |
| 50. | 12130 | 79.3% | 17.9%(+61.4)#51 | 4.2%(+75.1)#275 |
| 51. | 13696 | 79.3% | 17.9%(+61.4)#52 | 4.2%(+75.1)#276 |
| 52. | 11948 | 78.9% | 17.9%(+61.0)#53 | 4.2%(+74.7)#279 |
| 53. | 11778 | 78.8% | 17.9%(+60.9)#54 | 4.2%(+74.6)#281 |
| 54. | 12788 | 78.7% | 17.9%(+60.8)#55 | 4.2%(+74.5)#284 |
| 55. | 12452 | 78.6% | 17.9%(+60.7)#56 | 4.2%(+74.4)#288 |
| 56. | 11959 | 78.3% | 17.9%(+60.4)#57 | 4.2%(+74.1)#294 |
| 57. | 12959 | 77.8% | 17.9%(+59.9)#58 | 4.2%(+73.6)#299 |
| 58. | 12491 | 77.6% | 17.9%(+59.7)#59 | 4.2%(+73.4)#306 |
| 59. | 10914 | 77.5% | 17.9%(+59.6)#60 | 4.2%(+73.3)#308 |
| 60. | 12910 | 77.4% | 17.9%(+59.5)#61 | 4.2%(+73.2)#309 |
| 61. | 12434 | 77.4% | 17.9%(+59.5)#62 | 4.2%(+73.2)#310 |
| 62. | 12132 | 77.3% | 17.9%(+59.4)#63 | 4.2%(+73.1)#313 |
| 63. | 11934 | 77.0% | 17.9%(+59.1)#64 | 4.2%(+72.8)#315 |
| 64. | 12156 | 77.0% | 17.9%(+59.1)#65 | 4.2%(+72.8)#316 |
| 65. | 12958 | 76.3% | 17.9%(+58.4)#66 | 4.2%(+72.1)#333 |
| 66. | 12749 | 76.2% | 17.9%(+58.3)#67 | 4.2%(+72.0)#335 |
| 67. | 13639 | 76.2% | 17.9%(+58.3)#68 | 4.2%(+72.0)#336 |
| 68. | 10969 | 76.0% | 17.9%(+58.1)#69 | 4.2%(+71.8)#337 |
| 69. | 12443 | 75.7% | 17.9%(+57.8)#70 | 4.2%(+71.5)#346 |
| 70. | 12578 | 75.6% | 17.9%(+57.7)#71 | 4.2%(+71.4)#348 |
| 71. | 12570 | 75.5% | 17.9%(+57.6)#72 | 4.2%(+71.3)#350 |
| 72. | 11792 | 75.2% | 17.9%(+57.3)#73 | 4.2%(+71.0)#359 |
| 73. | 12046 | 75.1% | 17.9%(+57.2)#74 | 4.2%(+70.9)#362 |
| 74. | 12582 | 74.7% | 17.9%(+56.8)#75 | 4.2%(+70.5)#372 |
| 75. | 11749 | 74.2% | 17.9%(+56.3)#76 | 4.2%(+70.0)#382 |
| 76. | 12812 | 74.1% | 17.9%(+56.2)#77 | 4.2%(+69.9)#385 |
| 77. | 12978 | 74.1% | 17.9%(+56.2)#78 | 4.2%(+69.9)#386 |
| 78. | 13450 | 73.9% | 17.9%(+56.0)#79 | 4.2%(+69.7)#390 |
| 79. | 12823 | 73.5% | 17.9%(+55.6)#80 | 4.2%(+69.3)#402 |
| 80. | 12451 | 73.2% | 17.9%(+55.3)#81 | 4.2%(+69.0)#416 |
| 81. | 12522 | 73.1% | 17.9%(+55.2)#82 | 4.2%(+68.9)#417 |
| 82. | 12473 | 72.7% | 17.9%(+54.8)#83 | 4.2%(+68.5)#426 |
| 83. | 10517 | 72.7% | 17.9%(+54.8)#84 | 4.2%(+68.5)#427 |
| 84. | 10536 | 72.5% | 17.9%(+54.6)#85 | 4.2%(+68.3)#431 |
| 85. | 12069 | 72.0% | 17.9%(+54.1)#86 | 4.2%(+67.8)#448 |
| 86. | 10503 | 71.9% | 17.9%(+54.0)#87 | 4.2%(+67.7)#451 |
| 87. | 12765 | 71.4% | 17.9%(+53.5)#88 | 4.2%(+67.2)#464 |
| 88. | 12459 | 71.4% | 17.9%(+53.5)#89 | 4.2%(+67.2)#467 |
| 89. | 12540 | 71.2% | 17.9%(+53.3)#90 | 4.2%(+67.0)#470 |
| 90. | 11719 | 71.2% | 17.9%(+53.3)#91 | 4.2%(+67.0)#471 |
| 91. | 10516 | 70.9% | 17.9%(+53.0)#92 | 4.2%(+66.7)#477 |
| 92. | 12507 | 70.9% | 17.9%(+53.0)#93 | 4.2%(+66.7)#482 |
| 93. | 12928 | 70.8% | 17.9%(+52.9)#94 | 4.2%(+66.6)#483 |
| 94. | 10524 | 70.7% | 17.9%(+52.8)#95 | 4.2%(+66.5)#486 |
| 95. | 12136 | 70.7% | 17.9%(+52.8)#96 | 4.2%(+66.5)#488 |
| 96. | 12460 | 70.4% | 17.9%(+52.5)#97 | 4.2%(+66.2)#503 |
| 97. | 13860 | 70.3% | 17.9%(+52.4)#98 | 4.2%(+66.1)#508 |
| 98. | 12726 | 70.1% | 17.9%(+52.2)#99 | 4.2%(+65.9)#519 |
| 99. | 10567 | 69.8% | 17.9%(+51.9)#100 | 4.2%(+65.6)#533 |
| 100. | 12787 | 69.7% | 17.9%(+51.8)#101 | 4.2%(+65.5)#544 |
Common Questions
What are the Top 10 Zip Codes with the Highest Percentage of Households Heated by Fuel Oil / Kerosene in New York?
Top 10 Zip Codes with the Highest Percentage of Households Heated by Fuel Oil / Kerosene in New York are:
What zip code has the Highest Percentage of Households Heated by Fuel Oil / Kerosene in New York?
10527 has the Highest Percentage of Households Heated by Fuel Oil / Kerosene in New York with 100.0%.
What is the Percentage of Households Heated by Fuel Oil / Kerosene in the State of New York?
Percentage of Households Heated by Fuel Oil / Kerosene in New York is 17.9%.
What is the Percentage of Households Heated by Fuel Oil / Kerosene in the United States?
Percentage of Households Heated by Fuel Oil / Kerosene in the United States is 4.2%.