Zip Codes with the Highest Percentage of Households With Three or more Vehicles in Danville, IL
RELATED REPORTS & OPTIONS
Households with 3 or more Cars
Danville
Compare Zip Codes
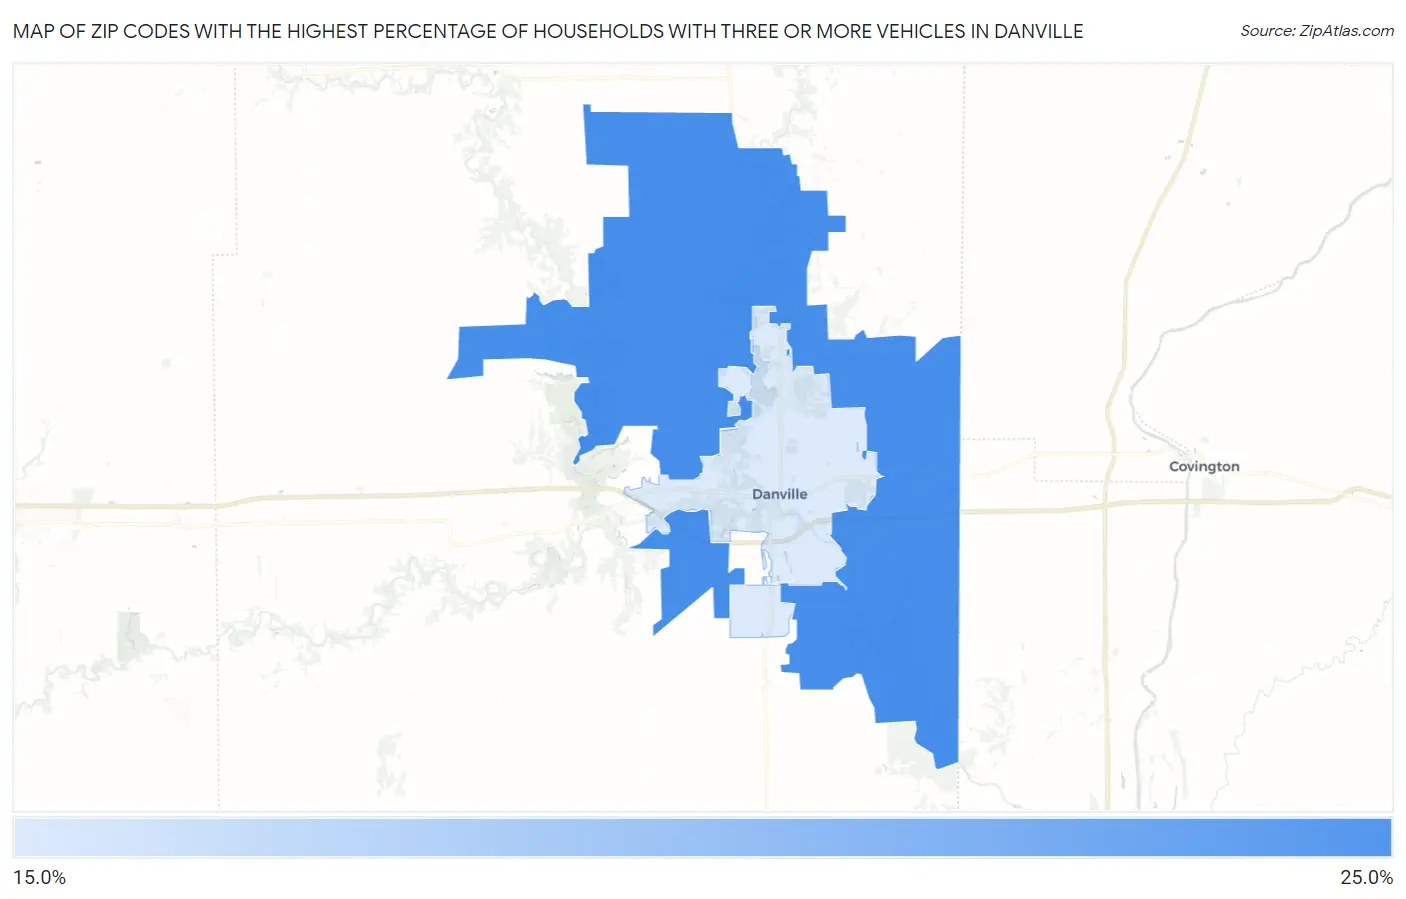
Map of Zip Codes with the Highest Percentage of Households With Three or more Vehicles in Danville
17.1%
21.7%
Zip Codes with the Highest Percentage of Households With Three or more Vehicles in Danville, IL
| Zip Code | Housholds With 3+ Cars | vs State | vs National | |
| 1. | 61834 | 21.7% | 24.5%(-2.80)#1,081 | 29.0%(-7.30)#25,515 |
| 2. | 61832 | 17.1% | 24.5%(-7.40)#1,233 | 29.0%(-11.9)#28,256 |
1
Common Questions
What are the Top Zip Codes with the Highest Percentage of Households With Three or more Vehicles in Danville, IL?
Top Zip Codes with the Highest Percentage of Households With Three or more Vehicles in Danville, IL are:
What zip code has the Highest Percentage of Households With Three or more Vehicles in Danville, IL?
61834 has the Highest Percentage of Households With Three or more Vehicles in Danville, IL with 21.7%.
What is the Percentage of Households With Three or more Vehicles in Danville, IL?
Percentage of Households With Three or more Vehicles in Danville is 15.1%.
What is the Percentage of Households With Three or more Vehicles in Illinois?
Percentage of Households With Three or more Vehicles in Illinois is 24.5%.
What is the Percentage of Households With Three or more Vehicles in the United States?
Percentage of Households With Three or more Vehicles in the United States is 29.0%.