Cities with the Highest Percentage of Croatian Population in Georgia

RELATED REPORTS & OPTIONS

Croatian
Population
Families and Households
Female Fertility
Female Fertility (Unmarried)
Race (Community Size)
Race (Percentage)
Ancestry (Community Size)
AfghanAfricanAlaska NativeAlaskan AthabascanAlbanianAleutAlsatianAmericanApacheArabArapahoArgentineanArmenianAssyrian / Chaldean / SyriacAustralianAustrianBahamianBangladeshiBarbadianBasqueBelgianBelizeanBermudanBhutaneseBlackfeetBolivianBrazilianBritishBritish West IndianBulgarianBurmeseCajunCambodianCanadianCape VerdeanCarpatho RusynCelticCentral AmericanCentral American IndianCherokeeCheyenneChickasawChileanChineseChippewaChoctawColombianColvilleComancheCosta RicanCreeCreekCroatianCrowCubanCypriotCzechCzechoslovakianDanishDelawareDominicanDutchDutch West IndianEastern EuropeanEcuadorianEgyptianEnglishEstonianEthiopianEuropeanFijianFilipinoFinnishFrenchFrench American IndianFrench CanadianGermanGerman RussianGhanaianGreekGuamanian / ChamorroGuatemalanGuyaneseHaitianHmongHonduranHopiHoumaHungarianIcelanderIndian (Asian)IndonesianInupiatIranianIraqiIrishIroquoisIsraeliItalianJamaicanJapaneseJordanianKenyanKiowaKoreanLaotianLatvianLebaneseLiberianLithuanianLumbeeLuxembourgerMacedonianMalaysianMalteseMarshalleseMenomineeMexicanMexican American IndianMongolianMoroccanNative HawaiianNavajoNepaleseNew ZealanderNicaraguanNigerianNorthern EuropeanNorwegianOkinawanOsageOttawaPaiutePakistaniPalestinianPanamanianParaguayanPennsylvania GermanPeruvianPimaPolishPortuguesePotawatomiPuebloPuerto RicanPuget Sound SalishRomanianRussianSalvadoranSamoanScandinavianScotch-IrishScottishSeminoleSenegaleseSerbianShoshoneSierra LeoneanSiouxSlavicSlovakSloveneSomaliSouth AfricanSouth AmericanSouth American IndianSoviet UnionSpaniardSpanishSpanish AmericanSpanish American IndianSri LankanSubsaharan AfricanSudaneseSwedishSwissSyrianTaiwaneseThaiTlingit-HaidaTohono O'OdhamTonganTrinidadian and TobagonianTsimshianTurkishU.S. Virgin IslanderUgandanUkrainianUruguayanUteVenezuelanVietnameseWelshWest IndianYakamaYaquiYugoslavianYumanYup'ikZimbabwean
Ancestry (Percentage)
AfghanAfricanAlaska NativeAlaskan AthabascanAlbanianAleutAlsatianAmericanApacheArabArapahoArgentineanArmenianAssyrian / Chaldean / SyriacAustralianAustrianBahamianBangladeshiBarbadianBasqueBelgianBelizeanBermudanBhutaneseBlackfeetBolivianBrazilianBritishBritish West IndianBulgarianBurmeseCajunCambodianCanadianCape VerdeanCarpatho RusynCelticCentral AmericanCentral American IndianCherokeeCheyenneChickasawChileanChineseChippewaChoctawColombianColvilleComancheCosta RicanCreeCreekCroatianCrowCubanCypriotCzechCzechoslovakianDanishDelawareDominicanDutchDutch West IndianEastern EuropeanEcuadorianEgyptianEnglishEstonianEthiopianEuropeanFijianFilipinoFinnishFrenchFrench American IndianFrench CanadianGermanGerman RussianGhanaianGreekGuamanian / ChamorroGuatemalanGuyaneseHaitianHmongHonduranHopiHoumaHungarianIcelanderIndian (Asian)IndonesianInupiatIranianIraqiIrishIroquoisIsraeliItalianJamaicanJapaneseJordanianKenyanKiowaKoreanLaotianLatvianLebaneseLiberianLithuanianLumbeeLuxembourgerMacedonianMalaysianMalteseMarshalleseMenomineeMexicanMexican American IndianMongolianMoroccanNative HawaiianNavajoNepaleseNew ZealanderNicaraguanNigerianNorthern EuropeanNorwegianOkinawanOsageOttawaPaiutePakistaniPalestinianPanamanianParaguayanPennsylvania GermanPeruvianPimaPolishPortuguesePotawatomiPuebloPuerto RicanPuget Sound SalishRomanianRussianSalvadoranSamoanScandinavianScotch-IrishScottishSeminoleSenegaleseSerbianShoshoneSierra LeoneanSiouxSlavicSlovakSloveneSomaliSouth AfricanSouth AmericanSouth American IndianSoviet UnionSpaniardSpanishSpanish AmericanSpanish American IndianSri LankanSubsaharan AfricanSudaneseSwedishSwissSyrianTaiwaneseThaiTlingit-HaidaTohono O'OdhamTonganTrinidadian and TobagonianTsimshianTurkishU.S. Virgin IslanderUgandanUkrainianUruguayanUteVenezuelanVietnameseWelshWest IndianYakamaYaquiYugoslavianYumanYup'ikZimbabwean
Immigrant Origin (Total)
AfghanistanAfricaAlbaniaArgentinaArmeniaAsiaAustraliaAustriaAzoresBahamasBangladeshBarbadosBelarusBelgiumBelizeBoliviaBosnia and HerzegovinaBrazilBulgariaBurma / MyanmarCabo VerdeCambodiaCameroonCanadaCaribbeanCentral AmericaChileChinaColombiaCongoCosta RicaCroatiaCubaCzechoslovakiaDenmarkDominicaDominican RepublicEastern AfricaEastern AsiaEastern EuropeEcuadorEgyptEl SalvadorEnglandEritreaEthiopiaEuropeFijiFranceGermanyGhanaGreeceGrenadaGuatemalaGuyanaHaitiHondurasHong KongHungaryIndiaIndonesiaIranIraqIrelandIsraelItalyJamaicaJapanJordanKazakhstanKenyaKoreaKuwaitLaosLatin AmericaLatviaLebanonLiberiaLithuaniaMalaysiaMexicoMicronesiaMiddle AfricaMoldovaMoroccoNepalNetherlandsNicaraguaNigeriaNorth MacedoniaNorthern AfricaNorthern EuropeNorwayOceaniaPakistanPanamaPeruPhilippinesPolandPortugalRomaniaRussiaSaudi ArabiaScotlandSenegalSerbiaSierra LeoneSingaporeSomaliaSouth AfricaSouth AmericaSouth Central AsiaSouth Eastern AsiaSouthern EuropeSpainSri LankaSt. Vincent and the GrenadinesSudanSwedenSwitzerlandSyriaTaiwanThailandTrinidad and TobagoTurkeyUgandaUkraineUruguayUzbekistanVenezuelaVietnamWest IndiesWestern AfricaWestern AsiaWestern EuropeYemenZaireZimbabwe
Immigrant Origin (Percentage)
AfghanistanAfricaAlbaniaArgentinaArmeniaAsiaAustraliaAustriaAzoresBahamasBangladeshBarbadosBelarusBelgiumBelizeBoliviaBosnia and HerzegovinaBrazilBulgariaBurma / MyanmarCabo VerdeCambodiaCameroonCanadaCaribbeanCentral AmericaChileChinaColombiaCongoCosta RicaCroatiaCubaCzechoslovakiaDenmarkDominicaDominican RepublicEastern AfricaEastern AsiaEastern EuropeEcuadorEgyptEl SalvadorEnglandEritreaEthiopiaEuropeFijiFranceGermanyGhanaGreeceGrenadaGuatemalaGuyanaHaitiHondurasHong KongHungaryIndiaIndonesiaIranIraqIrelandIsraelItalyJamaicaJapanJordanKazakhstanKenyaKoreaKuwaitLaosLatin AmericaLatviaLebanonLiberiaLithuaniaMalaysiaMexicoMicronesiaMiddle AfricaMoldovaMoroccoNepalNetherlandsNicaraguaNigeriaNorth MacedoniaNorthern AfricaNorthern EuropeNorwayOceaniaPakistanPanamaPeruPhilippinesPolandPortugalRomaniaRussiaSaudi ArabiaScotlandSenegalSerbiaSierra LeoneSingaporeSomaliaSouth AfricaSouth AmericaSouth Central AsiaSouth Eastern AsiaSouthern EuropeSpainSri LankaSt. Vincent and the GrenadinesSudanSwedenSwitzerlandSyriaTaiwanThailandTrinidad and TobagoTurkeyUgandaUkraineUruguayUzbekistanVenezuelaVietnamWest IndiesWestern AfricaWestern AsiaWestern EuropeYemenZaireZimbabwe
Income
Income (Families)
Income (Households)
Poverty
Poverty (Families)
Unemployment
Employment Occupations
Employment Industries
Employer Class
Commute Time
Commute Means
School Enrollment
Education by Degree Field
Occupancy
Finances
Physical Characteristics
Georgia
Compare Cities
Comparison Subject

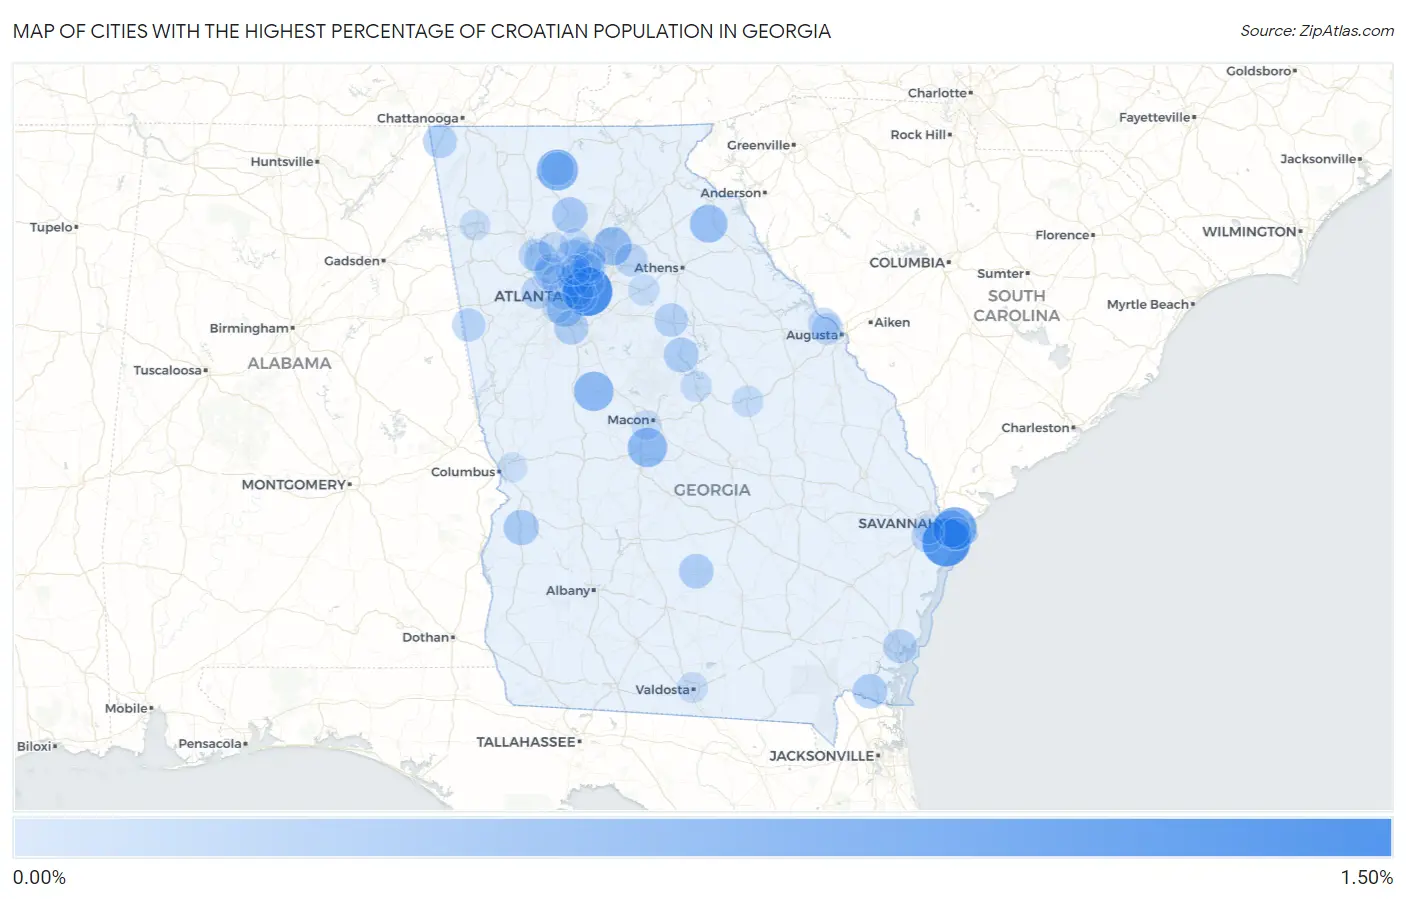
Map of Cities with the Highest Percentage of Croatian Population in Georgia

0.00%
1.50%
Cities with the Highest Percentage of Croatian Population in Georgia Map

Cities with the Highest Percentage of Croatian Population in Georgia

City Croatian vs State vs National
1.Pine Lake1.01%0.035%(+0.978)#10.12%(+0.893)#818
2.Skidaway Island0.93%0.035%(+0.890)#20.12%(+0.805)#890
3.Talahi Island0.68%0.035%(+0.640)#30.12%(+0.554)#1,237
4.East Ellijay0.57%0.035%(+0.531)#40.12%(+0.445)#1,458
5.Barnesville0.48%0.035%(+0.448)#50.12%(+0.363)#1,685
6.Centerville0.47%0.035%(+0.439)#60.12%(+0.354)#1,710
7.Buford0.41%0.035%(+0.377)#70.12%(+0.292)#1,909
8.Franklin Springs0.38%0.035%(+0.349)#80.12%(+0.264)#2,012
9.Whitemarsh Island0.35%0.035%(+0.318)#90.12%(+0.233)#2,140
10.Hapeville0.29%0.035%(+0.254)#100.12%(+0.169)#2,456
11.Ball Ground0.28%0.035%(+0.242)#110.12%(+0.156)#2,529
12.Lumpkin0.26%0.035%(+0.222)#120.12%(+0.137)#2,670
13.Eatonton0.24%0.035%(+0.200)#130.12%(+0.115)#2,839
14.Fitzgerald0.22%0.035%(+0.187)#140.12%(+0.102)#2,938
15.Kingsland0.22%0.035%(+0.185)#150.12%(+0.100)#2,951
16.Chamblee0.21%0.035%(+0.175)#160.12%(+0.089)#3,047
17.Jonesboro0.20%0.035%(+0.168)#170.12%(+0.083)#3,099
18.Trenton0.18%0.035%(+0.147)#180.12%(+0.062)#3,286
19.Brunswick0.18%0.035%(+0.142)#190.12%(+0.056)#3,349
20.Kennesaw0.18%0.035%(+0.141)#200.12%(+0.056)#3,351
21.Madison0.17%0.035%(+0.139)#210.12%(+0.054)#3,380
22.Ellijay0.17%0.035%(+0.136)#220.12%(+0.051)#3,411
23.Berkeley Lake0.16%0.035%(+0.123)#230.12%(+0.038)#3,553
24.Roswell0.16%0.035%(+0.122)#240.12%(+0.037)#3,564
25.Bowdon0.15%0.035%(+0.119)#250.12%(+0.034)#3,598
26.Auburn0.14%0.035%(+0.106)#260.12%(+0.020)#3,732
27.Lithia Springs0.13%0.035%(+0.096)#270.12%(+0.010)#3,855
28.Fair Oaks0.12%0.035%(+0.089)#280.12%(+0.004)#3,927
29.Georgetown0.12%0.035%(+0.085)#290.12%(-0.001)#3,978
30.Acworth0.11%0.035%(+0.077)#300.12%(-0.009)#4,068
31.Vinings0.11%0.035%(+0.073)#310.12%(-0.013)#4,124
32.North Decatur0.10%0.035%(+0.069)#320.12%(-0.016)#4,175
33.Belvedere Park0.10%0.035%(+0.068)#330.12%(-0.018)#4,191
34.Evans0.099%0.035%(+0.063)#340.12%(-0.022)#4,251
35.Brookhaven0.097%0.035%(+0.061)#350.12%(-0.024)#4,283
36.Martinez0.095%0.035%(+0.059)#360.12%(-0.026)#4,302
37.Atlanta0.087%0.035%(+0.051)#370.12%(-0.034)#4,402
38.Johns Creek0.080%0.035%(+0.045)#380.12%(-0.040)#4,482
39.Wilmington Island0.079%0.035%(+0.043)#390.12%(-0.042)#4,502
40.Sandy Springs0.077%0.035%(+0.042)#400.12%(-0.043)#4,523
41.Sandersville0.070%0.035%(+0.034)#410.12%(-0.051)#4,646
42.Decatur0.061%0.035%(+0.026)#420.12%(-0.059)#4,757
43.Milledgeville0.059%0.035%(+0.023)#430.12%(-0.062)#4,798
44.Monroe0.053%0.035%(+0.018)#440.12%(-0.067)#4,872
45.Norcross0.051%0.035%(+0.016)#450.12%(-0.069)#4,896
46.Alpharetta0.050%0.035%(+0.015)#460.12%(-0.071)#4,912
47.East Point0.045%0.035%(+0.009)#470.12%(-0.076)#4,987
48.Valdosta0.043%0.035%(+0.008)#480.12%(-0.077)#5,001
49.Milton0.029%0.035%(-0.006)#490.12%(-0.091)#5,189
50.Rome0.029%0.035%(-0.006)#500.12%(-0.091)#5,191
51.Athens-Clarke County Unified Government (Balance)0.028%0.035%(-0.008)#510.12%(-0.093)#5,221
52.Savannah0.020%0.035%(-0.015)#520.12%(-0.100)#5,310
53.Macon Bibb County0.019%0.035%(-0.016)#530.12%(-0.101)#5,329
54.Peachtree Corners0.019%0.035%(-0.016)#540.12%(-0.102)#5,333
55.Marietta0.016%0.035%(-0.019)#550.12%(-0.104)#5,361
56.Tucker0.016%0.035%(-0.019)#560.12%(-0.104)#5,363
57.Dunwoody0.016%0.035%(-0.020)#570.12%(-0.105)#5,369
58.Woodstock0.014%0.035%(-0.021)#580.12%(-0.106)#5,385
59.Columbus0.0034%0.035%(-0.032)#590.12%(-0.117)#5,450
60.Augusta-Richmond County Consolidated Government (Balance)0.0020%0.035%(-0.033)#600.12%(-0.119)#5,455

Common Questions

What are the Top 10 Cities with the Highest Percentage of Croatian Population in Georgia?
Top 10 Cities with the Highest Percentage of Croatian Population in Georgia are:
What city has the Highest Percentage of Croatian Population in Georgia?
Pine Lake has the Highest Percentage of Croatian Population in Georgia with 1.01%.
What is the Percentage of Croatian Population in the State of Georgia?
Percentage of Croatian Population in Georgia is 0.035%.
What is the Percentage of Croatian Population in the United States?
Percentage of Croatian Population in the United States is 0.12%.