Zip Codes with the Highest Percentage of Population with a Degree in Engineering in Greenwich, CT
RELATED REPORTS & OPTIONS
Engineering
Greenwich
Compare Zip Codes
Map of Zip Codes with the Highest Percentage of Population with a Degree in Engineering in Greenwich
5.6%
6.1%
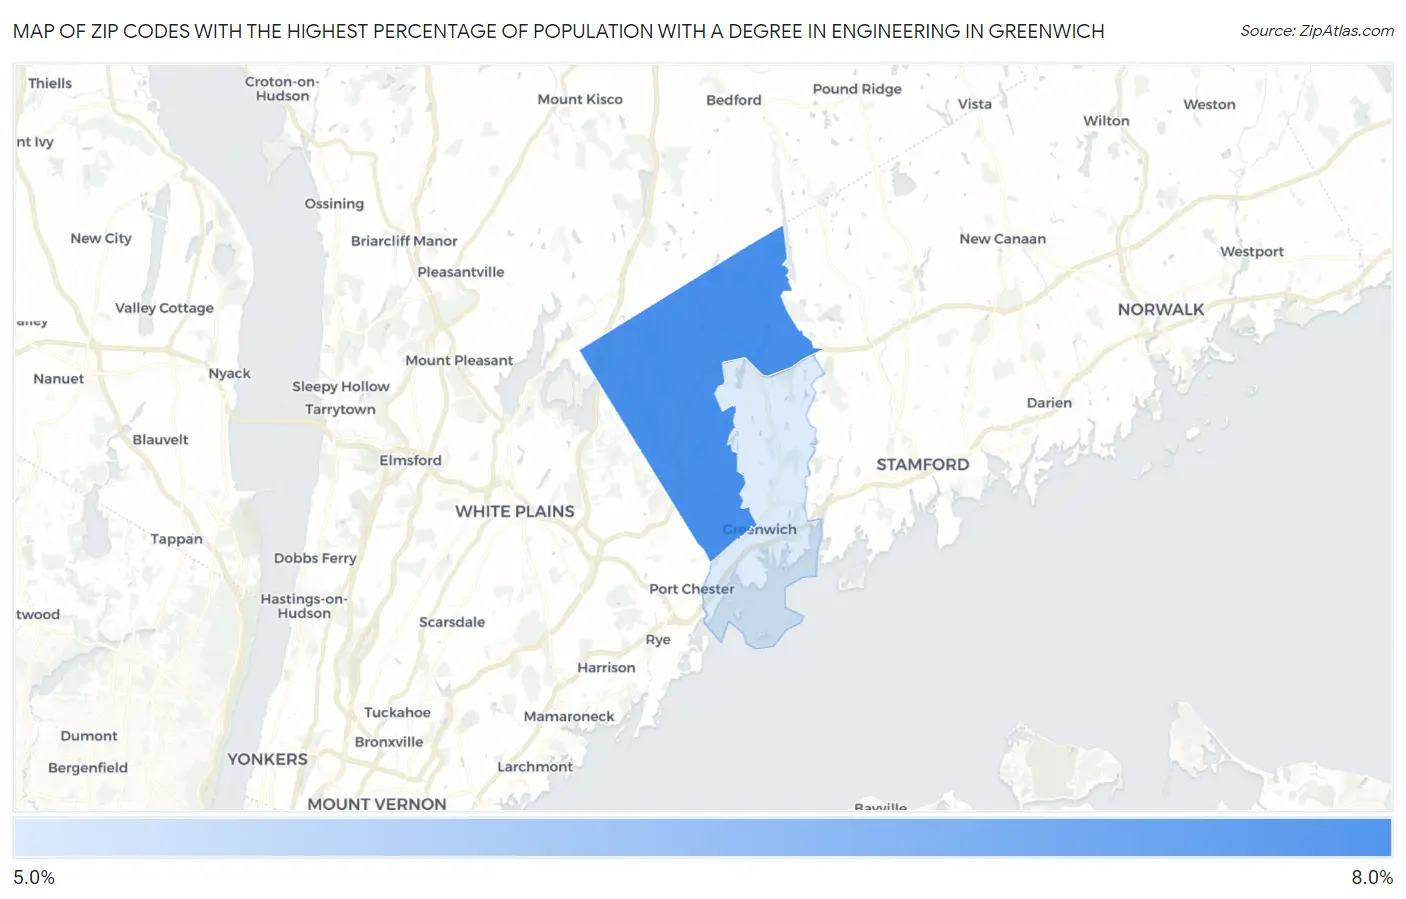
Zip Codes with the Highest Percentage of Population with a Degree in Engineering in Greenwich, CT
| Zip Code | % Graduates | vs State | vs National | |
| 1. | 06831 | 6.1% | 7.4%(-1.28)#147 | 7.6%(-1.54)#10,930 |
| 2. | 06830 | 5.6% | 7.4%(-1.74)#169 | 7.6%(-2.00)#12,095 |
1
Common Questions
What are the Top Zip Codes with the Highest Percentage of Population with a Degree in Engineering in Greenwich, CT?
Top Zip Codes with the Highest Percentage of Population with a Degree in Engineering in Greenwich, CT are:
What zip code has the Highest Percentage of Population with a Degree in Engineering in Greenwich, CT?
06831 has the Highest Percentage of Population with a Degree in Engineering in Greenwich, CT with 6.1%.
What is the Percentage of Population with a Degree in Engineering in Greenwich, CT?
Percentage of Population with a Degree in Engineering in Greenwich is 5.4%.
What is the Percentage of Population with a Degree in Engineering in Connecticut?
Percentage of Population with a Degree in Engineering in Connecticut is 7.4%.
What is the Percentage of Population with a Degree in Engineering in the United States?
Percentage of Population with a Degree in Engineering in the United States is 7.6%.