Zip Codes with the Highest Percentage of Population with a Degree in Computers and Mathematics in Connecticut
RELATED REPORTS & OPTIONS
Computers and Mathematics
Connecticut
Compare Zip Codes
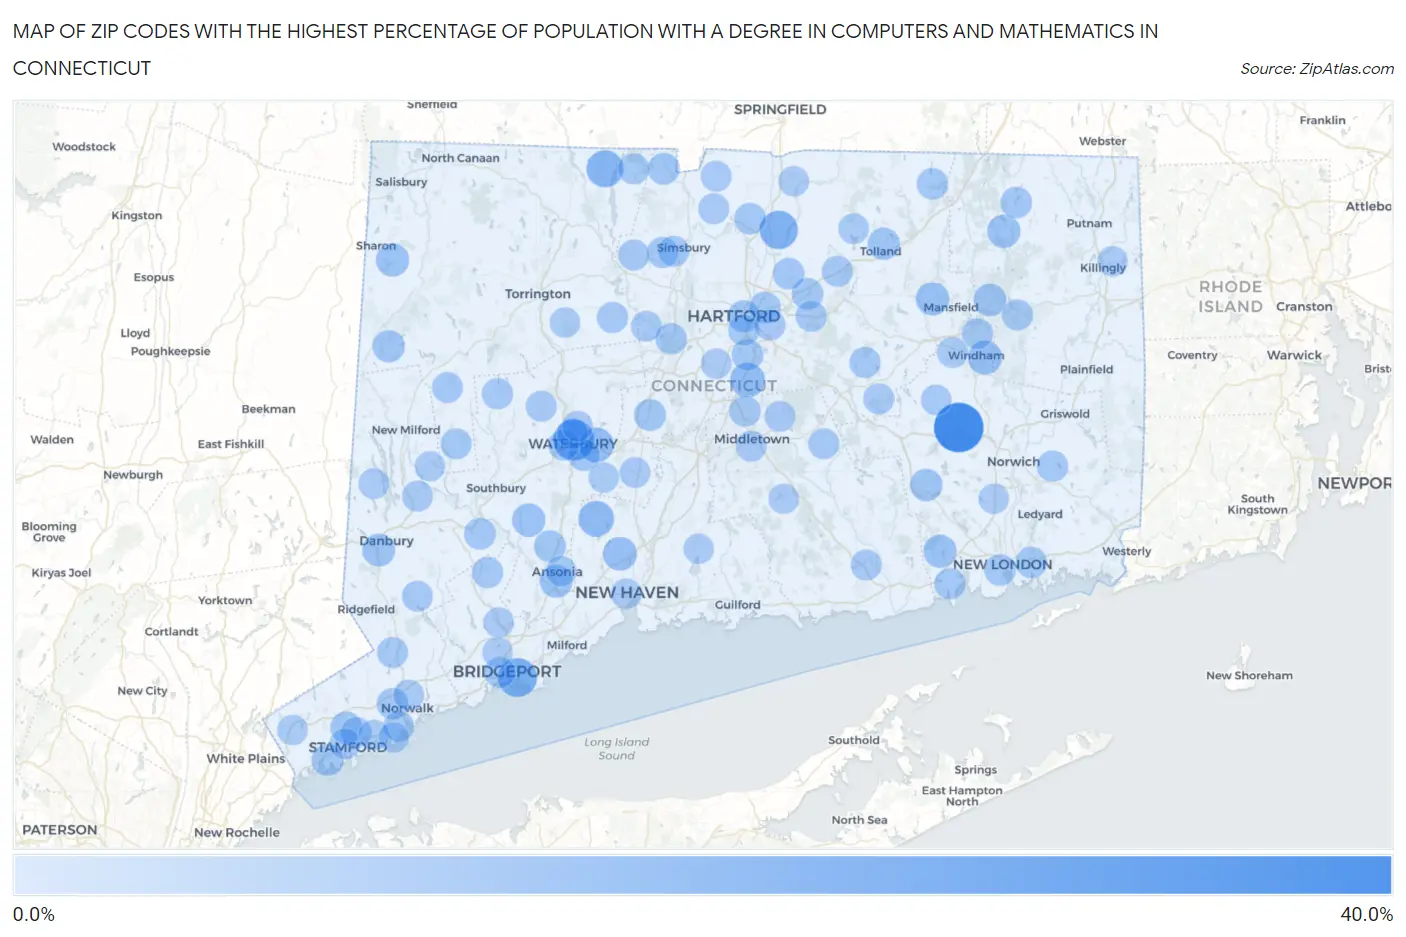
Map of Zip Codes with the Highest Percentage of Population with a Degree in Computers and Mathematics in Connecticut
0.0%
40.0%
Zip Codes with the Highest Percentage of Population with a Degree in Computers and Mathematics in Connecticut
| Zip Code | % Graduates | vs State | vs National | |
| 1. | 06336 | 35.7% | 4.4%(+31.3)#1 | 4.9%(+30.8)#165 |
| 2. | 06702 | 21.7% | 4.4%(+17.3)#2 | 4.9%(+16.8)#401 |
| 3. | 06607 | 18.4% | 4.4%(+14.0)#3 | 4.9%(+13.5)#540 |
| 4. | 06088 | 17.2% | 4.4%(+12.7)#4 | 4.9%(+12.3)#621 |
| 5. | 06091 | 15.1% | 4.4%(+10.7)#5 | 4.9%(+10.2)#779 |
| 6. | 06524 | 13.0% | 4.4%(+8.53)#6 | 4.9%(+8.06)#1,063 |
| 7. | 06705 | 11.7% | 4.4%(+7.24)#7 | 4.9%(+6.78)#1,287 |
| 8. | 06067 | 11.4% | 4.4%(+7.01)#8 | 4.9%(+6.55)#1,339 |
| 9. | 06280 | 10.3% | 4.4%(+5.88)#9 | 4.9%(+5.42)#1,648 |
| 10. | 06514 | 10.0% | 4.4%(+5.62)#10 | 4.9%(+5.15)#1,733 |
| 11. | 06268 | 9.4% | 4.4%(+4.99)#11 | 4.9%(+4.53)#2,004 |
| 12. | 06478 | 9.2% | 4.4%(+4.77)#12 | 4.9%(+4.31)#2,109 |
| 13. | 06242 | 9.2% | 4.4%(+4.77)#13 | 4.9%(+4.30)#2,112 |
| 14. | 06069 | 9.2% | 4.4%(+4.76)#14 | 4.9%(+4.30)#2,122 |
| 15. | 06333 | 9.0% | 4.4%(+4.61)#15 | 4.9%(+4.15)#2,228 |
| 16. | 06418 | 8.7% | 4.4%(+4.30)#16 | 4.9%(+3.83)#2,409 |
| 17. | 06810 | 8.4% | 4.4%(+3.96)#17 | 4.9%(+3.50)#2,601 |
| 18. | 06235 | 8.3% | 4.4%(+3.88)#18 | 4.9%(+3.42)#2,661 |
| 19. | 06420 | 7.9% | 4.4%(+3.47)#19 | 4.9%(+3.01)#2,978 |
| 20. | 06785 | 7.7% | 4.4%(+3.28)#20 | 4.9%(+2.82)#3,126 |
| 21. | 06084 | 7.7% | 4.4%(+3.22)#21 | 4.9%(+2.76)#3,197 |
| 22. | 06706 | 7.0% | 4.4%(+2.61)#22 | 4.9%(+2.15)#3,774 |
| 23. | 06060 | 7.0% | 4.4%(+2.58)#23 | 4.9%(+2.11)#3,816 |
| 24. | 06483 | 7.0% | 4.4%(+2.56)#24 | 4.9%(+2.10)#3,844 |
| 25. | 06103 | 7.0% | 4.4%(+2.54)#25 | 4.9%(+2.08)#3,869 |
| 26. | 06905 | 7.0% | 4.4%(+2.53)#26 | 4.9%(+2.07)#3,877 |
| 27. | 06878 | 6.9% | 4.4%(+2.49)#27 | 4.9%(+2.03)#3,922 |
| 28. | 06489 | 6.9% | 4.4%(+2.43)#28 | 4.9%(+1.97)#3,980 |
| 29. | 06482 | 6.7% | 4.4%(+2.30)#29 | 4.9%(+1.84)#4,159 |
| 30. | 06042 | 6.7% | 4.4%(+2.27)#30 | 4.9%(+1.80)#4,201 |
| 31. | 06096 | 6.6% | 4.4%(+2.21)#31 | 4.9%(+1.74)#4,285 |
| 32. | 06074 | 6.6% | 4.4%(+2.17)#32 | 4.9%(+1.71)#4,331 |
| 33. | 06108 | 6.6% | 4.4%(+2.13)#33 | 4.9%(+1.67)#4,375 |
| 34. | 06282 | 6.5% | 4.4%(+2.09)#34 | 4.9%(+1.63)#4,431 |
| 35. | 06320 | 6.5% | 4.4%(+2.08)#35 | 4.9%(+1.62)#4,450 |
| 36. | 06340 | 6.5% | 4.4%(+2.06)#36 | 4.9%(+1.60)#4,476 |
| 37. | 06076 | 6.4% | 4.4%(+1.96)#37 | 4.9%(+1.50)#4,622 |
| 38. | 06850 | 6.3% | 4.4%(+1.85)#38 | 4.9%(+1.39)#4,798 |
| 39. | 06032 | 6.2% | 4.4%(+1.79)#39 | 4.9%(+1.33)#4,895 |
| 40. | 06109 | 6.2% | 4.4%(+1.75)#40 | 4.9%(+1.29)#4,970 |
| 41. | 06365 | 6.1% | 4.4%(+1.67)#41 | 4.9%(+1.21)#5,112 |
| 42. | 06468 | 6.1% | 4.4%(+1.67)#42 | 4.9%(+1.21)#5,116 |
| 43. | 06751 | 6.0% | 4.4%(+1.57)#43 | 4.9%(+1.10)#5,305 |
| 44. | 06357 | 6.0% | 4.4%(+1.56)#44 | 4.9%(+1.10)#5,312 |
| 45. | 06248 | 6.0% | 4.4%(+1.53)#45 | 4.9%(+1.07)#5,363 |
| 46. | 06092 | 6.0% | 4.4%(+1.52)#46 | 4.9%(+1.06)#5,377 |
| 47. | 06114 | 5.9% | 4.4%(+1.51)#47 | 4.9%(+1.05)#5,398 |
| 48. | 06604 | 5.9% | 4.4%(+1.49)#48 | 4.9%(+1.03)#5,421 |
| 49. | 06708 | 5.9% | 4.4%(+1.46)#49 | 4.9%(+1.00)#5,493 |
| 50. | 06013 | 5.9% | 4.4%(+1.46)#50 | 4.9%(+1.00)#5,494 |
| 51. | 06416 | 5.9% | 4.4%(+1.42)#51 | 4.9%(+0.963)#5,567 |
| 52. | 06027 | 5.9% | 4.4%(+1.42)#52 | 4.9%(+0.958)#5,578 |
| 53. | 06040 | 5.8% | 4.4%(+1.33)#53 | 4.9%(+0.864)#5,761 |
| 54. | 06247 | 5.7% | 4.4%(+1.31)#54 | 4.9%(+0.844)#5,801 |
| 55. | 06066 | 5.7% | 4.4%(+1.28)#55 | 4.9%(+0.819)#5,852 |
| 56. | 06424 | 5.7% | 4.4%(+1.28)#56 | 4.9%(+0.814)#5,863 |
| 57. | 06897 | 5.7% | 4.4%(+1.24)#57 | 4.9%(+0.774)#5,944 |
| 58. | 06783 | 5.7% | 4.4%(+1.23)#58 | 4.9%(+0.765)#5,958 |
| 59. | 06256 | 5.6% | 4.4%(+1.20)#59 | 4.9%(+0.743)#5,998 |
| 60. | 06019 | 5.6% | 4.4%(+1.15)#60 | 4.9%(+0.688)#6,112 |
| 61. | 06070 | 5.6% | 4.4%(+1.15)#61 | 4.9%(+0.685)#6,116 |
| 62. | 06794 | 5.6% | 4.4%(+1.12)#62 | 4.9%(+0.662)#6,184 |
| 63. | 06426 | 5.5% | 4.4%(+1.11)#63 | 4.9%(+0.646)#6,221 |
| 64. | 06026 | 5.5% | 4.4%(+1.10)#64 | 4.9%(+0.637)#6,241 |
| 65. | 06795 | 5.5% | 4.4%(+1.09)#65 | 4.9%(+0.630)#6,252 |
| 66. | 06906 | 5.5% | 4.4%(+1.09)#66 | 4.9%(+0.628)#6,258 |
| 67. | 06226 | 5.5% | 4.4%(+1.08)#67 | 4.9%(+0.617)#6,281 |
| 68. | 06093 | 5.5% | 4.4%(+1.08)#68 | 4.9%(+0.614)#6,287 |
| 69. | 06896 | 5.5% | 4.4%(+1.05)#69 | 4.9%(+0.591)#6,331 |
| 70. | 06118 | 5.5% | 4.4%(+1.05)#70 | 4.9%(+0.590)#6,335 |
| 71. | 06804 | 5.5% | 4.4%(+1.02)#71 | 4.9%(+0.558)#6,395 |
| 72. | 06457 | 5.4% | 4.4%(+1.00)#72 | 4.9%(+0.541)#6,432 |
| 73. | 06902 | 5.4% | 4.4%(+0.980)#73 | 4.9%(+0.519)#6,478 |
| 74. | 06480 | 5.4% | 4.4%(+0.948)#74 | 4.9%(+0.487)#6,553 |
| 75. | 06231 | 5.4% | 4.4%(+0.944)#75 | 4.9%(+0.483)#6,559 |
| 76. | 06410 | 5.3% | 4.4%(+0.898)#76 | 4.9%(+0.437)#6,683 |
| 77. | 06710 | 5.3% | 4.4%(+0.850)#77 | 4.9%(+0.389)#6,801 |
| 78. | 06854 | 5.2% | 4.4%(+0.718)#78 | 4.9%(+0.257)#7,085 |
| 79. | 06704 | 5.1% | 4.4%(+0.670)#79 | 4.9%(+0.209)#7,200 |
| 80. | 06085 | 5.1% | 4.4%(+0.666)#80 | 4.9%(+0.205)#7,214 |
| 81. | 06851 | 5.1% | 4.4%(+0.632)#81 | 4.9%(+0.171)#7,292 |
| 82. | 06249 | 5.1% | 4.4%(+0.628)#82 | 4.9%(+0.166)#7,306 |
| 83. | 06401 | 5.0% | 4.4%(+0.588)#83 | 4.9%(+0.127)#7,401 |
| 84. | 06029 | 5.0% | 4.4%(+0.586)#84 | 4.9%(+0.124)#7,407 |
| 85. | 06812 | 4.9% | 4.4%(+0.511)#85 | 4.9%(+0.050)#7,582 |
| 86. | 06712 | 4.9% | 4.4%(+0.498)#86 | 4.9%(+0.037)#7,615 |
| 87. | 06820 | 4.9% | 4.4%(+0.471)#87 | 4.9%(+0.010)#7,685 |
| 88. | 06111 | 4.9% | 4.4%(+0.469)#88 | 4.9%(+0.008)#7,696 |
| 89. | 06441 | 4.9% | 4.4%(+0.455)#89 | 4.9%(-0.007)#7,725 |
| 90. | 06853 | 4.9% | 4.4%(+0.425)#90 | 4.9%(-0.036)#7,816 |
| 91. | 06606 | 4.8% | 4.4%(+0.398)#91 | 4.9%(-0.063)#7,897 |
| 92. | 06510 | 4.8% | 4.4%(+0.398)#92 | 4.9%(-0.063)#7,901 |
| 93. | 06831 | 4.8% | 4.4%(+0.395)#93 | 4.9%(-0.066)#7,906 |
| 94. | 06082 | 4.8% | 4.4%(+0.359)#94 | 4.9%(-0.102)#8,008 |
| 95. | 06472 | 4.7% | 4.4%(+0.297)#95 | 4.9%(-0.165)#8,188 |
| 96. | 06791 | 4.7% | 4.4%(+0.293)#96 | 4.9%(-0.168)#8,197 |
| 97. | 06382 | 4.7% | 4.4%(+0.283)#97 | 4.9%(-0.179)#8,221 |
| 98. | 06611 | 4.7% | 4.4%(+0.283)#98 | 4.9%(-0.179)#8,222 |
| 99. | 06241 | 4.7% | 4.4%(+0.248)#99 | 4.9%(-0.214)#8,335 |
| 100. | 06752 | 4.6% | 4.4%(+0.183)#100 | 4.9%(-0.279)#8,523 |
Common Questions
What are the Top 10 Zip Codes with the Highest Percentage of Population with a Degree in Computers and Mathematics in Connecticut?
Top 10 Zip Codes with the Highest Percentage of Population with a Degree in Computers and Mathematics in Connecticut are:
What zip code has the Highest Percentage of Population with a Degree in Computers and Mathematics in Connecticut?
06336 has the Highest Percentage of Population with a Degree in Computers and Mathematics in Connecticut with 35.7%.
What is the Percentage of Population with a Degree in Computers and Mathematics in the State of Connecticut?
Percentage of Population with a Degree in Computers and Mathematics in Connecticut is 4.4%.
What is the Percentage of Population with a Degree in Computers and Mathematics in the United States?
Percentage of Population with a Degree in Computers and Mathematics in the United States is 4.9%.