Swoyersville borough, PA Map & Demographics
Swoyersville borough Overview
$37,772
PER CAPITA INCOME
$76,000
AVG FAMILY INCOME
$64,397
AVG HOUSEHOLD INCOME
27.0%
WAGE / INCOME GAP [ % ]
73.0¢/ $1
WAGE / INCOME GAP [ $ ]
0.35
INEQUALITY / GINI INDEX
5,021
TOTAL POPULATION
2,557
MALE POPULATION
2,464
FEMALE POPULATION
103.77
MALES / 100 FEMALES
96.36
FEMALES / 100 MALES
53.1
MEDIAN AGE
2.6
AVG FAMILY SIZE
2.0
AVG HOUSEHOLD SIZE
2,722
LABOR FORCE [ PEOPLE ]
60.4%
PERCENT IN LABOR FORCE
3.6%
UNEMPLOYMENT RATE
Income in Swoyersville borough
Income Overview in Swoyersville borough
Per Capita Income in Swoyersville borough is $37,772, while median incomes of families and households are $76,000 and $64,397 respectively.
| Characteristic | Number | Measure |
| Per Capita Income | 5,021 | $37,772 |
| Median Family Income | 1,364 | $76,000 |
| Mean Family Income | 1,364 | $91,294 |
| Median Household Income | 2,508 | $64,397 |
| Mean Household Income | 2,508 | $74,334 |
| Income Deficit | 1,364 | $0 |
| Wage / Income Gap (%) | 5,021 | 27.04% |
| Wage / Income Gap ($) | 5,021 | 72.96¢ per $1 |
| Gini / Inequality Index | 5,021 | 0.35 |
Earnings by Sex in Swoyersville borough
Average Earnings in Swoyersville borough are $42,650, $50,017 for men and $36,490 for women, a difference of 27.0%.

| Sex | Number | Average Earnings |
| Male | 1,313 (46.7%) | $50,017 |
| Female | 1,497 (53.3%) | $36,490 |
| Total | 2,810 (100.0%) | $42,650 |
Earnings by Sex by Income Bracket in Swoyersville borough
The most common earnings brackets in Swoyersville borough are $55,000 to $64,999 for men (212 | 16.2%) and $65,000 to $74,999 for women (199 | 13.3%).
| Income | Male | Female |
| $2,499 or less | 0 (0.0%) | 49 (3.3%) |
| $2,500 to $4,999 | 59 (4.5%) | 86 (5.7%) |
| $5,000 to $7,499 | 21 (1.6%) | 57 (3.8%) |
| $7,500 to $9,999 | 0 (0.0%) | 11 (0.7%) |
| $10,000 to $12,499 | 0 (0.0%) | 117 (7.8%) |
| $12,500 to $14,999 | 26 (2.0%) | 87 (5.8%) |
| $15,000 to $17,499 | 0 (0.0%) | 5 (0.3%) |
| $17,500 to $19,999 | 16 (1.2%) | 0 (0.0%) |
| $20,000 to $22,499 | 0 (0.0%) | 90 (6.0%) |
| $22,500 to $24,999 | 73 (5.6%) | 57 (3.8%) |
| $25,000 to $29,999 | 123 (9.4%) | 117 (7.8%) |
| $30,000 to $34,999 | 85 (6.5%) | 26 (1.7%) |
| $35,000 to $39,999 | 66 (5.0%) | 149 (10.0%) |
| $40,000 to $44,999 | 61 (4.6%) | 71 (4.7%) |
| $45,000 to $49,999 | 126 (9.6%) | 99 (6.6%) |
| $50,000 to $54,999 | 92 (7.0%) | 14 (0.9%) |
| $55,000 to $64,999 | 212 (16.2%) | 69 (4.6%) |
| $65,000 to $74,999 | 102 (7.8%) | 199 (13.3%) |
| $75,000 to $99,999 | 171 (13.0%) | 168 (11.2%) |
| $100,000+ | 80 (6.1%) | 26 (1.7%) |
| Total | 1,313 (100.0%) | 1,497 (100.0%) |
Earnings by Sex by Educational Attainment in Swoyersville borough
Average earnings in Swoyersville borough are $51,216 for men and $39,613 for women, a difference of 22.7%. Men with an educational attainment of bachelor's degree enjoy the highest average annual earnings of $56,563, while those with high school diploma education earn the least with $46,413. Women with an educational attainment of graduate degree earn the most with the average annual earnings of $70,466, while those with high school diploma education have the smallest earnings of $21,700.
| Educational Attainment | Male Income | Female Income |
| Less than High School | $51,548 | $0 |
| High School Diploma | $46,413 | $21,700 |
| College or Associate's Degree | $52,137 | $35,795 |
| Bachelor's Degree | $56,563 | $56,685 |
| Graduate Degree | - | - |
| Total | $51,216 | $39,613 |
Family Income in Swoyersville borough
Family Income Brackets in Swoyersville borough
According to the Swoyersville borough family income data, there are 370 families falling into the $50,000 to $74,999 income range, which is the most common income bracket and makes up 27.1% of all families.
| Income Bracket | # Families | % Families |
| Less than $10,000 | 0 | 0.0% |
| $10,000 to $14,999 | 44 | 3.2% |
| $15,000 to $24,999 | 44 | 3.2% |
| $25,000 to $34,999 | 46 | 3.4% |
| $35,000 to $49,999 | 157 | 11.5% |
| $50,000 to $74,999 | 370 | 27.1% |
| $75,000 to $99,999 | 270 | 19.8% |
| $100,000 to $149,999 | 233 | 17.1% |
| $150,000 to $199,999 | 110 | 8.1% |
| $200,000+ | 89 | 6.5% |
Family Income by Famaliy Size in Swoyersville borough
2-person families (927 | 68.0%) account for the highest median family income in Swoyersville borough with $79,438 per family, while 2-person families (927 | 68.0%) have the highest median income of $39,719 per family member.
| Income Bracket | # Families | Median Income |
| 2-Person Families | 927 (68.0%) | $79,438 |
| 3-Person Families | 243 (17.8%) | $73,266 |
| 4-Person Families | 121 (8.9%) | $0 |
| 5-Person Families | 55 (4.0%) | $75,197 |
| 6-Person Families | 0 (0.0%) | $0 |
| 7+ Person Families | 18 (1.3%) | $0 |
| Total | 1,364 (100.0%) | $76,000 |
Family Income by Number of Earners in Swoyersville borough
The median family income in Swoyersville borough is $76,000, with families comprising 3+ earners (136) having the highest median family income of $162,917, while families with 1 earner (405) have the lowest median family income of $56,754, accounting for 10.0% and 29.7% of families, respectively.
| Number of Earners | # Families | Median Income |
| No Earners | 275 (20.2%) | $63,242 |
| 1 Earner | 405 (29.7%) | $56,754 |
| 2 Earners | 548 (40.2%) | $100,625 |
| 3+ Earners | 136 (10.0%) | $162,917 |
| Total | 1,364 (100.0%) | $76,000 |
Household Income in Swoyersville borough
Household Income Brackets in Swoyersville borough
With 883 households falling in the category, the $50,000 to $74,999 income range is the most frequent in Swoyersville borough, accounting for 35.2% of all households. In contrast, only 55 households (2.2%) fall into the less than $10,000 income bracket, making it the least populous group.
| Income Bracket | # Households | % Households |
| Less than $10,000 | 55 | 2.2% |
| $10,000 to $14,999 | 103 | 4.1% |
| $15,000 to $24,999 | 158 | 6.3% |
| $25,000 to $34,999 | 191 | 7.6% |
| $35,000 to $49,999 | 246 | 9.8% |
| $50,000 to $74,999 | 883 | 35.2% |
| $75,000 to $99,999 | 394 | 15.7% |
| $100,000 to $149,999 | 268 | 10.7% |
| $150,000 to $199,999 | 123 | 4.9% |
| $200,000+ | 88 | 3.5% |
Household Income by Householder Age in Swoyersville borough
The median household income in Swoyersville borough is $64,397, with the highest median household income of $71,680 found in the 25 to 44 years age bracket for the primary householder. A total of 623 households (24.8%) fall into this category.
| Income Bracket | # Households | Median Income |
| 15 to 24 Years | 0 (0.0%) | $0 |
| 25 to 44 Years | 623 (24.8%) | $71,680 |
| 45 to 64 Years | 876 (34.9%) | $69,717 |
| 65+ Years | 1,009 (40.2%) | $57,639 |
| Total | 2,508 (100.0%) | $64,397 |
Poverty in Swoyersville borough
Income Below Poverty by Sex and Age in Swoyersville borough
With 7.5% poverty level for males and 7.2% for females among the residents of Swoyersville borough, 16 and 17 year old males and 12 to 14 year old females are the most vulnerable to poverty, with 13 males (54.2%) and 11 females (28.2%) in their respective age groups living below the poverty level.
| Age Bracket | Male | Female |
| Under 5 Years | 55 (45.1%) | 0 (0.0%) |
| 5 Years | 0 (0.0%) | 0 (0.0%) |
| 6 to 11 Years | 12 (12.9%) | 0 (0.0%) |
| 12 to 14 Years | 24 (32.4%) | 11 (28.2%) |
| 15 Years | 0 (0.0%) | 0 (0.0%) |
| 16 and 17 Years | 13 (54.2%) | 0 (0.0%) |
| 18 to 24 Years | 0 (0.0%) | 45 (20.9%) |
| 25 to 34 Years | 21 (8.1%) | 16 (4.9%) |
| 35 to 44 Years | 13 (4.8%) | 57 (18.0%) |
| 45 to 54 Years | 32 (10.9%) | 11 (3.9%) |
| 55 to 64 Years | 0 (0.0%) | 19 (4.6%) |
| 65 to 74 Years | 1 (0.2%) | 18 (3.9%) |
| 75 Years and over | 21 (5.8%) | 1 (0.4%) |
| Total | 192 (7.5%) | 178 (7.2%) |
Income Above Poverty by Sex and Age in Swoyersville borough
According to the poverty statistics in Swoyersville borough, males aged 15 years and females aged under 5 years are the age groups that are most secure financially, with 100.0% of males and 100.0% of females in these age groups living above the poverty line.
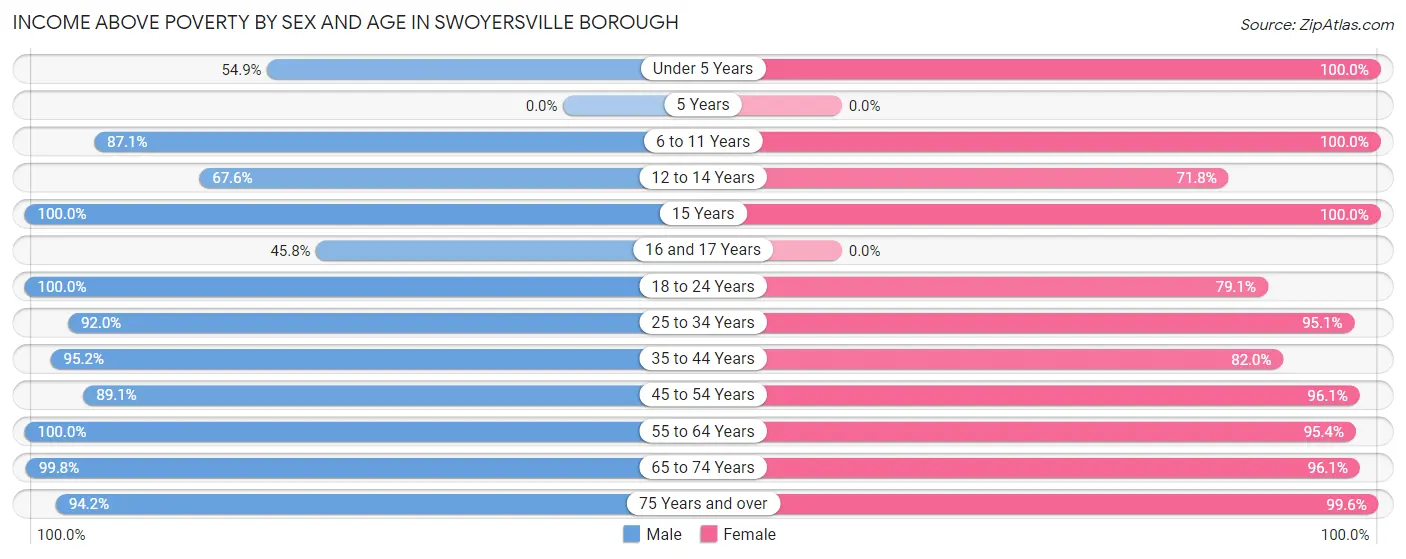
| Age Bracket | Male | Female |
| Under 5 Years | 67 (54.9%) | 55 (100.0%) |
| 5 Years | 0 (0.0%) | 0 (0.0%) |
| 6 to 11 Years | 81 (87.1%) | 42 (100.0%) |
| 12 to 14 Years | 50 (67.6%) | 28 (71.8%) |
| 15 Years | 53 (100.0%) | 36 (100.0%) |
| 16 and 17 Years | 11 (45.8%) | 0 (0.0%) |
| 18 to 24 Years | 175 (100.0%) | 170 (79.1%) |
| 25 to 34 Years | 240 (91.9%) | 311 (95.1%) |
| 35 to 44 Years | 256 (95.2%) | 259 (82.0%) |
| 45 to 54 Years | 261 (89.1%) | 272 (96.1%) |
| 55 to 64 Years | 405 (100.0%) | 393 (95.4%) |
| 65 to 74 Years | 424 (99.8%) | 448 (96.1%) |
| 75 Years and over | 342 (94.2%) | 272 (99.6%) |
| Total | 2,365 (92.5%) | 2,286 (92.8%) |
Income Below Poverty Among Married-Couple Families in Swoyersville borough
The poverty statistics for married-couple families in Swoyersville borough show that 2.2% or 24 of the total 1,094 families live below the poverty line. Families with 5 or more children have the highest poverty rate of 100.0%, comprising of 13 families. On the other hand, families with 1 or 2 children have the lowest poverty rate of 0.0%, which includes 0 families.
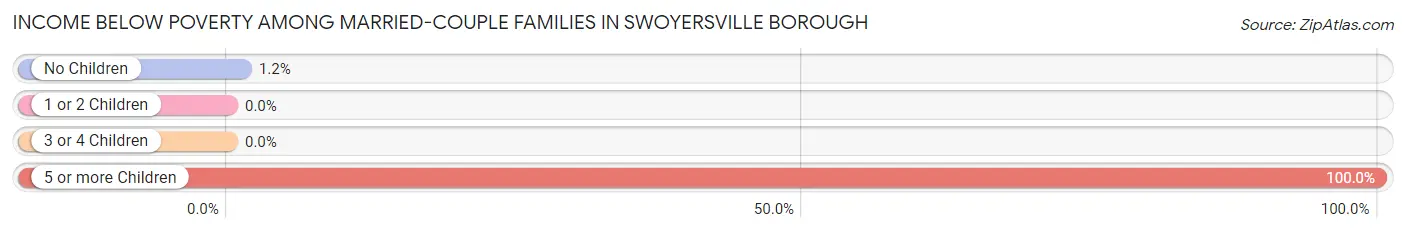
| Children | Above Poverty | Below Poverty |
| No Children | 896 (98.8%) | 11 (1.2%) |
| 1 or 2 Children | 155 (100.0%) | 0 (0.0%) |
| 3 or 4 Children | 19 (100.0%) | 0 (0.0%) |
| 5 or more Children | 0 (0.0%) | 13 (100.0%) |
| Total | 1,070 (97.8%) | 24 (2.2%) |
Income Below Poverty Among Single-Parent Households in Swoyersville borough
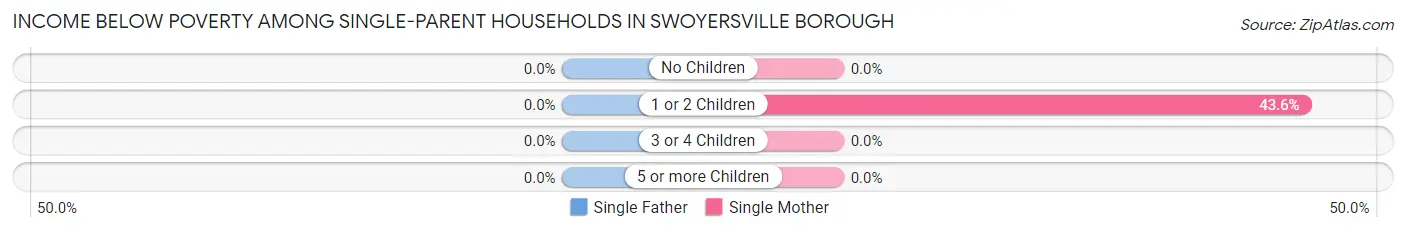
| Children | Single Father | Single Mother |
| No Children | 0 (0.0%) | 0 (0.0%) |
| 1 or 2 Children | 0 (0.0%) | 44 (43.6%) |
| 3 or 4 Children | 0 (0.0%) | 0 (0.0%) |
| 5 or more Children | 0 (0.0%) | 0 (0.0%) |
| Total | 0 (0.0%) | 44 (21.4%) |
Income Below Poverty Among Married-Couple vs Single-Parent Households in Swoyersville borough
The poverty data for Swoyersville borough shows that 24 of the married-couple family households (2.2%) and 44 of the single-parent households (16.3%) are living below the poverty level. Within the married-couple family households, those with 5 or more children have the highest poverty rate, with 13 households (100.0%) falling below the poverty line. Among the single-parent households, those with 1 or 2 children have the highest poverty rate, with 44 household (29.5%) living below poverty.
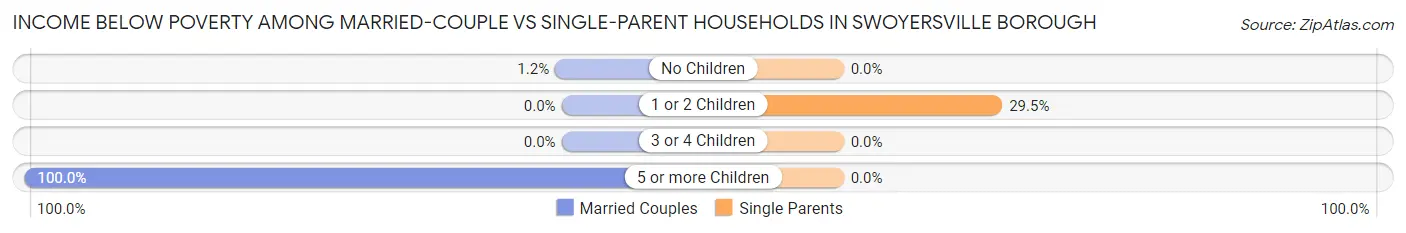
| Children | Married-Couple Families | Single-Parent Households |
| No Children | 11 (1.2%) | 0 (0.0%) |
| 1 or 2 Children | 0 (0.0%) | 44 (29.5%) |
| 3 or 4 Children | 0 (0.0%) | 0 (0.0%) |
| 5 or more Children | 13 (100.0%) | 0 (0.0%) |
| Total | 24 (2.2%) | 44 (16.3%) |
Race in Swoyersville borough
The most populous races in Swoyersville borough are White / Caucasian (4,658 | 92.8%), Two or more Races (359 | 7.1%), and Hispanic or Latino (313 | 6.2%).
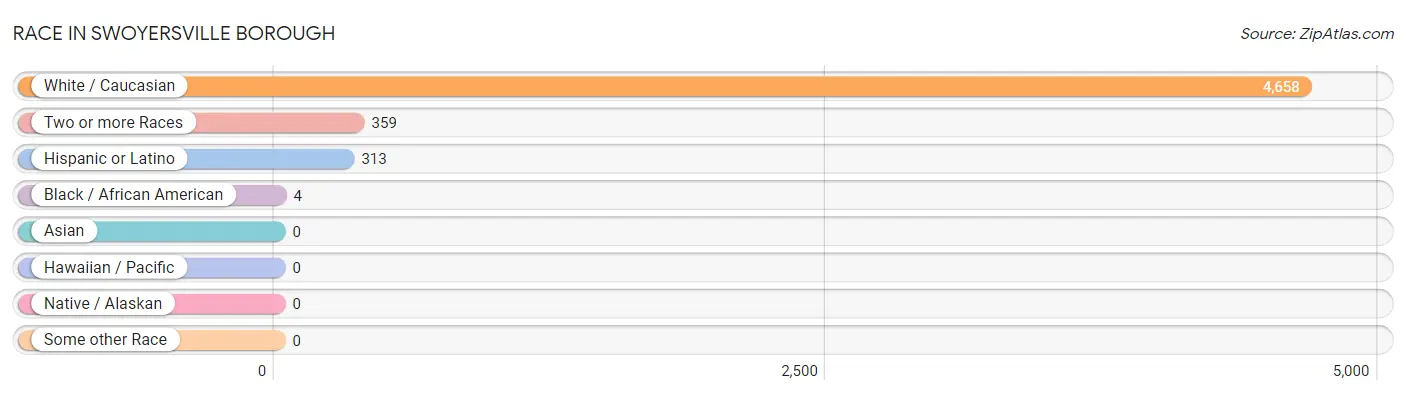
| Race | # Population | % Population |
| Asian | 0 | 0.0% |
| Black / African American | 4 | 0.1% |
| Hawaiian / Pacific | 0 | 0.0% |
| Hispanic or Latino | 313 | 6.2% |
| Native / Alaskan | 0 | 0.0% |
| White / Caucasian | 4,658 | 92.8% |
| Two or more Races | 359 | 7.1% |
| Some other Race | 0 | 0.0% |
| Total | 5,021 | 100.0% |
Ancestry in Swoyersville borough
The most populous ancestries reported in Swoyersville borough are Irish (1,123 | 22.4%), Polish (1,024 | 20.4%), Italian (830 | 16.5%), German (692 | 13.8%), and Slovak (454 | 9.0%), together accounting for 82.1% of all Swoyersville borough residents.
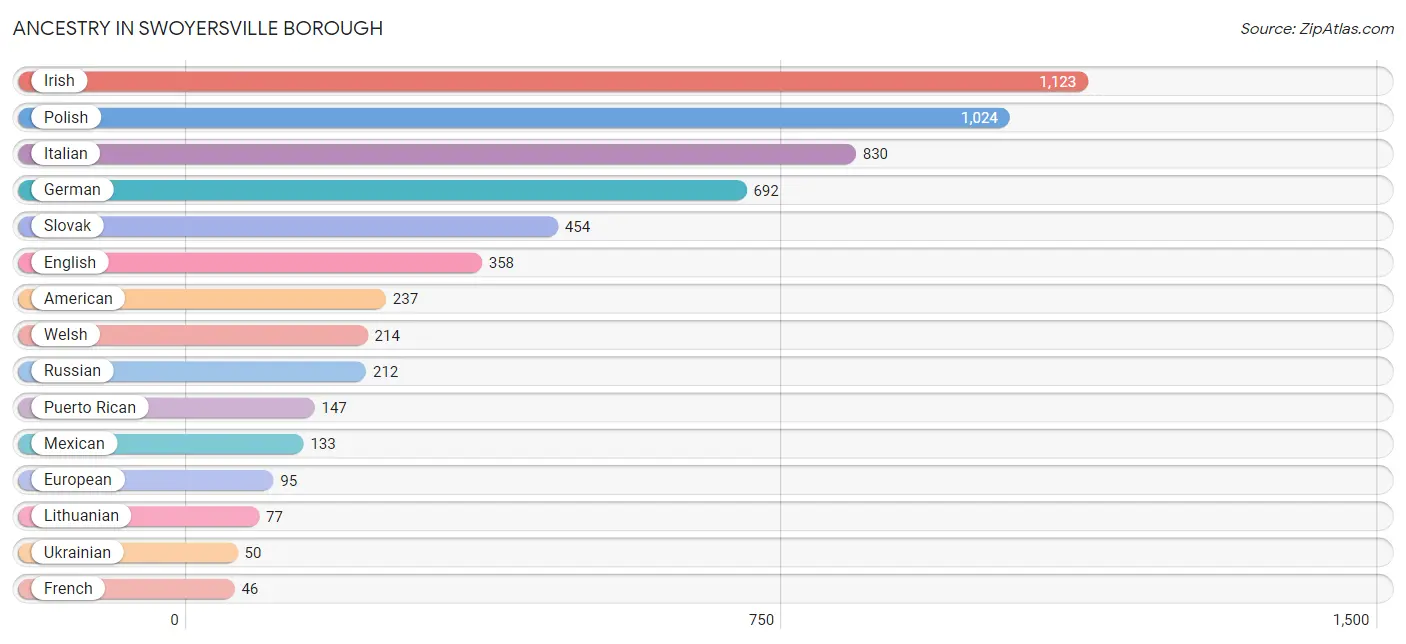
| Ancestry | # Population | % Population |
| American | 237 | 4.7% |
| Arab | 14 | 0.3% |
| British | 18 | 0.4% |
| Czechoslovakian | 10 | 0.2% |
| English | 358 | 7.1% |
| European | 95 | 1.9% |
| French | 46 | 0.9% |
| German | 692 | 13.8% |
| Greek | 26 | 0.5% |
| Hungarian | 5 | 0.1% |
| Irish | 1,123 | 22.4% |
| Italian | 830 | 16.5% |
| Lebanese | 14 | 0.3% |
| Lithuanian | 77 | 1.5% |
| Mexican | 133 | 2.6% |
| Pennsylvania German | 19 | 0.4% |
| Polish | 1,024 | 20.4% |
| Puerto Rican | 147 | 2.9% |
| Romanian | 15 | 0.3% |
| Russian | 212 | 4.2% |
| Scottish | 17 | 0.3% |
| Slavic | 30 | 0.6% |
| Slovak | 454 | 9.0% |
| Ukrainian | 50 | 1.0% |
| Welsh | 214 | 4.3% | View All 25 Rows |
Immigrants in Swoyersville borough
The most numerous immigrant groups reported in Swoyersville borough came from Europe (46 | 0.9%), England (17 | 0.3%), Northern Europe (17 | 0.3%), Germany (15 | 0.3%), and Western Europe (15 | 0.3%), together accounting for 2.2% of all Swoyersville borough residents.
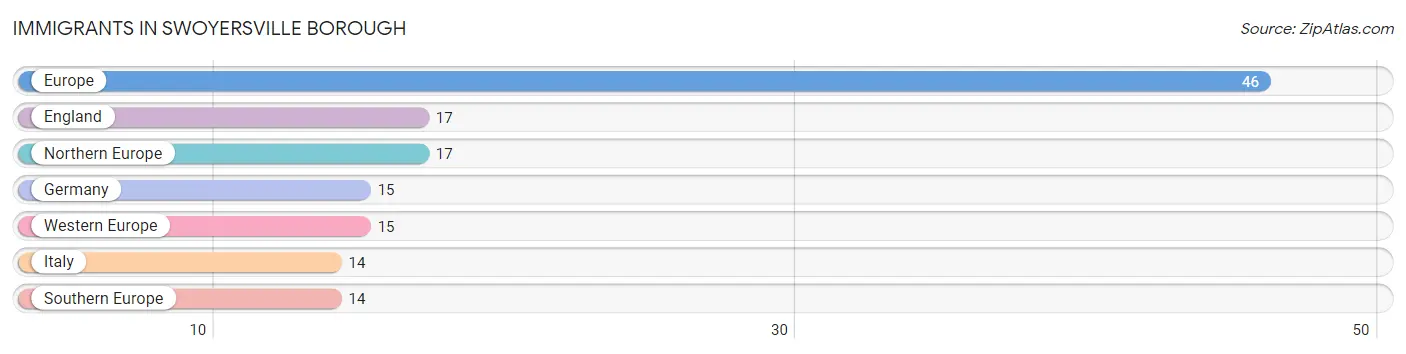
| Immigration Origin | # Population | % Population |
| England | 17 | 0.3% |
| Europe | 46 | 0.9% |
| Germany | 15 | 0.3% |
| Italy | 14 | 0.3% |
| Northern Europe | 17 | 0.3% |
| Southern Europe | 14 | 0.3% |
| Western Europe | 15 | 0.3% | View All 7 Rows |
Sex and Age in Swoyersville borough
Sex and Age in Swoyersville borough
The most populous age groups in Swoyersville borough are 65 to 69 Years (279 | 10.9%) for men and 65 to 69 Years (258 | 10.5%) for women.
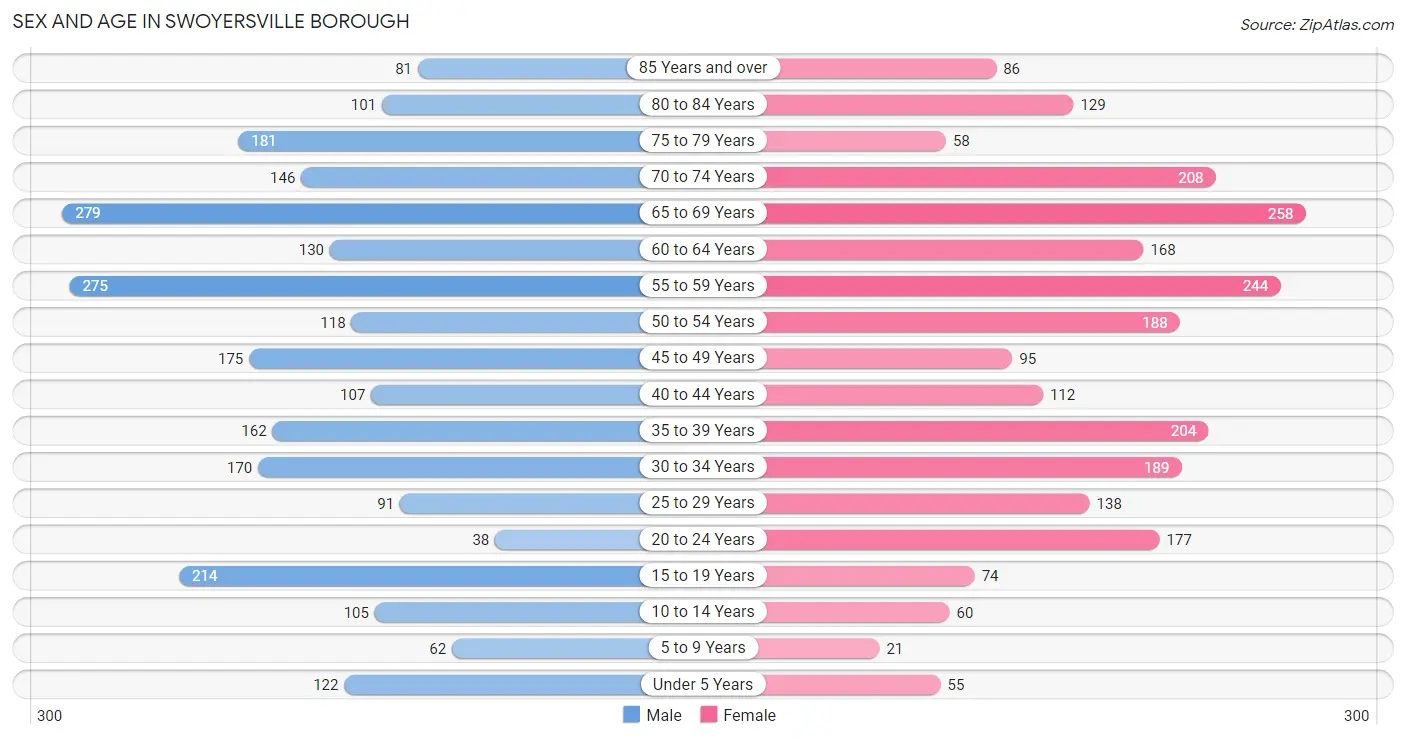
| Age Bracket | Male | Female |
| Under 5 Years | 122 (4.8%) | 55 (2.2%) |
| 5 to 9 Years | 62 (2.4%) | 21 (0.9%) |
| 10 to 14 Years | 105 (4.1%) | 60 (2.4%) |
| 15 to 19 Years | 214 (8.4%) | 74 (3.0%) |
| 20 to 24 Years | 38 (1.5%) | 177 (7.2%) |
| 25 to 29 Years | 91 (3.6%) | 138 (5.6%) |
| 30 to 34 Years | 170 (6.7%) | 189 (7.7%) |
| 35 to 39 Years | 162 (6.3%) | 204 (8.3%) |
| 40 to 44 Years | 107 (4.2%) | 112 (4.5%) |
| 45 to 49 Years | 175 (6.8%) | 95 (3.9%) |
| 50 to 54 Years | 118 (4.6%) | 188 (7.6%) |
| 55 to 59 Years | 275 (10.7%) | 244 (9.9%) |
| 60 to 64 Years | 130 (5.1%) | 168 (6.8%) |
| 65 to 69 Years | 279 (10.9%) | 258 (10.5%) |
| 70 to 74 Years | 146 (5.7%) | 208 (8.4%) |
| 75 to 79 Years | 181 (7.1%) | 58 (2.4%) |
| 80 to 84 Years | 101 (4.0%) | 129 (5.2%) |
| 85 Years and over | 81 (3.2%) | 86 (3.5%) |
| Total | 2,557 (100.0%) | 2,464 (100.0%) |
Families and Households in Swoyersville borough
Median Family Size in Swoyersville borough
The median family size in Swoyersville borough is 2.64 persons per family, with married-couple families (1,094 | 80.2%) accounting for the largest median family size of 2.74 persons per family. On the other hand, single male/father families (64 | 4.7%) represent the smallest median family size with 2.23 persons per family.
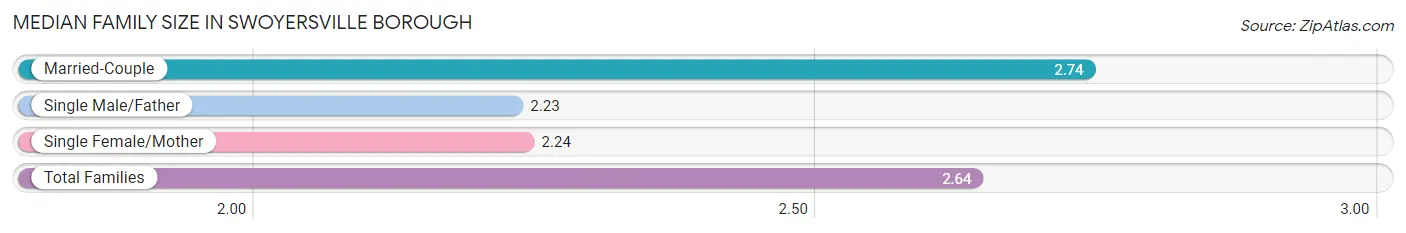
| Family Type | # Families | Family Size |
| Married-Couple | 1,094 (80.2%) | 2.74 |
| Single Male/Father | 64 (4.7%) | 2.23 |
| Single Female/Mother | 206 (15.1%) | 2.24 |
| Total Families | 1,364 (100.0%) | 2.64 |
Median Household Size in Swoyersville borough
The median household size in Swoyersville borough is 2.00 persons per household, with married-couple households (1,094 | 43.6%) accounting for the largest median household size of 2.74 persons per household. non-family households (1,144 | 45.6%) represent the smallest median household size with 1.19 persons per household.
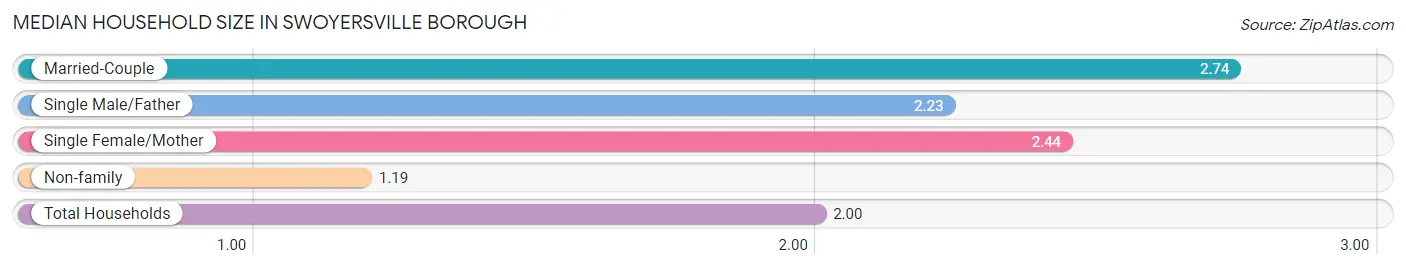
| Household Type | # Households | Household Size |
| Married-Couple | 1,094 (43.6%) | 2.74 |
| Single Male/Father | 64 (2.5%) | 2.23 |
| Single Female/Mother | 206 (8.2%) | 2.44 |
| Non-family | 1,144 (45.6%) | 1.19 |
| Total Households | 2,508 (100.0%) | 2.00 |
Household Size by Marriage Status in Swoyersville borough
Out of a total of 2,508 households in Swoyersville borough, 1,364 (54.4%) are family households, while 1,144 (45.6%) are nonfamily households. The most numerous type of family households are 2-person households, comprising 902, and the most common type of nonfamily households are 1-person households, comprising 976.
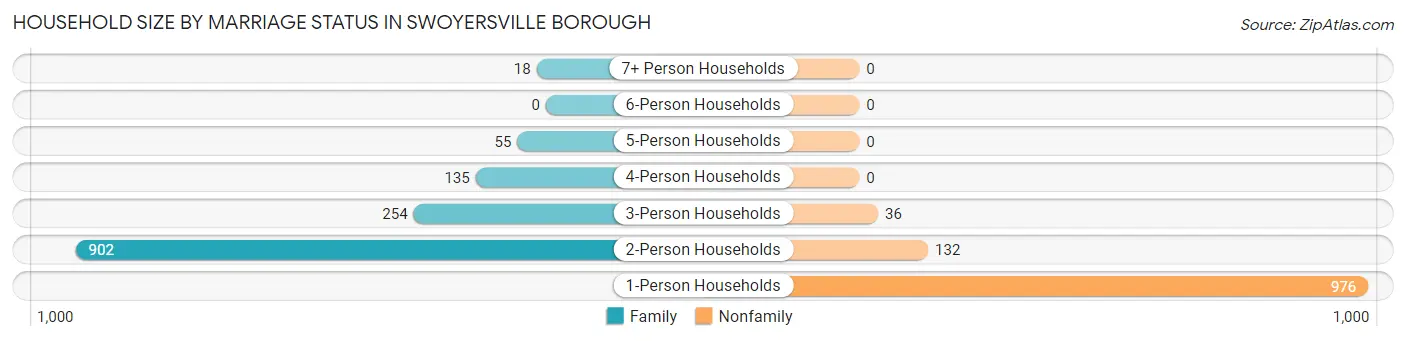
| Household Size | Family Households | Nonfamily Households |
| 1-Person Households | - | 976 (38.9%) |
| 2-Person Households | 902 (36.0%) | 132 (5.3%) |
| 3-Person Households | 254 (10.1%) | 36 (1.4%) |
| 4-Person Households | 135 (5.4%) | 0 (0.0%) |
| 5-Person Households | 55 (2.2%) | 0 (0.0%) |
| 6-Person Households | 0 (0.0%) | 0 (0.0%) |
| 7+ Person Households | 18 (0.7%) | 0 (0.0%) |
| Total | 1,364 (54.4%) | 1,144 (45.6%) |
Female Fertility in Swoyersville borough
Fertility by Age in Swoyersville borough
Average fertility rate in Swoyersville borough is 47.0 births per 1,000 women. Women in the age bracket of 20 to 34 years have the highest fertility rate with 93.0 births per 1,000 women. Women in the age bracket of 20 to 34 years acount for 100.0% of all women with births.
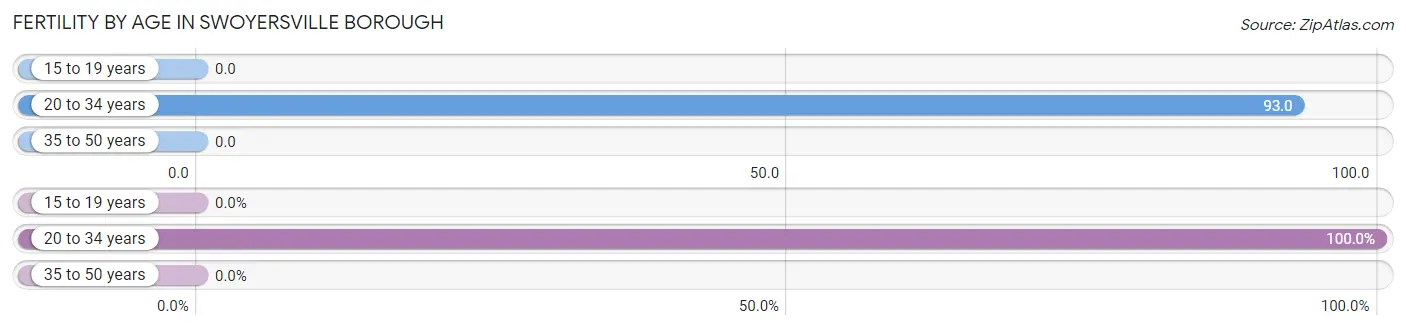
| Age Bracket | Women with Births | Births / 1,000 Women |
| 15 to 19 years | 0 (0.0%) | 0.0 |
| 20 to 34 years | 47 (100.0%) | 93.0 |
| 35 to 50 years | 0 (0.0%) | 0.0 |
| Total | 47 (100.0%) | 47.0 |
Fertility by Age by Marriage Status in Swoyersville borough
36.2% of women with births (47) in Swoyersville borough are married. The highest percentage of unmarried women with births falls into 20 to 34 years age bracket with 63.8% of them unmarried at the time of birth, while the lowest percentage of unmarried women with births belong to 20 to 34 years age bracket with 63.8% of them unmarried.
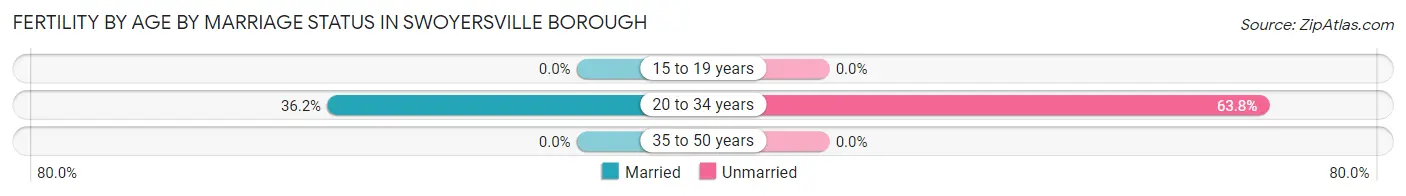
| Age Bracket | Married | Unmarried |
| 15 to 19 years | 0 (0.0%) | 0 (0.0%) |
| 20 to 34 years | 17 (36.2%) | 30 (63.8%) |
| 35 to 50 years | 0 (0.0%) | 0 (0.0%) |
| Total | 17 (36.2%) | 30 (63.8%) |
Fertility by Education in Swoyersville borough
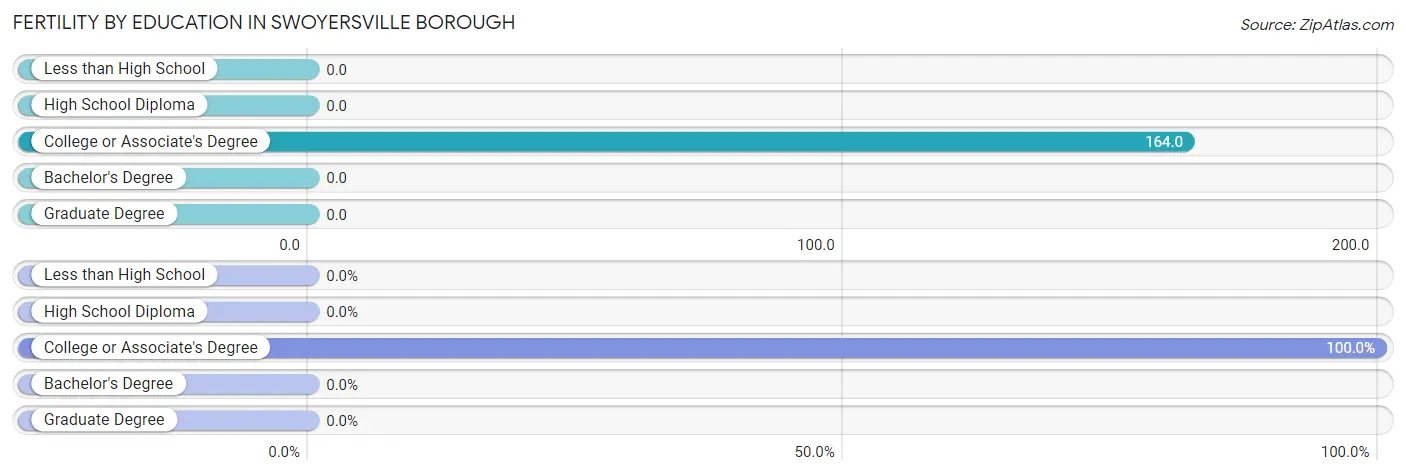
| Educational Attainment | Women with Births | Births / 1,000 Women |
| Less than High School | 0 (0.0%) | 0.0 |
| High School Diploma | 0 (0.0%) | 0.0 |
| College or Associate's Degree | 47 (100.0%) | 164.0 |
| Bachelor's Degree | 0 (0.0%) | 0.0 |
| Graduate Degree | 0 (0.0%) | 0.0 |
| Total | 47 (100.0%) | 47.0 |
Fertility by Education by Marriage Status in Swoyersville borough
63.8% of women with births in Swoyersville borough are unmarried. Women with the educational attainment of college or associate's degree are most likely to be married with 36.2% of them married at childbirth, while women with the educational attainment of college or associate's degree are least likely to be married with 63.8% of them unmarried at childbirth.
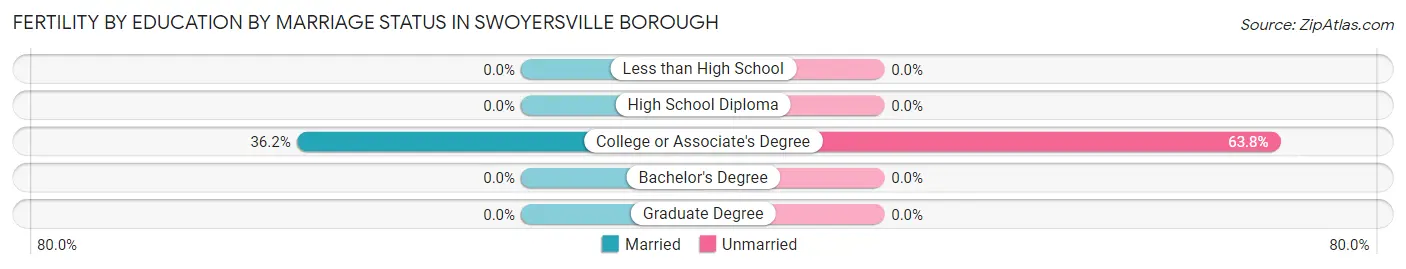
| Educational Attainment | Married | Unmarried |
| Less than High School | 0 (0.0%) | 0 (0.0%) |
| High School Diploma | 0 (0.0%) | 0 (0.0%) |
| College or Associate's Degree | 17 (36.2%) | 30 (63.8%) |
| Bachelor's Degree | 0 (0.0%) | 0 (0.0%) |
| Graduate Degree | 0 (0.0%) | 0 (0.0%) |
| Total | 17 (36.2%) | 30 (63.8%) |
Employment Characteristics in Swoyersville borough
Employment by Class of Employer in Swoyersville borough
Among the 2,597 employed individuals in Swoyersville borough, private company employees (1,775 | 68.3%), not-for-profit organizations (284 | 10.9%), and self-employed (not incorporated) (177 | 6.8%) make up the most common classes of employment.
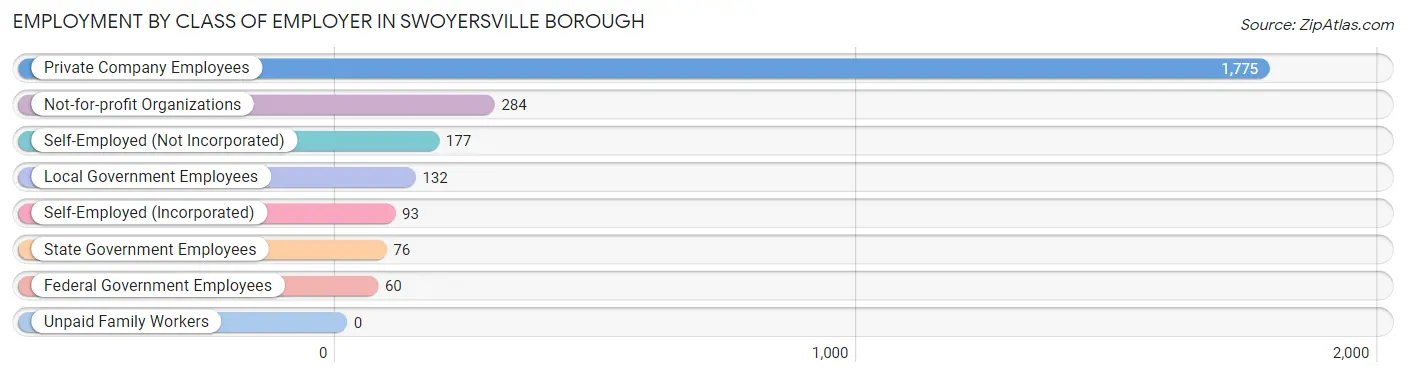
| Employer Class | # Employees | % Employees |
| Private Company Employees | 1,775 | 68.3% |
| Self-Employed (Incorporated) | 93 | 3.6% |
| Self-Employed (Not Incorporated) | 177 | 6.8% |
| Not-for-profit Organizations | 284 | 10.9% |
| Local Government Employees | 132 | 5.1% |
| State Government Employees | 76 | 2.9% |
| Federal Government Employees | 60 | 2.3% |
| Unpaid Family Workers | 0 | 0.0% |
| Total | 2,597 | 100.0% |
Employment Status by Age in Swoyersville borough
According to the labor force statistics for Swoyersville borough, out of the total population over 16 years of age (4,507), 60.4% or 2,722 individuals are in the labor force, with 3.6% or 98 of them unemployed. The age group with the highest labor force participation rate is 35 to 44 years, with 97.1% or 568 individuals in the labor force. Within the labor force, the 20 to 24 years age range has the highest percentage of unemployed individuals, with 6.6% or 12 of them being unemployed.
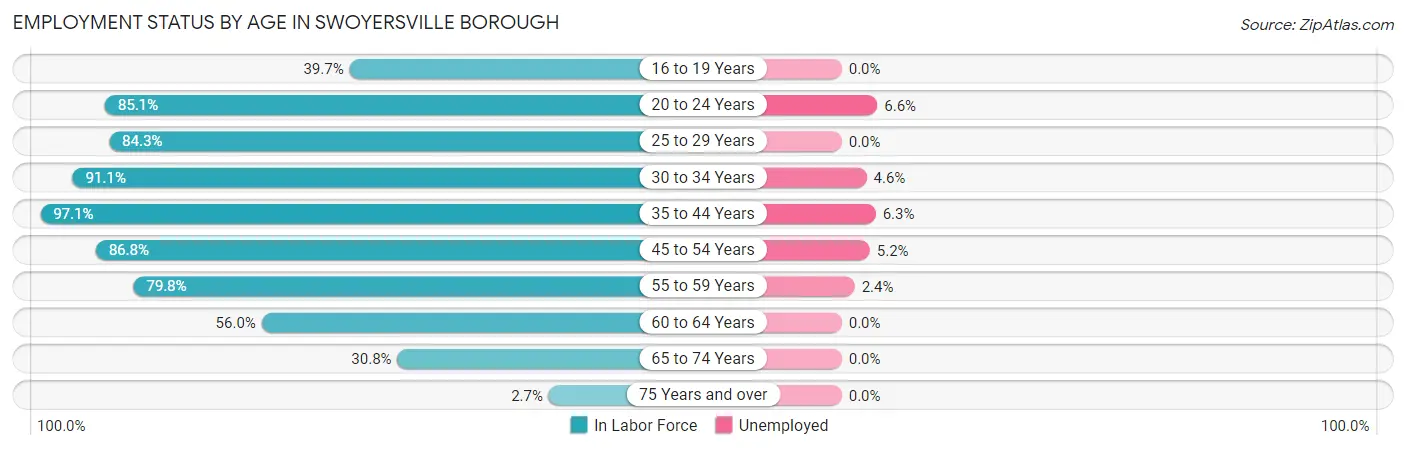
| Age Bracket | In Labor Force | Unemployed |
| 16 to 19 Years | 79 (39.7%) | 0 (0.0%) |
| 20 to 24 Years | 183 (85.1%) | 12 (6.6%) |
| 25 to 29 Years | 193 (84.3%) | 0 (0.0%) |
| 30 to 34 Years | 327 (91.1%) | 15 (4.6%) |
| 35 to 44 Years | 568 (97.1%) | 36 (6.3%) |
| 45 to 54 Years | 500 (86.8%) | 26 (5.2%) |
| 55 to 59 Years | 414 (79.8%) | 10 (2.4%) |
| 60 to 64 Years | 167 (56.0%) | 0 (0.0%) |
| 65 to 74 Years | 274 (30.8%) | 0 (0.0%) |
| 75 Years and over | 17 (2.7%) | 0 (0.0%) |
| Total | 2,722 (60.4%) | 98 (3.6%) |
Employment Status by Educational Attainment in Swoyersville borough
According to labor force statistics for Swoyersville borough, 84.5% of individuals (2,168) out of the total population between 25 and 64 years of age (2,566) are in the labor force, with 4.0% or 87 of them being unemployed. The group with the highest labor force participation rate are those with the educational attainment of less than high school, with 92.5% or 49 individuals in the labor force. Within the labor force, individuals with less than high school education have the highest percentage of unemployment, with 26.5% or 13 of them being unemployed.
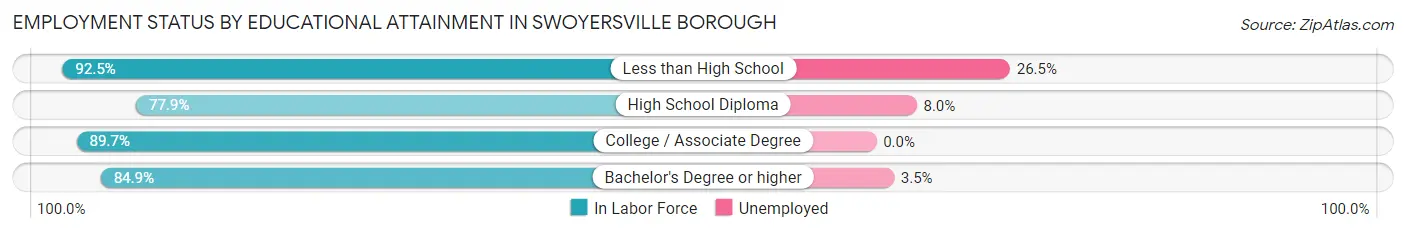
| Educational Attainment | In Labor Force | Unemployed |
| Less than High School | 49 (92.5%) | 14 (26.5%) |
| High School Diploma | 602 (77.9%) | 62 (8.0%) |
| College / Associate Degree | 772 (89.7%) | 0 (0.0%) |
| Bachelor's Degree or higher | 746 (84.9%) | 31 (3.5%) |
| Total | 2,168 (84.5%) | 103 (4.0%) |
Employment Occupations by Sex in Swoyersville borough
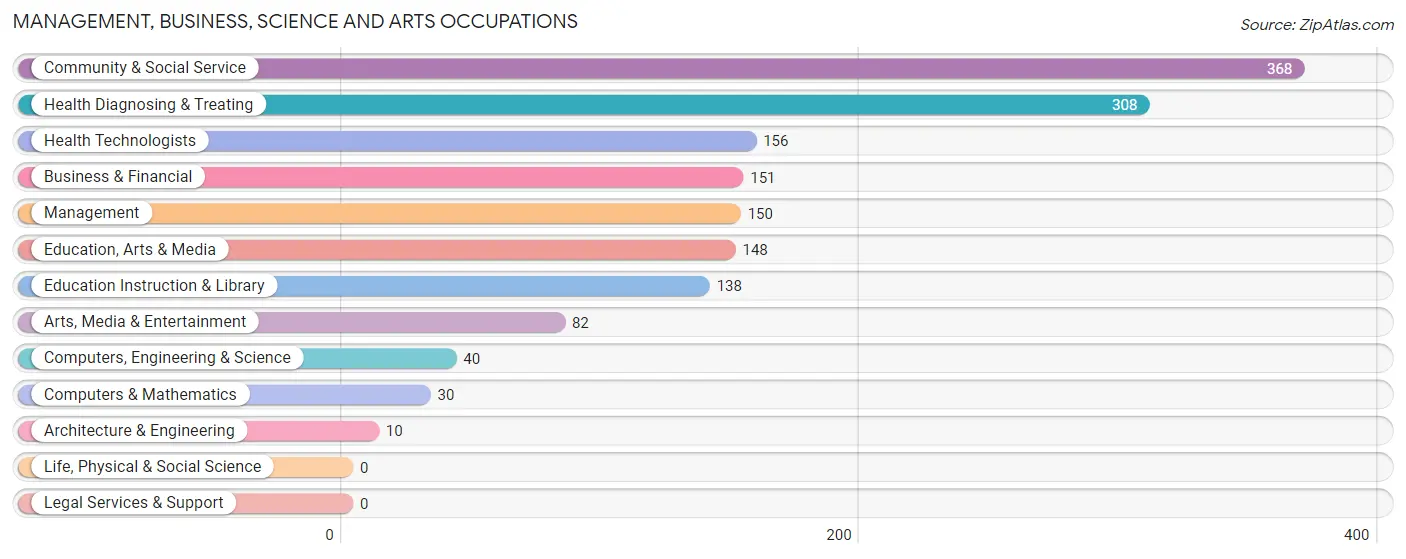
Management, Business, Science and Arts Occupations
The most common Management, Business, Science and Arts occupations in Swoyersville borough are Community & Social Service (368 | 14.0%), Health Diagnosing & Treating (308 | 11.7%), Health Technologists (156 | 5.9%), Business & Financial (151 | 5.8%), and Management (150 | 5.7%).
Management, Business, Science and Arts Occupations by Sex
Within the Management, Business, Science and Arts occupations in Swoyersville borough, the most male-oriented occupations are Computers, Engineering & Science (100.0%), Computers & Mathematics (100.0%), and Architecture & Engineering (100.0%), while the most female-oriented occupations are Health Diagnosing & Treating (100.0%), Health Technologists (100.0%), and Education, Arts & Media (77.0%).
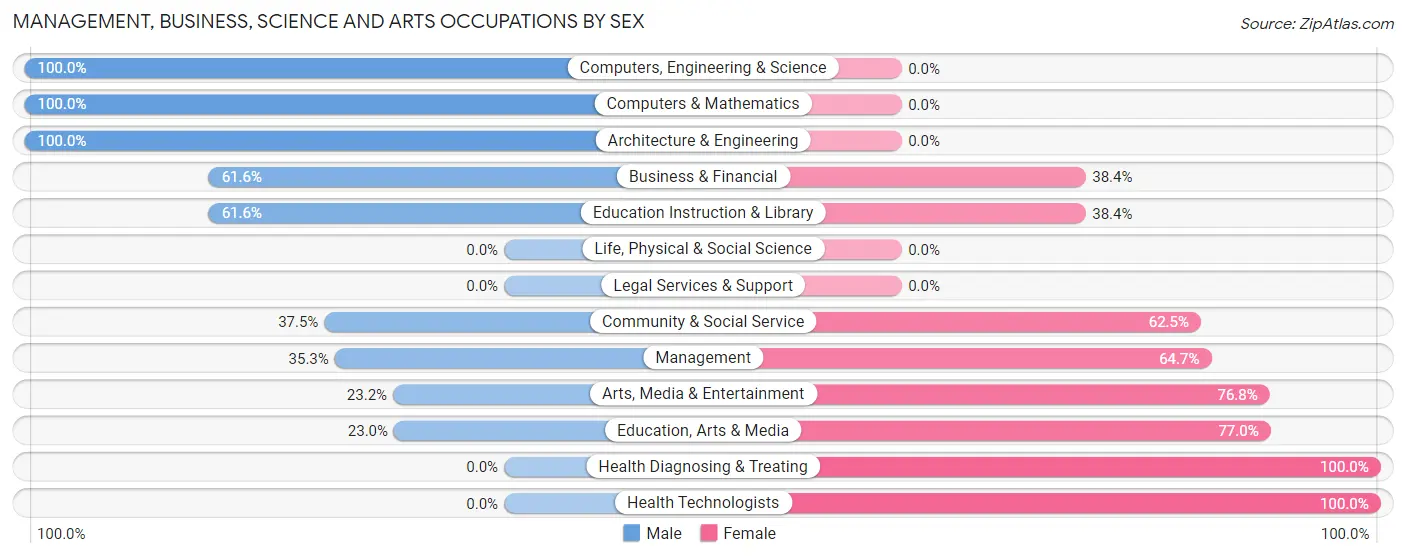
| Occupation | Male | Female |
| Management | 53 (35.3%) | 97 (64.7%) |
| Business & Financial | 93 (61.6%) | 58 (38.4%) |
| Computers, Engineering & Science | 40 (100.0%) | 0 (0.0%) |
| Computers & Mathematics | 30 (100.0%) | 0 (0.0%) |
| Architecture & Engineering | 10 (100.0%) | 0 (0.0%) |
| Life, Physical & Social Science | 0 (0.0%) | 0 (0.0%) |
| Community & Social Service | 138 (37.5%) | 230 (62.5%) |
| Education, Arts & Media | 34 (23.0%) | 114 (77.0%) |
| Legal Services & Support | 0 (0.0%) | 0 (0.0%) |
| Education Instruction & Library | 85 (61.6%) | 53 (38.4%) |
| Arts, Media & Entertainment | 19 (23.2%) | 63 (76.8%) |
| Health Diagnosing & Treating | 0 (0.0%) | 308 (100.0%) |
| Health Technologists | 0 (0.0%) | 156 (100.0%) |
| Total (Category) | 324 (31.9%) | 693 (68.1%) |
| Total (Overall) | 1,241 (47.3%) | 1,382 (52.7%) |
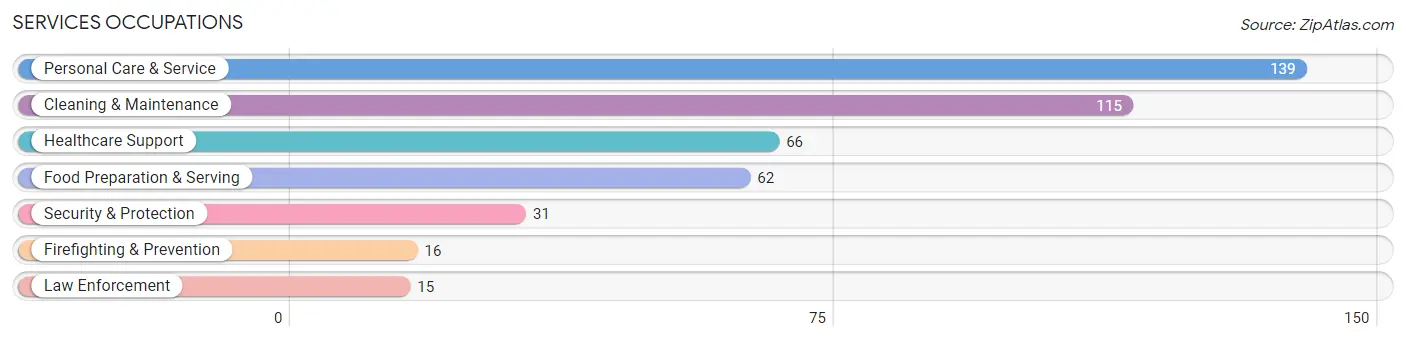
Services Occupations
The most common Services occupations in Swoyersville borough are Personal Care & Service (139 | 5.3%), Cleaning & Maintenance (115 | 4.4%), Healthcare Support (66 | 2.5%), Food Preparation & Serving (62 | 2.4%), and Security & Protection (31 | 1.2%).
Services Occupations by Sex
Within the Services occupations in Swoyersville borough, the most male-oriented occupations are Security & Protection (100.0%), Firefighting & Prevention (100.0%), and Law Enforcement (100.0%), while the most female-oriented occupations are Food Preparation & Serving (75.8%), Personal Care & Service (59.0%), and Cleaning & Maintenance (56.5%).
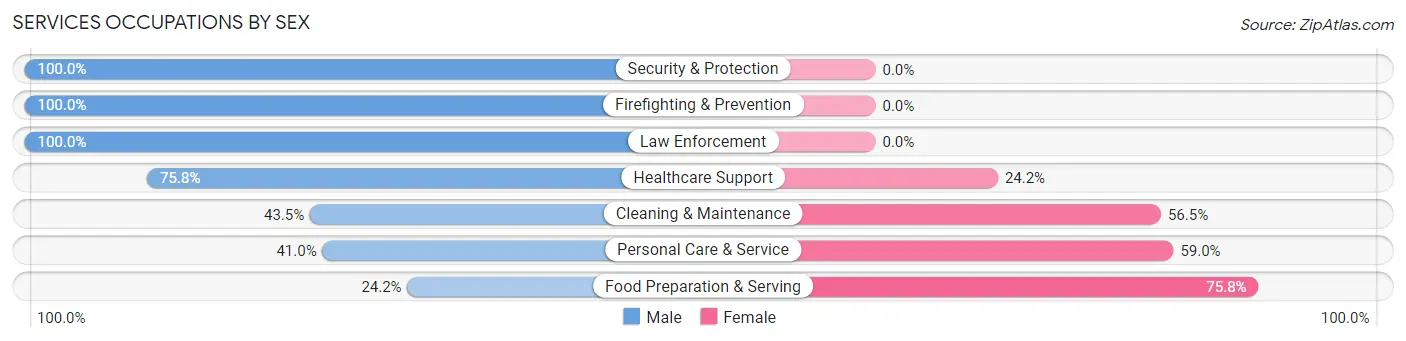
| Occupation | Male | Female |
| Healthcare Support | 50 (75.8%) | 16 (24.2%) |
| Security & Protection | 31 (100.0%) | 0 (0.0%) |
| Firefighting & Prevention | 16 (100.0%) | 0 (0.0%) |
| Law Enforcement | 15 (100.0%) | 0 (0.0%) |
| Food Preparation & Serving | 15 (24.2%) | 47 (75.8%) |
| Cleaning & Maintenance | 50 (43.5%) | 65 (56.5%) |
| Personal Care & Service | 57 (41.0%) | 82 (59.0%) |
| Total (Category) | 203 (49.1%) | 210 (50.8%) |
| Total (Overall) | 1,241 (47.3%) | 1,382 (52.7%) |
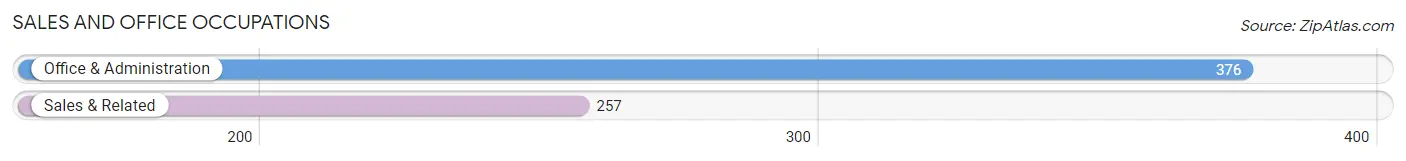
Sales and Office Occupations
The most common Sales and Office occupations in Swoyersville borough are Office & Administration (376 | 14.3%), and Sales & Related (257 | 9.8%).
Sales and Office Occupations by Sex
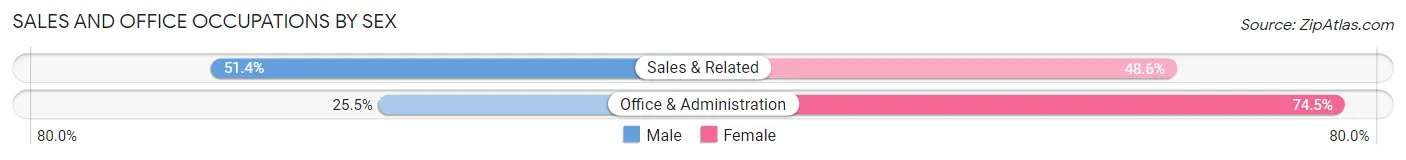
| Occupation | Male | Female |
| Sales & Related | 132 (51.4%) | 125 (48.6%) |
| Office & Administration | 96 (25.5%) | 280 (74.5%) |
| Total (Category) | 228 (36.0%) | 405 (64.0%) |
| Total (Overall) | 1,241 (47.3%) | 1,382 (52.7%) |
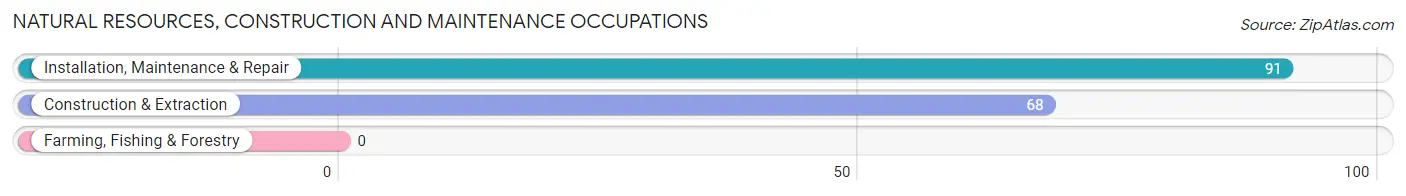
Natural Resources, Construction and Maintenance Occupations
The most common Natural Resources, Construction and Maintenance occupations in Swoyersville borough are Installation, Maintenance & Repair (91 | 3.5%), and Construction & Extraction (68 | 2.6%).
Natural Resources, Construction and Maintenance Occupations by Sex
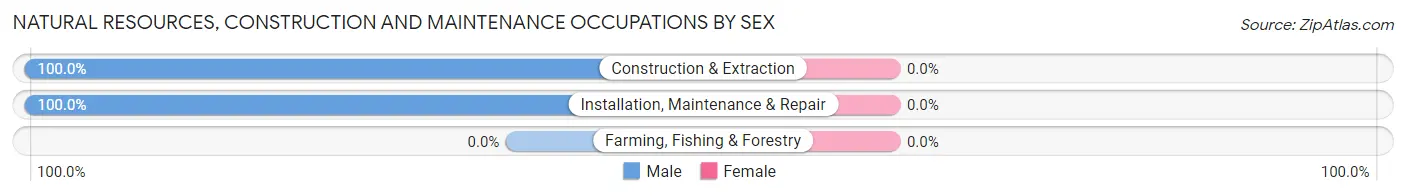
| Occupation | Male | Female |
| Farming, Fishing & Forestry | 0 (0.0%) | 0 (0.0%) |
| Construction & Extraction | 68 (100.0%) | 0 (0.0%) |
| Installation, Maintenance & Repair | 91 (100.0%) | 0 (0.0%) |
| Total (Category) | 159 (100.0%) | 0 (0.0%) |
| Total (Overall) | 1,241 (47.3%) | 1,382 (52.7%) |
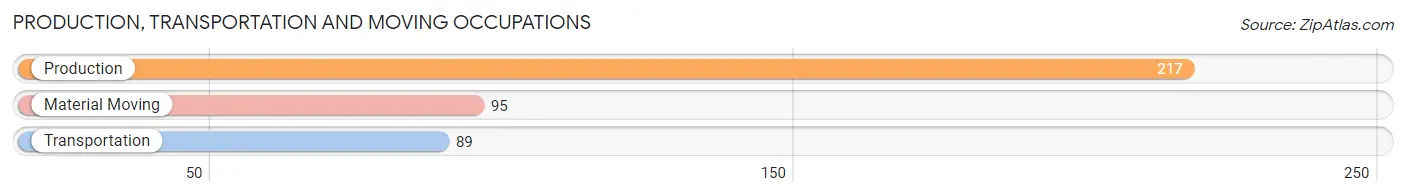
Production, Transportation and Moving Occupations
The most common Production, Transportation and Moving occupations in Swoyersville borough are Production (217 | 8.3%), Material Moving (95 | 3.6%), and Transportation (89 | 3.4%).
Production, Transportation and Moving Occupations by Sex
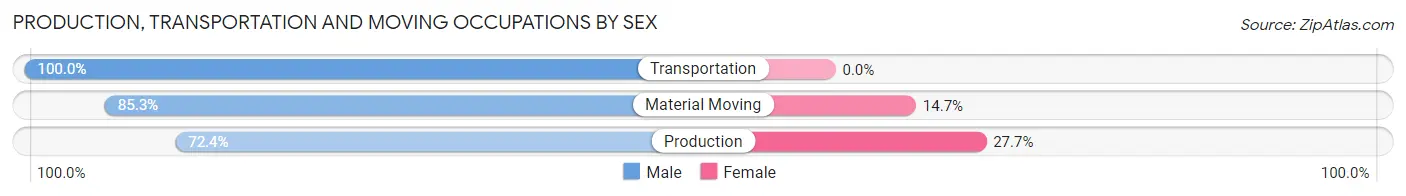
| Occupation | Male | Female |
| Production | 157 (72.4%) | 60 (27.7%) |
| Transportation | 89 (100.0%) | 0 (0.0%) |
| Material Moving | 81 (85.3%) | 14 (14.7%) |
| Total (Category) | 327 (81.6%) | 74 (18.4%) |
| Total (Overall) | 1,241 (47.3%) | 1,382 (52.7%) |
Employment Industries by Sex in Swoyersville borough
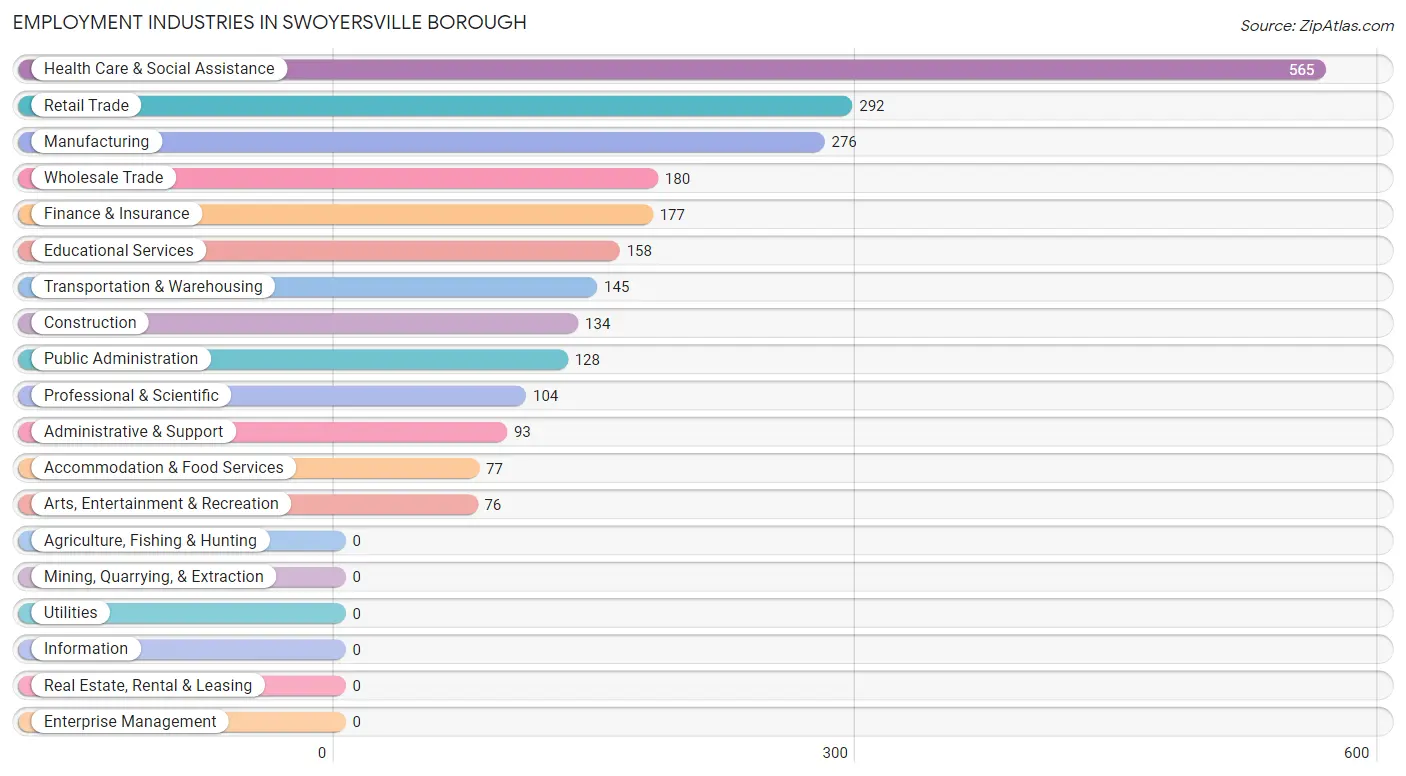
Employment Industries in Swoyersville borough
The major employment industries in Swoyersville borough include Health Care & Social Assistance (565 | 21.5%), Retail Trade (292 | 11.1%), Manufacturing (276 | 10.5%), Wholesale Trade (180 | 6.9%), and Finance & Insurance (177 | 6.8%).
Employment Industries by Sex in Swoyersville borough
The Swoyersville borough industries that see more men than women are Arts, Entertainment & Recreation (100.0%), Manufacturing (89.5%), and Transportation & Warehousing (86.9%), whereas the industries that tend to have a higher number of women are Health Care & Social Assistance (85.8%), Finance & Insurance (76.3%), and Retail Trade (68.5%).
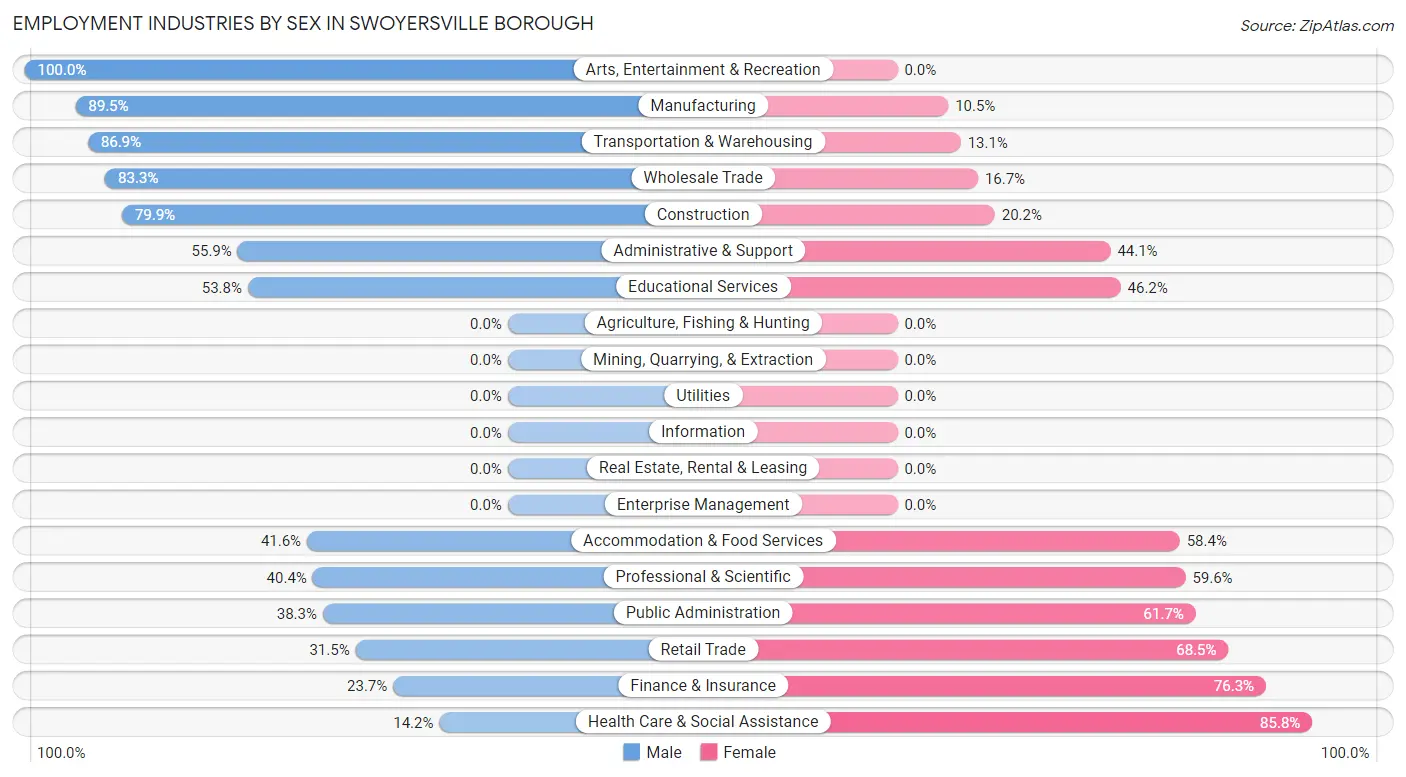
| Industry | Male | Female |
| Agriculture, Fishing & Hunting | 0 (0.0%) | 0 (0.0%) |
| Mining, Quarrying, & Extraction | 0 (0.0%) | 0 (0.0%) |
| Construction | 107 (79.8%) | 27 (20.2%) |
| Manufacturing | 247 (89.5%) | 29 (10.5%) |
| Wholesale Trade | 150 (83.3%) | 30 (16.7%) |
| Retail Trade | 92 (31.5%) | 200 (68.5%) |
| Transportation & Warehousing | 126 (86.9%) | 19 (13.1%) |
| Utilities | 0 (0.0%) | 0 (0.0%) |
| Information | 0 (0.0%) | 0 (0.0%) |
| Finance & Insurance | 42 (23.7%) | 135 (76.3%) |
| Real Estate, Rental & Leasing | 0 (0.0%) | 0 (0.0%) |
| Professional & Scientific | 42 (40.4%) | 62 (59.6%) |
| Enterprise Management | 0 (0.0%) | 0 (0.0%) |
| Administrative & Support | 52 (55.9%) | 41 (44.1%) |
| Educational Services | 85 (53.8%) | 73 (46.2%) |
| Health Care & Social Assistance | 80 (14.2%) | 485 (85.8%) |
| Arts, Entertainment & Recreation | 76 (100.0%) | 0 (0.0%) |
| Accommodation & Food Services | 32 (41.6%) | 45 (58.4%) |
| Public Administration | 49 (38.3%) | 79 (61.7%) |
| Total | 1,241 (47.3%) | 1,382 (52.7%) |
Education in Swoyersville borough
School Enrollment in Swoyersville borough
The most common levels of schooling among the 692 students in Swoyersville borough are college / undergraduate (233 | 33.7%), middle school (165 | 23.8%), and high school (113 | 16.3%).
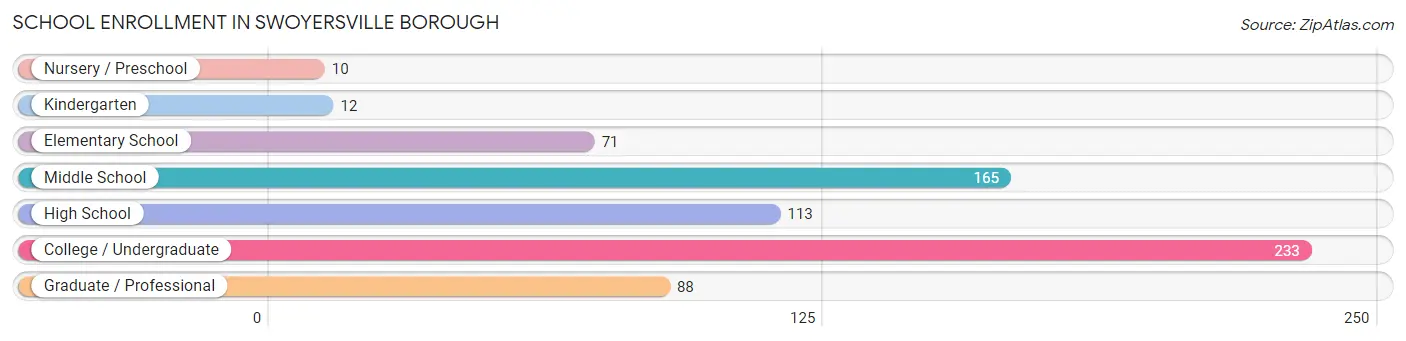
| School Level | # Students | % Students |
| Nursery / Preschool | 10 | 1.5% |
| Kindergarten | 12 | 1.7% |
| Elementary School | 71 | 10.3% |
| Middle School | 165 | 23.8% |
| High School | 113 | 16.3% |
| College / Undergraduate | 233 | 33.7% |
| Graduate / Professional | 88 | 12.7% |
| Total | 692 | 100.0% |
School Enrollment by Age by Funding Source in Swoyersville borough
Out of a total of 692 students who are enrolled in schools in Swoyersville borough, 254 (36.7%) attend a private institution, while the remaining 438 (63.3%) are enrolled in public schools. The age group of 10 to 14 year olds has the highest likelihood of being enrolled in private schools, with 115 (69.7% in the age bracket) enrolled. Conversely, the age group of 3 to 4 year olds has the lowest likelihood of being enrolled in a private school, with 10 (100.0% in the age bracket) attending a public institution.
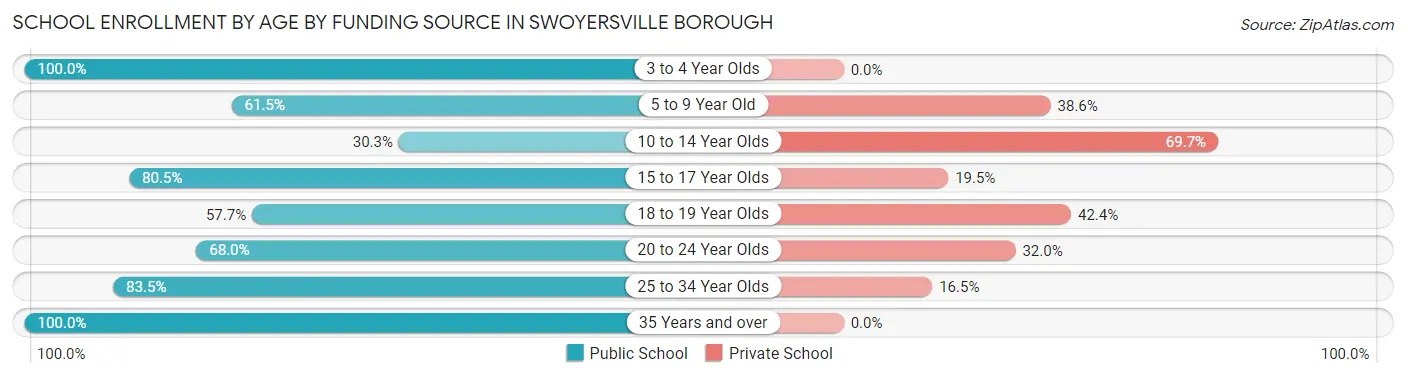
| Age Bracket | Public School | Private School |
| 3 to 4 Year Olds | 10 (100.0%) | 0 (0.0%) |
| 5 to 9 Year Old | 51 (61.5%) | 32 (38.6%) |
| 10 to 14 Year Olds | 50 (30.3%) | 115 (69.7%) |
| 15 to 17 Year Olds | 91 (80.5%) | 22 (19.5%) |
| 18 to 19 Year Olds | 49 (57.7%) | 36 (42.3%) |
| 20 to 24 Year Olds | 68 (68.0%) | 32 (32.0%) |
| 25 to 34 Year Olds | 86 (83.5%) | 17 (16.5%) |
| 35 Years and over | 33 (100.0%) | 0 (0.0%) |
| Total | 438 (63.3%) | 254 (36.7%) |
Educational Attainment by Field of Study in Swoyersville borough
Business (287 | 20.6%), education (212 | 15.2%), arts & humanities (165 | 11.9%), psychology (142 | 10.2%), and science & technology (139 | 10.0%) are the most common fields of study among 1,391 individuals in Swoyersville borough who have obtained a bachelor's degree or higher.
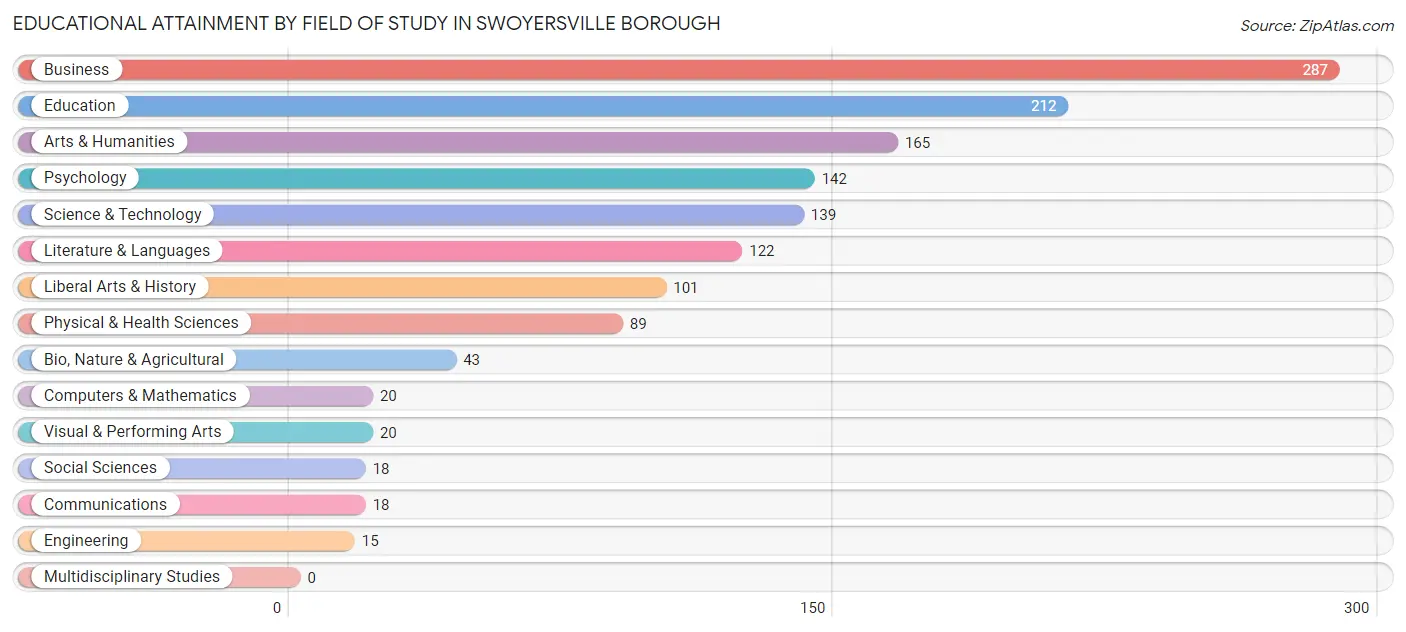
| Field of Study | # Graduates | % Graduates |
| Computers & Mathematics | 20 | 1.4% |
| Bio, Nature & Agricultural | 43 | 3.1% |
| Physical & Health Sciences | 89 | 6.4% |
| Psychology | 142 | 10.2% |
| Social Sciences | 18 | 1.3% |
| Engineering | 15 | 1.1% |
| Multidisciplinary Studies | 0 | 0.0% |
| Science & Technology | 139 | 10.0% |
| Business | 287 | 20.6% |
| Education | 212 | 15.2% |
| Literature & Languages | 122 | 8.8% |
| Liberal Arts & History | 101 | 7.3% |
| Visual & Performing Arts | 20 | 1.4% |
| Communications | 18 | 1.3% |
| Arts & Humanities | 165 | 11.9% |
| Total | 1,391 | 100.0% |
Transportation & Commute in Swoyersville borough
Vehicle Availability by Sex in Swoyersville borough
The most prevalent vehicle ownership categories in Swoyersville borough are males with 2 vehicles (382, accounting for 31.1%) and females with 2 vehicles (431, making up 27.9%).
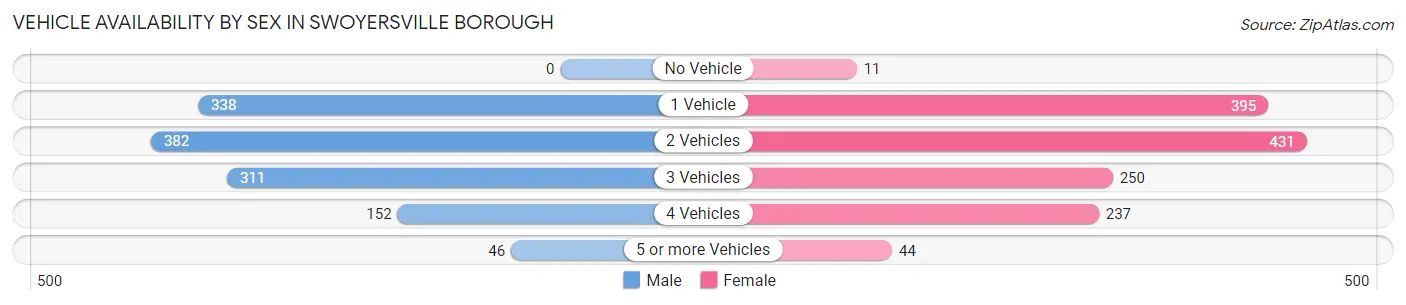
| Vehicles Available | Male | Female |
| No Vehicle | 0 (0.0%) | 11 (0.8%) |
| 1 Vehicle | 338 (27.5%) | 395 (28.9%) |
| 2 Vehicles | 382 (31.1%) | 431 (31.5%) |
| 3 Vehicles | 311 (25.3%) | 250 (18.3%) |
| 4 Vehicles | 152 (12.4%) | 237 (17.3%) |
| 5 or more Vehicles | 46 (3.7%) | 44 (3.2%) |
| Total | 1,229 (100.0%) | 1,368 (100.0%) |
Commute Time in Swoyersville borough
The most frequently occuring commute durations in Swoyersville borough are 15 to 19 minutes (557 commuters, 22.1%), 10 to 14 minutes (528 commuters, 20.9%), and 20 to 24 minutes (410 commuters, 16.2%).
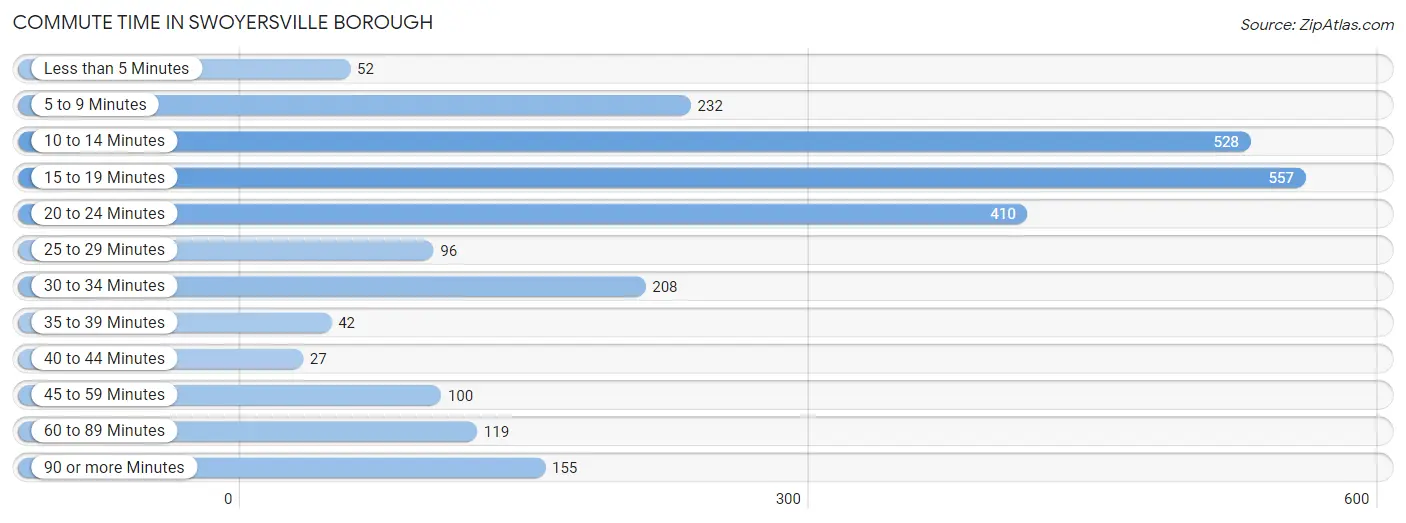
| Commute Time | # Commuters | % Commuters |
| Less than 5 Minutes | 52 | 2.1% |
| 5 to 9 Minutes | 232 | 9.2% |
| 10 to 14 Minutes | 528 | 20.9% |
| 15 to 19 Minutes | 557 | 22.1% |
| 20 to 24 Minutes | 410 | 16.2% |
| 25 to 29 Minutes | 96 | 3.8% |
| 30 to 34 Minutes | 208 | 8.2% |
| 35 to 39 Minutes | 42 | 1.7% |
| 40 to 44 Minutes | 27 | 1.1% |
| 45 to 59 Minutes | 100 | 4.0% |
| 60 to 89 Minutes | 119 | 4.7% |
| 90 or more Minutes | 155 | 6.1% |
Commute Time by Sex in Swoyersville borough
The most common commute times in Swoyersville borough are 15 to 19 minutes (211 commuters, 17.5%) for males and 15 to 19 minutes (346 commuters, 26.3%) for females.
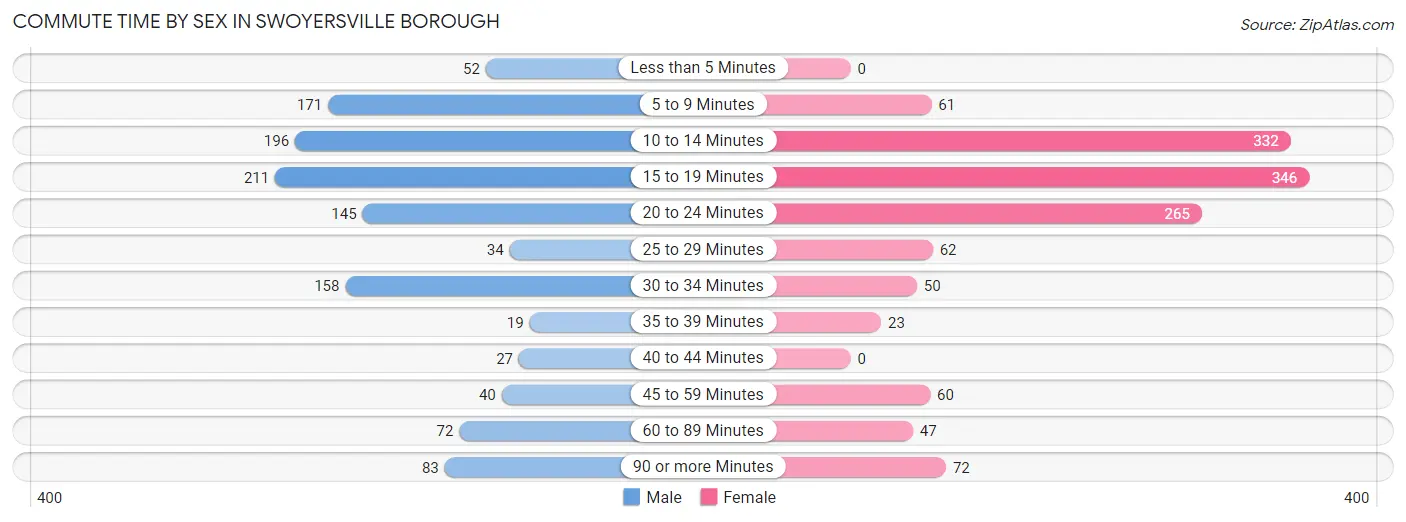
| Commute Time | Male | Female |
| Less than 5 Minutes | 52 (4.3%) | 0 (0.0%) |
| 5 to 9 Minutes | 171 (14.2%) | 61 (4.6%) |
| 10 to 14 Minutes | 196 (16.2%) | 332 (25.2%) |
| 15 to 19 Minutes | 211 (17.5%) | 346 (26.3%) |
| 20 to 24 Minutes | 145 (12.0%) | 265 (20.1%) |
| 25 to 29 Minutes | 34 (2.8%) | 62 (4.7%) |
| 30 to 34 Minutes | 158 (13.1%) | 50 (3.8%) |
| 35 to 39 Minutes | 19 (1.6%) | 23 (1.8%) |
| 40 to 44 Minutes | 27 (2.2%) | 0 (0.0%) |
| 45 to 59 Minutes | 40 (3.3%) | 60 (4.5%) |
| 60 to 89 Minutes | 72 (6.0%) | 47 (3.6%) |
| 90 or more Minutes | 83 (6.9%) | 72 (5.5%) |
Time of Departure to Work by Sex in Swoyersville borough
The most frequent times of departure to work in Swoyersville borough are 7:30 AM to 7:59 AM (191, 15.8%) for males and 7:30 AM to 7:59 AM (318, 24.1%) for females.
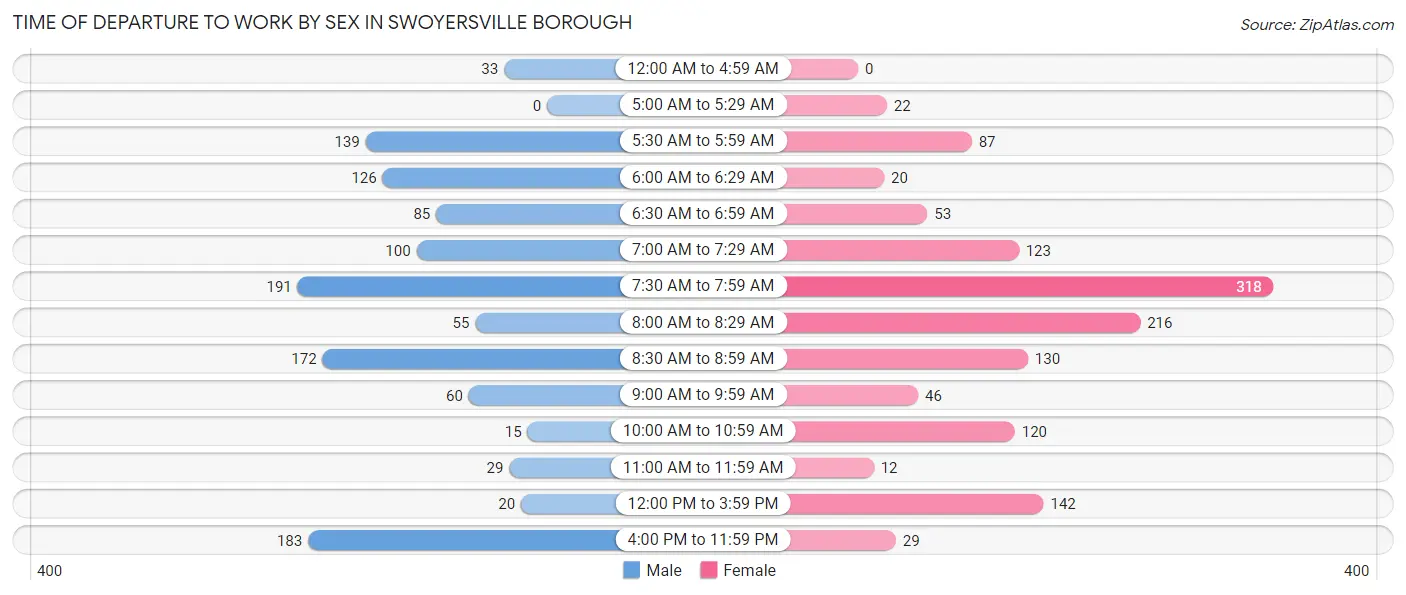
| Time of Departure | Male | Female |
| 12:00 AM to 4:59 AM | 33 (2.7%) | 0 (0.0%) |
| 5:00 AM to 5:29 AM | 0 (0.0%) | 22 (1.7%) |
| 5:30 AM to 5:59 AM | 139 (11.5%) | 87 (6.6%) |
| 6:00 AM to 6:29 AM | 126 (10.4%) | 20 (1.5%) |
| 6:30 AM to 6:59 AM | 85 (7.0%) | 53 (4.0%) |
| 7:00 AM to 7:29 AM | 100 (8.3%) | 123 (9.3%) |
| 7:30 AM to 7:59 AM | 191 (15.8%) | 318 (24.1%) |
| 8:00 AM to 8:29 AM | 55 (4.5%) | 216 (16.4%) |
| 8:30 AM to 8:59 AM | 172 (14.2%) | 130 (9.9%) |
| 9:00 AM to 9:59 AM | 60 (5.0%) | 46 (3.5%) |
| 10:00 AM to 10:59 AM | 15 (1.2%) | 120 (9.1%) |
| 11:00 AM to 11:59 AM | 29 (2.4%) | 12 (0.9%) |
| 12:00 PM to 3:59 PM | 20 (1.7%) | 142 (10.8%) |
| 4:00 PM to 11:59 PM | 183 (15.1%) | 29 (2.2%) |
| Total | 1,208 (100.0%) | 1,318 (100.0%) |
Housing Occupancy in Swoyersville borough
Occupancy by Ownership in Swoyersville borough
Of the total 2,508 dwellings in Swoyersville borough, owner-occupied units account for 2,033 (81.1%), while renter-occupied units make up 475 (18.9%).
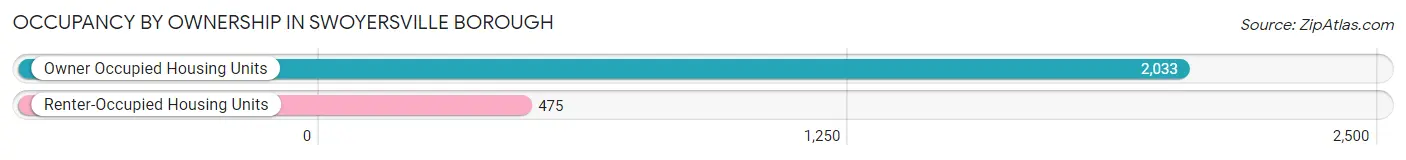
| Occupancy | # Housing Units | % Housing Units |
| Owner Occupied Housing Units | 2,033 | 81.1% |
| Renter-Occupied Housing Units | 475 | 18.9% |
| Total Occupied Housing Units | 2,508 | 100.0% |
Occupancy by Household Size in Swoyersville borough
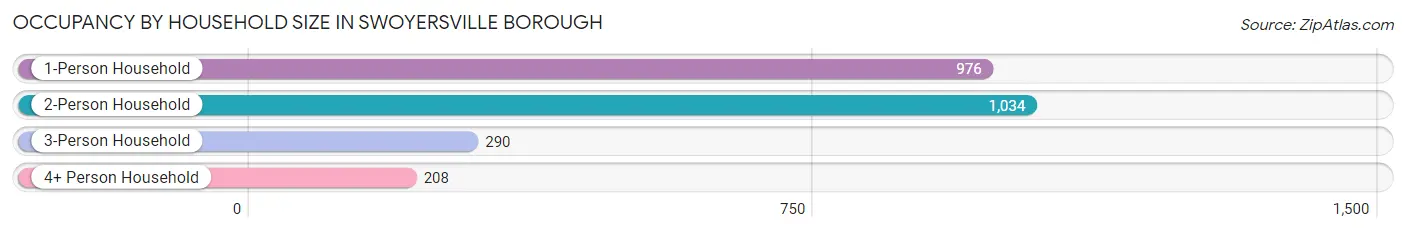
| Household Size | # Housing Units | % Housing Units |
| 1-Person Household | 976 | 38.9% |
| 2-Person Household | 1,034 | 41.2% |
| 3-Person Household | 290 | 11.6% |
| 4+ Person Household | 208 | 8.3% |
| Total Housing Units | 2,508 | 100.0% |
Occupancy by Ownership by Household Size in Swoyersville borough
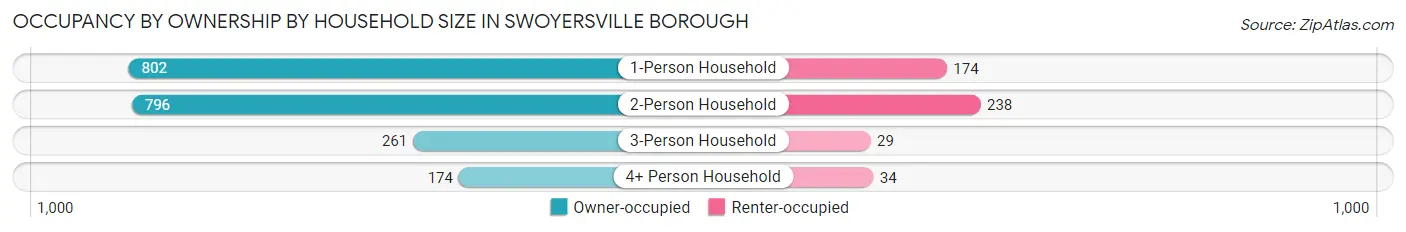
| Household Size | Owner-occupied | Renter-occupied |
| 1-Person Household | 802 (82.2%) | 174 (17.8%) |
| 2-Person Household | 796 (77.0%) | 238 (23.0%) |
| 3-Person Household | 261 (90.0%) | 29 (10.0%) |
| 4+ Person Household | 174 (83.7%) | 34 (16.4%) |
| Total Housing Units | 2,033 (81.1%) | 475 (18.9%) |
Occupancy by Educational Attainment in Swoyersville borough
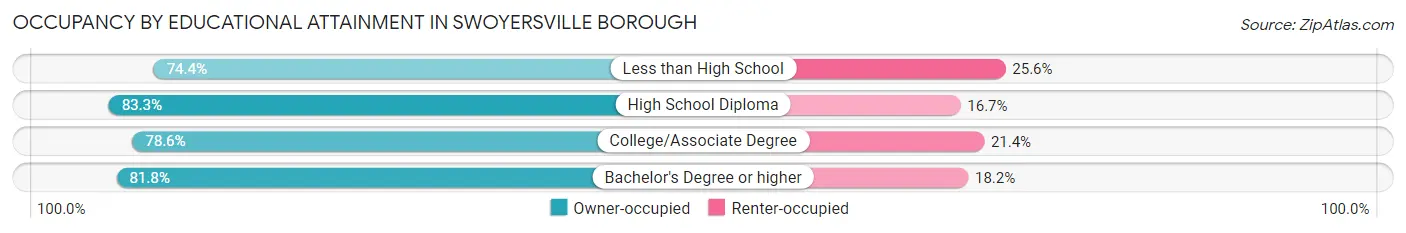
| Household Size | Owner-occupied | Renter-occupied |
| Less than High School | 61 (74.4%) | 21 (25.6%) |
| High School Diploma | 674 (83.3%) | 135 (16.7%) |
| College/Associate Degree | 607 (78.6%) | 165 (21.4%) |
| Bachelor's Degree or higher | 691 (81.8%) | 154 (18.2%) |
Occupancy by Age of Householder in Swoyersville borough
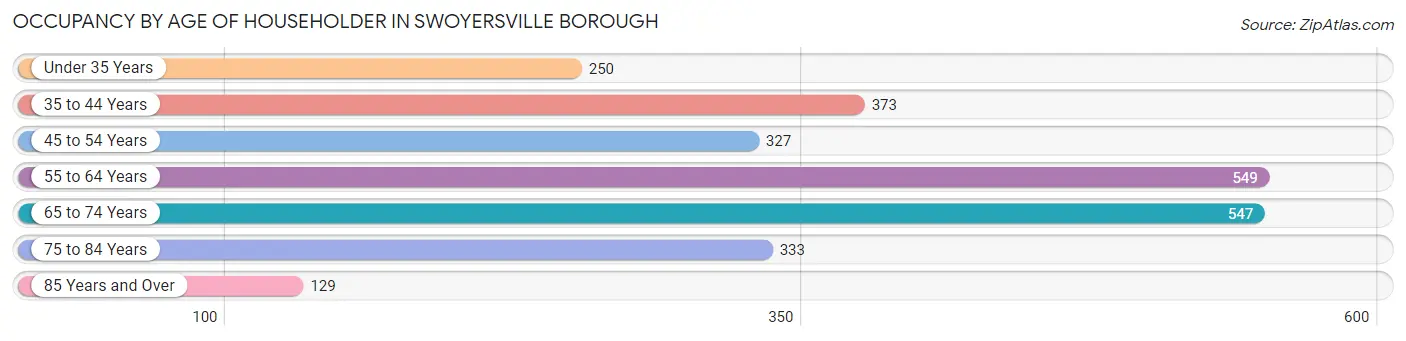
| Age Bracket | # Households | % Households |
| Under 35 Years | 250 | 10.0% |
| 35 to 44 Years | 373 | 14.9% |
| 45 to 54 Years | 327 | 13.0% |
| 55 to 64 Years | 549 | 21.9% |
| 65 to 74 Years | 547 | 21.8% |
| 75 to 84 Years | 333 | 13.3% |
| 85 Years and Over | 129 | 5.1% |
| Total | 2,508 | 100.0% |
Housing Finances in Swoyersville borough
Median Income by Occupancy in Swoyersville borough
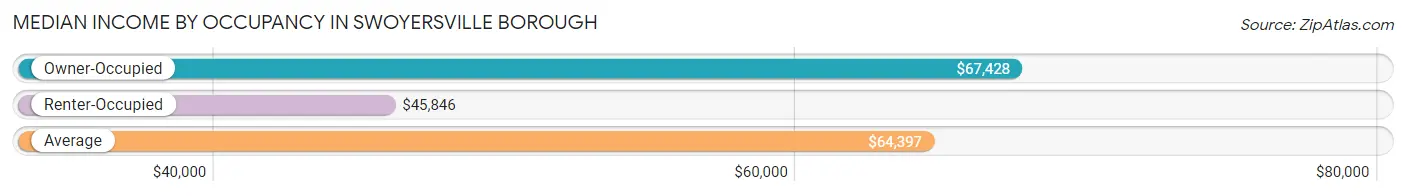
| Occupancy Type | # Households | Median Income |
| Owner-Occupied | 2,033 (81.1%) | $67,428 |
| Renter-Occupied | 475 (18.9%) | $45,846 |
| Average | 2,508 (100.0%) | $64,397 |
Occupancy by Householder Income Bracket in Swoyersville borough
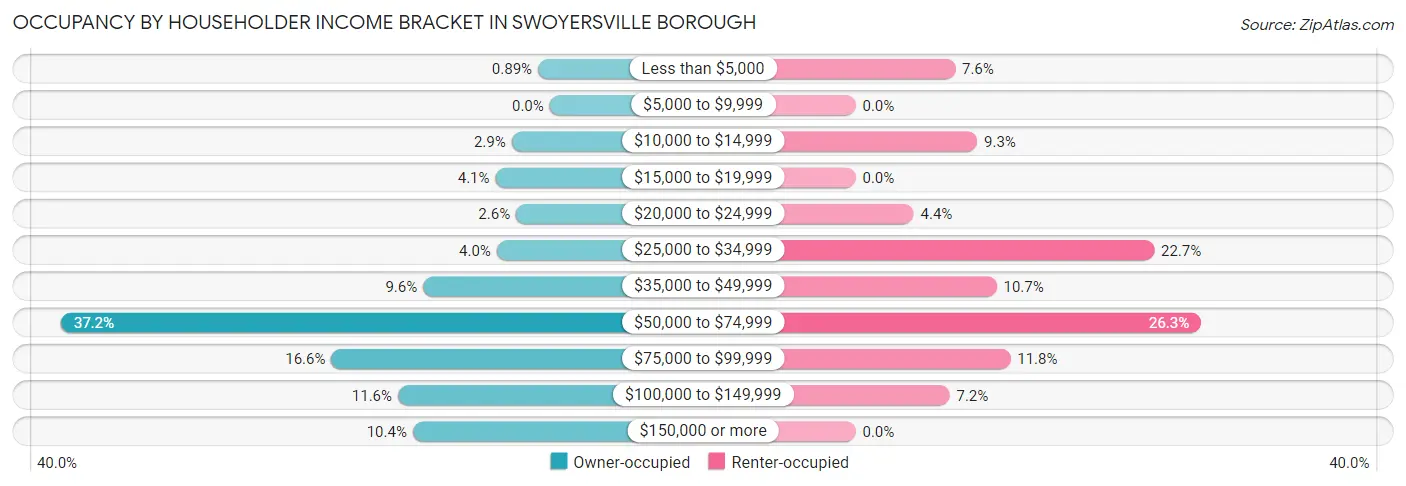
| Income Bracket | Owner-occupied | Renter-occupied |
| Less than $5,000 | 18 (0.9%) | 36 (7.6%) |
| $5,000 to $9,999 | 0 (0.0%) | 0 (0.0%) |
| $10,000 to $14,999 | 59 (2.9%) | 44 (9.3%) |
| $15,000 to $19,999 | 84 (4.1%) | 0 (0.0%) |
| $20,000 to $24,999 | 52 (2.6%) | 21 (4.4%) |
| $25,000 to $34,999 | 82 (4.0%) | 108 (22.7%) |
| $35,000 to $49,999 | 196 (9.6%) | 51 (10.7%) |
| $50,000 to $74,999 | 757 (37.2%) | 125 (26.3%) |
| $75,000 to $99,999 | 338 (16.6%) | 56 (11.8%) |
| $100,000 to $149,999 | 235 (11.6%) | 34 (7.2%) |
| $150,000 or more | 212 (10.4%) | 0 (0.0%) |
| Total | 2,033 (100.0%) | 475 (100.0%) |
Monthly Housing Cost Tiers in Swoyersville borough
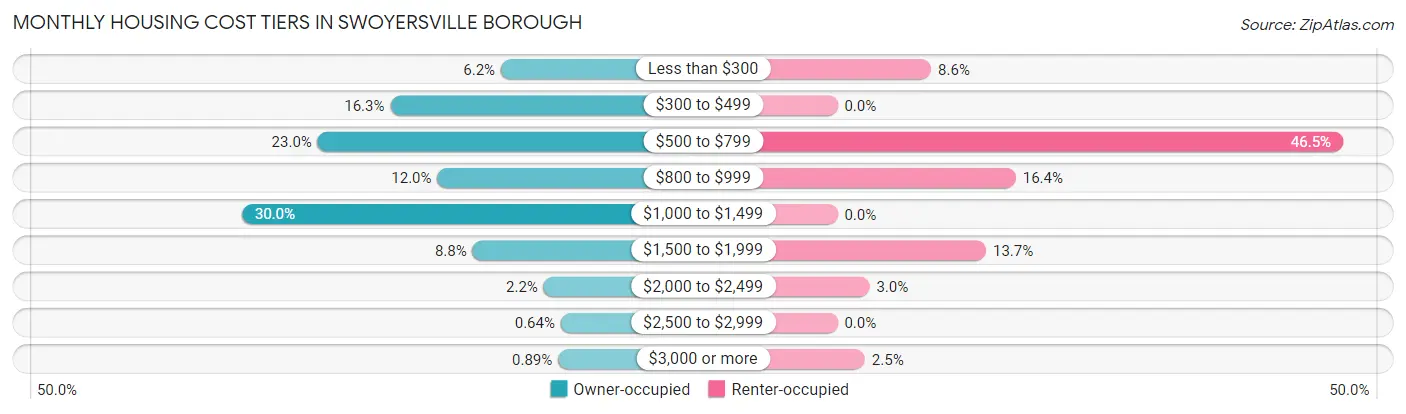
| Monthly Cost | Owner-occupied | Renter-occupied |
| Less than $300 | 125 (6.1%) | 41 (8.6%) |
| $300 to $499 | 332 (16.3%) | 0 (0.0%) |
| $500 to $799 | 468 (23.0%) | 221 (46.5%) |
| $800 to $999 | 244 (12.0%) | 78 (16.4%) |
| $1,000 to $1,499 | 610 (30.0%) | 0 (0.0%) |
| $1,500 to $1,999 | 178 (8.8%) | 65 (13.7%) |
| $2,000 to $2,499 | 45 (2.2%) | 14 (2.9%) |
| $2,500 to $2,999 | 13 (0.6%) | 0 (0.0%) |
| $3,000 or more | 18 (0.9%) | 12 (2.5%) |
| Total | 2,033 (100.0%) | 475 (100.0%) |
Physical Housing Characteristics in Swoyersville borough
Housing Structures in Swoyersville borough
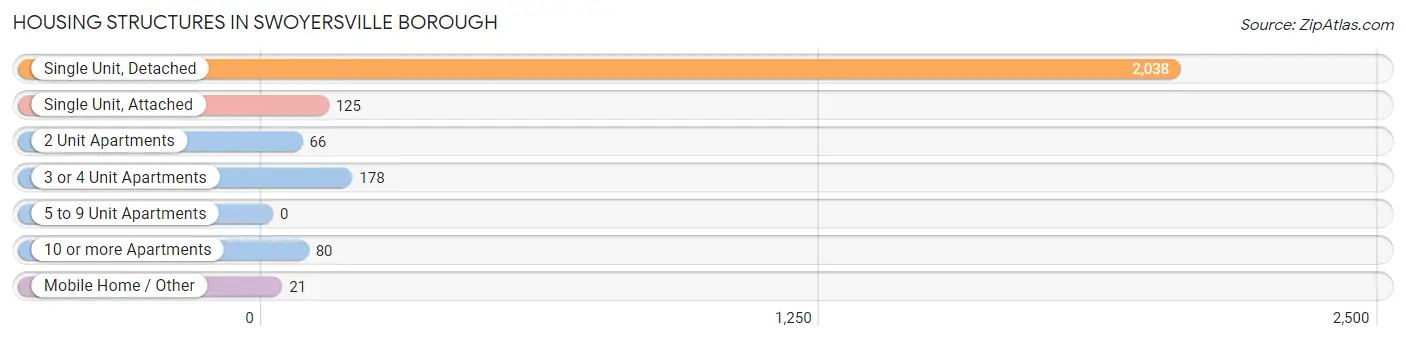
| Structure Type | # Housing Units | % Housing Units |
| Single Unit, Detached | 2,038 | 81.3% |
| Single Unit, Attached | 125 | 5.0% |
| 2 Unit Apartments | 66 | 2.6% |
| 3 or 4 Unit Apartments | 178 | 7.1% |
| 5 to 9 Unit Apartments | 0 | 0.0% |
| 10 or more Apartments | 80 | 3.2% |
| Mobile Home / Other | 21 | 0.8% |
| Total | 2,508 | 100.0% |
Housing Structures by Occupancy in Swoyersville borough
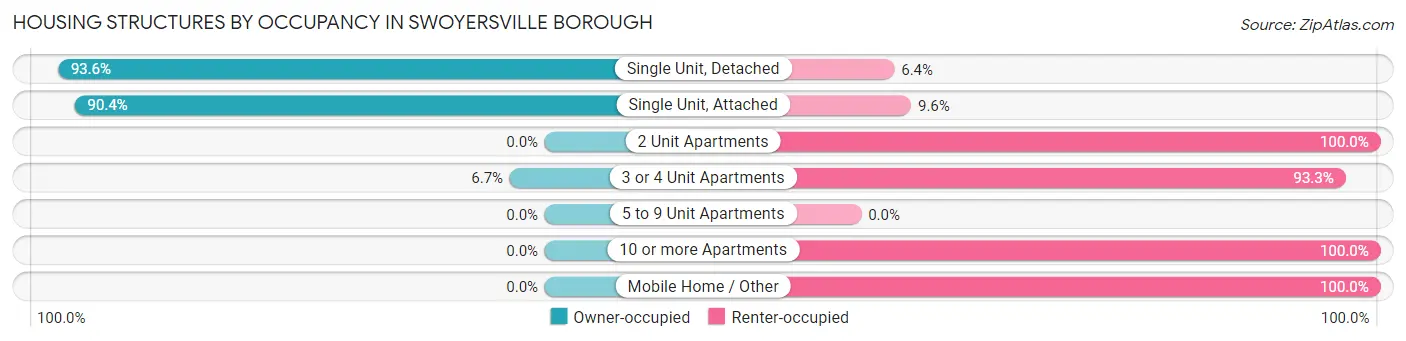
| Structure Type | Owner-occupied | Renter-occupied |
| Single Unit, Detached | 1,908 (93.6%) | 130 (6.4%) |
| Single Unit, Attached | 113 (90.4%) | 12 (9.6%) |
| 2 Unit Apartments | 0 (0.0%) | 66 (100.0%) |
| 3 or 4 Unit Apartments | 12 (6.7%) | 166 (93.3%) |
| 5 to 9 Unit Apartments | 0 (0.0%) | 0 (0.0%) |
| 10 or more Apartments | 0 (0.0%) | 80 (100.0%) |
| Mobile Home / Other | 0 (0.0%) | 21 (100.0%) |
| Total | 2,033 (81.1%) | 475 (18.9%) |
Housing Structures by Number of Rooms in Swoyersville borough
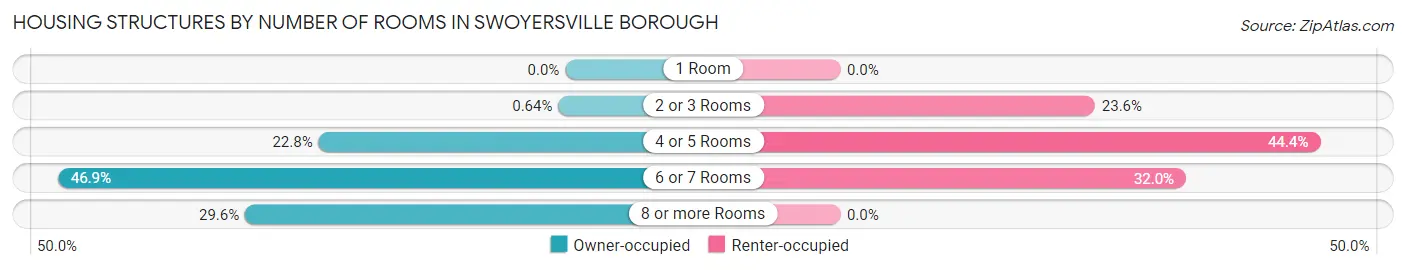
| Number of Rooms | Owner-occupied | Renter-occupied |
| 1 Room | 0 (0.0%) | 0 (0.0%) |
| 2 or 3 Rooms | 13 (0.6%) | 112 (23.6%) |
| 4 or 5 Rooms | 464 (22.8%) | 211 (44.4%) |
| 6 or 7 Rooms | 954 (46.9%) | 152 (32.0%) |
| 8 or more Rooms | 602 (29.6%) | 0 (0.0%) |
| Total | 2,033 (100.0%) | 475 (100.0%) |
Housing Structure by Heating Type in Swoyersville borough
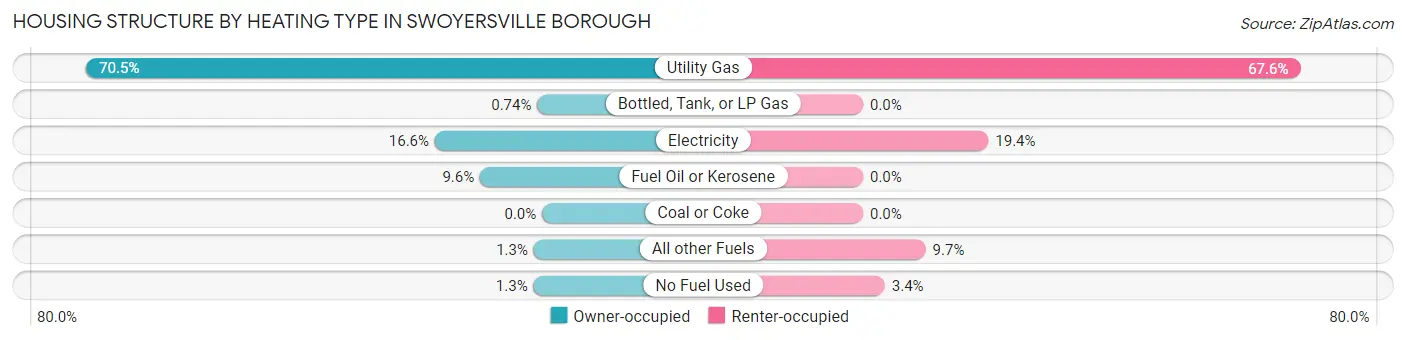
| Heating Type | Owner-occupied | Renter-occupied |
| Utility Gas | 1,433 (70.5%) | 321 (67.6%) |
| Bottled, Tank, or LP Gas | 15 (0.7%) | 0 (0.0%) |
| Electricity | 337 (16.6%) | 92 (19.4%) |
| Fuel Oil or Kerosene | 195 (9.6%) | 0 (0.0%) |
| Coal or Coke | 0 (0.0%) | 0 (0.0%) |
| All other Fuels | 26 (1.3%) | 46 (9.7%) |
| No Fuel Used | 27 (1.3%) | 16 (3.4%) |
| Total | 2,033 (100.0%) | 475 (100.0%) |
Household Vehicle Usage in Swoyersville borough
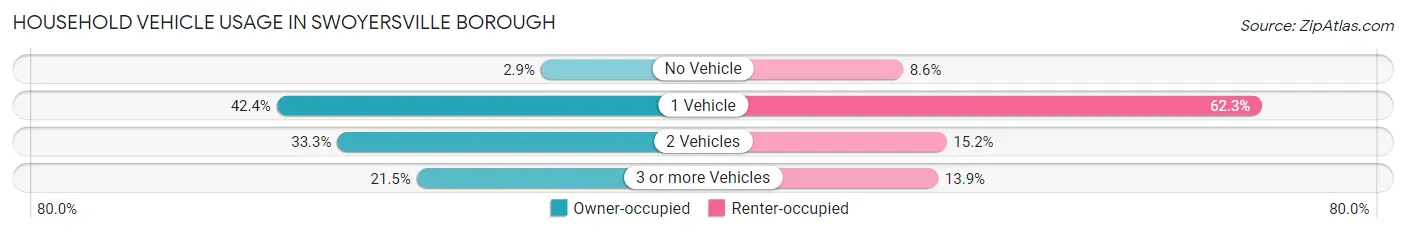
| Vehicles per Household | Owner-occupied | Renter-occupied |
| No Vehicle | 59 (2.9%) | 41 (8.6%) |
| 1 Vehicle | 861 (42.3%) | 296 (62.3%) |
| 2 Vehicles | 677 (33.3%) | 72 (15.2%) |
| 3 or more Vehicles | 436 (21.4%) | 66 (13.9%) |
| Total | 2,033 (100.0%) | 475 (100.0%) |
Real Estate & Mortgages in Swoyersville borough
Real Estate and Mortgage Overview in Swoyersville borough
| Characteristic | Without Mortgage | With Mortgage |
| Housing Units | 901 | 1,132 |
| Median Property Value | $155,800 | $134,300 |
| Median Household Income | $59,293 | $116 |
| Monthly Housing Costs | $497 | $0 |
| Real Estate Taxes | $2,468 | $40 |
Property Value by Mortgage Status in Swoyersville borough
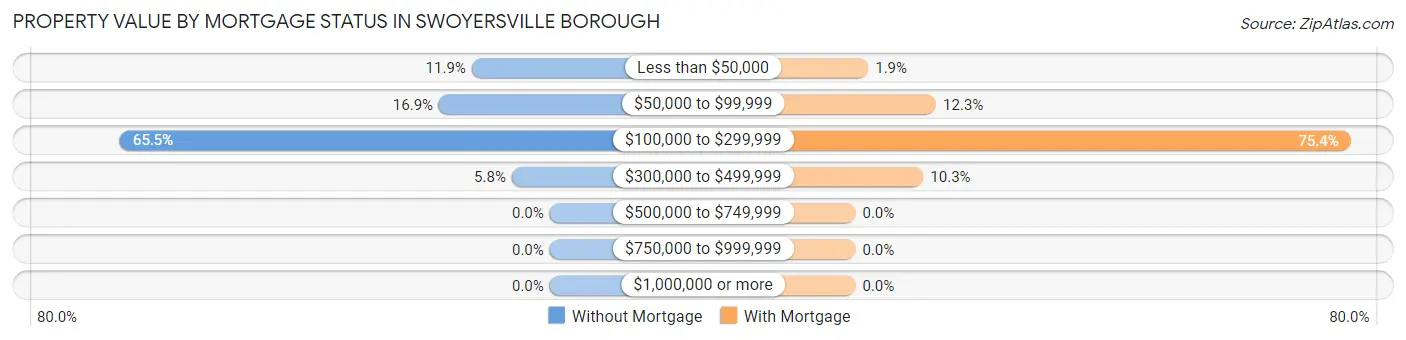
| Property Value | Without Mortgage | With Mortgage |
| Less than $50,000 | 107 (11.9%) | 22 (1.9%) |
| $50,000 to $99,999 | 152 (16.9%) | 139 (12.3%) |
| $100,000 to $299,999 | 590 (65.5%) | 854 (75.4%) |
| $300,000 to $499,999 | 52 (5.8%) | 117 (10.3%) |
| $500,000 to $749,999 | 0 (0.0%) | 0 (0.0%) |
| $750,000 to $999,999 | 0 (0.0%) | 0 (0.0%) |
| $1,000,000 or more | 0 (0.0%) | 0 (0.0%) |
| Total | 901 (100.0%) | 1,132 (100.0%) |
Household Income by Mortgage Status in Swoyersville borough
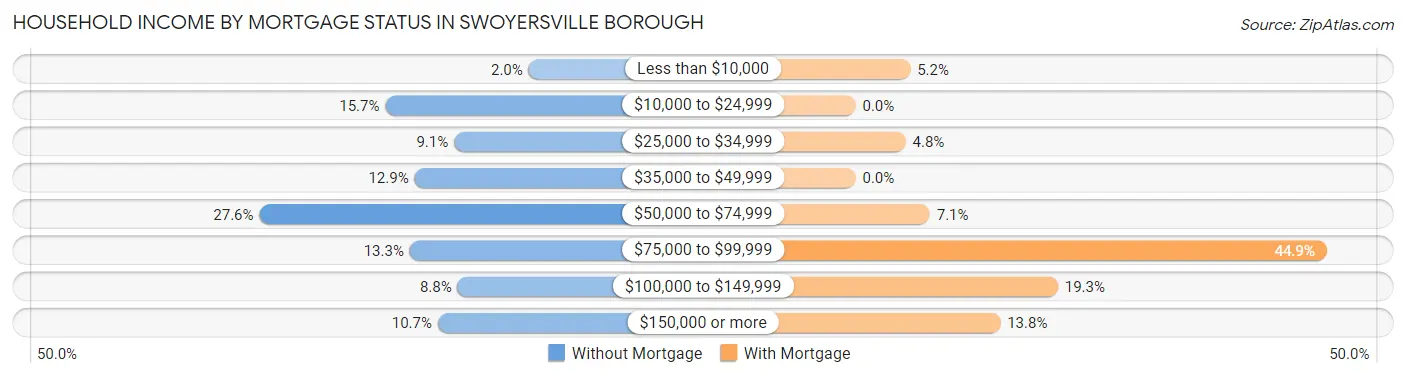
| Household Income | Without Mortgage | With Mortgage |
| Less than $10,000 | 18 (2.0%) | 59 (5.2%) |
| $10,000 to $24,999 | 141 (15.7%) | 0 (0.0%) |
| $25,000 to $34,999 | 82 (9.1%) | 54 (4.8%) |
| $35,000 to $49,999 | 116 (12.9%) | 0 (0.0%) |
| $50,000 to $74,999 | 249 (27.6%) | 80 (7.1%) |
| $75,000 to $99,999 | 120 (13.3%) | 508 (44.9%) |
| $100,000 to $149,999 | 79 (8.8%) | 218 (19.3%) |
| $150,000 or more | 96 (10.6%) | 156 (13.8%) |
| Total | 901 (100.0%) | 1,132 (100.0%) |
Property Value to Household Income Ratio in Swoyersville borough
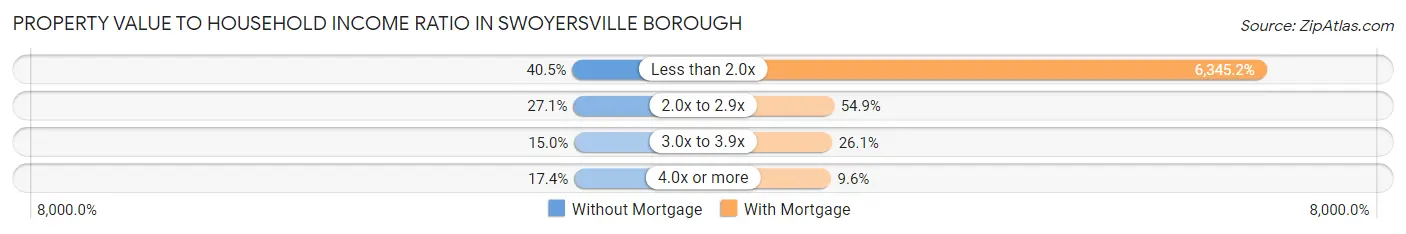
| Value-to-Income Ratio | Without Mortgage | With Mortgage |
| Less than 2.0x | 365 (40.5%) | 71,828 (6,345.2%) |
| 2.0x to 2.9x | 244 (27.1%) | 621 (54.9%) |
| 3.0x to 3.9x | 135 (15.0%) | 295 (26.1%) |
| 4.0x or more | 157 (17.4%) | 109 (9.6%) |
| Total | 901 (100.0%) | 1,132 (100.0%) |
Real Estate Taxes by Mortgage Status in Swoyersville borough
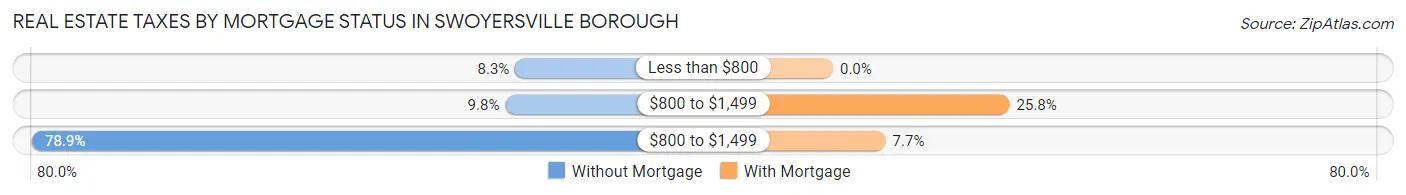
| Property Taxes | Without Mortgage | With Mortgage |
| Less than $800 | 75 (8.3%) | 0 (0.0%) |
| $800 to $1,499 | 88 (9.8%) | 292 (25.8%) |
| $800 to $1,499 | 711 (78.9%) | 87 (7.7%) |
| Total | 901 (100.0%) | 1,132 (100.0%) |
Health & Disability in Swoyersville borough
Health Insurance Coverage by Age in Swoyersville borough
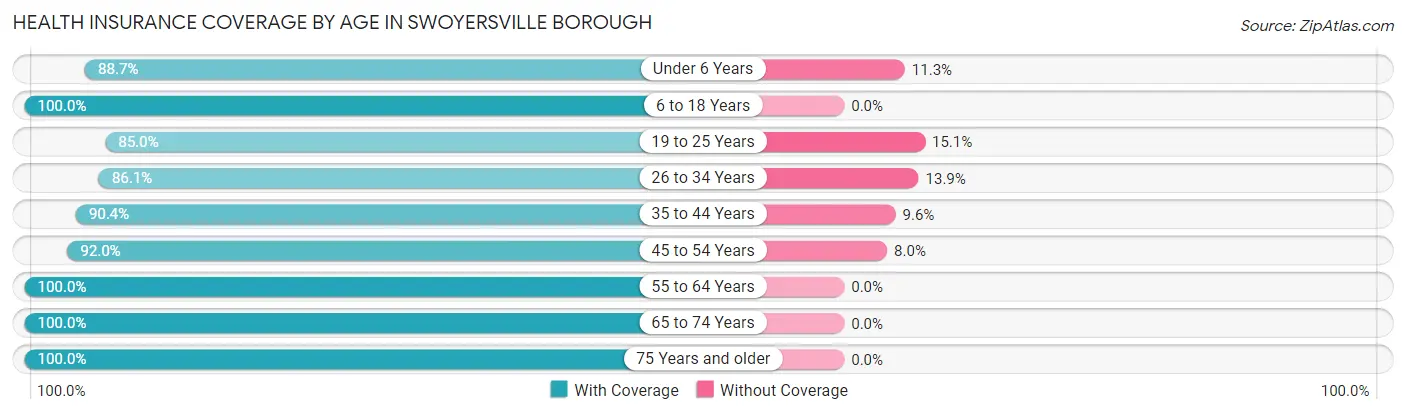
| Age Bracket | With Coverage | Without Coverage |
| Under 6 Years | 157 (88.7%) | 20 (11.3%) |
| 6 to 18 Years | 413 (100.0%) | 0 (0.0%) |
| 19 to 25 Years | 333 (85.0%) | 59 (15.0%) |
| 26 to 34 Years | 460 (86.1%) | 74 (13.9%) |
| 35 to 44 Years | 529 (90.4%) | 56 (9.6%) |
| 45 to 54 Years | 530 (92.0%) | 46 (8.0%) |
| 55 to 64 Years | 817 (100.0%) | 0 (0.0%) |
| 65 to 74 Years | 891 (100.0%) | 0 (0.0%) |
| 75 Years and older | 636 (100.0%) | 0 (0.0%) |
| Total | 4,766 (94.9%) | 255 (5.1%) |
Health Insurance Coverage by Citizenship Status in Swoyersville borough
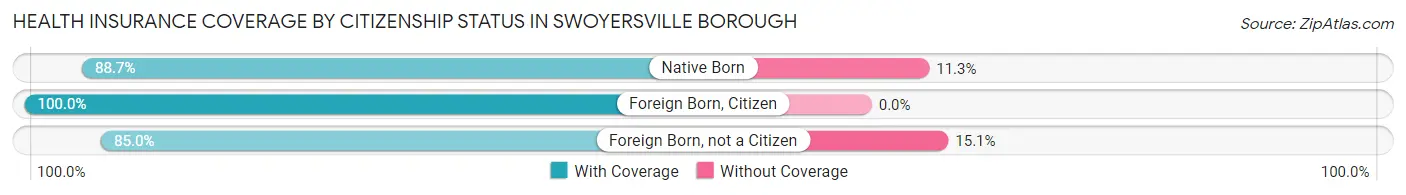
| Citizenship Status | With Coverage | Without Coverage |
| Native Born | 157 (88.7%) | 20 (11.3%) |
| Foreign Born, Citizen | 413 (100.0%) | 0 (0.0%) |
| Foreign Born, not a Citizen | 333 (85.0%) | 59 (15.0%) |
Health Insurance Coverage by Household Income in Swoyersville borough
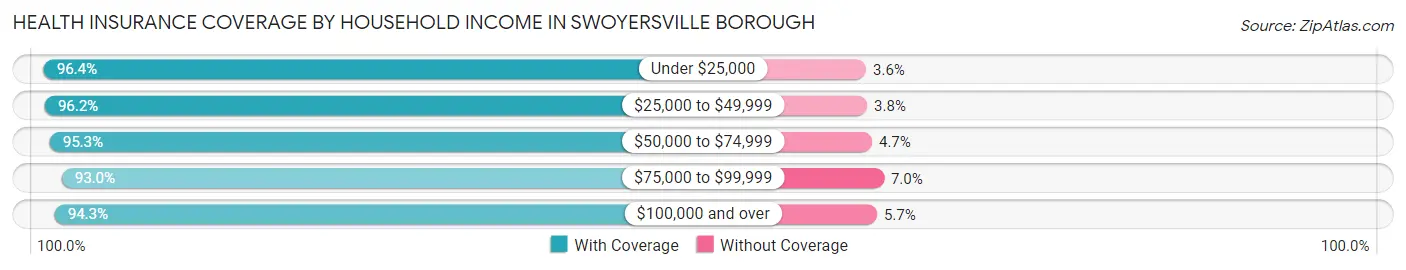
| Household Income | With Coverage | Without Coverage |
| Under $25,000 | 401 (96.4%) | 15 (3.6%) |
| $25,000 to $49,999 | 830 (96.2%) | 33 (3.8%) |
| $50,000 to $74,999 | 1,572 (95.3%) | 78 (4.7%) |
| $75,000 to $99,999 | 787 (93.0%) | 59 (7.0%) |
| $100,000 and over | 1,166 (94.3%) | 70 (5.7%) |
Public vs Private Health Insurance Coverage by Age in Swoyersville borough
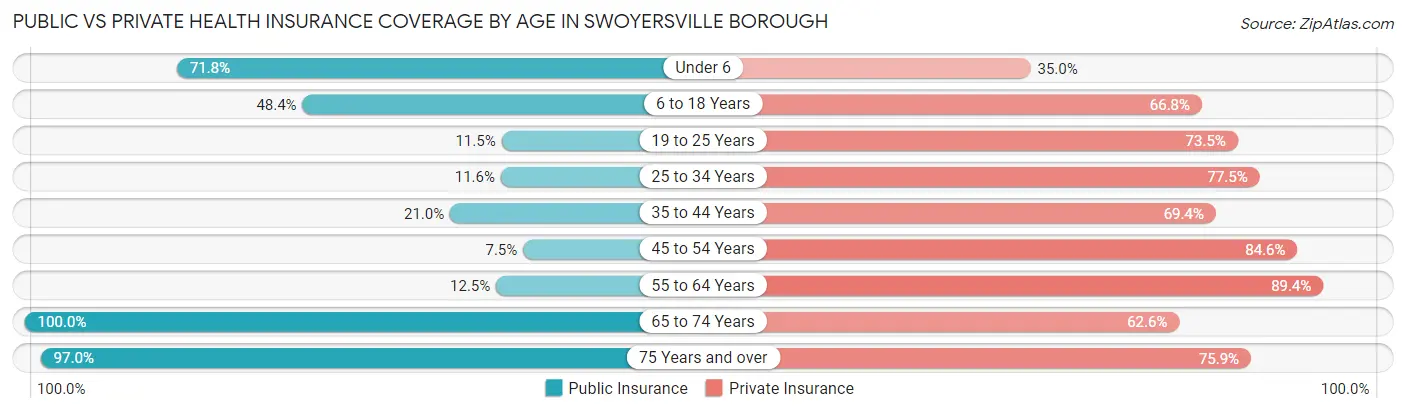
| Age Bracket | Public Insurance | Private Insurance |
| Under 6 | 127 (71.8%) | 62 (35.0%) |
| 6 to 18 Years | 200 (48.4%) | 276 (66.8%) |
| 19 to 25 Years | 45 (11.5%) | 288 (73.5%) |
| 25 to 34 Years | 62 (11.6%) | 414 (77.5%) |
| 35 to 44 Years | 123 (21.0%) | 406 (69.4%) |
| 45 to 54 Years | 43 (7.5%) | 487 (84.6%) |
| 55 to 64 Years | 102 (12.5%) | 730 (89.3%) |
| 65 to 74 Years | 891 (100.0%) | 558 (62.6%) |
| 75 Years and over | 617 (97.0%) | 483 (75.9%) |
| Total | 2,210 (44.0%) | 3,704 (73.8%) |
Disability Status by Sex by Age in Swoyersville borough
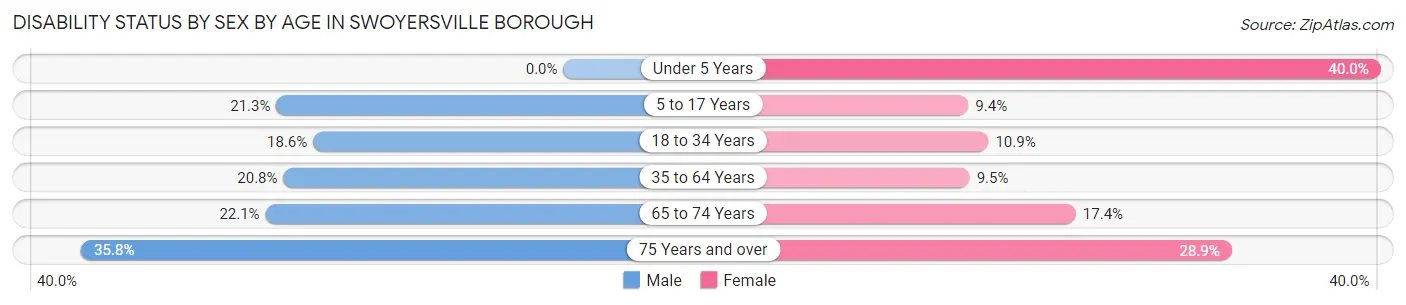
| Age Bracket | Male | Female |
| Under 5 Years | 0 (0.0%) | 22 (40.0%) |
| 5 to 17 Years | 52 (21.3%) | 11 (9.4%) |
| 18 to 34 Years | 81 (18.6%) | 59 (10.9%) |
| 35 to 64 Years | 201 (20.8%) | 96 (9.5%) |
| 65 to 74 Years | 94 (22.1%) | 81 (17.4%) |
| 75 Years and over | 130 (35.8%) | 79 (28.9%) |
Disability Class by Sex by Age in Swoyersville borough
Disability Class: Hearing Difficulty
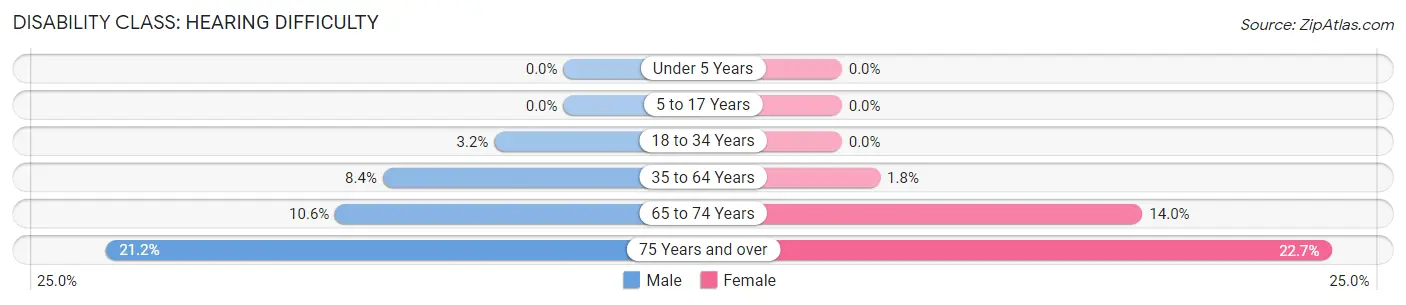
| Age Bracket | Male | Female |
| Under 5 Years | 0 (0.0%) | 0 (0.0%) |
| 5 to 17 Years | 0 (0.0%) | 0 (0.0%) |
| 18 to 34 Years | 14 (3.2%) | 0 (0.0%) |
| 35 to 64 Years | 81 (8.4%) | 18 (1.8%) |
| 65 to 74 Years | 45 (10.6%) | 65 (14.0%) |
| 75 Years and over | 77 (21.2%) | 62 (22.7%) |
Disability Class: Vision Difficulty
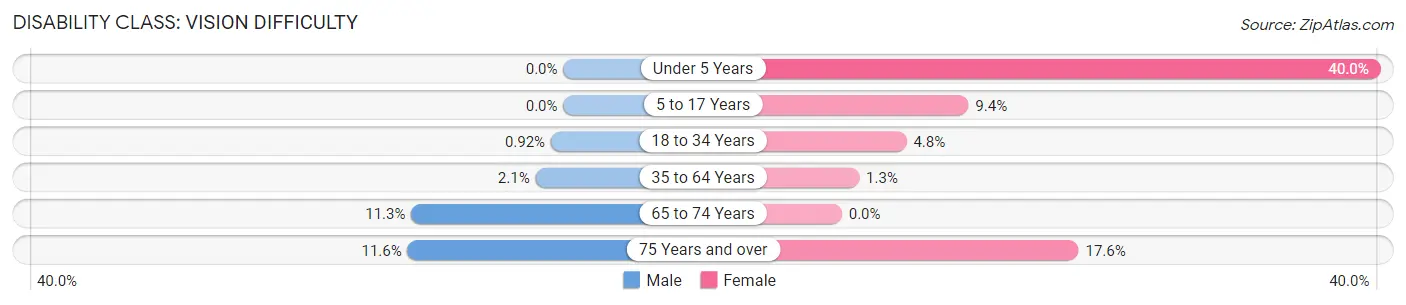
| Age Bracket | Male | Female |
| Under 5 Years | 0 (0.0%) | 22 (40.0%) |
| 5 to 17 Years | 0 (0.0%) | 11 (9.4%) |
| 18 to 34 Years | 4 (0.9%) | 26 (4.8%) |
| 35 to 64 Years | 20 (2.1%) | 13 (1.3%) |
| 65 to 74 Years | 48 (11.3%) | 0 (0.0%) |
| 75 Years and over | 42 (11.6%) | 48 (17.6%) |
Disability Class: Cognitive Difficulty
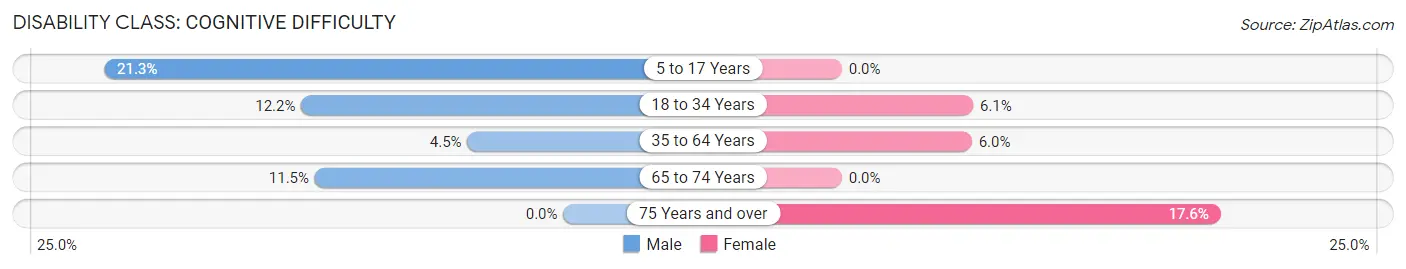
| Age Bracket | Male | Female |
| 5 to 17 Years | 52 (21.3%) | 0 (0.0%) |
| 18 to 34 Years | 53 (12.2%) | 33 (6.1%) |
| 35 to 64 Years | 43 (4.4%) | 61 (6.0%) |
| 65 to 74 Years | 49 (11.5%) | 0 (0.0%) |
| 75 Years and over | 0 (0.0%) | 48 (17.6%) |
Disability Class: Ambulatory Difficulty
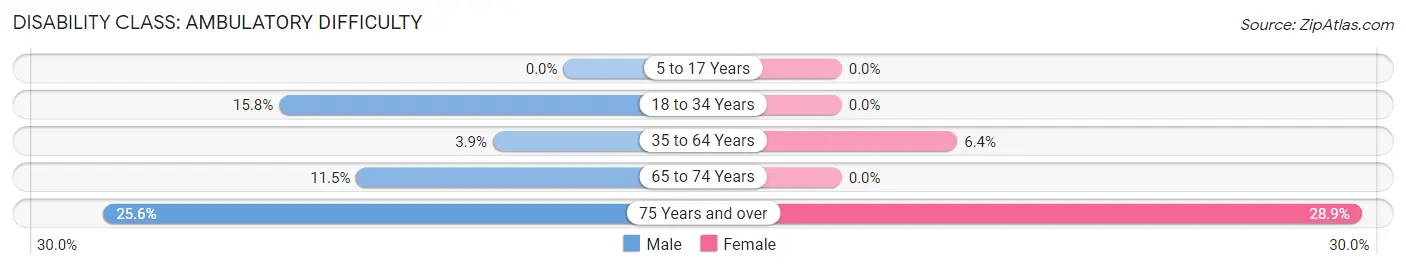
| Age Bracket | Male | Female |
| 5 to 17 Years | 0 (0.0%) | 0 (0.0%) |
| 18 to 34 Years | 69 (15.8%) | 0 (0.0%) |
| 35 to 64 Years | 38 (3.9%) | 65 (6.4%) |
| 65 to 74 Years | 49 (11.5%) | 0 (0.0%) |
| 75 Years and over | 93 (25.6%) | 79 (28.9%) |
Disability Class: Self-Care Difficulty
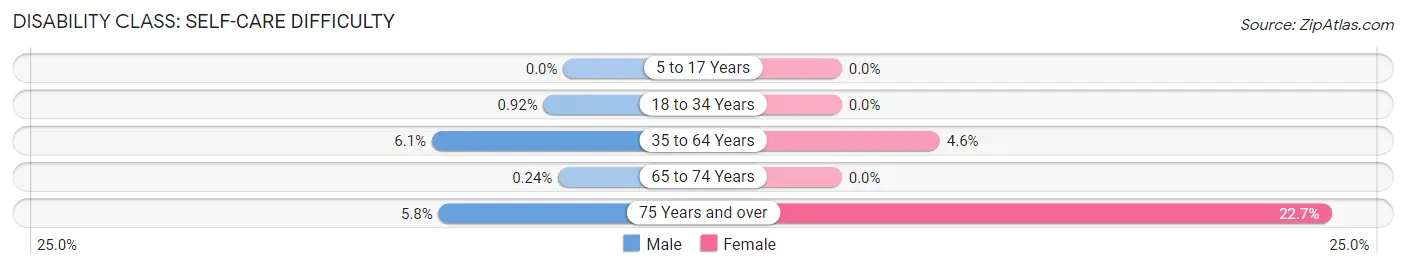
| Age Bracket | Male | Female |
| 5 to 17 Years | 0 (0.0%) | 0 (0.0%) |
| 18 to 34 Years | 4 (0.9%) | 0 (0.0%) |
| 35 to 64 Years | 59 (6.1%) | 46 (4.5%) |
| 65 to 74 Years | 1 (0.2%) | 0 (0.0%) |
| 75 Years and over | 21 (5.8%) | 62 (22.7%) |
Technology Access in Swoyersville borough
Computing Device Access in Swoyersville borough
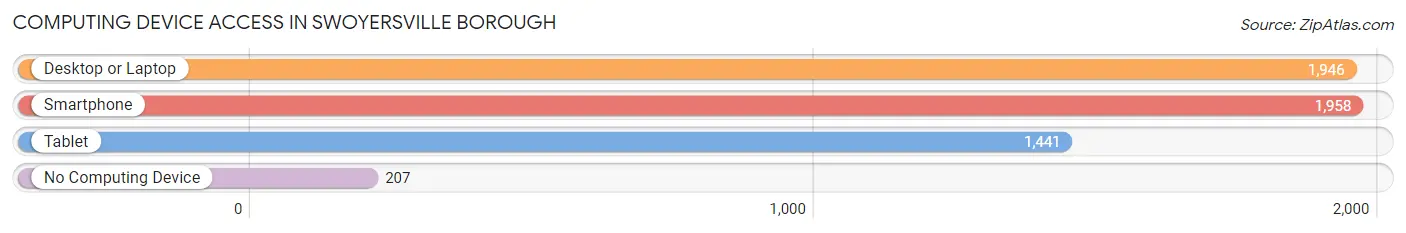
| Device Type | # Households | % Households |
| Desktop or Laptop | 1,946 | 77.6% |
| Smartphone | 1,958 | 78.1% |
| Tablet | 1,441 | 57.5% |
| No Computing Device | 207 | 8.3% |
| Total | 2,508 | 100.0% |
Internet Access in Swoyersville borough
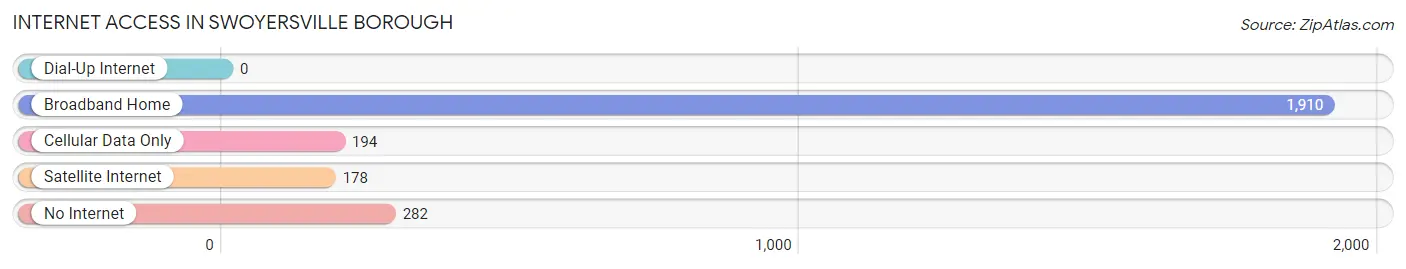
| Internet Type | # Households | % Households |
| Dial-Up Internet | 0 | 0.0% |
| Broadband Home | 1,910 | 76.2% |
| Cellular Data Only | 194 | 7.7% |
| Satellite Internet | 178 | 7.1% |
| No Internet | 282 | 11.2% |
| Total | 2,508 | 100.0% |
Swoyersville borough Summary
Swoyersville Borough is a small borough located in Luzerne County, Pennsylvania. It is situated in the Wyoming Valley, a region of the Northeastern United States. The borough is located approximately 8 miles south of Wilkes-Barre, the county seat. The population of Swoyersville Borough was 2,845 at the 2010 census.
History
Swoyersville Borough was founded in 1872 by John Swoyer, a local landowner. The borough was named after him. Swoyer was a prominent figure in the area and was involved in the development of the local coal industry. He also served as a member of the Luzerne County Board of Commissioners.
The borough was incorporated in 1873 and was the first borough in Luzerne County to be incorporated. The first mayor of Swoyersville was John Swoyer.
The borough was a center of the coal industry in the late 19th and early 20th centuries. The coal industry provided employment for many of the borough's residents. The coal industry declined in the mid-20th century, leading to a decrease in population and economic activity.
Geography
Swoyersville Borough is located at 41°14'N 75°51'W (41.2333, -75.85). It is situated in the Wyoming Valley, a region of the Northeastern United States. The borough is located approximately 8 miles south of Wilkes-Barre, the county seat.
The borough has a total area of 0.9 square miles, all of which is land. The borough is bordered by Kingston Township to the north, West Wyoming Borough to the east, and Exeter Township to the south and west.
Economy
The economy of Swoyersville Borough is largely based on manufacturing and retail. The borough is home to several manufacturing companies, including a plastics manufacturer, a metal fabricator, and a printing company. The borough also has several retail stores, including a grocery store, a hardware store, and a pharmacy.
The borough is also home to several restaurants, including a pizza shop, a Chinese restaurant, and a diner.
Demographics
As of the 2010 census, the population of Swoyersville Borough was 2,845. The racial makeup of the borough was 97.3% White, 0.7% African American, 0.2% Native American, 0.4% Asian, 0.1% Pacific Islander, 0.3% from other races, and 1.0% from two or more races. Hispanic or Latino of any race were 1.3% of the population.
The median household income in Swoyersville Borough was $37,917, and the median family income was $45,938. The per capita income for the borough was $18,945. About 11.2% of families and 13.2% of the population were below the poverty line, including 17.2% of those under age 18 and 8.2% of those age 65 or over.
Common Questions
What is Per Capita Income in Swoyersville borough?
Per Capita income in Swoyersville borough is $37,772.
What is the Median Family Income in Swoyersville borough?
Median Family Income in Swoyersville borough is $76,000.
What is the Median Household income in Swoyersville borough?
Median Household Income in Swoyersville borough is $64,397.
What is Income or Wage Gap in Swoyersville borough?
Income or Wage Gap in Swoyersville borough is 27.0%.
Women in Swoyersville borough earn 73.0 cents for every dollar earned by a man.
What is Inequality or Gini Index in Swoyersville borough?
Inequality or Gini Index in Swoyersville borough is 0.35.
What is the Total Population of Swoyersville borough?
Total Population of Swoyersville borough is 5,021.
What is the Total Male Population of Swoyersville borough?
Total Male Population of Swoyersville borough is 2,557.
What is the Total Female Population of Swoyersville borough?
Total Female Population of Swoyersville borough is 2,464.
What is the Ratio of Males per 100 Females in Swoyersville borough?
There are 103.77 Males per 100 Females in Swoyersville borough.
What is the Ratio of Females per 100 Males in Swoyersville borough?
There are 96.36 Females per 100 Males in Swoyersville borough.
What is the Median Population Age in Swoyersville borough?
Median Population Age in Swoyersville borough is 53.1 Years.
What is the Average Family Size in Swoyersville borough
Average Family Size in Swoyersville borough is 2.6 People.
What is the Average Household Size in Swoyersville borough
Average Household Size in Swoyersville borough is 2.0 People.
How Large is the Labor Force in Swoyersville borough?
There are 2,722 People in the Labor Forcein in Swoyersville borough.
What is the Percentage of People in the Labor Force in Swoyersville borough?
60.4% of People are in the Labor Force in Swoyersville borough.
What is the Unemployment Rate in Swoyersville borough?
Unemployment Rate in Swoyersville borough is 3.6%.