Zip Codes with the Highest Percentage of Population with a Degree in Social Sciences in Cincinnati, OH
RELATED REPORTS & OPTIONS
Social Sciences
Cincinnati
Compare Zip Codes
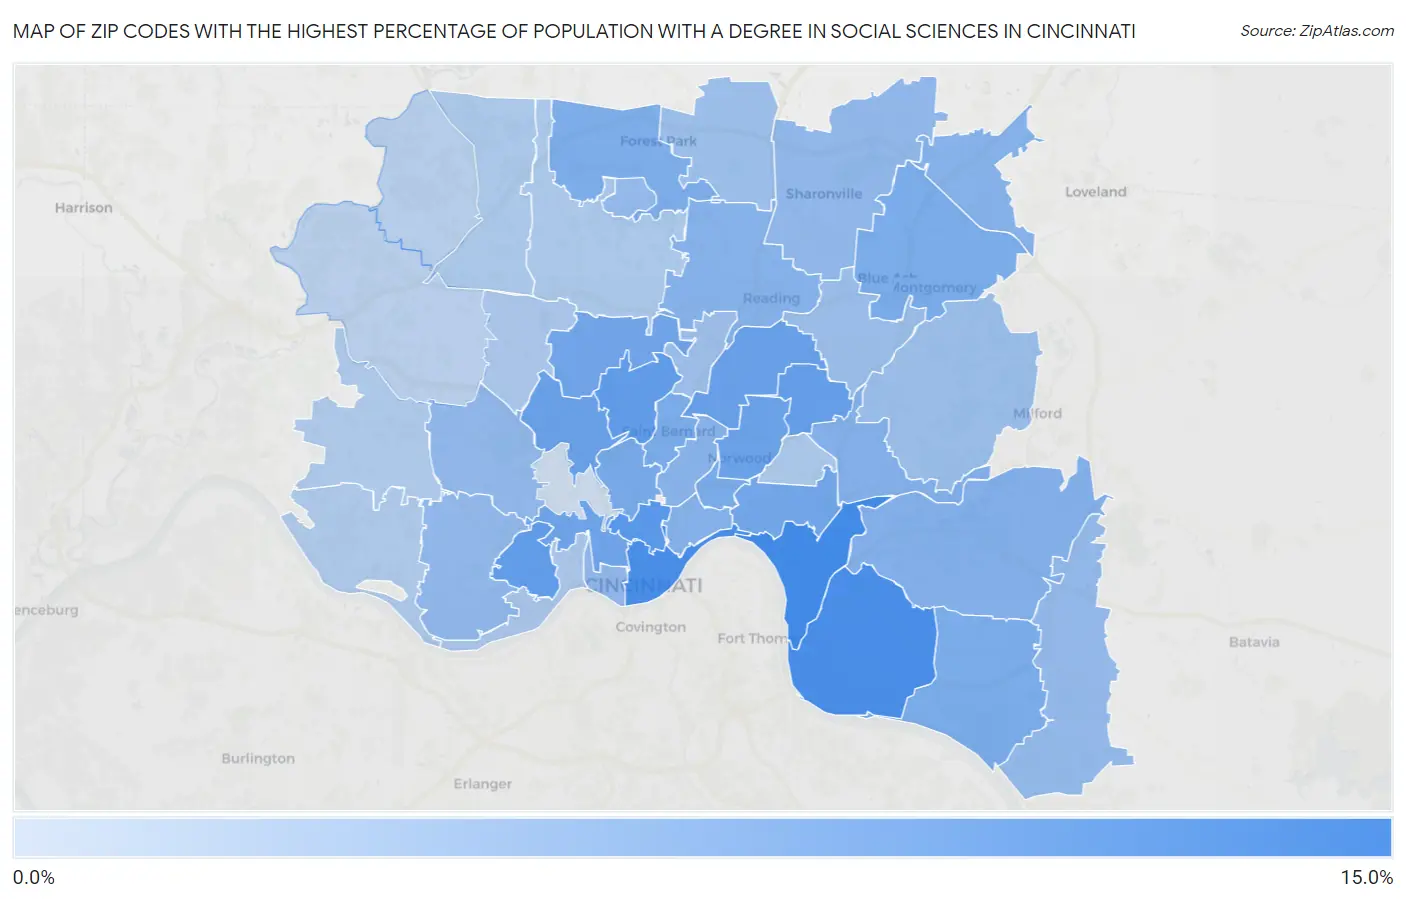
Map of Zip Codes with the Highest Percentage of Population with a Degree in Social Sciences in Cincinnati
1.2%
12.2%
Zip Codes with the Highest Percentage of Population with a Degree in Social Sciences in Cincinnati, OH
| Zip Code | % Graduates | vs State | vs National | |
| 1. | 45226 | 12.2% | 6.0%(+6.18)#65 | 8.1%(+4.11)#3,367 |
| 2. | 45202 | 11.7% | 6.0%(+5.65)#70 | 8.1%(+3.58)#3,774 |
| 3. | 45230 | 11.6% | 6.0%(+5.59)#72 | 8.1%(+3.52)#3,841 |
| 4. | 45219 | 10.2% | 6.0%(+4.19)#102 | 8.1%(+2.12)#5,320 |
| 5. | 45205 | 9.6% | 6.0%(+3.62)#113 | 8.1%(+1.55)#6,035 |
| 6. | 45232 | 9.5% | 6.0%(+3.49)#122 | 8.1%(+1.42)#6,218 |
| 7. | 45213 | 9.1% | 6.0%(+3.14)#130 | 8.1%(+1.06)#6,730 |
| 8. | 45237 | 9.1% | 6.0%(+3.08)#133 | 8.1%(+1.01)#6,838 |
| 9. | 45223 | 8.9% | 6.0%(+2.92)#137 | 8.1%(+0.843)#7,092 |
| 10. | 45212 | 8.7% | 6.0%(+2.69)#145 | 8.1%(+0.616)#7,458 |
| 11. | 45214 | 8.5% | 6.0%(+2.52)#152 | 8.1%(+0.451)#7,758 |
| 12. | 45224 | 8.4% | 6.0%(+2.36)#158 | 8.1%(+0.289)#8,068 |
| 13. | 45208 | 8.2% | 6.0%(+2.15)#169 | 8.1%(+0.083)#8,453 |
| 14. | 45220 | 7.6% | 6.0%(+1.65)#193 | 8.1%(-0.426)#9,473 |
| 15. | 45242 | 7.5% | 6.0%(+1.51)#202 | 8.1%(-0.565)#9,752 |
| 16. | 45207 | 7.5% | 6.0%(+1.48)#207 | 8.1%(-0.590)#9,812 |
| 17. | 45255 | 7.5% | 6.0%(+1.47)#208 | 8.1%(-0.604)#9,848 |
| 18. | 45217 | 7.4% | 6.0%(+1.42)#214 | 8.1%(-0.647)#9,951 |
| 19. | 45240 | 7.4% | 6.0%(+1.40)#215 | 8.1%(-0.670)#9,996 |
| 20. | 45227 | 6.9% | 6.0%(+0.873)#258 | 8.1%(-1.20)#11,228 |
| 21. | 45244 | 6.8% | 6.0%(+0.789)#265 | 8.1%(-1.28)#11,413 |
| 22. | 45215 | 6.6% | 6.0%(+0.638)#280 | 8.1%(-1.43)#11,765 |
| 23. | 45249 | 6.6% | 6.0%(+0.579)#284 | 8.1%(-1.49)#11,917 |
| 24. | 45206 | 6.6% | 6.0%(+0.566)#288 | 8.1%(-1.51)#11,955 |
| 25. | 45229 | 6.4% | 6.0%(+0.410)#301 | 8.1%(-1.66)#12,350 |
| 26. | 45203 | 6.0% | 6.0%(-0.015)#324 | 8.1%(-2.09)#13,385 |
| 27. | 45238 | 5.9% | 6.0%(-0.070)#331 | 8.1%(-2.14)#13,517 |
| 28. | 45211 | 5.9% | 6.0%(-0.144)#339 | 8.1%(-2.22)#13,702 |
| 29. | 45241 | 5.8% | 6.0%(-0.249)#344 | 8.1%(-2.32)#13,937 |
| 30. | 45245 | 5.5% | 6.0%(-0.483)#369 | 8.1%(-2.55)#14,534 |
| 31. | 45218 | 5.4% | 6.0%(-0.594)#379 | 8.1%(-2.67)#14,801 |
| 32. | 45246 | 5.0% | 6.0%(-0.962)#416 | 8.1%(-3.03)#15,738 |
| 33. | 45236 | 4.9% | 6.0%(-1.09)#431 | 8.1%(-3.16)#16,036 |
| 34. | 45243 | 4.9% | 6.0%(-1.10)#434 | 8.1%(-3.17)#16,059 |
| 35. | 45216 | 4.8% | 6.0%(-1.19)#442 | 8.1%(-3.26)#16,258 |
| 36. | 45204 | 3.9% | 6.0%(-2.15)#549 | 8.1%(-4.22)#18,542 |
| 37. | 45239 | 3.7% | 6.0%(-2.26)#564 | 8.1%(-4.33)#18,794 |
| 38. | 45209 | 3.7% | 6.0%(-2.28)#566 | 8.1%(-4.35)#18,842 |
| 39. | 45231 | 3.7% | 6.0%(-2.31)#567 | 8.1%(-4.38)#18,931 |
| 40. | 45251 | 3.6% | 6.0%(-2.39)#573 | 8.1%(-4.46)#19,107 |
| 41. | 45248 | 3.5% | 6.0%(-2.51)#589 | 8.1%(-4.58)#19,363 |
| 42. | 45233 | 3.5% | 6.0%(-2.52)#590 | 8.1%(-4.59)#19,383 |
| 43. | 45252 | 2.8% | 6.0%(-3.21)#661 | 8.1%(-5.28)#20,743 |
| 44. | 45247 | 2.7% | 6.0%(-3.29)#667 | 8.1%(-5.36)#20,893 |
| 45. | 45225 | 1.2% | 6.0%(-4.77)#803 | 8.1%(-6.84)#23,305 |
1
Common Questions
What are the Top 10 Zip Codes with the Highest Percentage of Population with a Degree in Social Sciences in Cincinnati, OH?
Top 10 Zip Codes with the Highest Percentage of Population with a Degree in Social Sciences in Cincinnati, OH are:
What zip code has the Highest Percentage of Population with a Degree in Social Sciences in Cincinnati, OH?
45226 has the Highest Percentage of Population with a Degree in Social Sciences in Cincinnati, OH with 12.2%.
What is the Percentage of Population with a Degree in Social Sciences in Cincinnati, OH?
Percentage of Population with a Degree in Social Sciences in Cincinnati is 8.2%.
What is the Percentage of Population with a Degree in Social Sciences in Ohio?
Percentage of Population with a Degree in Social Sciences in Ohio is 6.0%.
What is the Percentage of Population with a Degree in Social Sciences in the United States?
Percentage of Population with a Degree in Social Sciences in the United States is 8.1%.