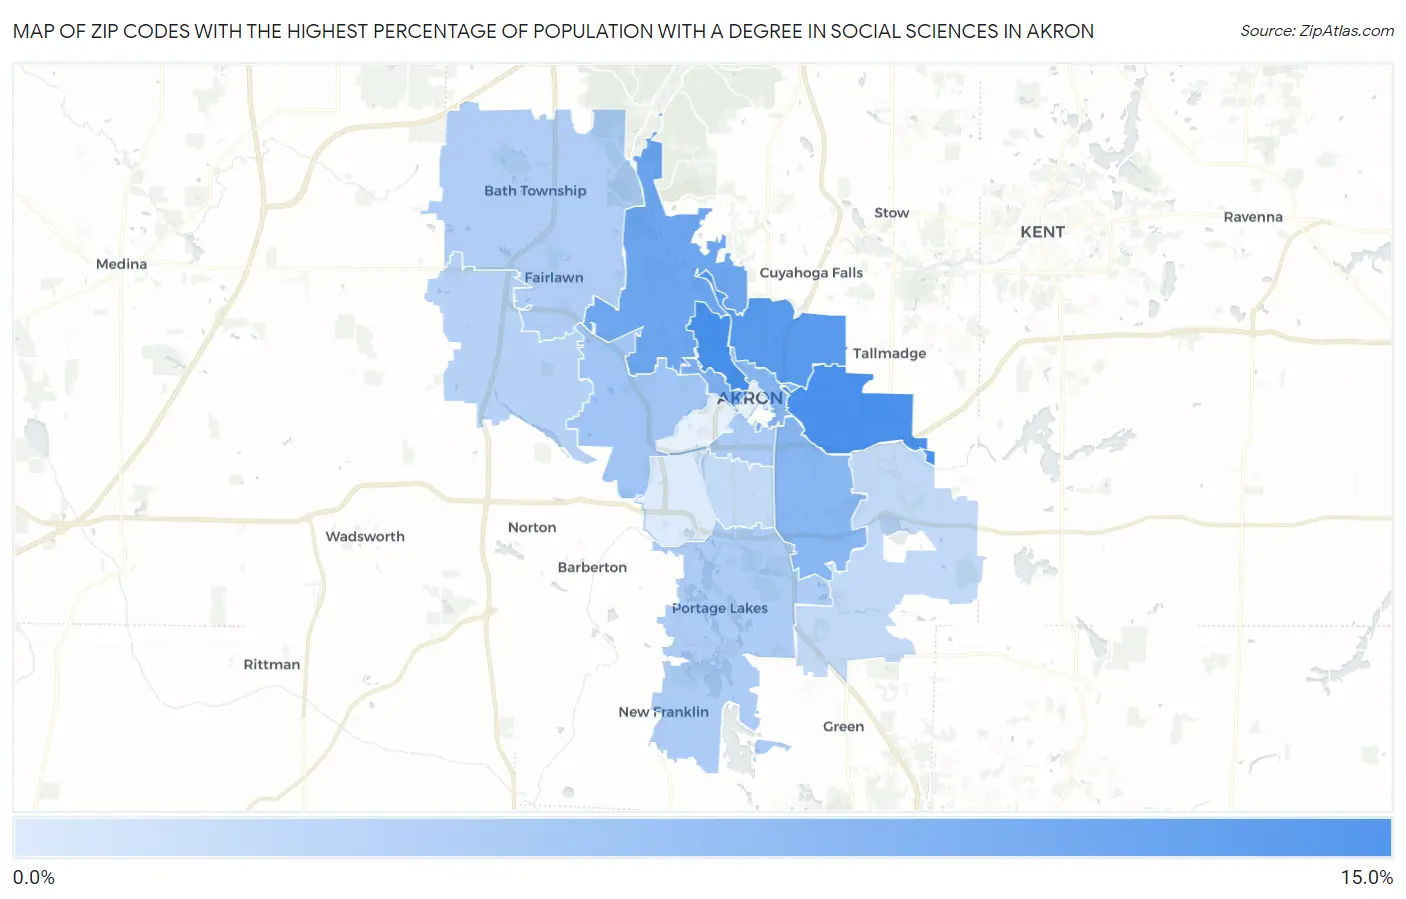
Zip Codes with the Highest Percentage of Population with a Degree in Social Sciences in Akron, OH
RELATED REPORTS & OPTIONS
Social Sciences
Akron
Compare Zip Codes
Map of Zip Codes with the Highest Percentage of Population with a Degree in Social Sciences in Akron
2.4%
11.6%
Zip Codes with the Highest Percentage of Population with a Degree in Social Sciences in Akron, OH
| Zip Code | % Graduates | vs State | vs National | |
| 1. | 44303 | 11.6% | 6.0%(+5.64)#71 | 8.1%(+3.57)#3,784 |
| 2. | 44305 | 11.5% | 6.0%(+5.53)#75 | 8.1%(+3.46)#3,900 |
| 3. | 44310 | 10.7% | 6.0%(+4.67)#90 | 8.1%(+2.60)#4,735 |
| 4. | 44313 | 9.2% | 6.0%(+3.16)#129 | 8.1%(+1.09)#6,687 |
| 5. | 44302 | 8.1% | 6.0%(+2.13)#170 | 8.1%(+0.059)#8,492 |
| 6. | 44304 | 7.6% | 6.0%(+1.56)#198 | 8.1%(-0.507)#9,636 |
| 7. | 44306 | 7.5% | 6.0%(+1.51)#201 | 8.1%(-0.558)#9,738 |
| 8. | 44320 | 6.0% | 6.0%(+0.025)#317 | 8.1%(-2.05)#13,269 |
| 9. | 44311 | 5.5% | 6.0%(-0.520)#373 | 8.1%(-2.59)#14,611 |
| 10. | 44319 | 5.3% | 6.0%(-0.701)#389 | 8.1%(-2.77)#15,083 |
| 11. | 44333 | 5.2% | 6.0%(-0.821)#400 | 8.1%(-2.89)#15,391 |
| 12. | 44321 | 4.7% | 6.0%(-1.31)#456 | 8.1%(-3.38)#16,548 |
| 13. | 44312 | 4.0% | 6.0%(-1.96)#530 | 8.1%(-4.03)#18,104 |
| 14. | 44301 | 3.9% | 6.0%(-2.12)#546 | 8.1%(-4.19)#18,483 |
| 15. | 44314 | 2.4% | 6.0%(-3.58)#700 | 8.1%(-5.66)#21,452 |
1
Common Questions
What are the Top 10 Zip Codes with the Highest Percentage of Population with a Degree in Social Sciences in Akron, OH?
Top 10 Zip Codes with the Highest Percentage of Population with a Degree in Social Sciences in Akron, OH are:
What zip code has the Highest Percentage of Population with a Degree in Social Sciences in Akron, OH?
44303 has the Highest Percentage of Population with a Degree in Social Sciences in Akron, OH with 11.6%.
What is the Percentage of Population with a Degree in Social Sciences in Akron, OH?
Percentage of Population with a Degree in Social Sciences in Akron is 8.0%.
What is the Percentage of Population with a Degree in Social Sciences in Ohio?
Percentage of Population with a Degree in Social Sciences in Ohio is 6.0%.
What is the Percentage of Population with a Degree in Social Sciences in the United States?
Percentage of Population with a Degree in Social Sciences in the United States is 8.1%.