Zip Codes with the Highest Percentage of Local Government Employees in Warren, OH
RELATED REPORTS & OPTIONS
Local Government Employees
Warren
Compare Zip Codes
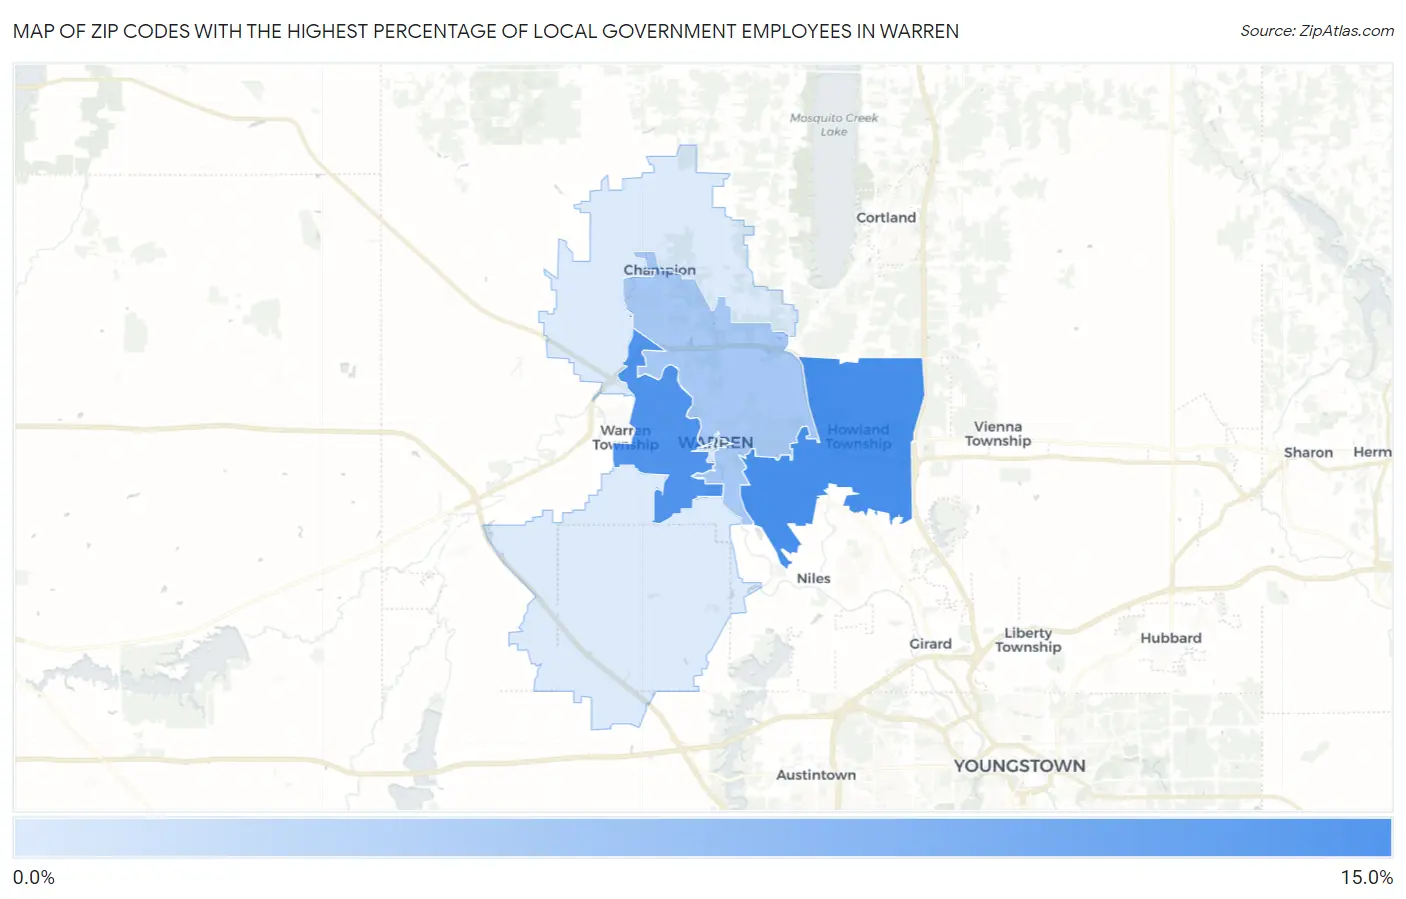
Map of Zip Codes with the Highest Percentage of Local Government Employees in Warren
3.4%
10.8%
Zip Codes with the Highest Percentage of Local Government Employees in Warren, OH
| Zip Code | % Local Government Employees | vs State | vs National | |
| 1. | 44484 | 10.8% | 7.4%(+3.37)#218 | 7.2%(+3.59)#6,874 |
| 2. | 44485 | 10.5% | 7.4%(+3.03)#248 | 7.2%(+3.24)#7,457 |
| 3. | 44483 | 6.0% | 7.4%(-1.45)#776 | 7.2%(-1.24)#19,819 |
| 4. | 44481 | 3.4% | 7.4%(-4.09)#1,031 | 7.2%(-3.88)#26,989 |
1
Common Questions
What are the Top 3 Zip Codes with the Highest Percentage of Local Government Employees in Warren, OH?
Top 3 Zip Codes with the Highest Percentage of Local Government Employees in Warren, OH are:
What zip code has the Highest Percentage of Local Government Employees in Warren, OH?
44484 has the Highest Percentage of Local Government Employees in Warren, OH with 10.8%.
What is the Percentage of Local Government Employees in Warren, OH?
Percentage of Local Government Employees in Warren is 8.8%.
What is the Percentage of Local Government Employees in Ohio?
Percentage of Local Government Employees in Ohio is 7.4%.
What is the Percentage of Local Government Employees in the United States?
Percentage of Local Government Employees in the United States is 7.2%.