Zip Codes with the Highest Percentage of Households with Income Above $100,000 in Youngstown, OH

RELATED REPORTS & OPTIONS

Household Income | $100k+
Population
Families and Households
Female Fertility
Female Fertility (Unmarried)
Race (Community Size)
Race (Percentage)
Ancestry (Community Size)
AfricanAmericanApacheArabArmenianAustrianBarbadianBelgianBhutaneseBlackfeetBrazilianBritishBulgarianBurmeseCanadianCarpatho RusynCelticCentral AmericanCentral American IndianCherokeeColombianCreekCroatianCubanCypriotCzechCzechoslovakianDanishDominicanDutchEastern EuropeanEnglishEuropeanFinnishFrenchFrench CanadianGermanGreekGuatemalanHaitianHonduranHungarianIndian (Asian)IrishIroquoisItalianJamaicanJordanianKoreanLebaneseLithuanianMexicanMoroccanNative HawaiianNew ZealanderNicaraguanNigerianNorthern EuropeanNorwegianPakistaniPalestinianPennsylvania GermanPeruvianPolishPortuguesePuerto RicanRomanianRussianScandinavianScotch-IrishScottishSerbianSiouxSlavicSlovakSloveneSouth AmericanSpaniardSpanishSri LankanSubsaharan AfricanSwedishSwissThaiTrinidadian and TobagonianUkrainianVenezuelanWelshWest Indian
Ancestry (Percentage)
AfricanAmericanApacheArabArmenianAustrianBarbadianBelgianBhutaneseBlackfeetBrazilianBritishBulgarianBurmeseCanadianCarpatho RusynCelticCentral AmericanCentral American IndianCherokeeColombianCreekCroatianCubanCypriotCzechCzechoslovakianDanishDominicanDutchEastern EuropeanEnglishEuropeanFinnishFrenchFrench CanadianGermanGreekGuatemalanHaitianHonduranHungarianIndian (Asian)IrishIroquoisItalianJamaicanJordanianKoreanLebaneseLithuanianMexicanMoroccanNative HawaiianNew ZealanderNicaraguanNigerianNorthern EuropeanNorwegianPakistaniPalestinianPennsylvania GermanPeruvianPolishPortuguesePuerto RicanRomanianRussianScandinavianScotch-IrishScottishSerbianSiouxSlavicSlovakSloveneSouth AmericanSpaniardSpanishSri LankanSubsaharan AfricanSwedishSwissThaiTrinidadian and TobagonianUkrainianVenezuelanWelshWest Indian
Immigrant Origin (Total)
Immigrant Origin (Percentage)
Income
Income (Families)
Income (Households)
Poverty
Poverty (Families)
Unemployment
Employment Occupations
Employment Industries
Employer Class
Commute Time
Commute Means
School Enrollment
Education by Degree Field
Occupancy
Finances
Physical Characteristics
Youngstown
Compare Zip Codes
Comparison Subject

Map of Zip Codes with the Highest Percentage of Households with Income Above $100,000 in Youngstown

1.2%
37.1%
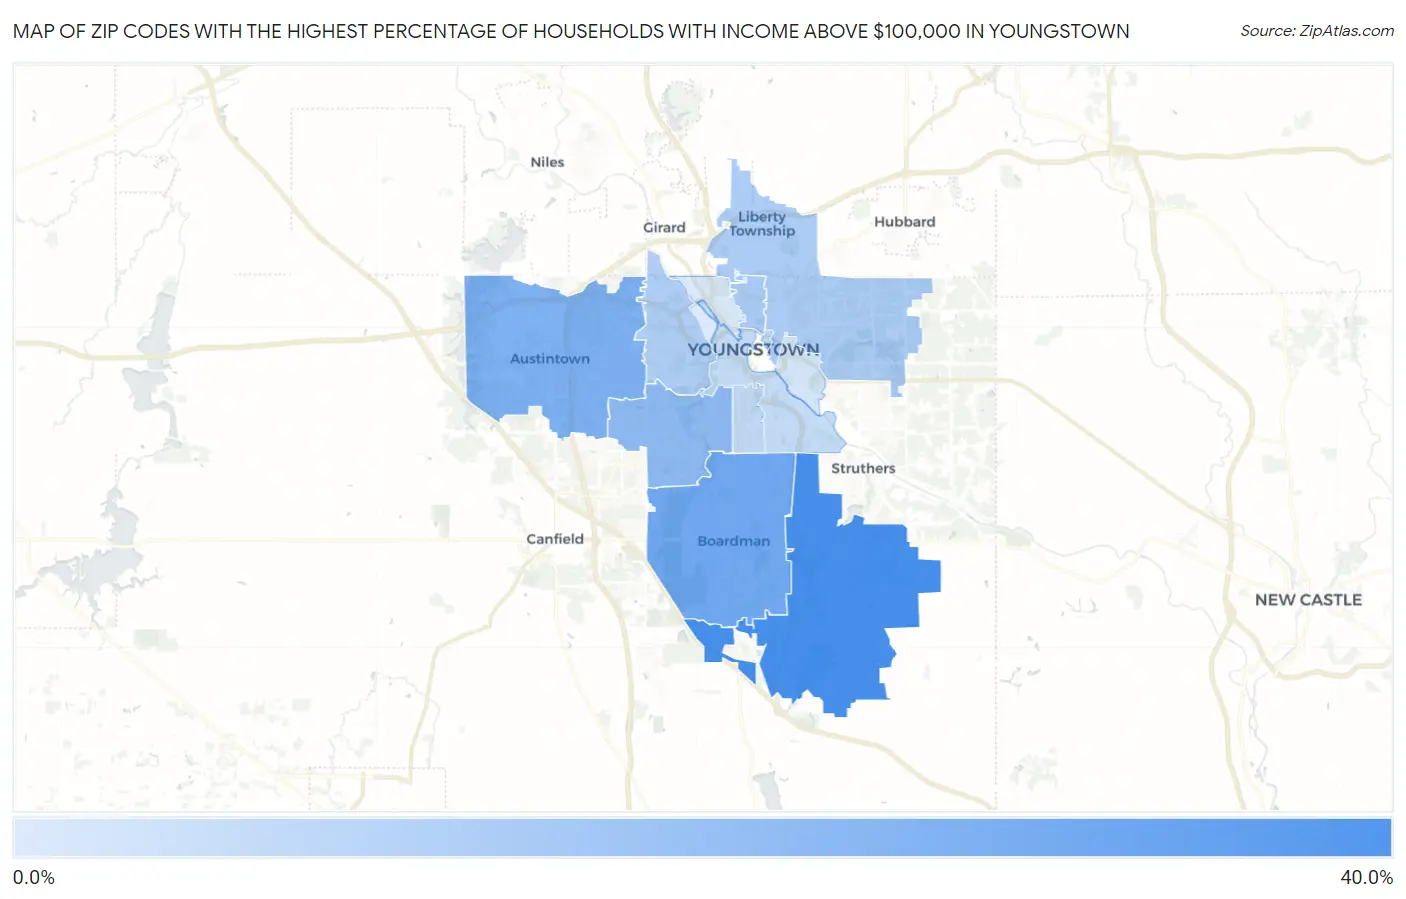
Zip Codes with the Highest Percentage of Households with Income Above $100,000 in Youngstown Map

Zip Codes with the Highest Percentage of Households with Income Above $100,000 in Youngstown, OH

Zip Code Households with Income > $100k vs State vs National
1. 44514 37.1% 31.5% (+5.60)#299 37.3% (-0.200)#10,485
2. 44512 26.1% 31.5% (-5.40)#653 37.3% (-11.2)#18,776
3. 44515 22.4% 31.5% (-9.10)#792 37.3% (-14.9)#22,048
4. 44511 18.7% 31.5% (-12.8)#913 37.3% (-18.6)#25,042
5. 44504 11.9% 31.5% (-19.6)#1,064 37.3% (-25.4)#29,074
6. 44505 11.8% 31.5% (-19.7)#1,066 37.3% (-25.5)#29,106
7. 44509 10.9% 31.5% (-20.6)#1,081 37.3% (-26.4)#29,492
8. 44507 6.9% 31.5% (-24.6)#1,133 37.3% (-30.4)#30,684
9. 44502 5.9% 31.5% (-25.6)#1,135 37.3% (-31.4)#30,872
10. 44506 2.5% 31.5% (-29.0)#1,160 37.3% (-34.8)#31,384
11. 44510 1.2% 31.5% (-30.3)#1,162 37.3% (-36.1)#31,481

Common Questions

What are the Top 10 Zip Codes with the Highest Percentage of Households with Income Above $100,000 in Youngstown, OH?
Top 10 Zip Codes with the Highest Percentage of Households with Income Above $100,000 in Youngstown, OH are:
#1
37.1%
#2
26.1%
#3
22.4%
#4
18.7%
#5
11.9%
#6
11.8%
#7
10.9%
#8
6.9%
#9
5.9%
#10
2.5%
What zip code has the Highest Percentage of Households with Income Above $100,000 in Youngstown, OH?
44514 has the Highest Percentage of Households with Income Above $100,000 in Youngstown, OH with 37.1%.
What is the Percentage of Households with Income Above $100,000 in Youngstown, OH?
Percentage of Households with Income Above $100,000 in Youngstown is 9.1%.
What is the Percentage of Households with Income Above $100,000 in Ohio?
Percentage of Households with Income Above $100,000 in Ohio is 31.5%.
What is the Percentage of Households with Income Above $100,000 in the United States?
Percentage of Households with Income Above $100,000 in the United States is 37.3%.