Zip Codes with the Highest Percentage of Population Employed in Installation, Maintenance & Repair in Westerville, OH
RELATED REPORTS & OPTIONS
Installation, Maintenance & Repair
Westerville
Compare Zip Codes
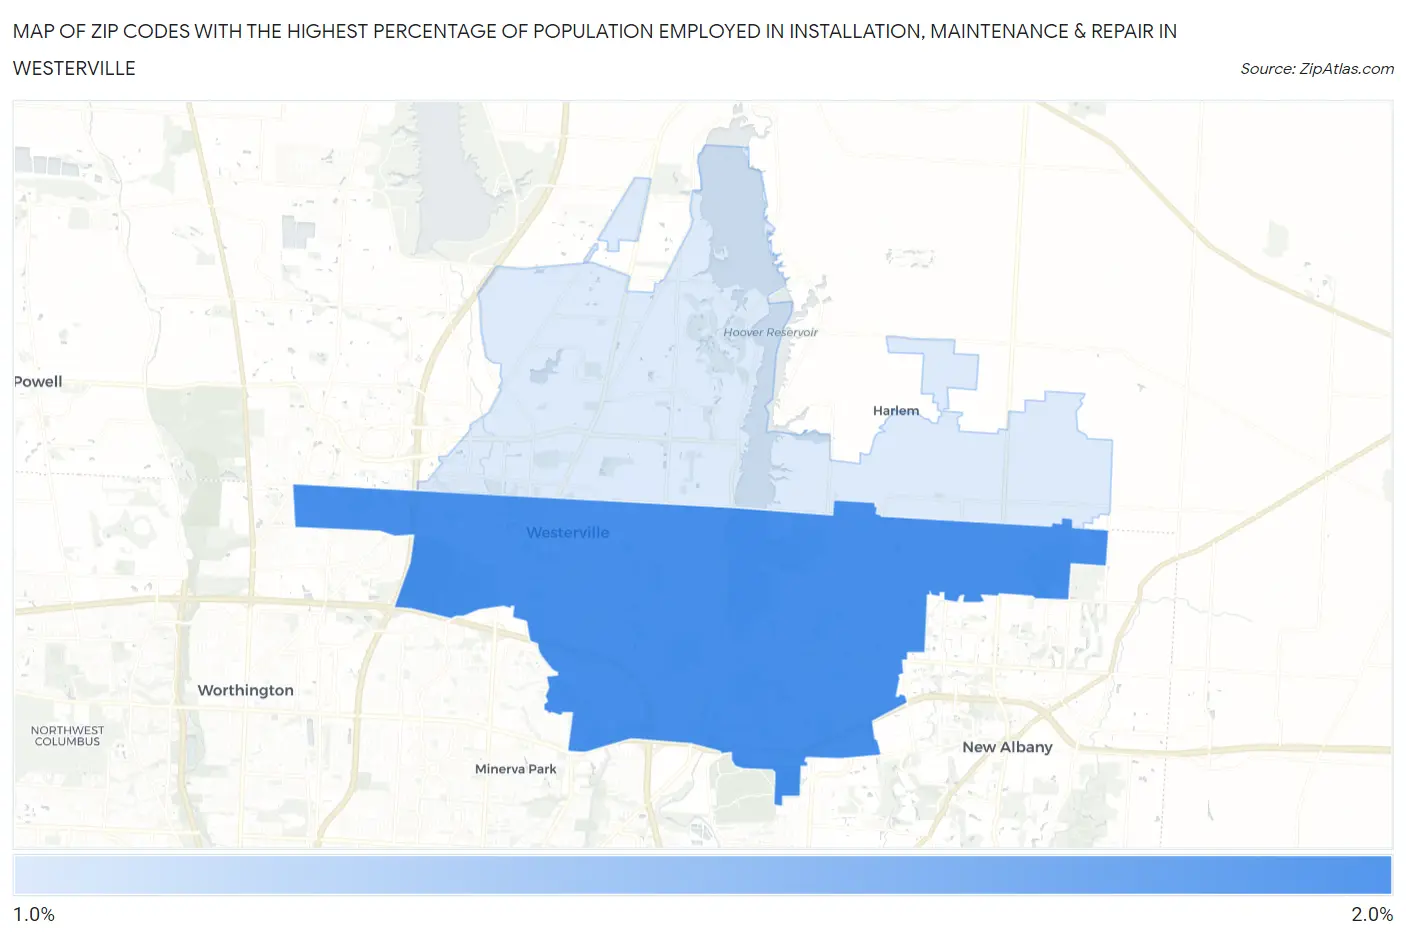
Map of Zip Codes with the Highest Percentage of Population Employed in Installation, Maintenance & Repair in Westerville
1.1%
1.7%
Zip Codes with the Highest Percentage of Population Employed in Installation, Maintenance & Repair in Westerville, OH
| Zip Code | % Employed | vs State | vs National | |
| 1. | 43081 | 1.7% | 3.1%(-1.31)#891 | 3.1%(-1.32)#23,120 |
| 2. | 43082 | 1.1% | 3.1%(-1.99)#997 | 3.1%(-2.00)#25,707 |
1
Common Questions
What are the Top Zip Codes with the Highest Percentage of Population Employed in Installation, Maintenance & Repair in Westerville, OH?
Top Zip Codes with the Highest Percentage of Population Employed in Installation, Maintenance & Repair in Westerville, OH are:
What zip code has the Highest Percentage of Population Employed in Installation, Maintenance & Repair in Westerville, OH?
43081 has the Highest Percentage of Population Employed in Installation, Maintenance & Repair in Westerville, OH with 1.7%.
What is the Percentage of Population Employed in Installation, Maintenance & Repair in Westerville, OH?
Percentage of Population Employed in Installation, Maintenance & Repair in Westerville is 0.83%.
What is the Percentage of Population Employed in Installation, Maintenance & Repair in Ohio?
Percentage of Population Employed in Installation, Maintenance & Repair in Ohio is 3.1%.
What is the Percentage of Population Employed in Installation, Maintenance & Repair in the United States?
Percentage of Population Employed in Installation, Maintenance & Repair in the United States is 3.1%.