Zip Codes with the Highest Percentage of Population Employed in Installation, Maintenance & Repair in Cincinnati, OH
RELATED REPORTS & OPTIONS
Installation, Maintenance & Repair
Cincinnati
Compare Zip Codes
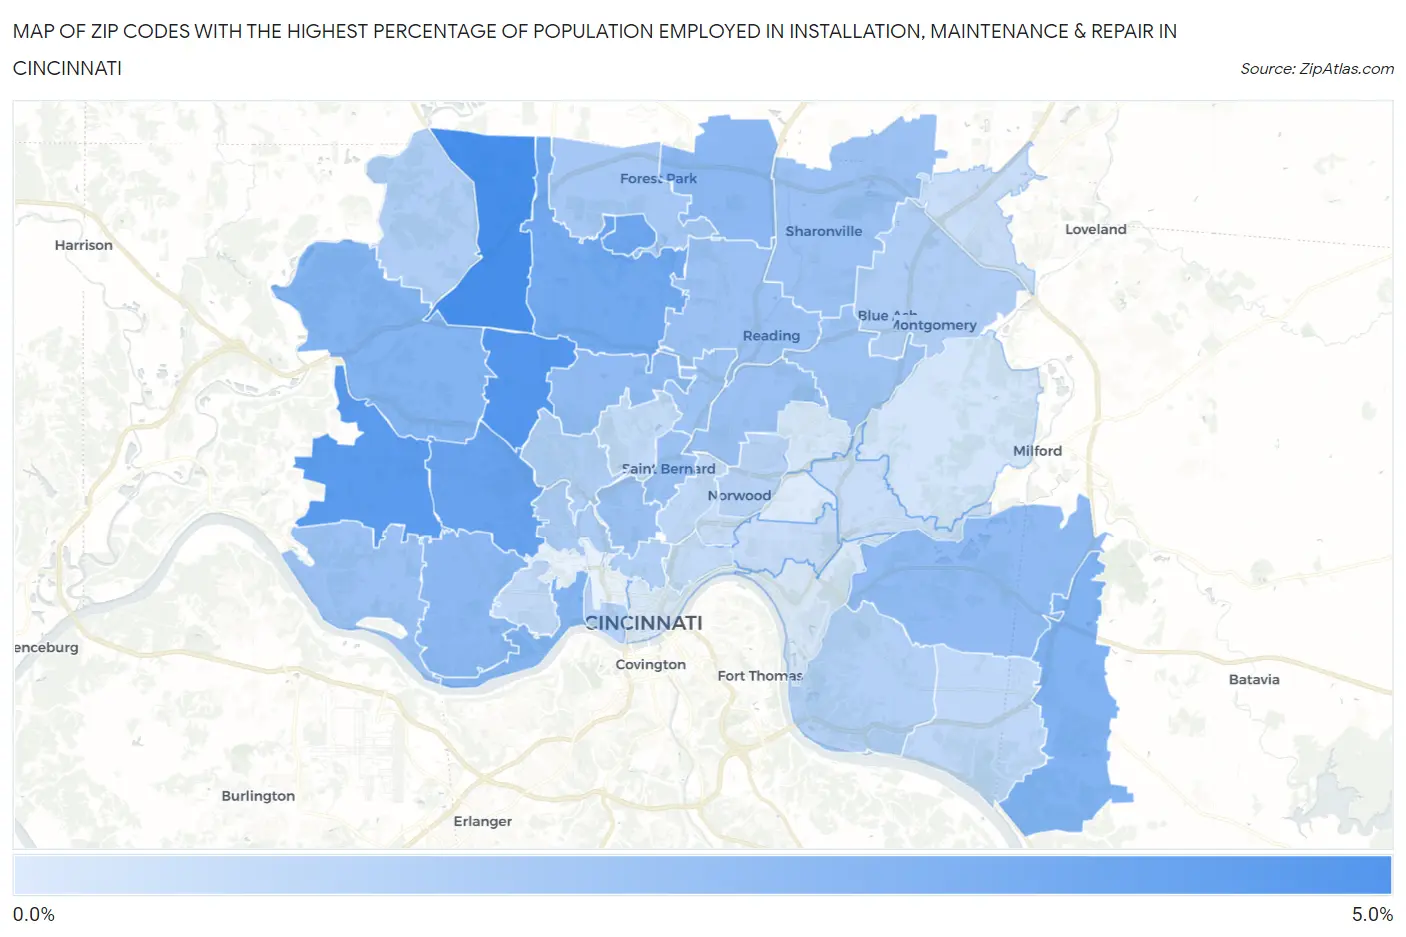
Map of Zip Codes with the Highest Percentage of Population Employed in Installation, Maintenance & Repair in Cincinnati
0.22%
4.3%
Zip Codes with the Highest Percentage of Population Employed in Installation, Maintenance & Repair in Cincinnati, OH
| Zip Code | % Employed | vs State | vs National | |
| 1. | 45251 | 4.3% | 3.1%(+1.19)#426 | 3.1%(+1.18)#11,326 |
| 2. | 45239 | 3.9% | 3.1%(+0.812)#482 | 3.1%(+0.805)#12,928 |
| 3. | 45248 | 3.7% | 3.1%(+0.603)#530 | 3.1%(+0.597)#13,859 |
| 4. | 45211 | 3.4% | 3.1%(+0.318)#582 | 3.1%(+0.312)#15,175 |
| 5. | 45218 | 3.2% | 3.1%(+0.104)#626 | 3.1%(+0.097)#16,204 |
| 6. | 45231 | 3.1% | 3.1%(+0.025)#641 | 3.1%(+0.018)#16,592 |
| 7. | 45245 | 2.7% | 3.1%(-0.370)#720 | 3.1%(-0.377)#18,598 |
| 8. | 45247 | 2.6% | 3.1%(-0.422)#731 | 3.1%(-0.428)#18,877 |
| 9. | 45204 | 2.6% | 3.1%(-0.482)#747 | 3.1%(-0.488)#19,175 |
| 10. | 45246 | 2.4% | 3.1%(-0.672)#783 | 3.1%(-0.679)#20,115 |
| 11. | 45238 | 2.4% | 3.1%(-0.703)#788 | 3.1%(-0.709)#20,277 |
| 12. | 45224 | 2.2% | 3.1%(-0.839)#811 | 3.1%(-0.846)#20,984 |
| 13. | 45244 | 2.2% | 3.1%(-0.841)#812 | 3.1%(-0.847)#20,990 |
| 14. | 45237 | 2.0% | 3.1%(-1.04)#846 | 3.1%(-1.05)#21,929 |
| 15. | 45233 | 2.0% | 3.1%(-1.08)#852 | 3.1%(-1.08)#22,097 |
| 16. | 45217 | 2.0% | 3.1%(-1.09)#853 | 3.1%(-1.09)#22,131 |
| 17. | 45220 | 2.0% | 3.1%(-1.09)#855 | 3.1%(-1.09)#22,142 |
| 18. | 45241 | 1.9% | 3.1%(-1.12)#858 | 3.1%(-1.12)#22,269 |
| 19. | 45215 | 1.9% | 3.1%(-1.13)#860 | 3.1%(-1.14)#22,326 |
| 20. | 45216 | 1.9% | 3.1%(-1.18)#867 | 3.1%(-1.19)#22,534 |
| 21. | 45236 | 1.9% | 3.1%(-1.20)#870 | 3.1%(-1.21)#22,627 |
| 22. | 45240 | 1.7% | 3.1%(-1.39)#906 | 3.1%(-1.39)#23,468 |
| 23. | 45225 | 1.5% | 3.1%(-1.57)#929 | 3.1%(-1.58)#24,191 |
| 24. | 45252 | 1.4% | 3.1%(-1.64)#938 | 3.1%(-1.64)#24,463 |
| 25. | 45242 | 1.4% | 3.1%(-1.65)#939 | 3.1%(-1.65)#24,495 |
| 26. | 45223 | 1.4% | 3.1%(-1.69)#951 | 3.1%(-1.70)#24,660 |
| 27. | 45230 | 1.3% | 3.1%(-1.72)#954 | 3.1%(-1.72)#24,740 |
| 28. | 45219 | 1.3% | 3.1%(-1.73)#955 | 3.1%(-1.74)#24,800 |
| 29. | 45203 | 1.3% | 3.1%(-1.79)#962 | 3.1%(-1.79)#24,974 |
| 30. | 45212 | 1.2% | 3.1%(-1.85)#972 | 3.1%(-1.86)#25,221 |
| 31. | 45229 | 1.0% | 3.1%(-2.03)#1,006 | 3.1%(-2.03)#25,828 |
| 32. | 45255 | 1.0% | 3.1%(-2.04)#1,007 | 3.1%(-2.05)#25,874 |
| 33. | 45205 | 0.92% | 3.1%(-2.14)#1,021 | 3.1%(-2.15)#26,138 |
| 34. | 45232 | 0.91% | 3.1%(-2.15)#1,022 | 3.1%(-2.16)#26,164 |
| 35. | 45206 | 0.91% | 3.1%(-2.15)#1,023 | 3.1%(-2.16)#26,180 |
| 36. | 45227 | 0.80% | 3.1%(-2.27)#1,039 | 3.1%(-2.27)#26,511 |
| 37. | 45249 | 0.79% | 3.1%(-2.27)#1,042 | 3.1%(-2.28)#26,528 |
| 38. | 45207 | 0.77% | 3.1%(-2.29)#1,043 | 3.1%(-2.29)#26,584 |
| 39. | 45208 | 0.75% | 3.1%(-2.31)#1,047 | 3.1%(-2.32)#26,648 |
| 40. | 45243 | 0.49% | 3.1%(-2.57)#1,061 | 3.1%(-2.58)#27,241 |
| 41. | 45213 | 0.39% | 3.1%(-2.68)#1,064 | 3.1%(-2.68)#27,429 |
| 42. | 45226 | 0.36% | 3.1%(-2.70)#1,065 | 3.1%(-2.71)#27,467 |
| 43. | 45202 | 0.32% | 3.1%(-2.74)#1,068 | 3.1%(-2.74)#27,526 |
| 44. | 45209 | 0.22% | 3.1%(-2.85)#1,071 | 3.1%(-2.85)#27,668 |
1
Common Questions
What are the Top 10 Zip Codes with the Highest Percentage of Population Employed in Installation, Maintenance & Repair in Cincinnati, OH?
Top 10 Zip Codes with the Highest Percentage of Population Employed in Installation, Maintenance & Repair in Cincinnati, OH are:
What zip code has the Highest Percentage of Population Employed in Installation, Maintenance & Repair in Cincinnati, OH?
45251 has the Highest Percentage of Population Employed in Installation, Maintenance & Repair in Cincinnati, OH with 4.3%.
What is the Percentage of Population Employed in Installation, Maintenance & Repair in Cincinnati, OH?
Percentage of Population Employed in Installation, Maintenance & Repair in Cincinnati is 1.3%.
What is the Percentage of Population Employed in Installation, Maintenance & Repair in Ohio?
Percentage of Population Employed in Installation, Maintenance & Repair in Ohio is 3.1%.
What is the Percentage of Population Employed in Installation, Maintenance & Repair in the United States?
Percentage of Population Employed in Installation, Maintenance & Repair in the United States is 3.1%.