Buford, OH Map & Demographics
Buford Map
Buford Overview
$32,882
PER CAPITA INCOME
$81,516
AVG FAMILY INCOME
$81,117
AVG HOUSEHOLD INCOME
45.6%
WAGE / INCOME GAP [ % ]
54.4¢/ $1
WAGE / INCOME GAP [ $ ]
0.30
INEQUALITY / GINI INDEX
439
TOTAL POPULATION
255
MALE POPULATION
184
FEMALE POPULATION
138.59
MALES / 100 FEMALES
72.16
FEMALES / 100 MALES
27.0
MEDIAN AGE
2.8
AVG FAMILY SIZE
2.7
AVG HOUSEHOLD SIZE
251
LABOR FORCE [ PEOPLE ]
75.4%
PERCENT IN LABOR FORCE
18.3%
UNEMPLOYMENT RATE
Buford Area Codes
Income in Buford
Income Overview in Buford
Per Capita Income in Buford is $32,882, while median incomes of families and households are $81,516 and $81,117 respectively.
| Characteristic | Number | Measure |
| Per Capita Income | 439 | $32,882 |
| Median Family Income | 145 | $81,516 |
| Mean Family Income | 145 | $100,340 |
| Median Household Income | 160 | $81,117 |
| Mean Household Income | 160 | $93,914 |
| Income Deficit | 145 | $0 |
| Wage / Income Gap (%) | 439 | 45.63% |
| Wage / Income Gap ($) | 439 | 54.37¢ per $1 |
| Gini / Inequality Index | 439 | 0.30 |
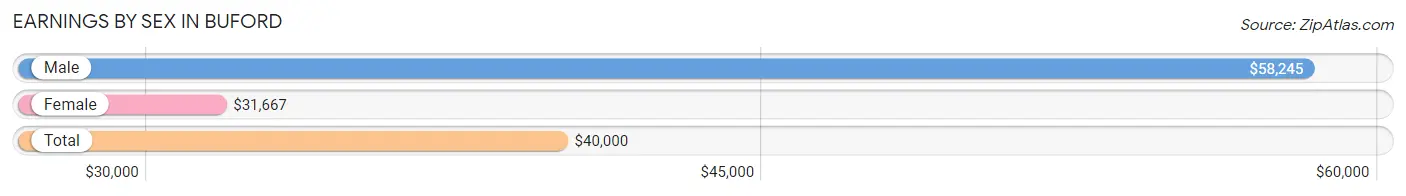
Earnings by Sex in Buford
Average Earnings in Buford are $40,000, $58,245 for men and $31,667 for women, a difference of 45.6%.
| Sex | Number | Average Earnings |
| Male | 154 (55.4%) | $58,245 |
| Female | 124 (44.6%) | $31,667 |
| Total | 278 (100.0%) | $40,000 |
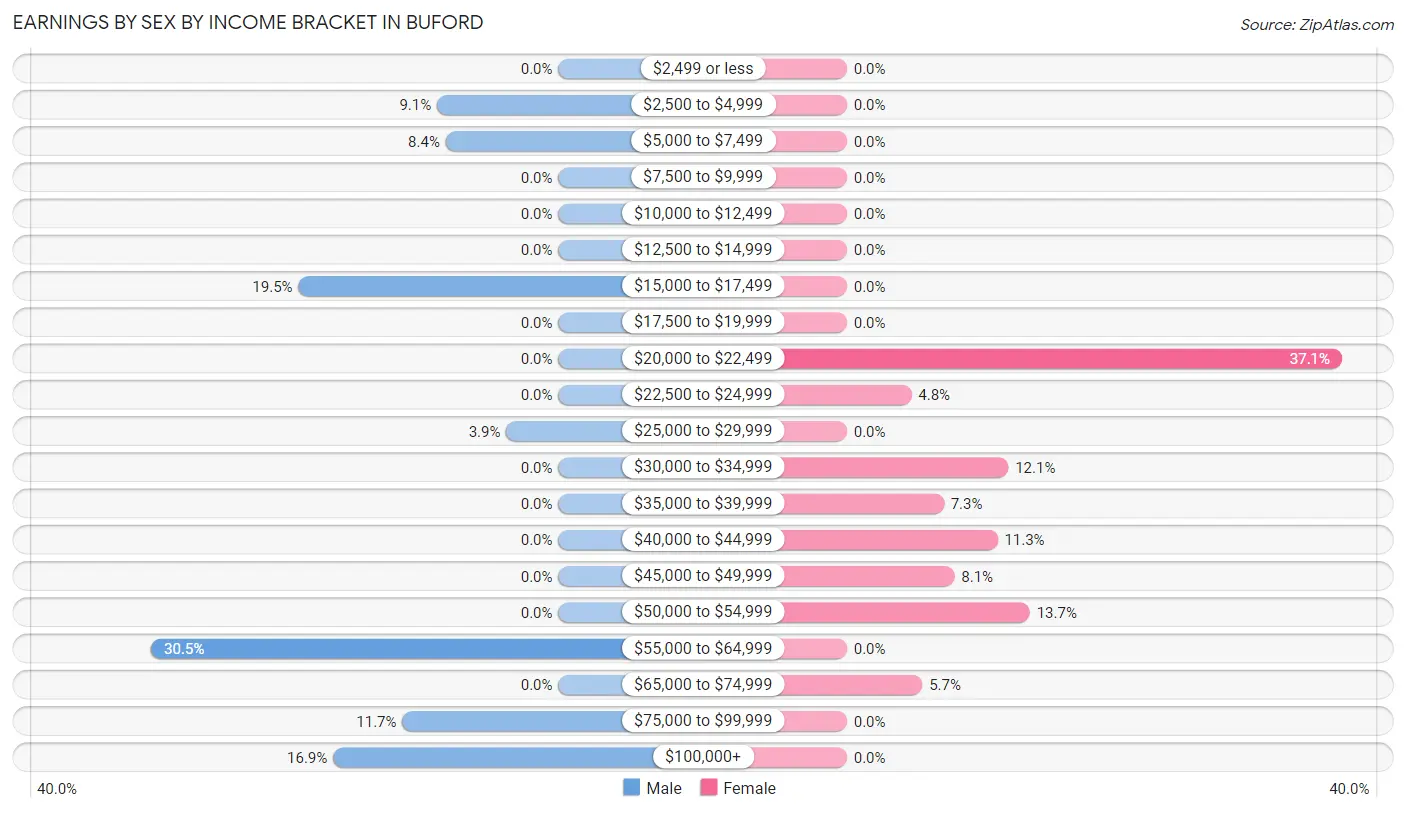
Earnings by Sex by Income Bracket in Buford
The most common earnings brackets in Buford are $55,000 to $64,999 for men (47 | 30.5%) and $20,000 to $22,499 for women (46 | 37.1%).
| Income | Male | Female |
| $2,499 or less | 0 (0.0%) | 0 (0.0%) |
| $2,500 to $4,999 | 14 (9.1%) | 0 (0.0%) |
| $5,000 to $7,499 | 13 (8.4%) | 0 (0.0%) |
| $7,500 to $9,999 | 0 (0.0%) | 0 (0.0%) |
| $10,000 to $12,499 | 0 (0.0%) | 0 (0.0%) |
| $12,500 to $14,999 | 0 (0.0%) | 0 (0.0%) |
| $15,000 to $17,499 | 30 (19.5%) | 0 (0.0%) |
| $17,500 to $19,999 | 0 (0.0%) | 0 (0.0%) |
| $20,000 to $22,499 | 0 (0.0%) | 46 (37.1%) |
| $22,500 to $24,999 | 0 (0.0%) | 6 (4.8%) |
| $25,000 to $29,999 | 6 (3.9%) | 0 (0.0%) |
| $30,000 to $34,999 | 0 (0.0%) | 15 (12.1%) |
| $35,000 to $39,999 | 0 (0.0%) | 9 (7.3%) |
| $40,000 to $44,999 | 0 (0.0%) | 14 (11.3%) |
| $45,000 to $49,999 | 0 (0.0%) | 10 (8.1%) |
| $50,000 to $54,999 | 0 (0.0%) | 17 (13.7%) |
| $55,000 to $64,999 | 47 (30.5%) | 0 (0.0%) |
| $65,000 to $74,999 | 0 (0.0%) | 7 (5.7%) |
| $75,000 to $99,999 | 18 (11.7%) | 0 (0.0%) |
| $100,000+ | 26 (16.9%) | 0 (0.0%) |
| Total | 154 (100.0%) | 124 (100.0%) |
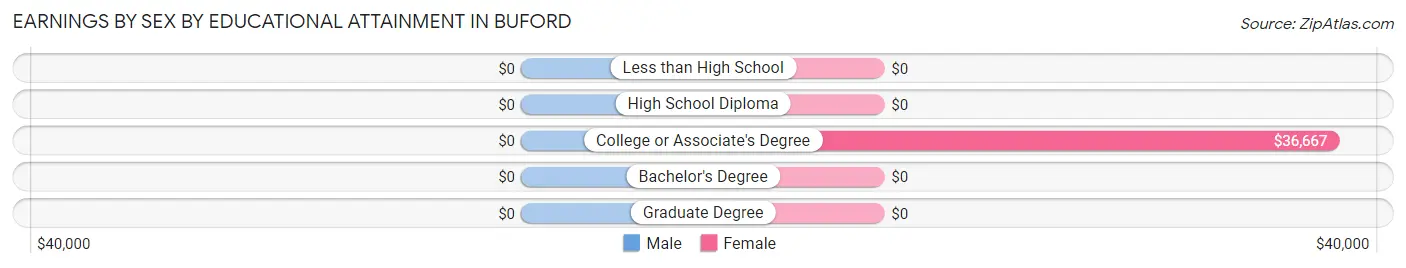
Earnings by Sex by Educational Attainment in Buford
| Educational Attainment | Male Income | Female Income |
| Less than High School | - | - |
| High School Diploma | - | - |
| College or Associate's Degree | - | - |
| Bachelor's Degree | - | - |
| Graduate Degree | - | - |
| Total | $59,761 | $31,667 |
Family Income in Buford
Family Income Brackets in Buford
According to the Buford family income data, there are 47 families falling into the $75,000 to $99,999 income range, which is the most common income bracket and makes up 32.4% of all families.
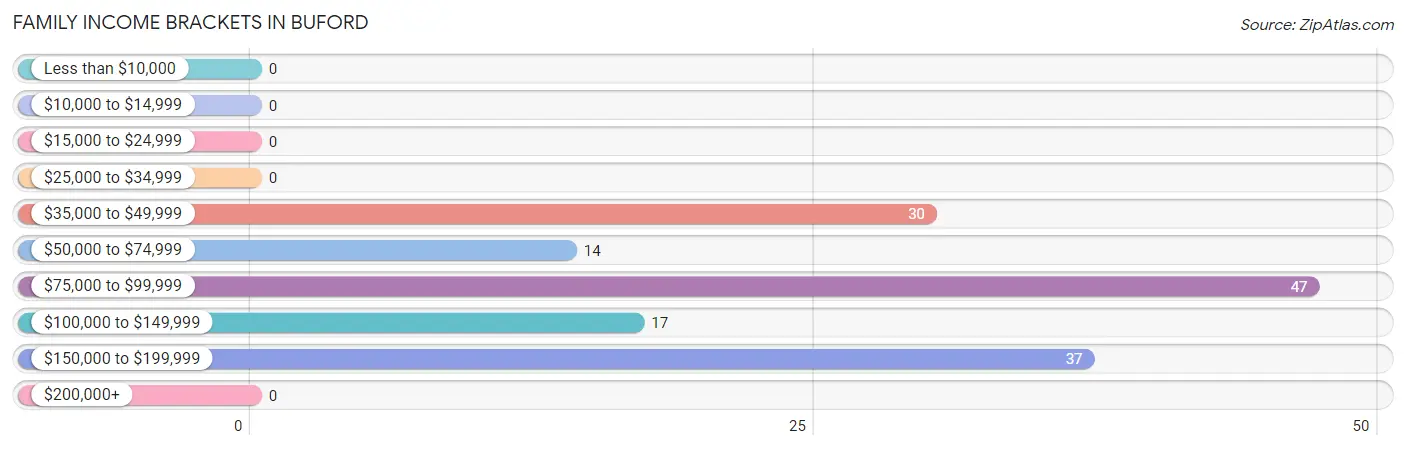
| Income Bracket | # Families | % Families |
| Less than $10,000 | 0 | 0.0% |
| $10,000 to $14,999 | 0 | 0.0% |
| $15,000 to $24,999 | 0 | 0.0% |
| $25,000 to $34,999 | 0 | 0.0% |
| $35,000 to $49,999 | 30 | 20.7% |
| $50,000 to $74,999 | 14 | 9.7% |
| $75,000 to $99,999 | 47 | 32.4% |
| $100,000 to $149,999 | 17 | 11.7% |
| $150,000 to $199,999 | 37 | 25.5% |
| $200,000+ | 0 | 0.0% |
Family Income by Famaliy Size in Buford
| Income Bracket | # Families | Median Income |
| 2-Person Families | 53 (36.5%) | $0 |
| 3-Person Families | 58 (40.0%) | $0 |
| 4-Person Families | 0 (0.0%) | $0 |
| 5-Person Families | 34 (23.4%) | $0 |
| 6-Person Families | 0 (0.0%) | $0 |
| 7+ Person Families | 0 (0.0%) | $0 |
| Total | 145 (100.0%) | $81,516 |
Family Income by Number of Earners in Buford
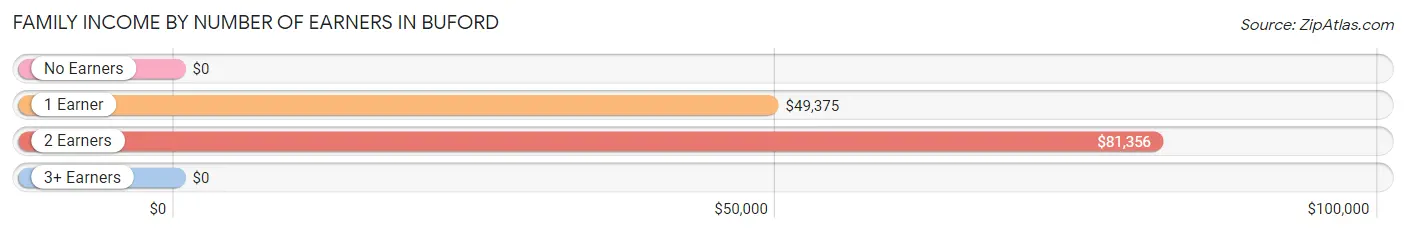
| Number of Earners | # Families | Median Income |
| No Earners | 0 (0.0%) | $0 |
| 1 Earner | 45 (31.0%) | $49,375 |
| 2 Earners | 63 (43.4%) | $81,356 |
| 3+ Earners | 37 (25.5%) | $0 |
| Total | 145 (100.0%) | $81,516 |
Household Income in Buford
Household Income Brackets in Buford
With 47 households falling in the category, the $75,000 to $99,999 income range is the most frequent in Buford, accounting for 29.4% of all households.
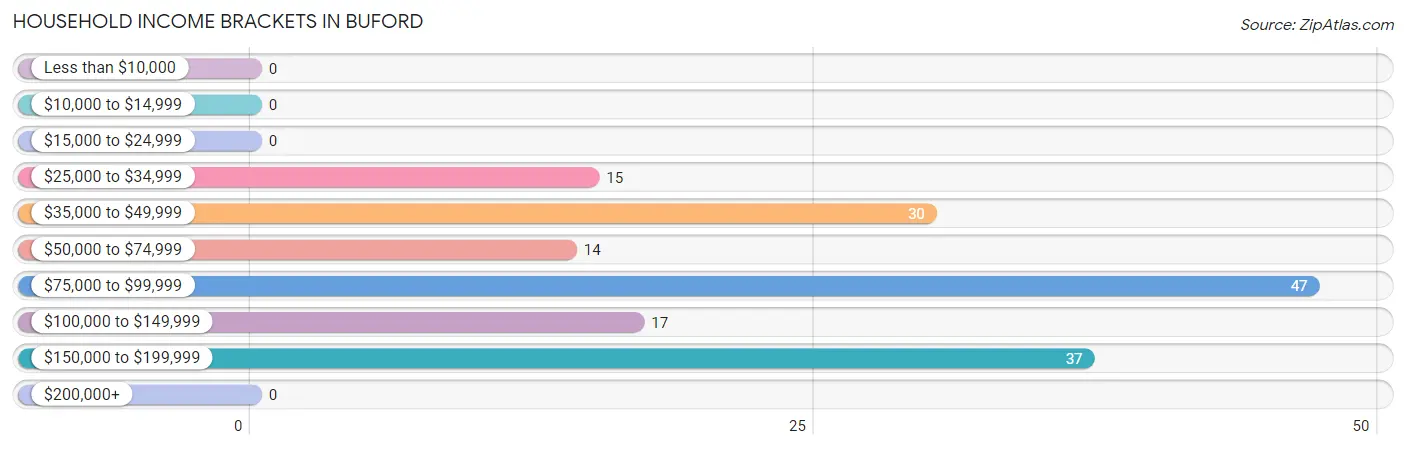
| Income Bracket | # Households | % Households |
| Less than $10,000 | 0 | 0.0% |
| $10,000 to $14,999 | 0 | 0.0% |
| $15,000 to $24,999 | 0 | 0.0% |
| $25,000 to $34,999 | 15 | 9.4% |
| $35,000 to $49,999 | 30 | 18.8% |
| $50,000 to $74,999 | 14 | 8.8% |
| $75,000 to $99,999 | 47 | 29.4% |
| $100,000 to $149,999 | 17 | 10.6% |
| $150,000 to $199,999 | 37 | 23.1% |
| $200,000+ | 0 | 0.0% |
Household Income by Householder Age in Buford
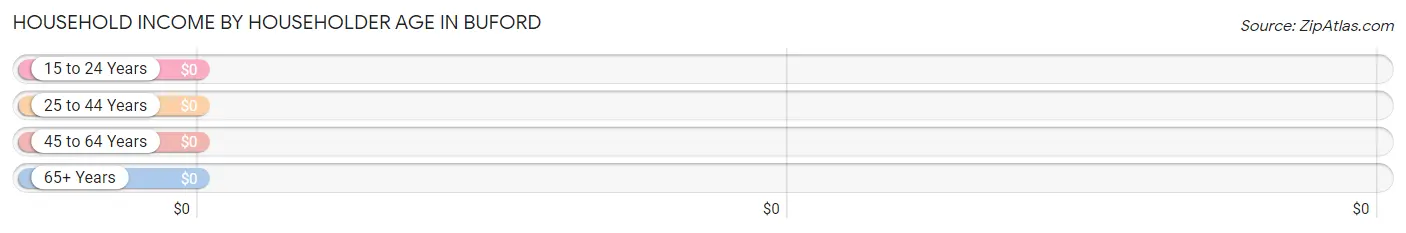
| Income Bracket | # Households | Median Income |
| 15 to 24 Years | 0 (0.0%) | $0 |
| 25 to 44 Years | 81 (50.6%) | $0 |
| 45 to 64 Years | 49 (30.6%) | $0 |
| 65+ Years | 30 (18.8%) | $0 |
| Total | 160 (100.0%) | $81,117 |
Poverty in Buford
Income Below Poverty by Sex and Age in Buford
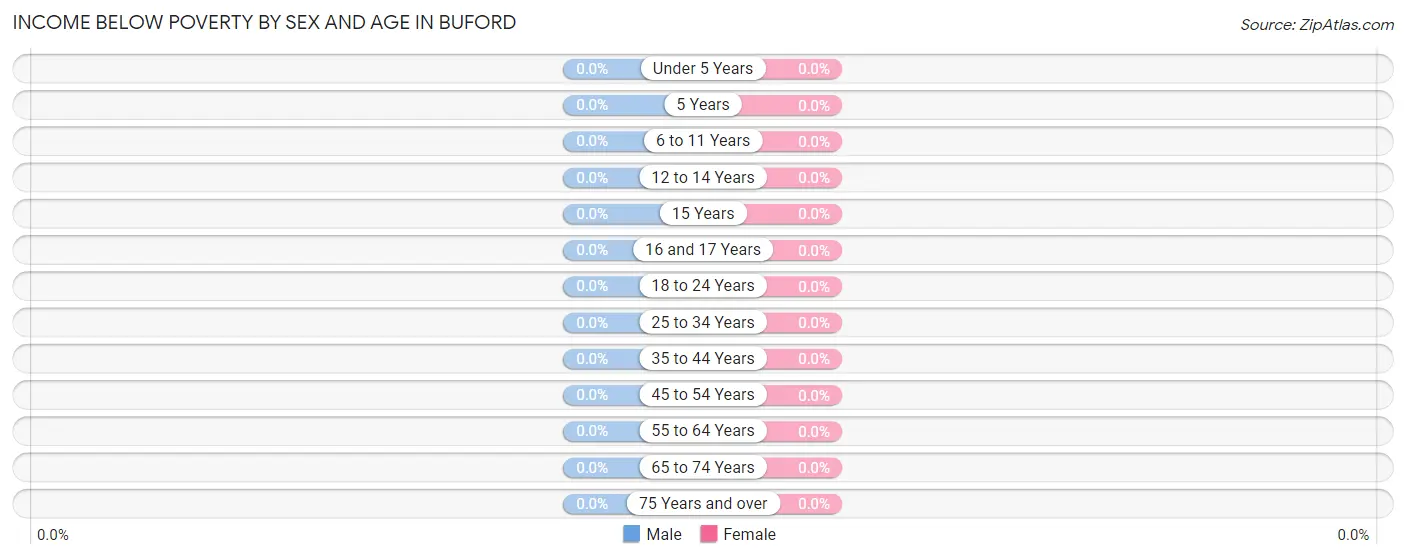
| Age Bracket | Male | Female |
| Under 5 Years | 0 (0.0%) | 0 (0.0%) |
| 5 Years | 0 (0.0%) | 0 (0.0%) |
| 6 to 11 Years | 0 (0.0%) | 0 (0.0%) |
| 12 to 14 Years | 0 (0.0%) | 0 (0.0%) |
| 15 Years | 0 (0.0%) | 0 (0.0%) |
| 16 and 17 Years | 0 (0.0%) | 0 (0.0%) |
| 18 to 24 Years | 0 (0.0%) | 0 (0.0%) |
| 25 to 34 Years | 0 (0.0%) | 0 (0.0%) |
| 35 to 44 Years | 0 (0.0%) | 0 (0.0%) |
| 45 to 54 Years | 0 (0.0%) | 0 (0.0%) |
| 55 to 64 Years | 0 (0.0%) | 0 (0.0%) |
| 65 to 74 Years | 0 (0.0%) | 0 (0.0%) |
| 75 Years and over | 0 (0.0%) | 0 (0.0%) |
| Total | 0 (0.0%) | 0 (0.0%) |
Income Above Poverty by Sex and Age in Buford
According to the poverty statistics in Buford, males aged 6 to 11 years and females aged under 5 years are the age groups that are most secure financially, with 100.0% of males and 100.0% of females in these age groups living above the poverty line.
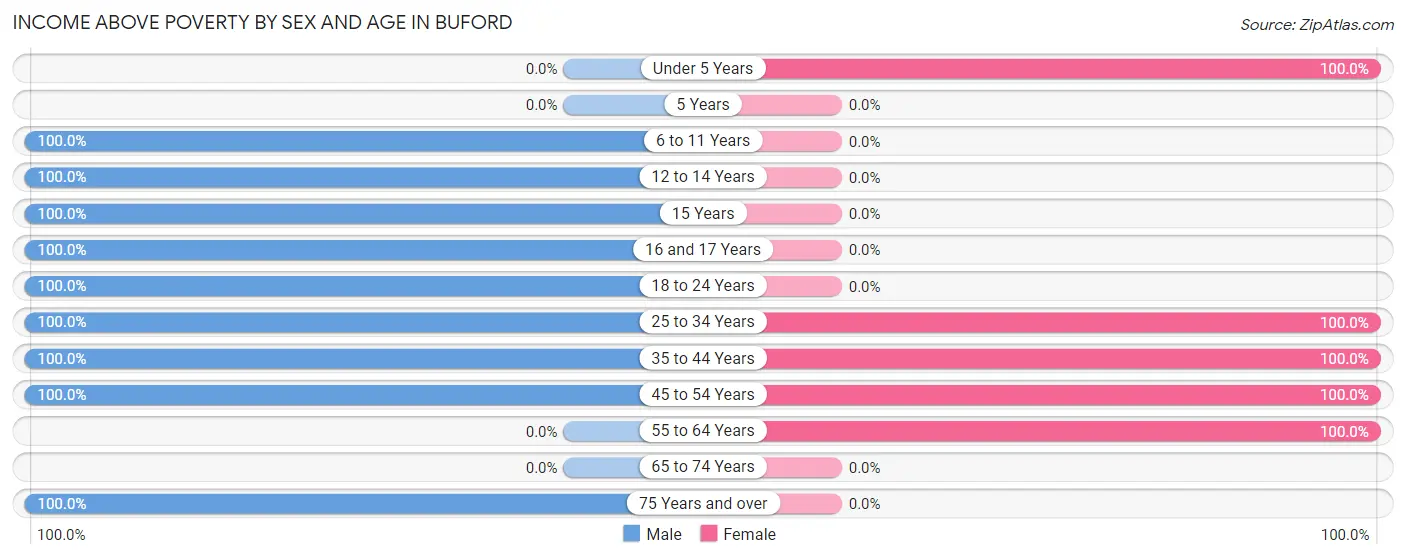
| Age Bracket | Male | Female |
| Under 5 Years | 0 (0.0%) | 39 (100.0%) |
| 5 Years | 0 (0.0%) | 0 (0.0%) |
| 6 to 11 Years | 8 (100.0%) | 0 (0.0%) |
| 12 to 14 Years | 30 (100.0%) | 0 (0.0%) |
| 15 Years | 15 (100.0%) | 0 (0.0%) |
| 16 and 17 Years | 24 (100.0%) | 0 (0.0%) |
| 18 to 24 Years | 43 (100.0%) | 0 (0.0%) |
| 25 to 34 Years | 47 (100.0%) | 46 (100.0%) |
| 35 to 44 Years | 40 (100.0%) | 23 (100.0%) |
| 45 to 54 Years | 18 (100.0%) | 49 (100.0%) |
| 55 to 64 Years | 0 (0.0%) | 13 (100.0%) |
| 65 to 74 Years | 0 (0.0%) | 0 (0.0%) |
| 75 Years and over | 30 (100.0%) | 0 (0.0%) |
| Total | 255 (100.0%) | 170 (100.0%) |
Income Below Poverty Among Married-Couple Families in Buford
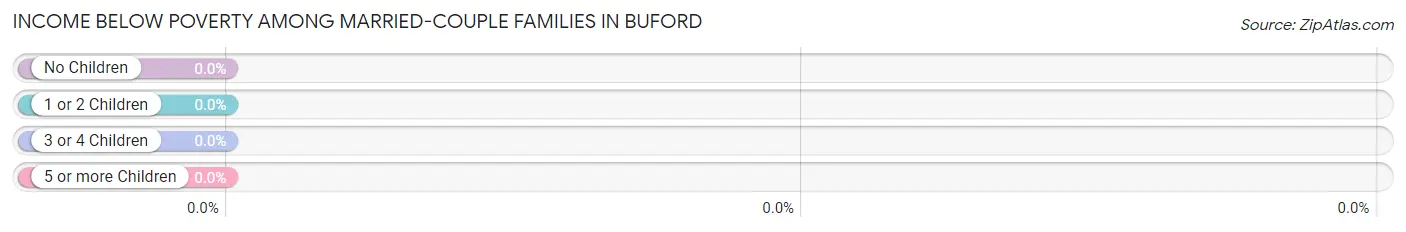
| Children | Above Poverty | Below Poverty |
| No Children | 21 (100.0%) | 0 (0.0%) |
| 1 or 2 Children | 47 (100.0%) | 0 (0.0%) |
| 3 or 4 Children | 34 (100.0%) | 0 (0.0%) |
| 5 or more Children | 0 (0.0%) | 0 (0.0%) |
| Total | 102 (100.0%) | 0 (0.0%) |
Income Below Poverty Among Single-Parent Households in Buford
| Children | Single Father | Single Mother |
| No Children | 0 (0.0%) | 0 (0.0%) |
| 1 or 2 Children | 0 (0.0%) | 0 (0.0%) |
| 3 or 4 Children | 0 (0.0%) | 0 (0.0%) |
| 5 or more Children | 0 (0.0%) | 0 (0.0%) |
| Total | 0 (0.0%) | 0 (0.0%) |
Income Below Poverty Among Married-Couple vs Single-Parent Households in Buford
| Children | Married-Couple Families | Single-Parent Households |
| No Children | 0 (0.0%) | 0 (0.0%) |
| 1 or 2 Children | 0 (0.0%) | 0 (0.0%) |
| 3 or 4 Children | 0 (0.0%) | 0 (0.0%) |
| 5 or more Children | 0 (0.0%) | 0 (0.0%) |
| Total | 0 (0.0%) | 0 (0.0%) |
Race in Buford
The most populous races in Buford are , and White / Caucasian (439 | 100.0%).
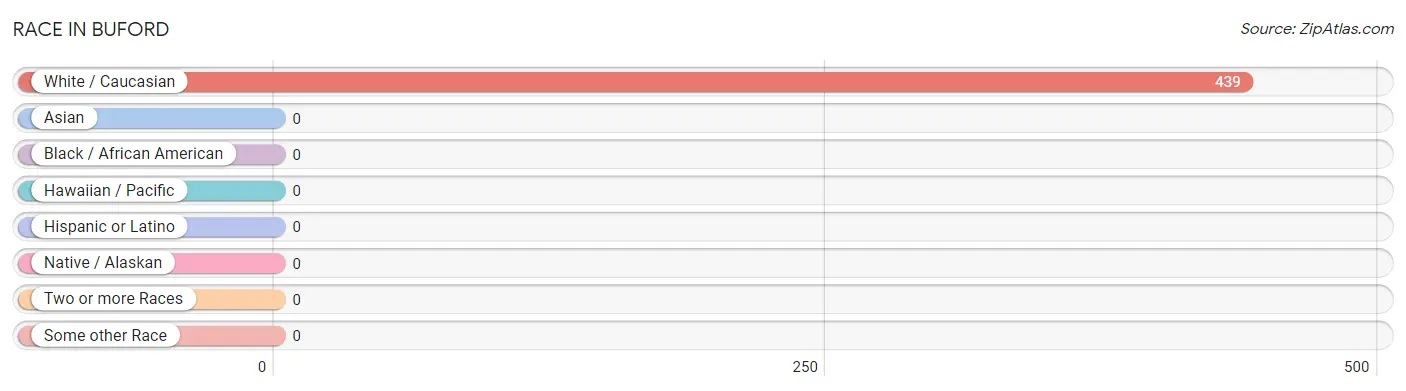
| Race | # Population | % Population |
| Asian | 0 | 0.0% |
| Black / African American | 0 | 0.0% |
| Hawaiian / Pacific | 0 | 0.0% |
| Hispanic or Latino | 0 | 0.0% |
| Native / Alaskan | 0 | 0.0% |
| White / Caucasian | 439 | 100.0% |
| Two or more Races | 0 | 0.0% |
| Some other Race | 0 | 0.0% |
| Total | 439 | 100.0% |
Ancestry in Buford
The most populous ancestries reported in Buford are German (146 | 33.3%), English (54 | 12.3%), Irish (32 | 7.3%), Scotch-Irish (17 | 3.9%), and Scottish (14 | 3.2%), together accounting for 59.9% of all Buford residents.
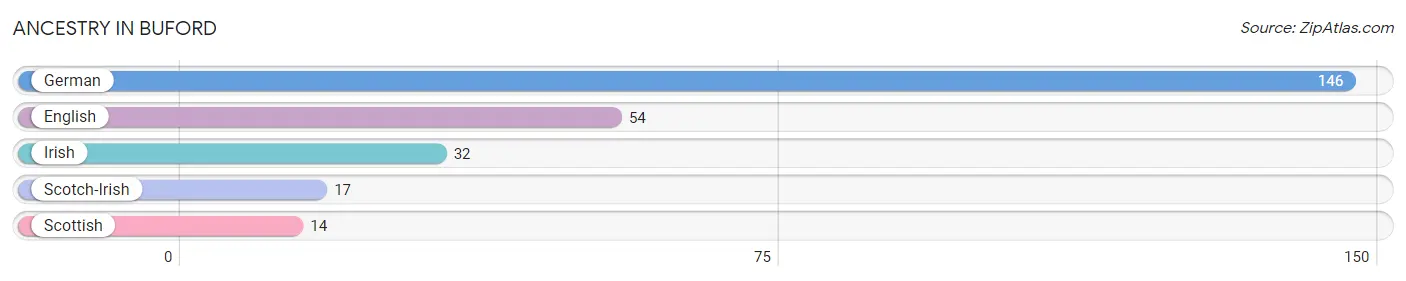
| Ancestry | # Population | % Population |
| English | 54 | 12.3% |
| German | 146 | 33.3% |
| Irish | 32 | 7.3% |
| Scotch-Irish | 17 | 3.9% |
| Scottish | 14 | 3.2% | View All 5 Rows |
Immigrants in Buford

| Immigration Origin | # Population | % Population | View All 0 Rows |
Sex and Age in Buford
Sex and Age in Buford
The most populous age groups in Buford are 15 to 19 Years (52 | 20.4%) for men and Under 5 Years (53 | 28.8%) for women.
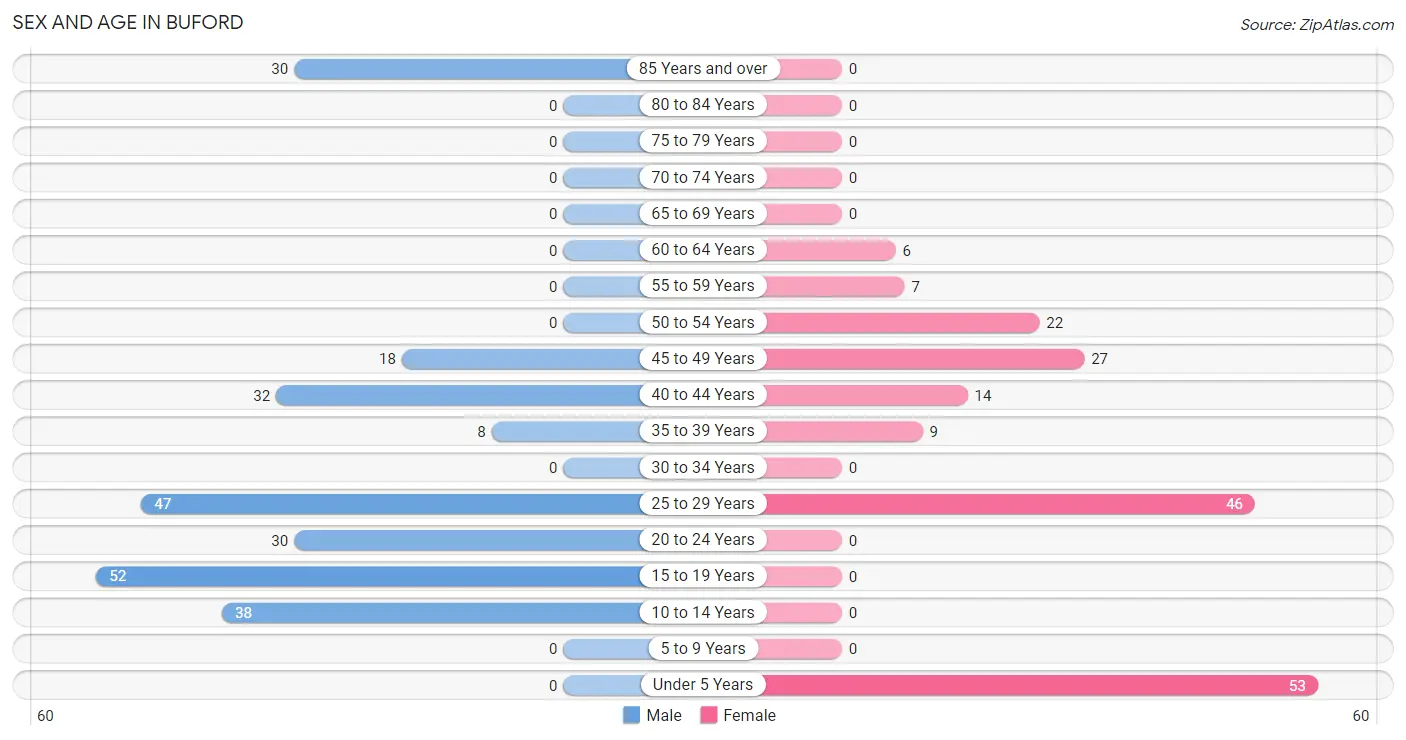
| Age Bracket | Male | Female |
| Under 5 Years | 0 (0.0%) | 53 (28.8%) |
| 5 to 9 Years | 0 (0.0%) | 0 (0.0%) |
| 10 to 14 Years | 38 (14.9%) | 0 (0.0%) |
| 15 to 19 Years | 52 (20.4%) | 0 (0.0%) |
| 20 to 24 Years | 30 (11.8%) | 0 (0.0%) |
| 25 to 29 Years | 47 (18.4%) | 46 (25.0%) |
| 30 to 34 Years | 0 (0.0%) | 0 (0.0%) |
| 35 to 39 Years | 8 (3.1%) | 9 (4.9%) |
| 40 to 44 Years | 32 (12.6%) | 14 (7.6%) |
| 45 to 49 Years | 18 (7.1%) | 27 (14.7%) |
| 50 to 54 Years | 0 (0.0%) | 22 (12.0%) |
| 55 to 59 Years | 0 (0.0%) | 7 (3.8%) |
| 60 to 64 Years | 0 (0.0%) | 6 (3.3%) |
| 65 to 69 Years | 0 (0.0%) | 0 (0.0%) |
| 70 to 74 Years | 0 (0.0%) | 0 (0.0%) |
| 75 to 79 Years | 0 (0.0%) | 0 (0.0%) |
| 80 to 84 Years | 0 (0.0%) | 0 (0.0%) |
| 85 Years and over | 30 (11.8%) | 0 (0.0%) |
| Total | 255 (100.0%) | 184 (100.0%) |
Families and Households in Buford
Median Family Size in Buford
The median family size in Buford is 2.83 persons per family, with married-couple families (102 | 70.3%) accounting for the largest median family size of 3.18 persons per family. On the other hand, single male/father families (30 | 20.7%) represent the smallest median family size with 2.00 persons per family.
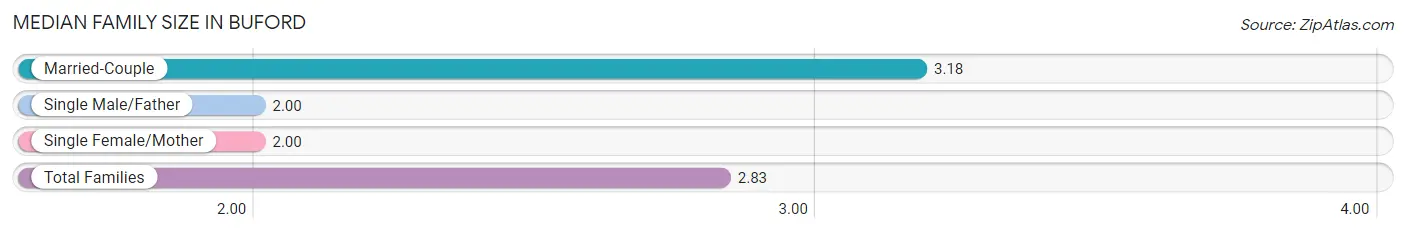
| Family Type | # Families | Family Size |
| Married-Couple | 102 (70.3%) | 3.18 |
| Single Male/Father | 30 (20.7%) | 2.00 |
| Single Female/Mother | 13 (9.0%) | 2.00 |
| Total Families | 145 (100.0%) | 2.83 |
Median Household Size in Buford
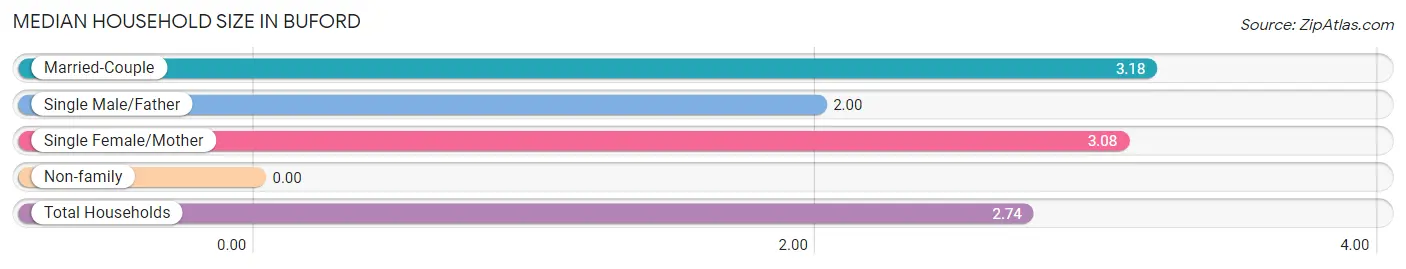
| Household Type | # Households | Household Size |
| Married-Couple | 102 (63.7%) | 3.18 |
| Single Male/Father | 30 (18.8%) | 2.00 |
| Single Female/Mother | 13 (8.1%) | 3.08 |
| Non-family | 15 (9.4%) | - |
| Total Households | 160 (100.0%) | 2.74 |
Household Size by Marriage Status in Buford
Out of a total of 160 households in Buford, 145 (90.6%) are family households, while 15 (9.4%) are nonfamily households. The most numerous type of family households are 3-person households, comprising 58, and the most common type of nonfamily households are 1-person households, comprising 15.
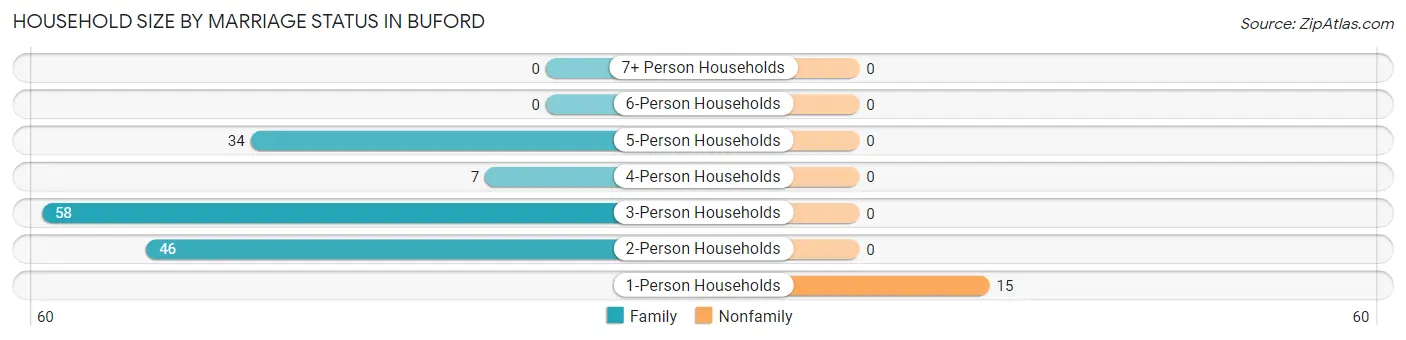
| Household Size | Family Households | Nonfamily Households |
| 1-Person Households | - | 15 (9.4%) |
| 2-Person Households | 46 (28.7%) | 0 (0.0%) |
| 3-Person Households | 58 (36.2%) | 0 (0.0%) |
| 4-Person Households | 7 (4.4%) | 0 (0.0%) |
| 5-Person Households | 34 (21.2%) | 0 (0.0%) |
| 6-Person Households | 0 (0.0%) | 0 (0.0%) |
| 7+ Person Households | 0 (0.0%) | 0 (0.0%) |
| Total | 145 (90.6%) | 15 (9.4%) |
Female Fertility in Buford
Fertility by Age in Buford
| Age Bracket | Women with Births | Births / 1,000 Women |
| 15 to 19 years | 0 (0.0%) | 0.0 |
| 20 to 34 years | 0 (0.0%) | 0.0 |
| 35 to 50 years | 0 (0.0%) | 0.0 |
| Total | 0 (0.0%) | 0.0 |
Fertility by Age by Marriage Status in Buford
| Age Bracket | Married | Unmarried |
| 15 to 19 years | 0 (0.0%) | 0 (0.0%) |
| 20 to 34 years | 0 (0.0%) | 0 (0.0%) |
| 35 to 50 years | 0 (0.0%) | 0 (0.0%) |
| Total | 0 (0.0%) | 0 (0.0%) |
Fertility by Education in Buford
| Educational Attainment | Women with Births | Births / 1,000 Women |
| Less than High School | 0 (0.0%) | 0.0 |
| High School Diploma | 0 (0.0%) | 0.0 |
| College or Associate's Degree | 0 (0.0%) | 0.0 |
| Bachelor's Degree | 0 (0.0%) | 0.0 |
| Graduate Degree | 0 (0.0%) | 0.0 |
| Total | 0 (0.0%) | 0.0 |
Fertility by Education by Marriage Status in Buford
| Educational Attainment | Married | Unmarried |
| Less than High School | 0 (0.0%) | 0 (0.0%) |
| High School Diploma | 0 (0.0%) | 0 (0.0%) |
| College or Associate's Degree | 0 (0.0%) | 0 (0.0%) |
| Bachelor's Degree | 0 (0.0%) | 0 (0.0%) |
| Graduate Degree | 0 (0.0%) | 0 (0.0%) |
| Total | 0 (0.0%) | 0 (0.0%) |
Employment Characteristics in Buford
Employment by Class of Employer in Buford
Among the 199 employed individuals in Buford, private company employees (165 | 82.9%), local government employees (20 | 10.1%), and state government employees (14 | 7.0%) make up the most common classes of employment.
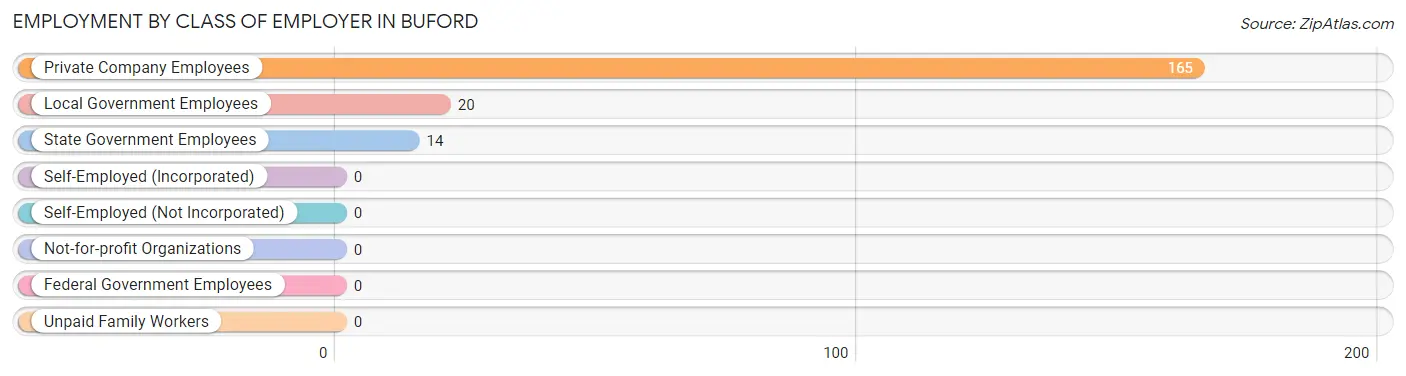
| Employer Class | # Employees | % Employees |
| Private Company Employees | 165 | 82.9% |
| Self-Employed (Incorporated) | 0 | 0.0% |
| Self-Employed (Not Incorporated) | 0 | 0.0% |
| Not-for-profit Organizations | 0 | 0.0% |
| Local Government Employees | 20 | 10.1% |
| State Government Employees | 14 | 7.0% |
| Federal Government Employees | 0 | 0.0% |
| Unpaid Family Workers | 0 | 0.0% |
| Total | 199 | 100.0% |
Employment Status by Age in Buford
According to the labor force statistics for Buford, out of the total population over 16 years of age (333), 75.4% or 251 individuals are in the labor force, with 18.3% or 46 of them unemployed. The age group with the highest labor force participation rate is 20 to 24 years, with 100.0% or 30 individuals in the labor force. Within the labor force, the 25 to 29 years age range has the highest percentage of unemployed individuals, with 49.5% or 46 of them being unemployed.
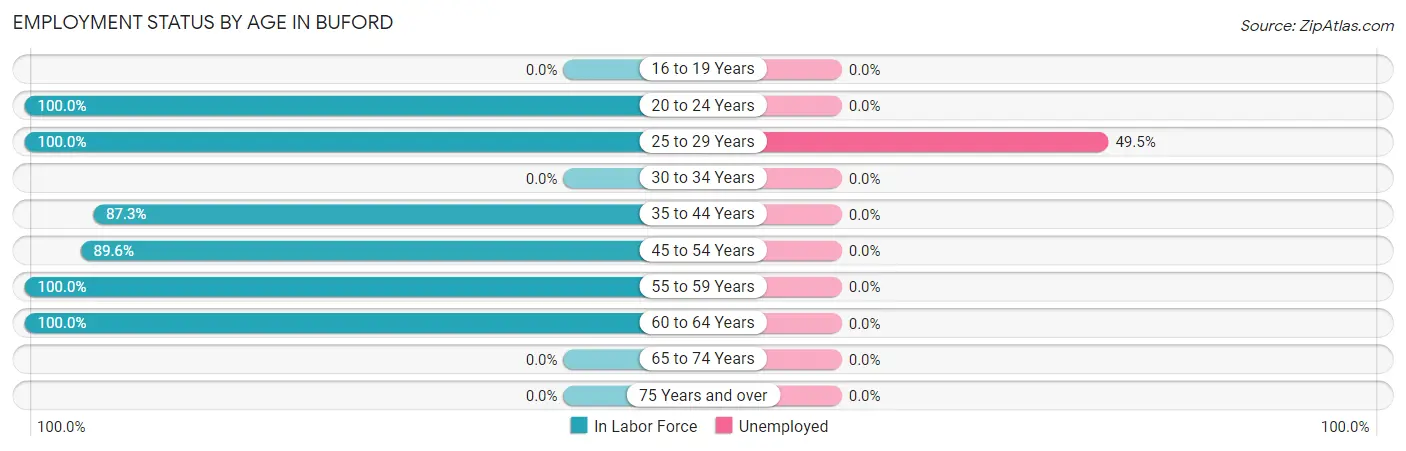
| Age Bracket | In Labor Force | Unemployed |
| 16 to 19 Years | 0 (0.0%) | 0 (0.0%) |
| 20 to 24 Years | 30 (100.0%) | 0 (0.0%) |
| 25 to 29 Years | 93 (100.0%) | 46 (49.5%) |
| 30 to 34 Years | 0 (0.0%) | 0 (0.0%) |
| 35 to 44 Years | 55 (87.3%) | 0 (0.0%) |
| 45 to 54 Years | 60 (89.6%) | 0 (0.0%) |
| 55 to 59 Years | 7 (100.0%) | 0 (0.0%) |
| 60 to 64 Years | 6 (100.0%) | 0 (0.0%) |
| 65 to 74 Years | 0 (0.0%) | 0 (0.0%) |
| 75 Years and over | 0 (0.0%) | 0 (0.0%) |
| Total | 251 (75.4%) | 46 (18.3%) |
Employment Status by Educational Attainment in Buford
According to labor force statistics for Buford, 93.6% of individuals (221) out of the total population between 25 and 64 years of age (236) are in the labor force, with 20.8% or 46 of them being unemployed. The group with the highest labor force participation rate are those with the educational attainment of high school diploma, with 100.0% or 7 individuals in the labor force. Within the labor force, individuals with bachelor's degree or higher education have the highest percentage of unemployment, with 43.0% or 46 of them being unemployed.
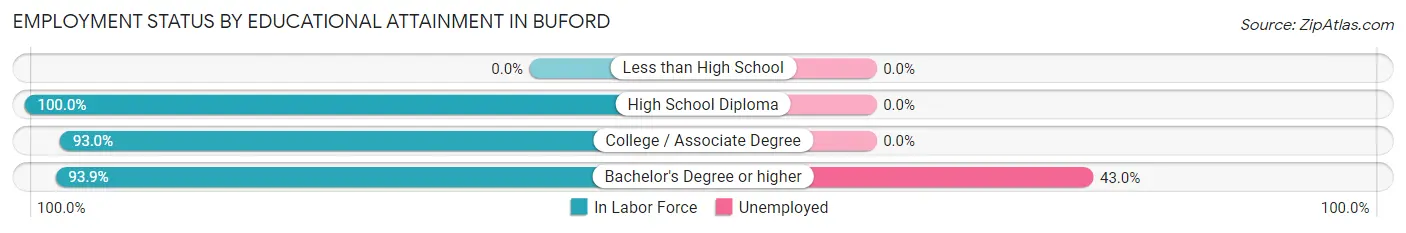
| Educational Attainment | In Labor Force | Unemployed |
| Less than High School | 0 (0.0%) | 0 (0.0%) |
| High School Diploma | 7 (100.0%) | 0 (0.0%) |
| College / Associate Degree | 107 (93.0%) | 0 (0.0%) |
| Bachelor's Degree or higher | 107 (93.9%) | 49 (43.0%) |
| Total | 221 (93.6%) | 49 (20.8%) |
Employment Occupations by Sex in Buford
Management, Business, Science and Arts Occupations
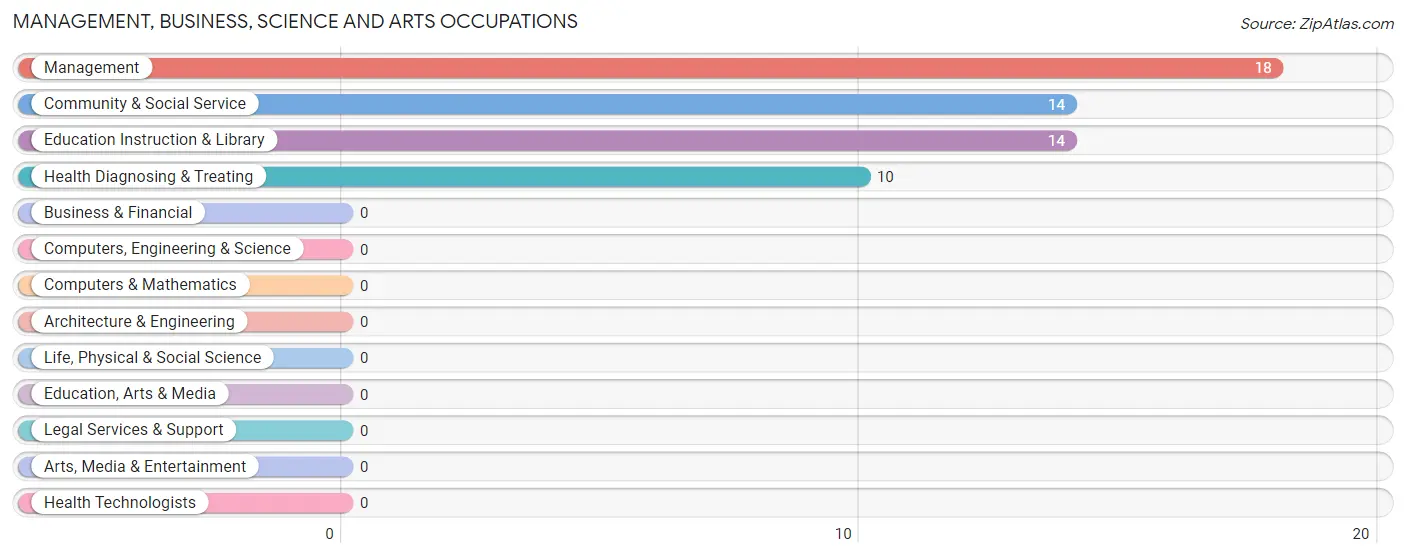
The most common Management, Business, Science and Arts occupations in Buford are Management (18 | 8.8%), Community & Social Service (14 | 6.8%), Education Instruction & Library (14 | 6.8%), and Health Diagnosing & Treating (10 | 4.9%).
Management, Business, Science and Arts Occupations by Sex
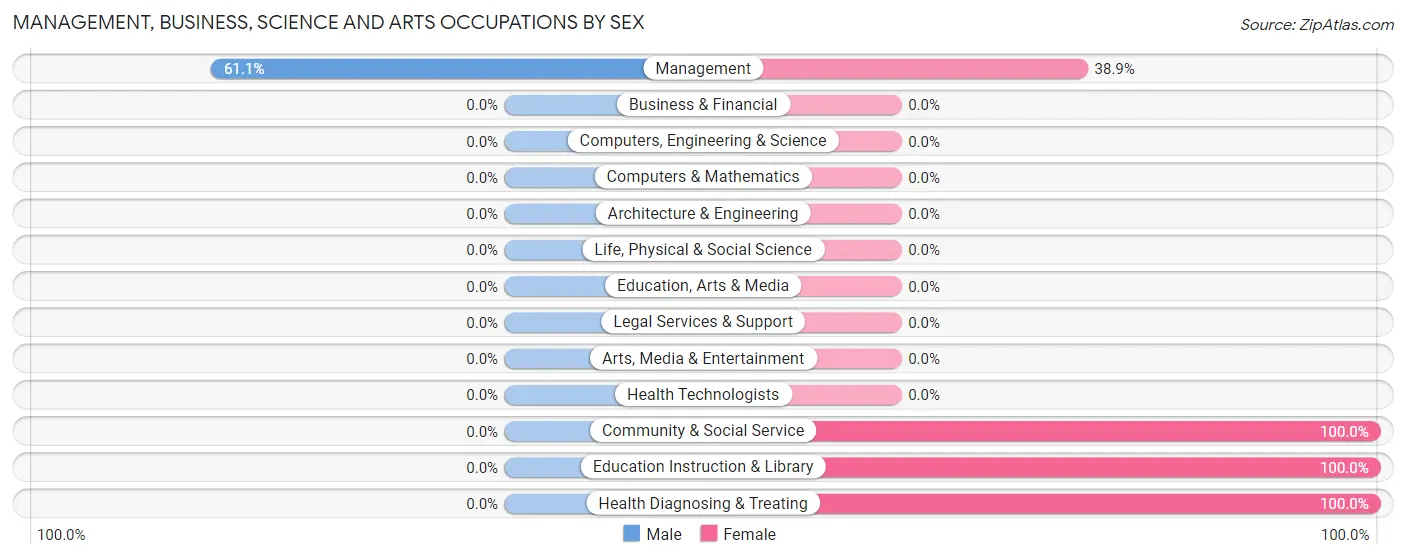
| Occupation | Male | Female |
| Management | 11 (61.1%) | 7 (38.9%) |
| Business & Financial | 0 (0.0%) | 0 (0.0%) |
| Computers, Engineering & Science | 0 (0.0%) | 0 (0.0%) |
| Computers & Mathematics | 0 (0.0%) | 0 (0.0%) |
| Architecture & Engineering | 0 (0.0%) | 0 (0.0%) |
| Life, Physical & Social Science | 0 (0.0%) | 0 (0.0%) |
| Community & Social Service | 0 (0.0%) | 14 (100.0%) |
| Education, Arts & Media | 0 (0.0%) | 0 (0.0%) |
| Legal Services & Support | 0 (0.0%) | 0 (0.0%) |
| Education Instruction & Library | 0 (0.0%) | 14 (100.0%) |
| Arts, Media & Entertainment | 0 (0.0%) | 0 (0.0%) |
| Health Diagnosing & Treating | 0 (0.0%) | 10 (100.0%) |
| Health Technologists | 0 (0.0%) | 0 (0.0%) |
| Total (Category) | 11 (26.2%) | 31 (73.8%) |
| Total (Overall) | 127 (62.0%) | 78 (38.1%) |
Services Occupations
The most common Services occupations in Buford are , and Healthcare Support (21 | 10.2%).
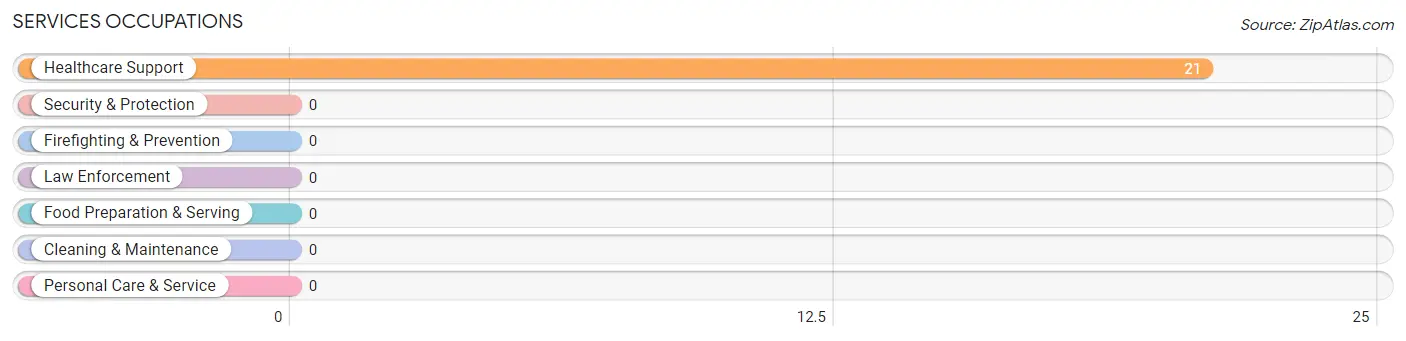
Services Occupations by Sex
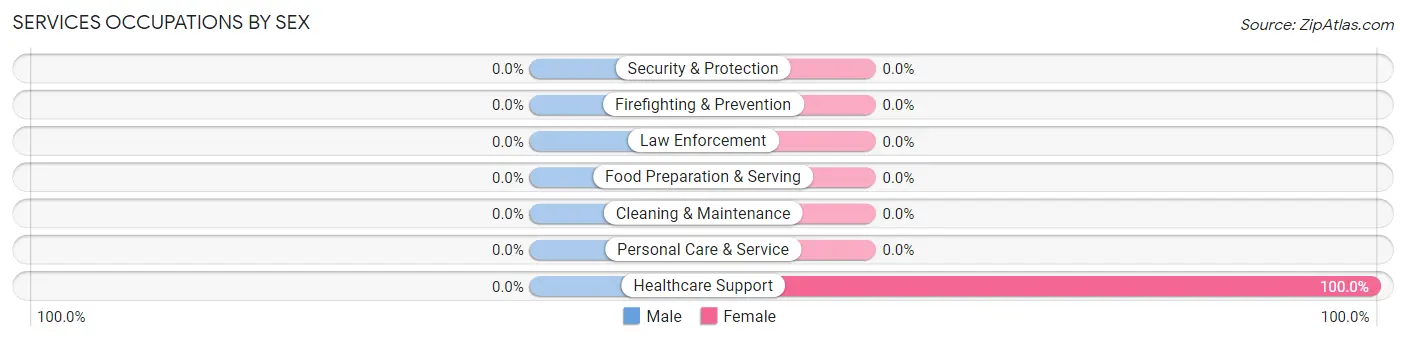
| Occupation | Male | Female |
| Healthcare Support | 0 (0.0%) | 21 (100.0%) |
| Security & Protection | 0 (0.0%) | 0 (0.0%) |
| Firefighting & Prevention | 0 (0.0%) | 0 (0.0%) |
| Law Enforcement | 0 (0.0%) | 0 (0.0%) |
| Food Preparation & Serving | 0 (0.0%) | 0 (0.0%) |
| Cleaning & Maintenance | 0 (0.0%) | 0 (0.0%) |
| Personal Care & Service | 0 (0.0%) | 0 (0.0%) |
| Total (Category) | 0 (0.0%) | 21 (100.0%) |
| Total (Overall) | 127 (62.0%) | 78 (38.1%) |
Sales and Office Occupations
The most common Sales and Office occupations in Buford are Sales & Related (17 | 8.3%), and Office & Administration (9 | 4.4%).
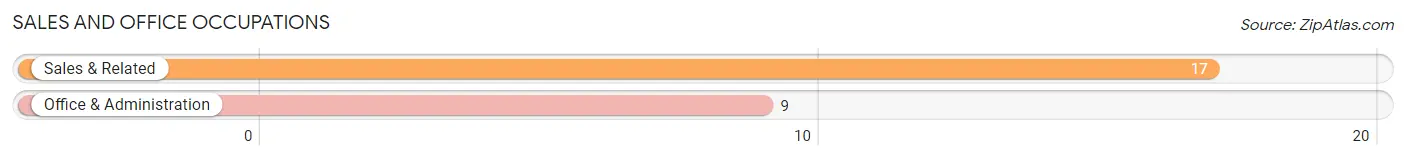
Sales and Office Occupations by Sex

| Occupation | Male | Female |
| Sales & Related | 0 (0.0%) | 17 (100.0%) |
| Office & Administration | 0 (0.0%) | 9 (100.0%) |
| Total (Category) | 0 (0.0%) | 26 (100.0%) |
| Total (Overall) | 127 (62.0%) | 78 (38.1%) |
Natural Resources, Construction and Maintenance Occupations
The most common Natural Resources, Construction and Maintenance occupations in Buford are Construction & Extraction (63 | 30.7%), and Installation, Maintenance & Repair (47 | 22.9%).
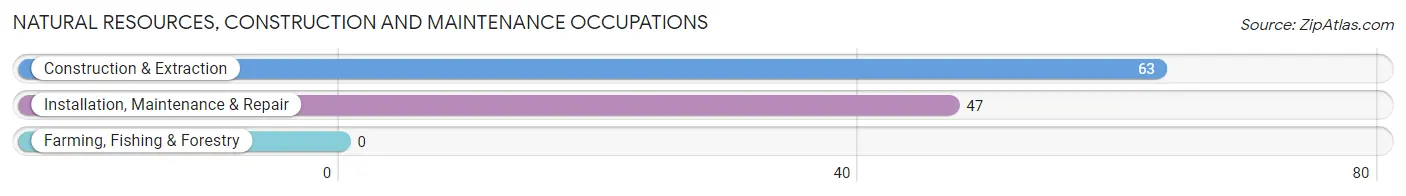
Natural Resources, Construction and Maintenance Occupations by Sex
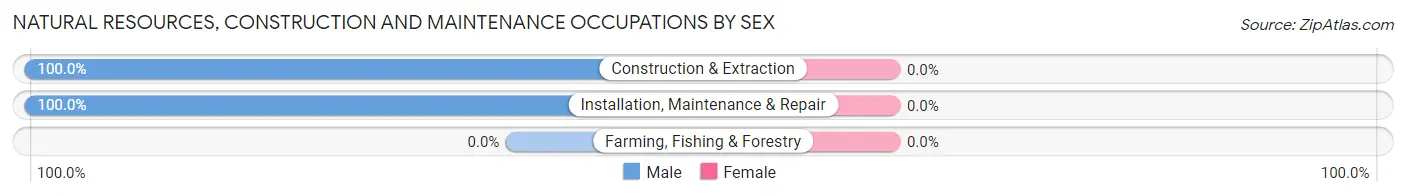
| Occupation | Male | Female |
| Farming, Fishing & Forestry | 0 (0.0%) | 0 (0.0%) |
| Construction & Extraction | 63 (100.0%) | 0 (0.0%) |
| Installation, Maintenance & Repair | 47 (100.0%) | 0 (0.0%) |
| Total (Category) | 110 (100.0%) | 0 (0.0%) |
| Total (Overall) | 127 (62.0%) | 78 (38.1%) |
Production, Transportation and Moving Occupations
The most common Production, Transportation and Moving occupations in Buford are , and Transportation (6 | 2.9%).
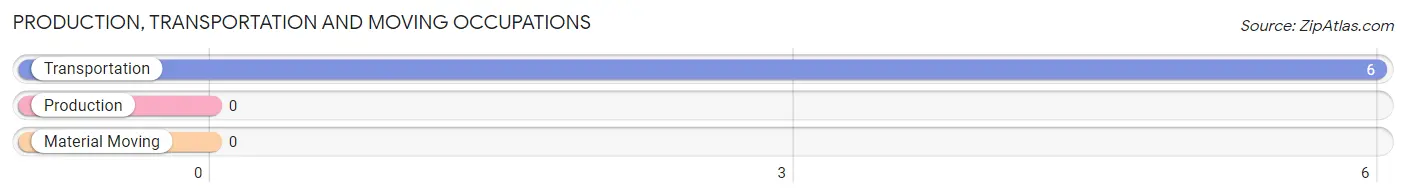
Production, Transportation and Moving Occupations by Sex
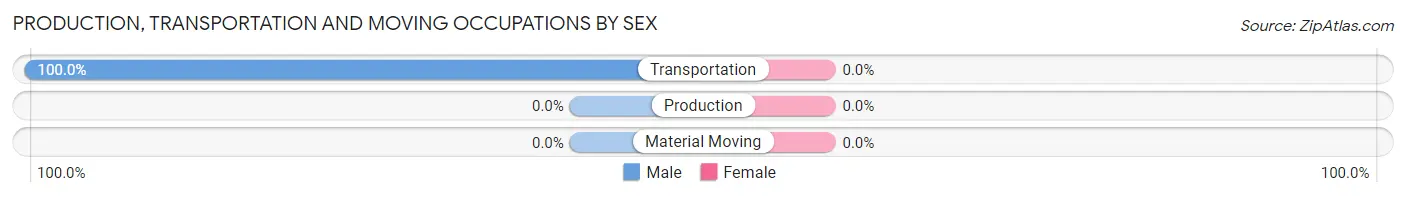
| Occupation | Male | Female |
| Production | 0 (0.0%) | 0 (0.0%) |
| Transportation | 6 (100.0%) | 0 (0.0%) |
| Material Moving | 0 (0.0%) | 0 (0.0%) |
| Total (Category) | 6 (100.0%) | 0 (0.0%) |
| Total (Overall) | 127 (62.0%) | 78 (38.1%) |
Employment Industries by Sex in Buford
Employment Industries in Buford
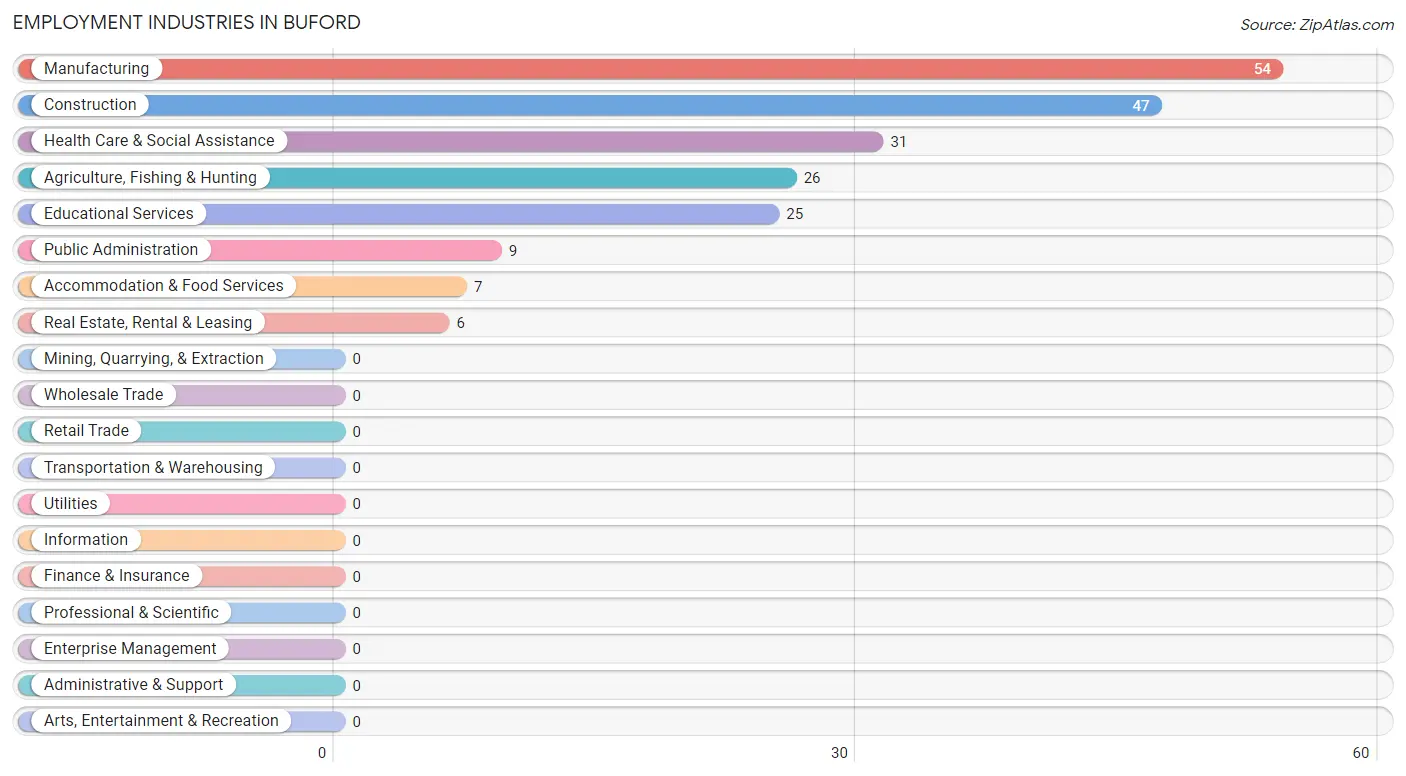
The major employment industries in Buford include Manufacturing (54 | 26.3%), Construction (47 | 22.9%), Health Care & Social Assistance (31 | 15.1%), Agriculture, Fishing & Hunting (26 | 12.7%), and Educational Services (25 | 12.2%).
Employment Industries by Sex in Buford
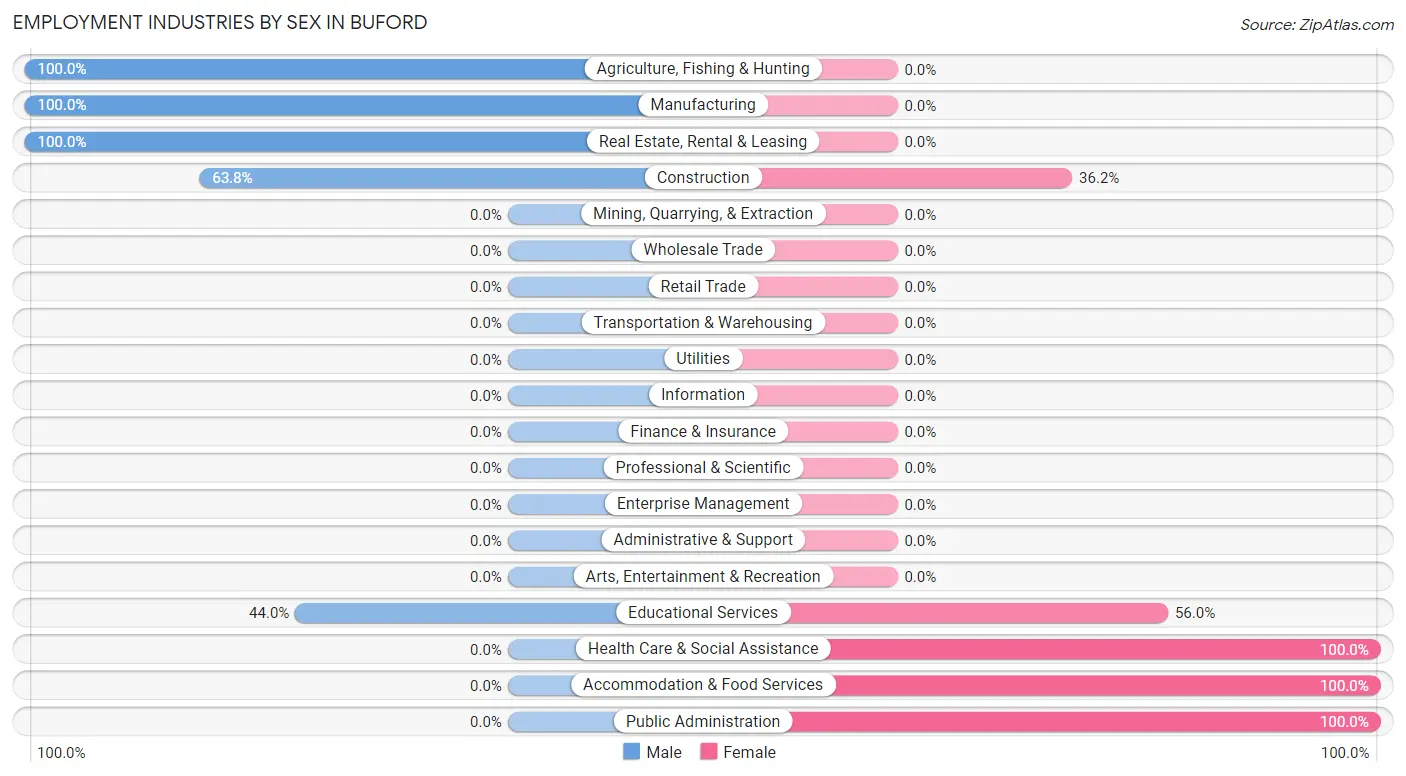
The Buford industries that see more men than women are Agriculture, Fishing & Hunting (100.0%), Manufacturing (100.0%), and Real Estate, Rental & Leasing (100.0%), whereas the industries that tend to have a higher number of women are Health Care & Social Assistance (100.0%), Accommodation & Food Services (100.0%), and Public Administration (100.0%).
| Industry | Male | Female |
| Agriculture, Fishing & Hunting | 26 (100.0%) | 0 (0.0%) |
| Mining, Quarrying, & Extraction | 0 (0.0%) | 0 (0.0%) |
| Construction | 30 (63.8%) | 17 (36.2%) |
| Manufacturing | 54 (100.0%) | 0 (0.0%) |
| Wholesale Trade | 0 (0.0%) | 0 (0.0%) |
| Retail Trade | 0 (0.0%) | 0 (0.0%) |
| Transportation & Warehousing | 0 (0.0%) | 0 (0.0%) |
| Utilities | 0 (0.0%) | 0 (0.0%) |
| Information | 0 (0.0%) | 0 (0.0%) |
| Finance & Insurance | 0 (0.0%) | 0 (0.0%) |
| Real Estate, Rental & Leasing | 6 (100.0%) | 0 (0.0%) |
| Professional & Scientific | 0 (0.0%) | 0 (0.0%) |
| Enterprise Management | 0 (0.0%) | 0 (0.0%) |
| Administrative & Support | 0 (0.0%) | 0 (0.0%) |
| Educational Services | 11 (44.0%) | 14 (56.0%) |
| Health Care & Social Assistance | 0 (0.0%) | 31 (100.0%) |
| Arts, Entertainment & Recreation | 0 (0.0%) | 0 (0.0%) |
| Accommodation & Food Services | 0 (0.0%) | 7 (100.0%) |
| Public Administration | 0 (0.0%) | 9 (100.0%) |
| Total | 127 (62.0%) | 78 (38.1%) |
Education in Buford
School Enrollment in Buford
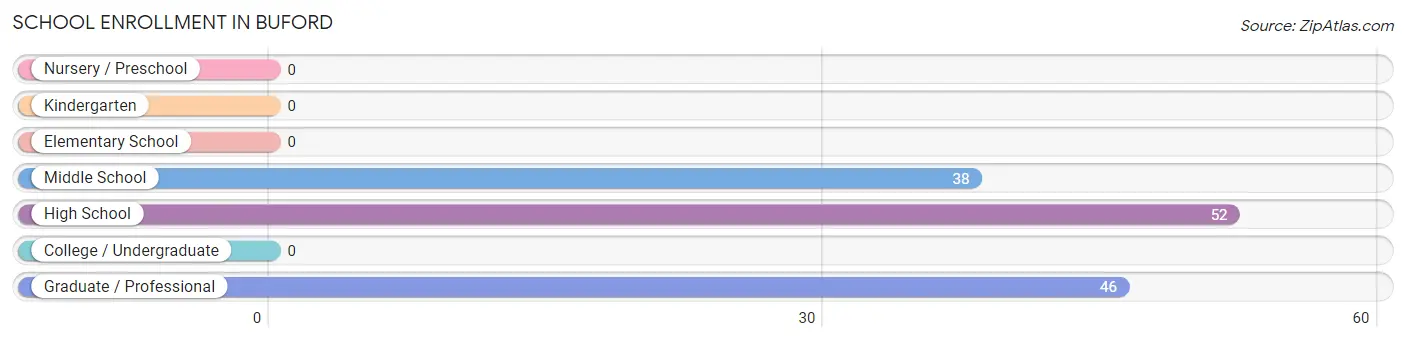
The most common levels of schooling among the 136 students in Buford are high school (52 | 38.2%), graduate / professional (46 | 33.8%), and middle school (38 | 27.9%).
| School Level | # Students | % Students |
| Nursery / Preschool | 0 | 0.0% |
| Kindergarten | 0 | 0.0% |
| Elementary School | 0 | 0.0% |
| Middle School | 38 | 27.9% |
| High School | 52 | 38.2% |
| College / Undergraduate | 0 | 0.0% |
| Graduate / Professional | 46 | 33.8% |
| Total | 136 | 100.0% |
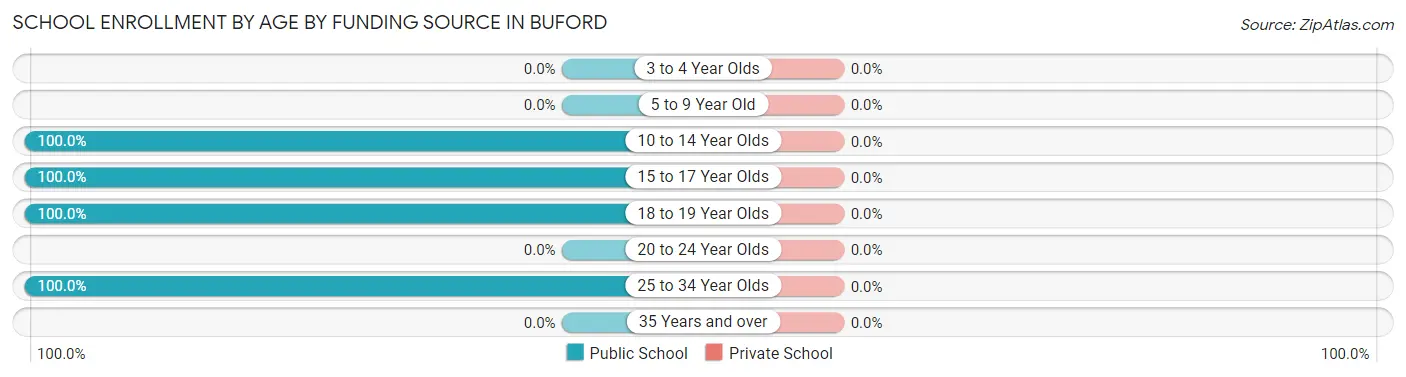
School Enrollment by Age by Funding Source in Buford
| Age Bracket | Public School | Private School |
| 3 to 4 Year Olds | 0 (0.0%) | 0 (0.0%) |
| 5 to 9 Year Old | 0 (0.0%) | 0 (0.0%) |
| 10 to 14 Year Olds | 38 (100.0%) | 0 (0.0%) |
| 15 to 17 Year Olds | 39 (100.0%) | 0 (0.0%) |
| 18 to 19 Year Olds | 13 (100.0%) | 0 (0.0%) |
| 20 to 24 Year Olds | 0 (0.0%) | 0 (0.0%) |
| 25 to 34 Year Olds | 46 (100.0%) | 0 (0.0%) |
| 35 Years and over | 0 (0.0%) | 0 (0.0%) |
| Total | 136 (100.0%) | 0 (0.0%) |
Educational Attainment by Field of Study in Buford
Education (64 | 52.9%), bio, nature & agricultural (26 | 21.5%), arts & humanities (14 | 11.6%), science & technology (10 | 8.3%), and liberal arts & history (7 | 5.8%) are the most common fields of study among 121 individuals in Buford who have obtained a bachelor's degree or higher.
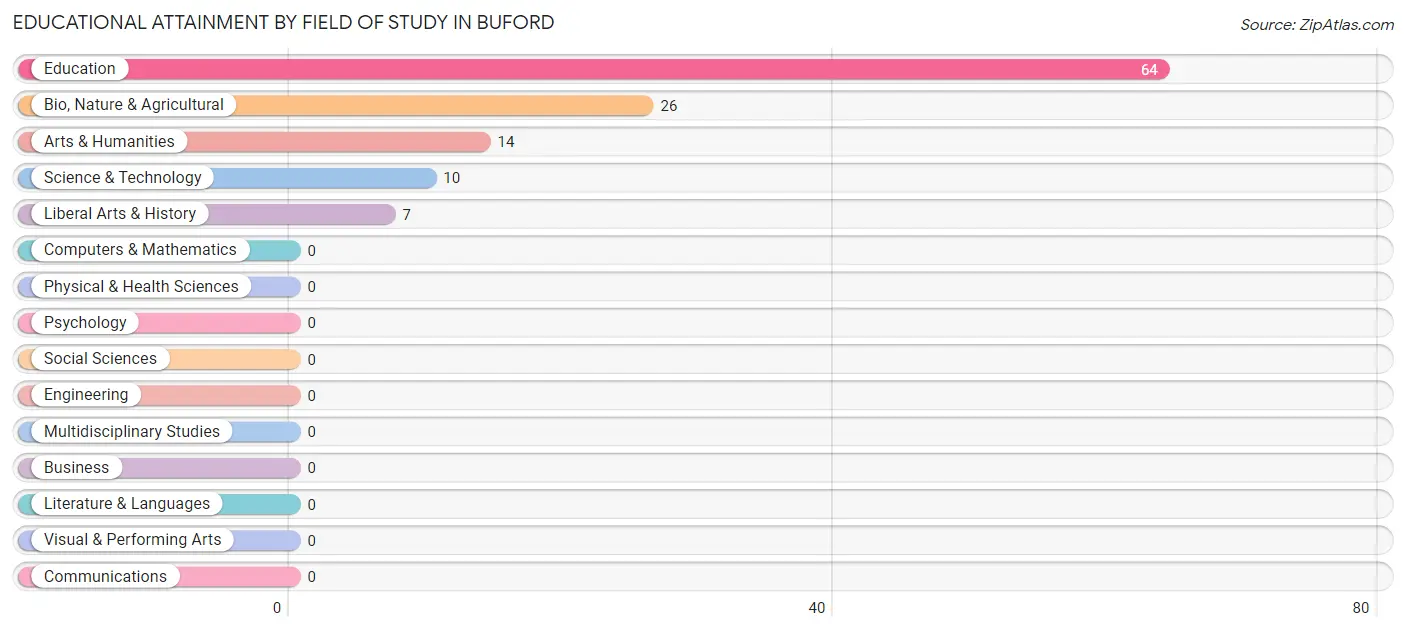
| Field of Study | # Graduates | % Graduates |
| Computers & Mathematics | 0 | 0.0% |
| Bio, Nature & Agricultural | 26 | 21.5% |
| Physical & Health Sciences | 0 | 0.0% |
| Psychology | 0 | 0.0% |
| Social Sciences | 0 | 0.0% |
| Engineering | 0 | 0.0% |
| Multidisciplinary Studies | 0 | 0.0% |
| Science & Technology | 10 | 8.3% |
| Business | 0 | 0.0% |
| Education | 64 | 52.9% |
| Literature & Languages | 0 | 0.0% |
| Liberal Arts & History | 7 | 5.8% |
| Visual & Performing Arts | 0 | 0.0% |
| Communications | 0 | 0.0% |
| Arts & Humanities | 14 | 11.6% |
| Total | 121 | 100.0% |
Transportation & Commute in Buford
Vehicle Availability by Sex in Buford
The most prevalent vehicle ownership categories in Buford are males with 2 vehicles (77, accounting for 60.6%) and females with 2 vehicles (0, making up 106.9%).
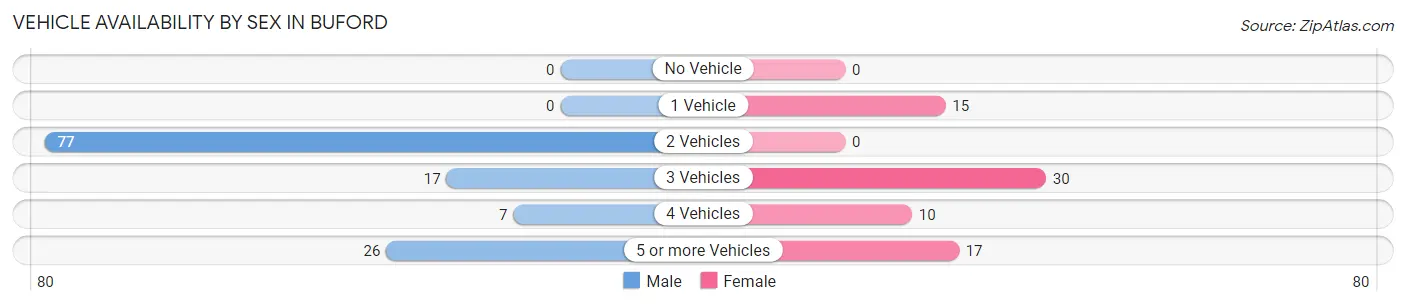
| Vehicles Available | Male | Female |
| No Vehicle | 0 (0.0%) | 0 (0.0%) |
| 1 Vehicle | 0 (0.0%) | 15 (20.8%) |
| 2 Vehicles | 77 (60.6%) | 0 (0.0%) |
| 3 Vehicles | 17 (13.4%) | 30 (41.7%) |
| 4 Vehicles | 7 (5.5%) | 10 (13.9%) |
| 5 or more Vehicles | 26 (20.5%) | 17 (23.6%) |
| Total | 127 (100.0%) | 72 (100.0%) |
Commute Time in Buford
The most frequently occuring commute durations in Buford are 60 to 89 minutes (57 commuters, 28.6%), 30 to 34 minutes (44 commuters, 22.1%), and 10 to 14 minutes (43 commuters, 21.6%).
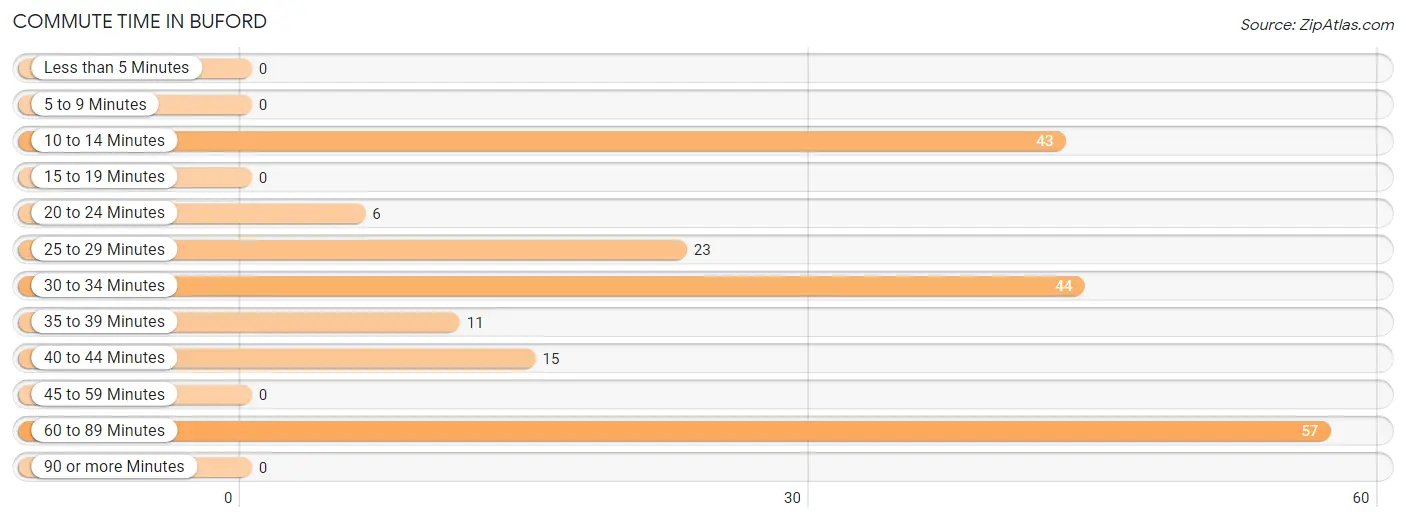
| Commute Time | # Commuters | % Commuters |
| Less than 5 Minutes | 0 | 0.0% |
| 5 to 9 Minutes | 0 | 0.0% |
| 10 to 14 Minutes | 43 | 21.6% |
| 15 to 19 Minutes | 0 | 0.0% |
| 20 to 24 Minutes | 6 | 3.0% |
| 25 to 29 Minutes | 23 | 11.6% |
| 30 to 34 Minutes | 44 | 22.1% |
| 35 to 39 Minutes | 11 | 5.5% |
| 40 to 44 Minutes | 15 | 7.5% |
| 45 to 59 Minutes | 0 | 0.0% |
| 60 to 89 Minutes | 57 | 28.6% |
| 90 or more Minutes | 0 | 0.0% |
Commute Time by Sex in Buford
The most common commute times in Buford are 60 to 89 minutes (47 commuters, 37.0%) for males and 25 to 29 minutes (23 commuters, 31.9%) for females.
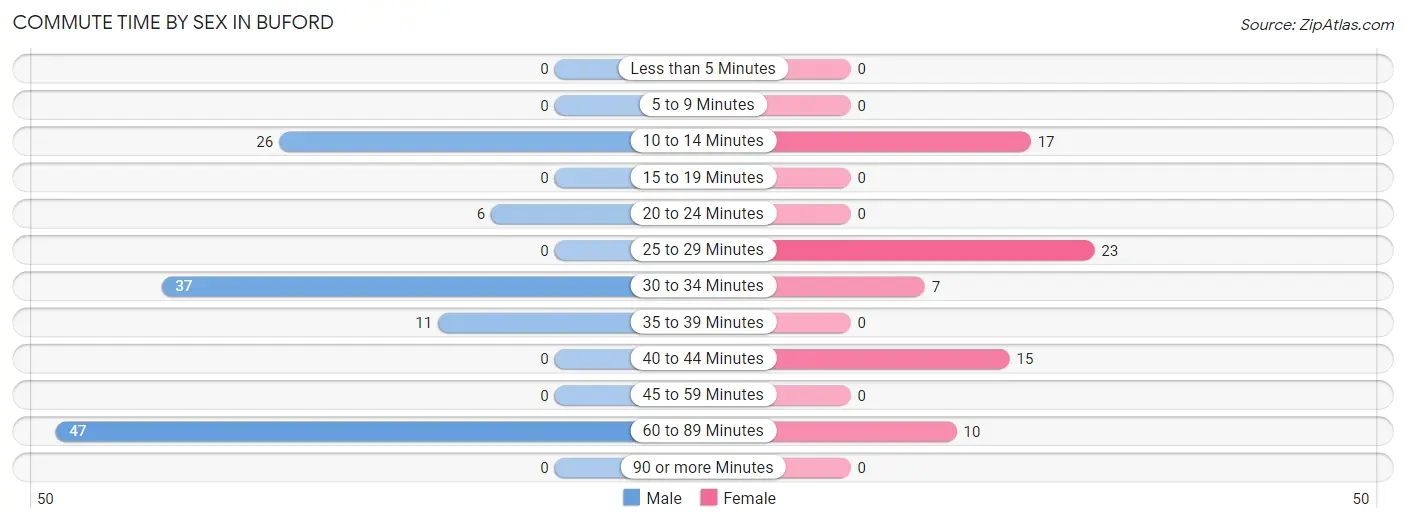
| Commute Time | Male | Female |
| Less than 5 Minutes | 0 (0.0%) | 0 (0.0%) |
| 5 to 9 Minutes | 0 (0.0%) | 0 (0.0%) |
| 10 to 14 Minutes | 26 (20.5%) | 17 (23.6%) |
| 15 to 19 Minutes | 0 (0.0%) | 0 (0.0%) |
| 20 to 24 Minutes | 6 (4.7%) | 0 (0.0%) |
| 25 to 29 Minutes | 0 (0.0%) | 23 (31.9%) |
| 30 to 34 Minutes | 37 (29.1%) | 7 (9.7%) |
| 35 to 39 Minutes | 11 (8.7%) | 0 (0.0%) |
| 40 to 44 Minutes | 0 (0.0%) | 15 (20.8%) |
| 45 to 59 Minutes | 0 (0.0%) | 0 (0.0%) |
| 60 to 89 Minutes | 47 (37.0%) | 10 (13.9%) |
| 90 or more Minutes | 0 (0.0%) | 0 (0.0%) |
Time of Departure to Work by Sex in Buford
The most frequent times of departure to work in Buford are 4:00 PM to 11:59 PM (47, 37.0%) for males and 6:30 AM to 6:59 AM (48, 66.7%) for females.
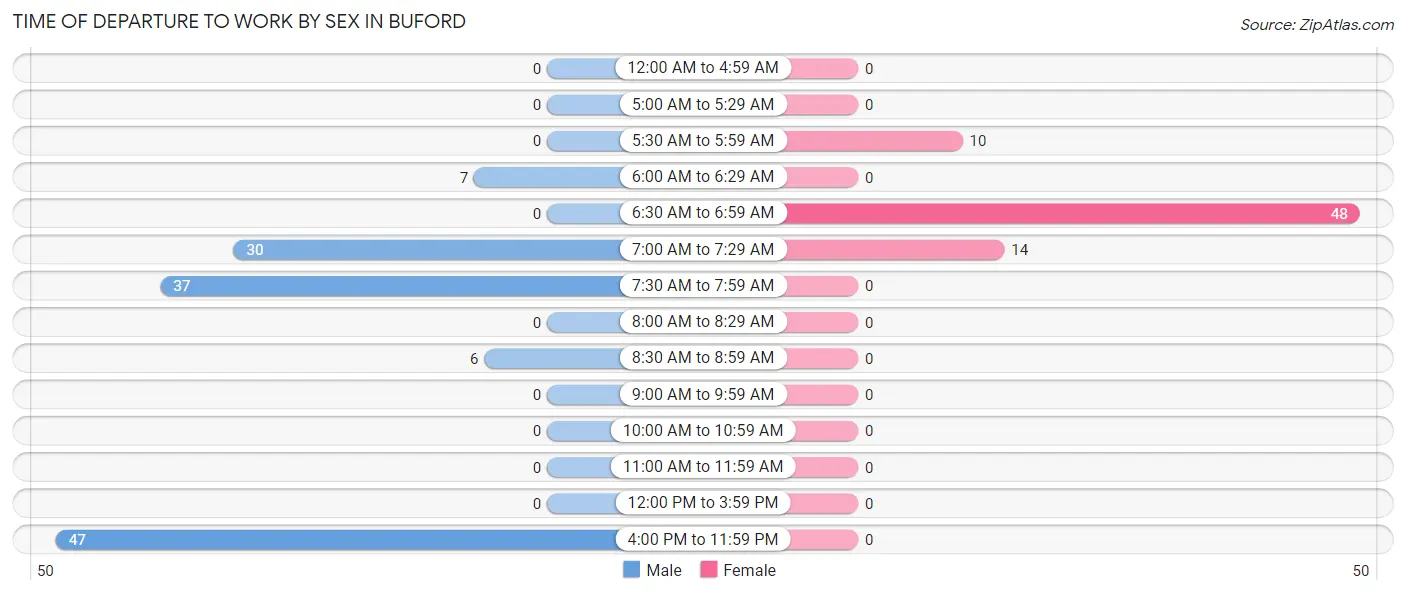
| Time of Departure | Male | Female |
| 12:00 AM to 4:59 AM | 0 (0.0%) | 0 (0.0%) |
| 5:00 AM to 5:29 AM | 0 (0.0%) | 0 (0.0%) |
| 5:30 AM to 5:59 AM | 0 (0.0%) | 10 (13.9%) |
| 6:00 AM to 6:29 AM | 7 (5.5%) | 0 (0.0%) |
| 6:30 AM to 6:59 AM | 0 (0.0%) | 48 (66.7%) |
| 7:00 AM to 7:29 AM | 30 (23.6%) | 14 (19.4%) |
| 7:30 AM to 7:59 AM | 37 (29.1%) | 0 (0.0%) |
| 8:00 AM to 8:29 AM | 0 (0.0%) | 0 (0.0%) |
| 8:30 AM to 8:59 AM | 6 (4.7%) | 0 (0.0%) |
| 9:00 AM to 9:59 AM | 0 (0.0%) | 0 (0.0%) |
| 10:00 AM to 10:59 AM | 0 (0.0%) | 0 (0.0%) |
| 11:00 AM to 11:59 AM | 0 (0.0%) | 0 (0.0%) |
| 12:00 PM to 3:59 PM | 0 (0.0%) | 0 (0.0%) |
| 4:00 PM to 11:59 PM | 47 (37.0%) | 0 (0.0%) |
| Total | 127 (100.0%) | 72 (100.0%) |
Housing Occupancy in Buford
Occupancy by Ownership in Buford
Of the total 160 dwellings in Buford, owner-occupied units account for 154 (96.3%), while renter-occupied units make up 6 (3.7%).
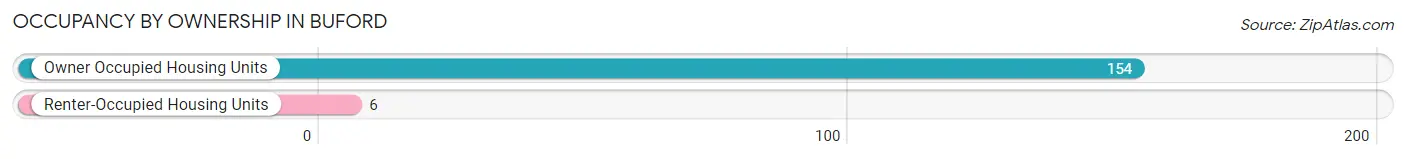
| Occupancy | # Housing Units | % Housing Units |
| Owner Occupied Housing Units | 154 | 96.3% |
| Renter-Occupied Housing Units | 6 | 3.7% |
| Total Occupied Housing Units | 160 | 100.0% |
Occupancy by Household Size in Buford
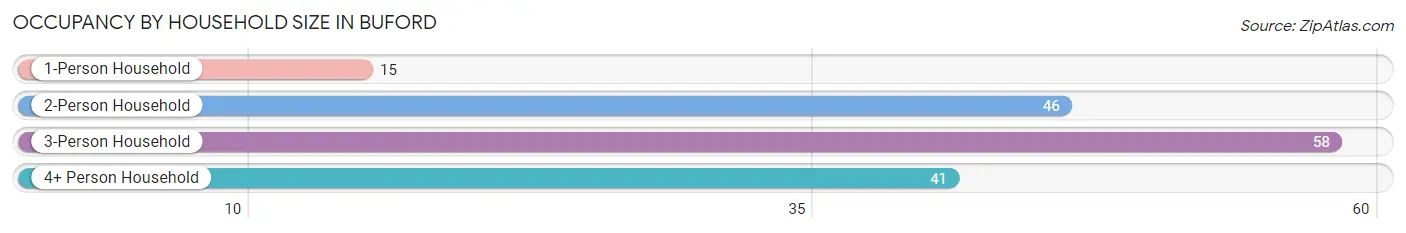
| Household Size | # Housing Units | % Housing Units |
| 1-Person Household | 15 | 9.4% |
| 2-Person Household | 46 | 28.7% |
| 3-Person Household | 58 | 36.2% |
| 4+ Person Household | 41 | 25.6% |
| Total Housing Units | 160 | 100.0% |
Occupancy by Ownership by Household Size in Buford
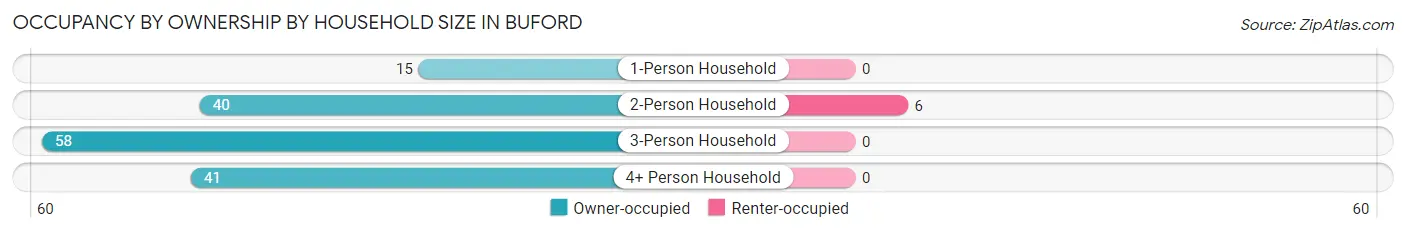
| Household Size | Owner-occupied | Renter-occupied |
| 1-Person Household | 15 (100.0%) | 0 (0.0%) |
| 2-Person Household | 40 (87.0%) | 6 (13.0%) |
| 3-Person Household | 58 (100.0%) | 0 (0.0%) |
| 4+ Person Household | 41 (100.0%) | 0 (0.0%) |
| Total Housing Units | 154 (96.3%) | 6 (3.7%) |
Occupancy by Educational Attainment in Buford
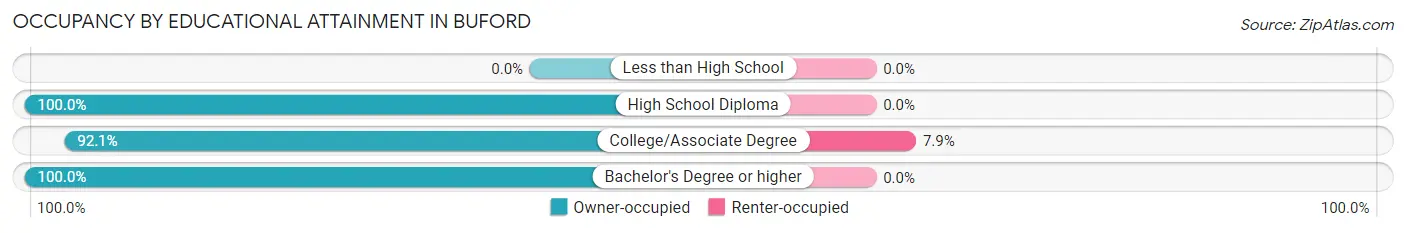
| Household Size | Owner-occupied | Renter-occupied |
| Less than High School | 0 (0.0%) | 0 (0.0%) |
| High School Diploma | 30 (100.0%) | 0 (0.0%) |
| College/Associate Degree | 70 (92.1%) | 6 (7.9%) |
| Bachelor's Degree or higher | 54 (100.0%) | 0 (0.0%) |
Occupancy by Age of Householder in Buford
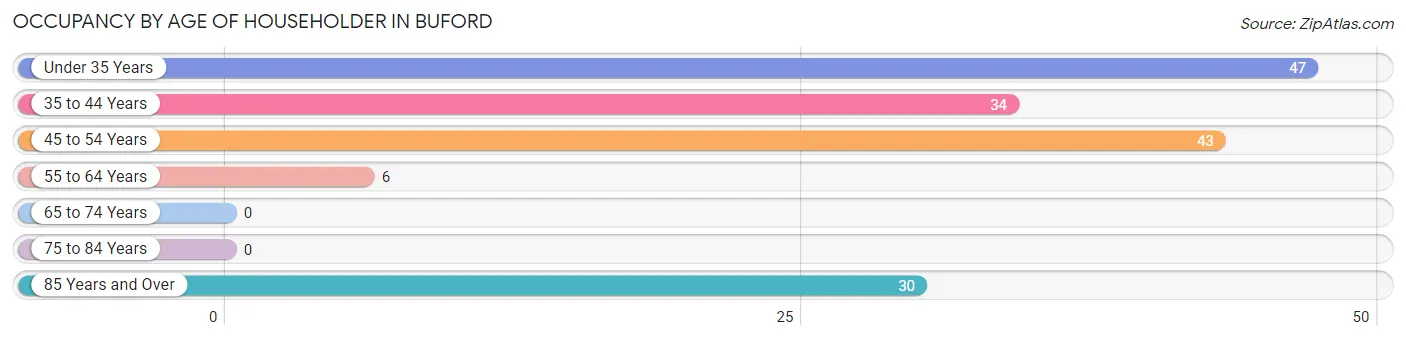
| Age Bracket | # Households | % Households |
| Under 35 Years | 47 | 29.4% |
| 35 to 44 Years | 34 | 21.2% |
| 45 to 54 Years | 43 | 26.9% |
| 55 to 64 Years | 6 | 3.7% |
| 65 to 74 Years | 0 | 0.0% |
| 75 to 84 Years | 0 | 0.0% |
| 85 Years and Over | 30 | 18.8% |
| Total | 160 | 100.0% |
Housing Finances in Buford
Median Income by Occupancy in Buford
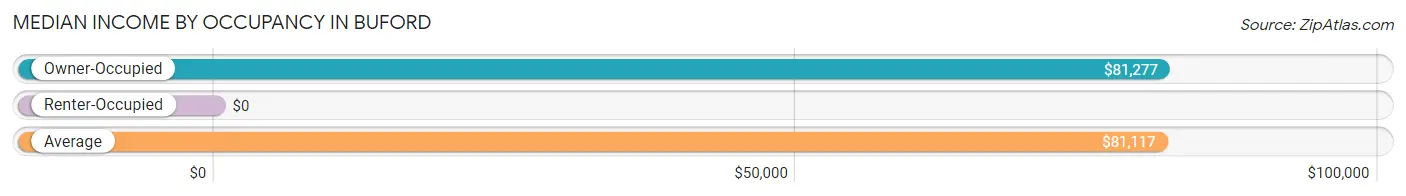
| Occupancy Type | # Households | Median Income |
| Owner-Occupied | 154 (96.3%) | $81,277 |
| Renter-Occupied | 6 (3.7%) | $0 |
| Average | 160 (100.0%) | $81,117 |
Occupancy by Householder Income Bracket in Buford
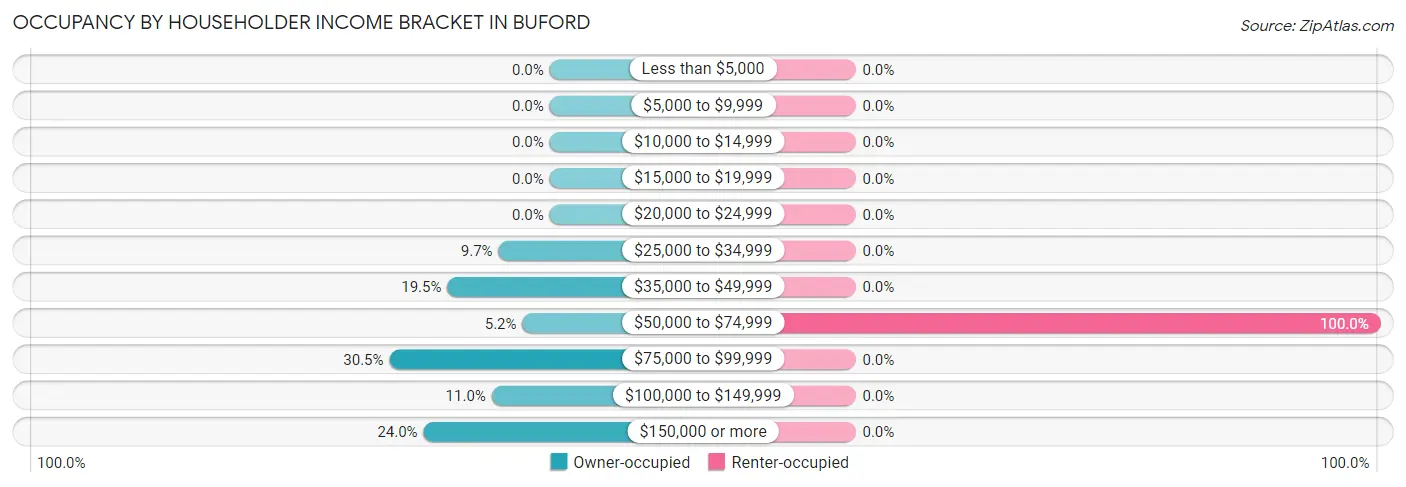
| Income Bracket | Owner-occupied | Renter-occupied |
| Less than $5,000 | 0 (0.0%) | 0 (0.0%) |
| $5,000 to $9,999 | 0 (0.0%) | 0 (0.0%) |
| $10,000 to $14,999 | 0 (0.0%) | 0 (0.0%) |
| $15,000 to $19,999 | 0 (0.0%) | 0 (0.0%) |
| $20,000 to $24,999 | 0 (0.0%) | 0 (0.0%) |
| $25,000 to $34,999 | 15 (9.7%) | 0 (0.0%) |
| $35,000 to $49,999 | 30 (19.5%) | 0 (0.0%) |
| $50,000 to $74,999 | 8 (5.2%) | 6 (100.0%) |
| $75,000 to $99,999 | 47 (30.5%) | 0 (0.0%) |
| $100,000 to $149,999 | 17 (11.0%) | 0 (0.0%) |
| $150,000 or more | 37 (24.0%) | 0 (0.0%) |
| Total | 154 (100.0%) | 6 (100.0%) |
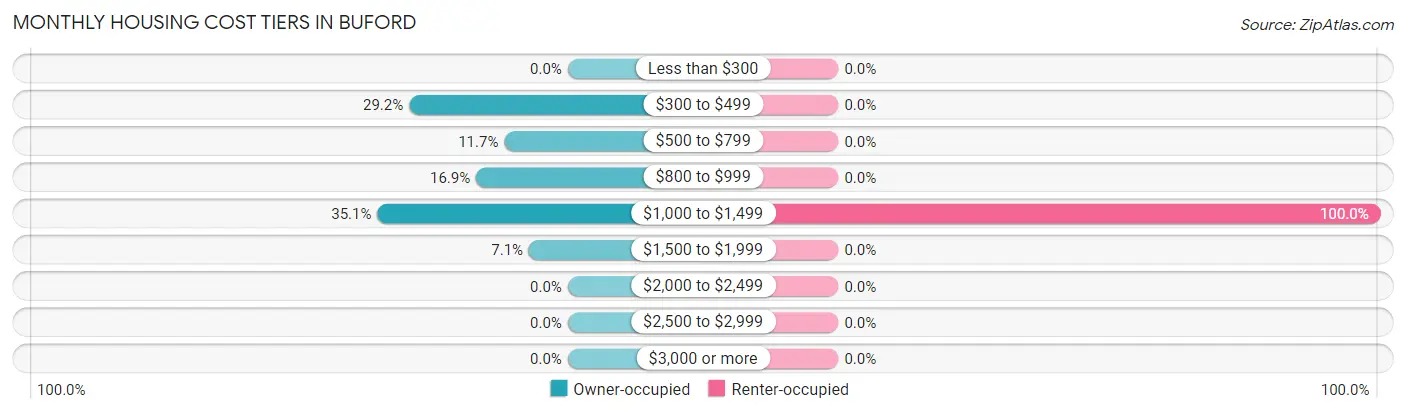
Monthly Housing Cost Tiers in Buford
| Monthly Cost | Owner-occupied | Renter-occupied |
| Less than $300 | 0 (0.0%) | 0 (0.0%) |
| $300 to $499 | 45 (29.2%) | 0 (0.0%) |
| $500 to $799 | 18 (11.7%) | 0 (0.0%) |
| $800 to $999 | 26 (16.9%) | 0 (0.0%) |
| $1,000 to $1,499 | 54 (35.1%) | 6 (100.0%) |
| $1,500 to $1,999 | 11 (7.1%) | 0 (0.0%) |
| $2,000 to $2,499 | 0 (0.0%) | 0 (0.0%) |
| $2,500 to $2,999 | 0 (0.0%) | 0 (0.0%) |
| $3,000 or more | 0 (0.0%) | 0 (0.0%) |
| Total | 154 (100.0%) | 6 (100.0%) |
Physical Housing Characteristics in Buford
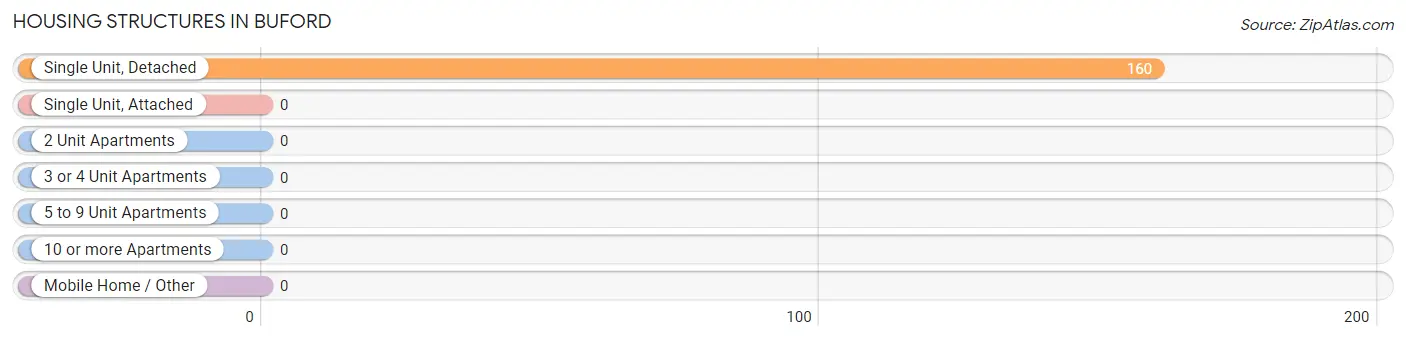
Housing Structures in Buford
| Structure Type | # Housing Units | % Housing Units |
| Single Unit, Detached | 160 | 100.0% |
| Single Unit, Attached | 0 | 0.0% |
| 2 Unit Apartments | 0 | 0.0% |
| 3 or 4 Unit Apartments | 0 | 0.0% |
| 5 to 9 Unit Apartments | 0 | 0.0% |
| 10 or more Apartments | 0 | 0.0% |
| Mobile Home / Other | 0 | 0.0% |
| Total | 160 | 100.0% |
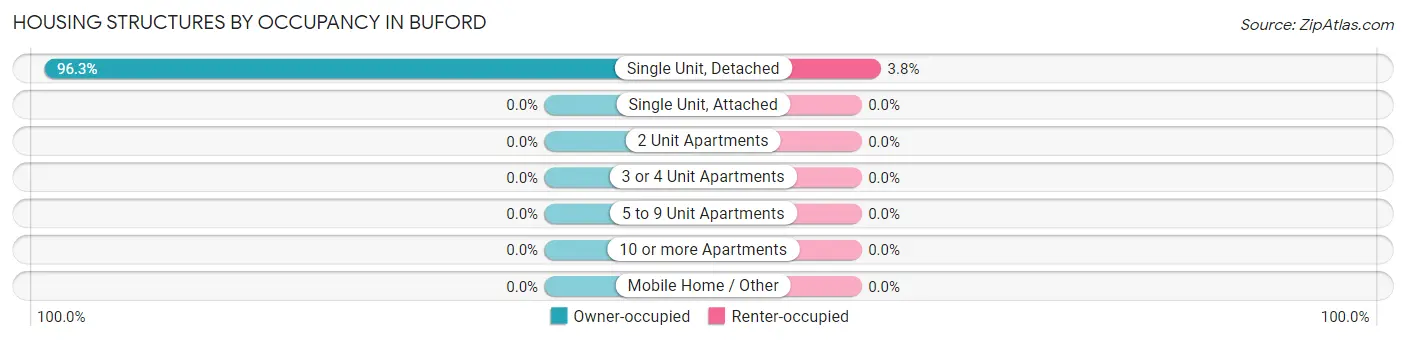
Housing Structures by Occupancy in Buford
| Structure Type | Owner-occupied | Renter-occupied |
| Single Unit, Detached | 154 (96.3%) | 6 (3.7%) |
| Single Unit, Attached | 0 (0.0%) | 0 (0.0%) |
| 2 Unit Apartments | 0 (0.0%) | 0 (0.0%) |
| 3 or 4 Unit Apartments | 0 (0.0%) | 0 (0.0%) |
| 5 to 9 Unit Apartments | 0 (0.0%) | 0 (0.0%) |
| 10 or more Apartments | 0 (0.0%) | 0 (0.0%) |
| Mobile Home / Other | 0 (0.0%) | 0 (0.0%) |
| Total | 154 (96.3%) | 6 (3.7%) |
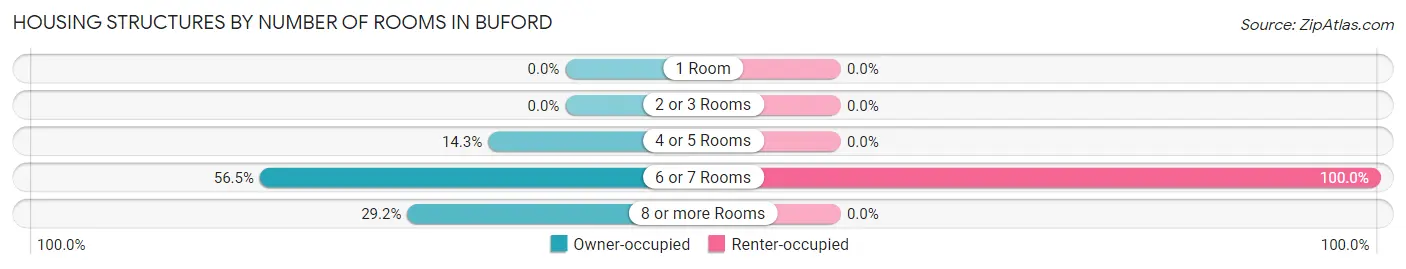
Housing Structures by Number of Rooms in Buford
| Number of Rooms | Owner-occupied | Renter-occupied |
| 1 Room | 0 (0.0%) | 0 (0.0%) |
| 2 or 3 Rooms | 0 (0.0%) | 0 (0.0%) |
| 4 or 5 Rooms | 22 (14.3%) | 0 (0.0%) |
| 6 or 7 Rooms | 87 (56.5%) | 6 (100.0%) |
| 8 or more Rooms | 45 (29.2%) | 0 (0.0%) |
| Total | 154 (100.0%) | 6 (100.0%) |
Housing Structure by Heating Type in Buford
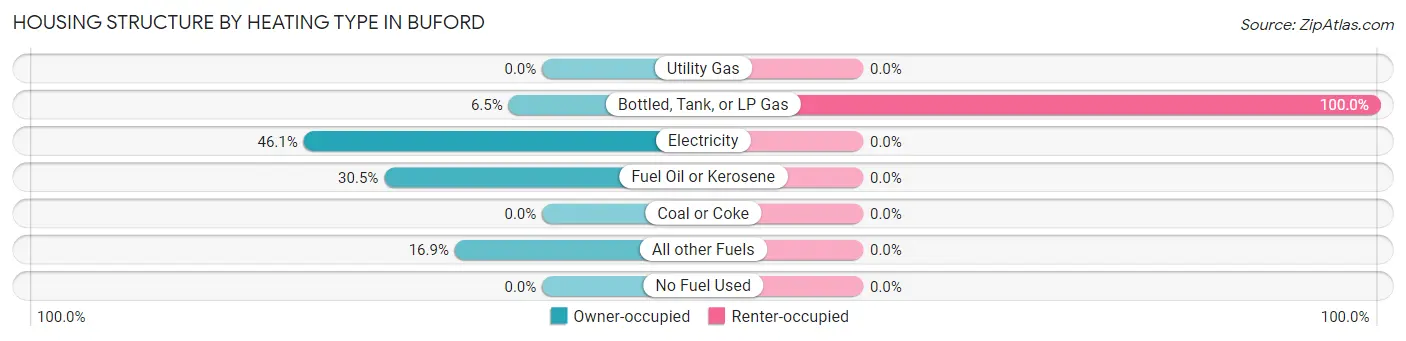
| Heating Type | Owner-occupied | Renter-occupied |
| Utility Gas | 0 (0.0%) | 0 (0.0%) |
| Bottled, Tank, or LP Gas | 10 (6.5%) | 6 (100.0%) |
| Electricity | 71 (46.1%) | 0 (0.0%) |
| Fuel Oil or Kerosene | 47 (30.5%) | 0 (0.0%) |
| Coal or Coke | 0 (0.0%) | 0 (0.0%) |
| All other Fuels | 26 (16.9%) | 0 (0.0%) |
| No Fuel Used | 0 (0.0%) | 0 (0.0%) |
| Total | 154 (100.0%) | 6 (100.0%) |
Household Vehicle Usage in Buford
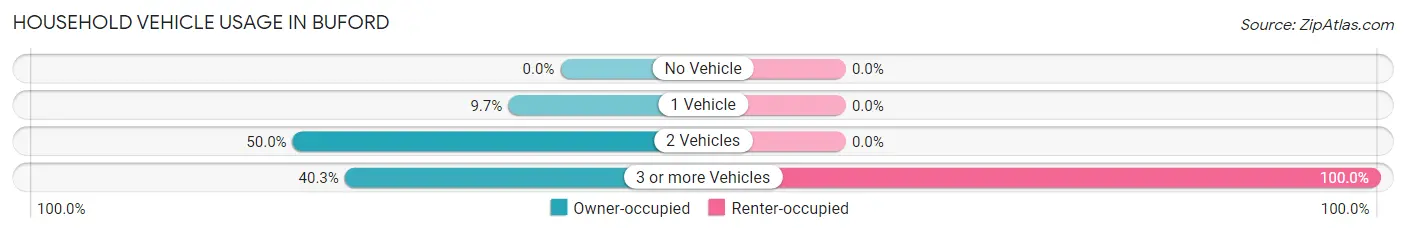
| Vehicles per Household | Owner-occupied | Renter-occupied |
| No Vehicle | 0 (0.0%) | 0 (0.0%) |
| 1 Vehicle | 15 (9.7%) | 0 (0.0%) |
| 2 Vehicles | 77 (50.0%) | 0 (0.0%) |
| 3 or more Vehicles | 62 (40.3%) | 6 (100.0%) |
| Total | 154 (100.0%) | 6 (100.0%) |
Real Estate & Mortgages in Buford
Real Estate and Mortgage Overview in Buford
| Characteristic | Without Mortgage | With Mortgage |
| Housing Units | 48 | 106 |
| Median Property Value | - | - |
| Median Household Income | $49,500 | $37 |
| Monthly Housing Costs | - | - |
| Real Estate Taxes | - | - |
Property Value by Mortgage Status in Buford
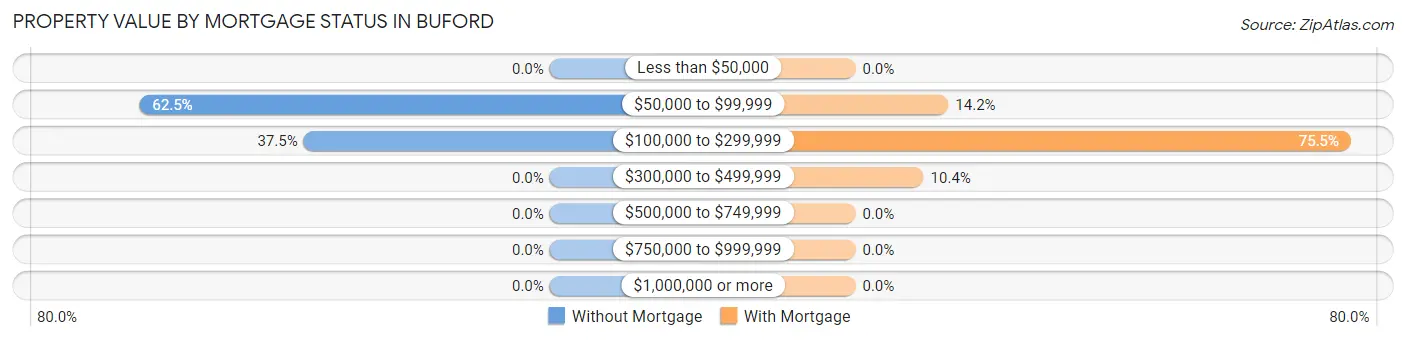
| Property Value | Without Mortgage | With Mortgage |
| Less than $50,000 | 0 (0.0%) | 0 (0.0%) |
| $50,000 to $99,999 | 30 (62.5%) | 15 (14.1%) |
| $100,000 to $299,999 | 18 (37.5%) | 80 (75.5%) |
| $300,000 to $499,999 | 0 (0.0%) | 11 (10.4%) |
| $500,000 to $749,999 | 0 (0.0%) | 0 (0.0%) |
| $750,000 to $999,999 | 0 (0.0%) | 0 (0.0%) |
| $1,000,000 or more | 0 (0.0%) | 0 (0.0%) |
| Total | 48 (100.0%) | 106 (100.0%) |
Household Income by Mortgage Status in Buford
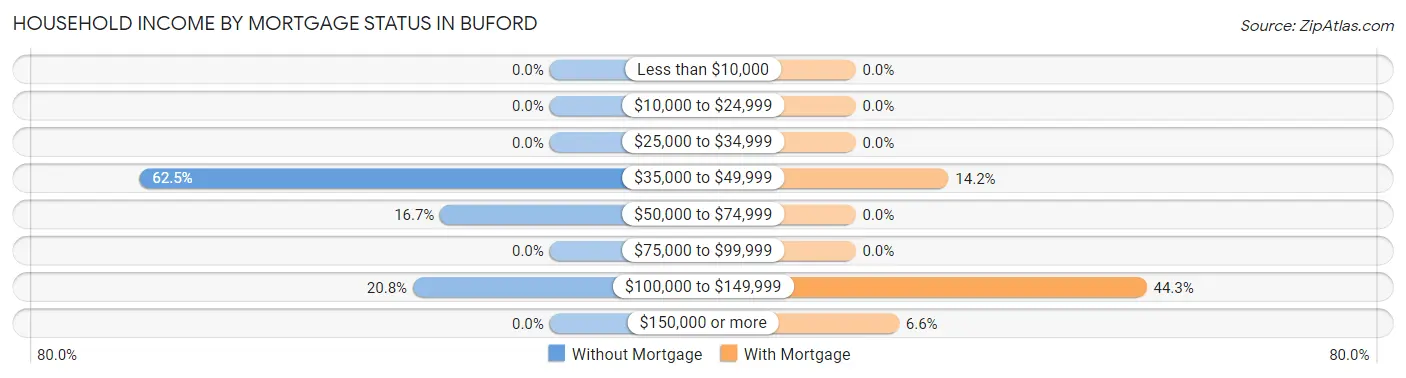
| Household Income | Without Mortgage | With Mortgage |
| Less than $10,000 | 0 (0.0%) | 0 (0.0%) |
| $10,000 to $24,999 | 0 (0.0%) | 0 (0.0%) |
| $25,000 to $34,999 | 0 (0.0%) | 0 (0.0%) |
| $35,000 to $49,999 | 30 (62.5%) | 15 (14.1%) |
| $50,000 to $74,999 | 8 (16.7%) | 0 (0.0%) |
| $75,000 to $99,999 | 0 (0.0%) | 0 (0.0%) |
| $100,000 to $149,999 | 10 (20.8%) | 47 (44.3%) |
| $150,000 or more | 0 (0.0%) | 7 (6.6%) |
| Total | 48 (100.0%) | 106 (100.0%) |
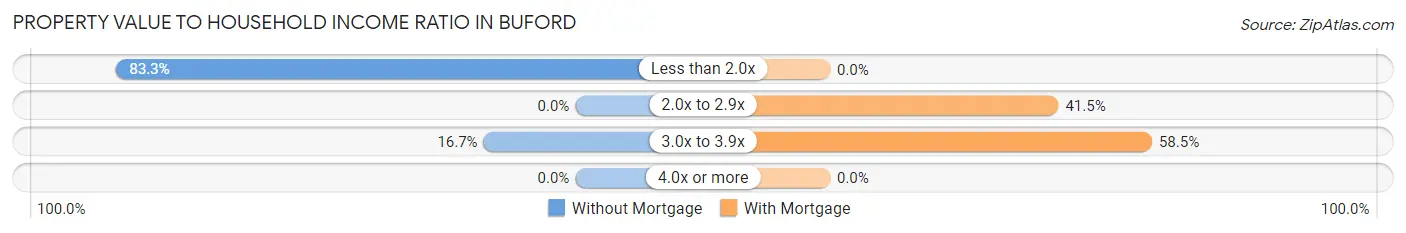
Property Value to Household Income Ratio in Buford
| Value-to-Income Ratio | Without Mortgage | With Mortgage |
| Less than 2.0x | 40 (83.3%) | 0 (0.0%) |
| 2.0x to 2.9x | 0 (0.0%) | 44 (41.5%) |
| 3.0x to 3.9x | 8 (16.7%) | 62 (58.5%) |
| 4.0x or more | 0 (0.0%) | 0 (0.0%) |
| Total | 48 (100.0%) | 106 (100.0%) |
Real Estate Taxes by Mortgage Status in Buford
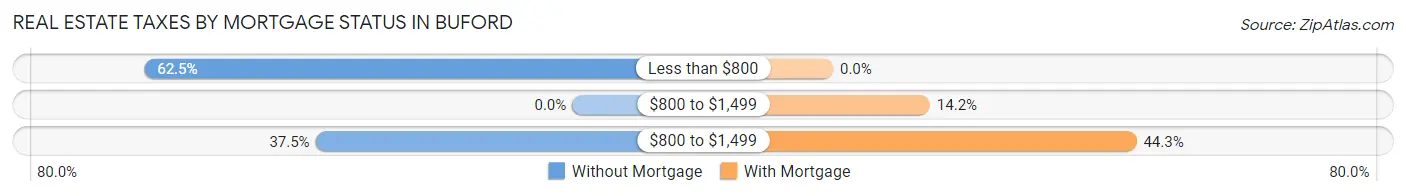
| Property Taxes | Without Mortgage | With Mortgage |
| Less than $800 | 30 (62.5%) | 0 (0.0%) |
| $800 to $1,499 | 0 (0.0%) | 15 (14.1%) |
| $800 to $1,499 | 18 (37.5%) | 47 (44.3%) |
| Total | 48 (100.0%) | 106 (100.0%) |
Health & Disability in Buford
Health Insurance Coverage by Age in Buford
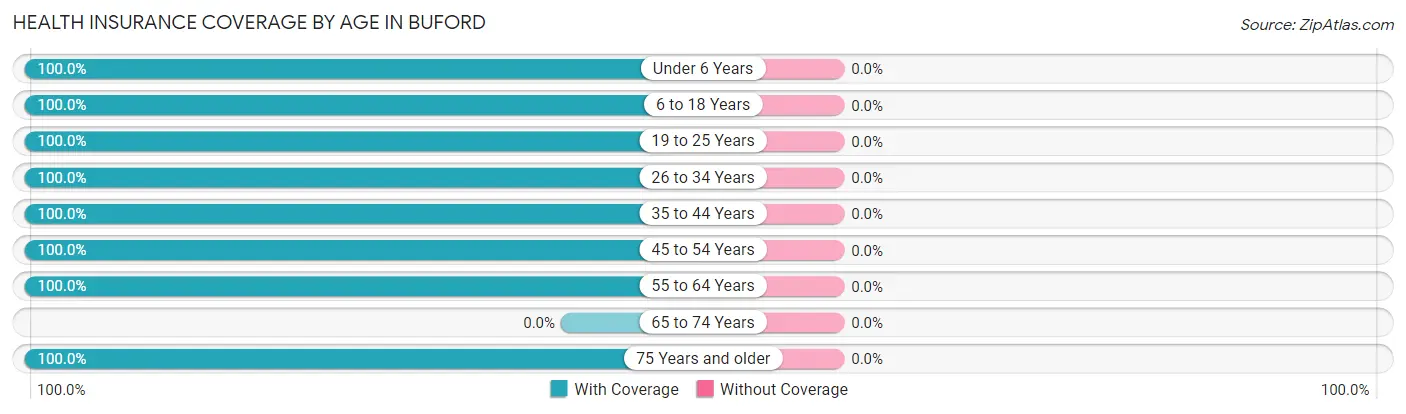
| Age Bracket | With Coverage | Without Coverage |
| Under 6 Years | 53 (100.0%) | 0 (0.0%) |
| 6 to 18 Years | 90 (100.0%) | 0 (0.0%) |
| 19 to 25 Years | 30 (100.0%) | 0 (0.0%) |
| 26 to 34 Years | 93 (100.0%) | 0 (0.0%) |
| 35 to 44 Years | 63 (100.0%) | 0 (0.0%) |
| 45 to 54 Years | 67 (100.0%) | 0 (0.0%) |
| 55 to 64 Years | 13 (100.0%) | 0 (0.0%) |
| 65 to 74 Years | 0 (0.0%) | 0 (0.0%) |
| 75 Years and older | 30 (100.0%) | 0 (0.0%) |
| Total | 439 (100.0%) | 0 (0.0%) |
Health Insurance Coverage by Citizenship Status in Buford

| Citizenship Status | With Coverage | Without Coverage |
| Native Born | 53 (100.0%) | 0 (0.0%) |
| Foreign Born, Citizen | 90 (100.0%) | 0 (0.0%) |
| Foreign Born, not a Citizen | 30 (100.0%) | 0 (0.0%) |
Health Insurance Coverage by Household Income in Buford
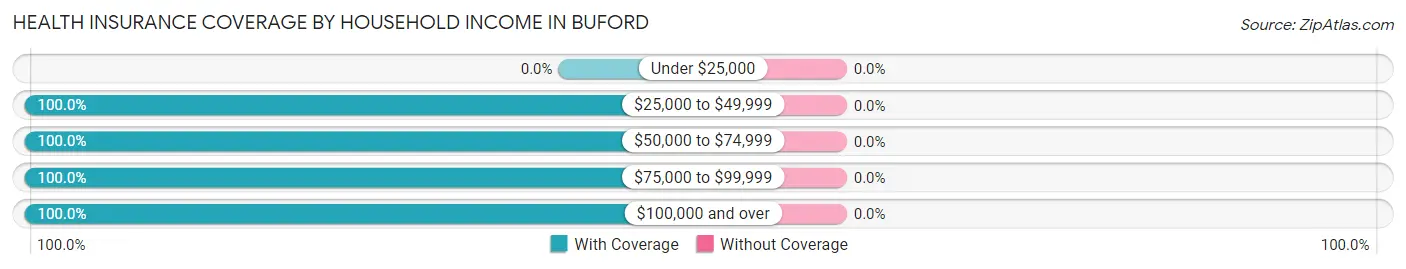
| Household Income | With Coverage | Without Coverage |
| Under $25,000 | 0 (0.0%) | 0 (0.0%) |
| $25,000 to $49,999 | 75 (100.0%) | 0 (0.0%) |
| $50,000 to $74,999 | 55 (100.0%) | 0 (0.0%) |
| $75,000 to $99,999 | 132 (100.0%) | 0 (0.0%) |
| $100,000 and over | 177 (100.0%) | 0 (0.0%) |
Public vs Private Health Insurance Coverage by Age in Buford
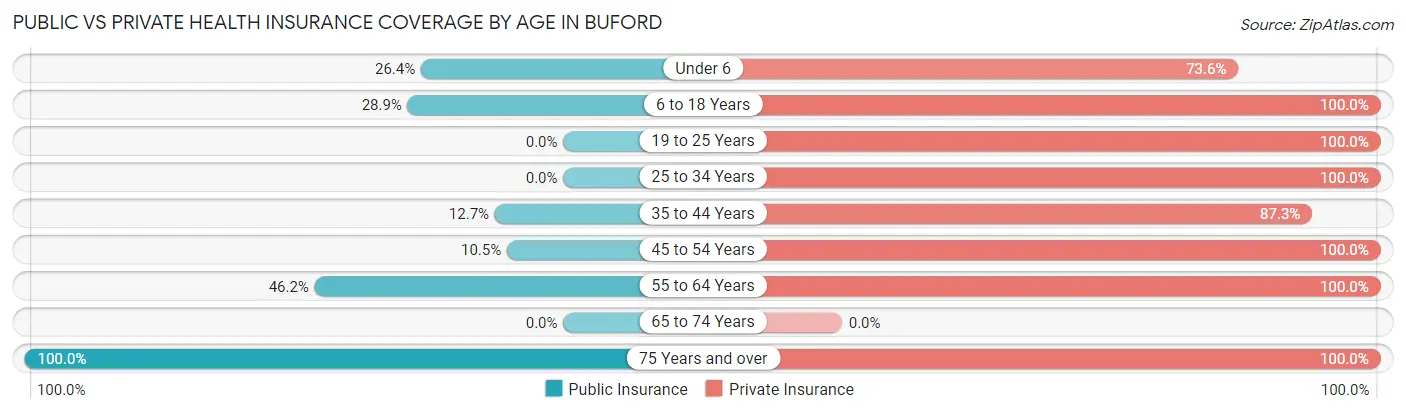
| Age Bracket | Public Insurance | Private Insurance |
| Under 6 | 14 (26.4%) | 39 (73.6%) |
| 6 to 18 Years | 26 (28.9%) | 90 (100.0%) |
| 19 to 25 Years | 0 (0.0%) | 30 (100.0%) |
| 25 to 34 Years | 0 (0.0%) | 93 (100.0%) |
| 35 to 44 Years | 8 (12.7%) | 55 (87.3%) |
| 45 to 54 Years | 7 (10.4%) | 67 (100.0%) |
| 55 to 64 Years | 6 (46.2%) | 13 (100.0%) |
| 65 to 74 Years | 0 (0.0%) | 0 (0.0%) |
| 75 Years and over | 30 (100.0%) | 30 (100.0%) |
| Total | 91 (20.7%) | 417 (95.0%) |
Disability Status by Sex by Age in Buford
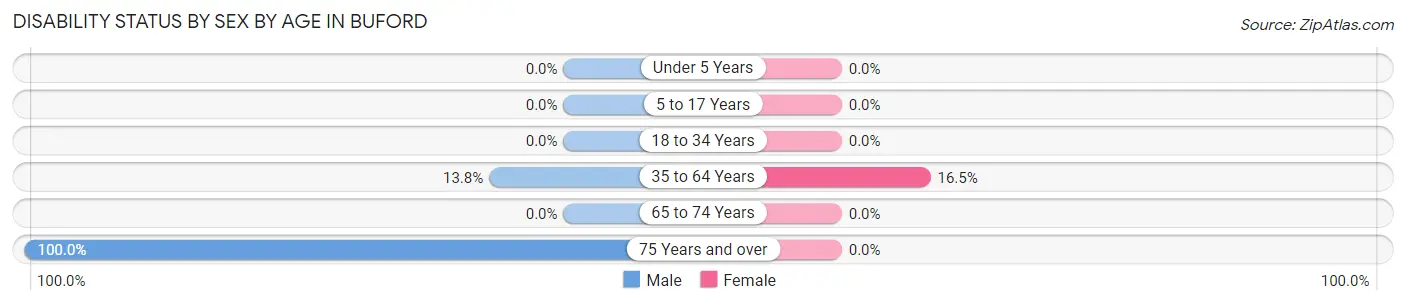
| Age Bracket | Male | Female |
| Under 5 Years | 0 (0.0%) | 0 (0.0%) |
| 5 to 17 Years | 0 (0.0%) | 0 (0.0%) |
| 18 to 34 Years | 0 (0.0%) | 0 (0.0%) |
| 35 to 64 Years | 8 (13.8%) | 14 (16.5%) |
| 65 to 74 Years | 0 (0.0%) | 0 (0.0%) |
| 75 Years and over | 30 (100.0%) | 0 (0.0%) |
Disability Class by Sex by Age in Buford
Disability Class: Hearing Difficulty
| Age Bracket | Male | Female |
| Under 5 Years | 0 (0.0%) | 0 (0.0%) |
| 5 to 17 Years | 0 (0.0%) | 0 (0.0%) |
| 18 to 34 Years | 0 (0.0%) | 0 (0.0%) |
| 35 to 64 Years | 0 (0.0%) | 0 (0.0%) |
| 65 to 74 Years | 0 (0.0%) | 0 (0.0%) |
| 75 Years and over | 0 (0.0%) | 0 (0.0%) |
Disability Class: Vision Difficulty
| Age Bracket | Male | Female |
| Under 5 Years | 0 (0.0%) | 0 (0.0%) |
| 5 to 17 Years | 0 (0.0%) | 0 (0.0%) |
| 18 to 34 Years | 0 (0.0%) | 0 (0.0%) |
| 35 to 64 Years | 0 (0.0%) | 0 (0.0%) |
| 65 to 74 Years | 0 (0.0%) | 0 (0.0%) |
| 75 Years and over | 0 (0.0%) | 0 (0.0%) |
Disability Class: Cognitive Difficulty
| Age Bracket | Male | Female |
| 5 to 17 Years | 0 (0.0%) | 0 (0.0%) |
| 18 to 34 Years | 0 (0.0%) | 0 (0.0%) |
| 35 to 64 Years | 0 (0.0%) | 0 (0.0%) |
| 65 to 74 Years | 0 (0.0%) | 0 (0.0%) |
| 75 Years and over | 0 (0.0%) | 0 (0.0%) |
Disability Class: Ambulatory Difficulty
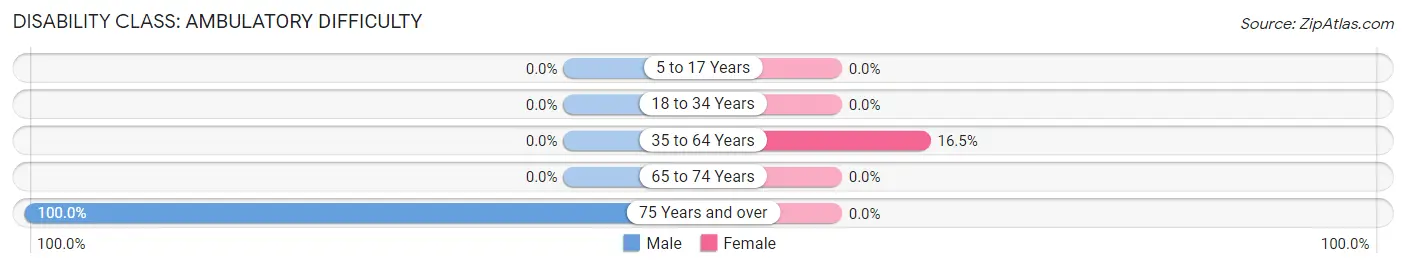
| Age Bracket | Male | Female |
| 5 to 17 Years | 0 (0.0%) | 0 (0.0%) |
| 18 to 34 Years | 0 (0.0%) | 0 (0.0%) |
| 35 to 64 Years | 0 (0.0%) | 14 (16.5%) |
| 65 to 74 Years | 0 (0.0%) | 0 (0.0%) |
| 75 Years and over | 30 (100.0%) | 0 (0.0%) |
Disability Class: Self-Care Difficulty
| Age Bracket | Male | Female |
| 5 to 17 Years | 0 (0.0%) | 0 (0.0%) |
| 18 to 34 Years | 0 (0.0%) | 0 (0.0%) |
| 35 to 64 Years | 0 (0.0%) | 0 (0.0%) |
| 65 to 74 Years | 0 (0.0%) | 0 (0.0%) |
| 75 Years and over | 0 (0.0%) | 0 (0.0%) |
Technology Access in Buford
Computing Device Access in Buford
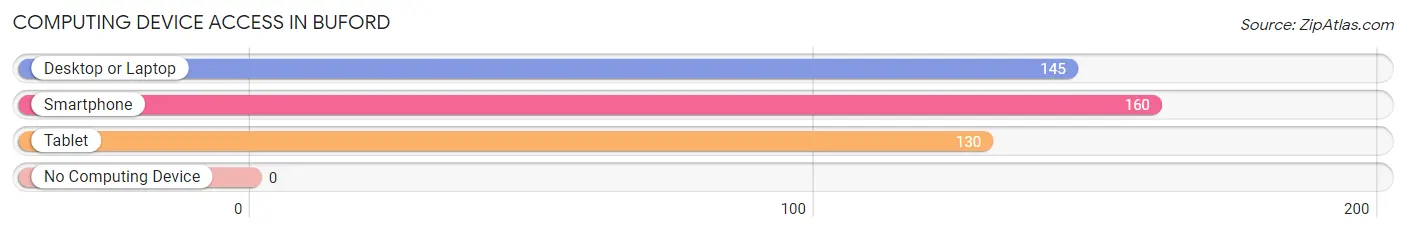
| Device Type | # Households | % Households |
| Desktop or Laptop | 145 | 90.6% |
| Smartphone | 160 | 100.0% |
| Tablet | 130 | 81.2% |
| No Computing Device | 0 | 0.0% |
| Total | 160 | 100.0% |
Internet Access in Buford
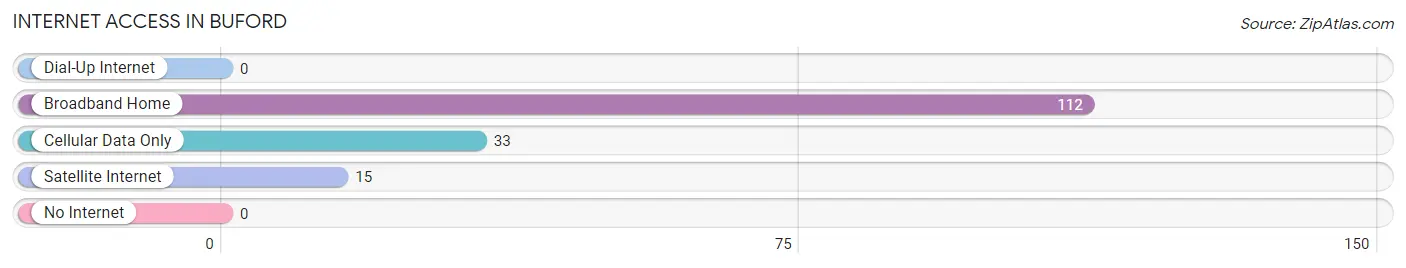
| Internet Type | # Households | % Households |
| Dial-Up Internet | 0 | 0.0% |
| Broadband Home | 112 | 70.0% |
| Cellular Data Only | 33 | 20.6% |
| Satellite Internet | 15 | 9.4% |
| No Internet | 0 | 0.0% |
| Total | 160 | 100.0% |
Buford Summary
Buford, Ohio is a small village located in the southeastern corner of Ohio, in the Appalachian region of the state. It is situated in the foothills of the Appalachian Mountains, and is surrounded by rolling hills and lush forests. The village is located in the county of Lawrence, and is part of the Ironton-Lawrence County Metropolitan Statistical Area. The population of Buford was estimated to be 1,072 in the year 2000, making it one of the smallest villages in the state.
Geography
Buford is located in the southeastern corner of Ohio, in the Appalachian region of the state. It is situated in the foothills of the Appalachian Mountains, and is surrounded by rolling hills and lush forests. The village is located in the county of Lawrence, and is part of the Ironton-Lawrence County Metropolitan Statistical Area. The village is situated on the banks of the Ohio River, and is bordered by the towns of Ironton, South Point, and Proctorville. The village is located at an elevation of 845 feet above sea level.
The climate in Buford is classified as humid continental, with hot summers and cold winters. The average annual temperature is around 54 degrees Fahrenheit, with an average high of around 75 degrees in the summer and an average low of around 34 degrees in the winter. The average annual precipitation is around 40 inches, with the majority of the precipitation occurring in the spring and summer months.
Economy
The economy of Buford is largely based on agriculture and tourism. The village is home to several small farms, which produce a variety of crops, including corn, soybeans, wheat, and hay. The village also has several small businesses, including a grocery store, a hardware store, and a few restaurants.
Tourism is also an important part of the economy of Buford. The village is home to several attractions, including the Lawrence County Historical Society Museum, the Lawrence County Fairgrounds, and the Buford Dam. The village also hosts several festivals throughout the year, including the Buford Apple Festival and the Buford Bluegrass Festival.
Demographics
The population of Buford was estimated to be 1,072 in the year 2000, making it one of the smallest villages in the state. The population is predominantly white, with a small percentage of African Americans and Hispanics. The median household income in the village is around $30,000, and the median home value is around $90,000. The village has a high rate of poverty, with around 25% of the population living below the poverty line.
Conclusion
Buford, Ohio is a small village located in the southeastern corner of Ohio, in the Appalachian region of the state. It is situated in the foothills of the Appalachian Mountains, and is surrounded by rolling hills and lush forests. The village is located in the county of Lawrence, and is part of the Ironton-Lawrence County Metropolitan Statistical Area. The population of Buford was estimated to be 1,072 in the year 2000, making it one of the smallest villages in the state. The economy of Buford is largely based on agriculture and tourism, and the population is predominantly white, with a small percentage of African Americans and Hispanics. The village is home to several attractions, including the Lawrence County Historical Society Museum, the Lawrence County Fairgrounds, and the Buford Dam.
Common Questions
What is Per Capita Income in Buford?
Per Capita income in Buford is $32,882.
What is the Median Family Income in Buford?
Median Family Income in Buford is $81,516.
What is the Median Household income in Buford?
Median Household Income in Buford is $81,117.
What is Income or Wage Gap in Buford?
Income or Wage Gap in Buford is 45.6%.
Women in Buford earn 54.4 cents for every dollar earned by a man.
What is Inequality or Gini Index in Buford?
Inequality or Gini Index in Buford is 0.30.
What is the Total Population of Buford?
Total Population of Buford is 439.
What is the Total Male Population of Buford?
Total Male Population of Buford is 255.
What is the Total Female Population of Buford?
Total Female Population of Buford is 184.
What is the Ratio of Males per 100 Females in Buford?
There are 138.59 Males per 100 Females in Buford.
What is the Ratio of Females per 100 Males in Buford?
There are 72.16 Females per 100 Males in Buford.
What is the Median Population Age in Buford?
Median Population Age in Buford is 27.0 Years.
What is the Average Family Size in Buford
Average Family Size in Buford is 2.8 People.
What is the Average Household Size in Buford
Average Household Size in Buford is 2.7 People.
How Large is the Labor Force in Buford?
There are 251 People in the Labor Forcein in Buford.
What is the Percentage of People in the Labor Force in Buford?
75.4% of People are in the Labor Force in Buford.
What is the Unemployment Rate in Buford?
Unemployment Rate in Buford is 18.3%.