Zip Codes with the Highest Percentage of Population Employed in Education, Arts & Media in Northampton, MA
RELATED REPORTS & OPTIONS
Education, Arts & Media
Northampton
Compare Zip Codes
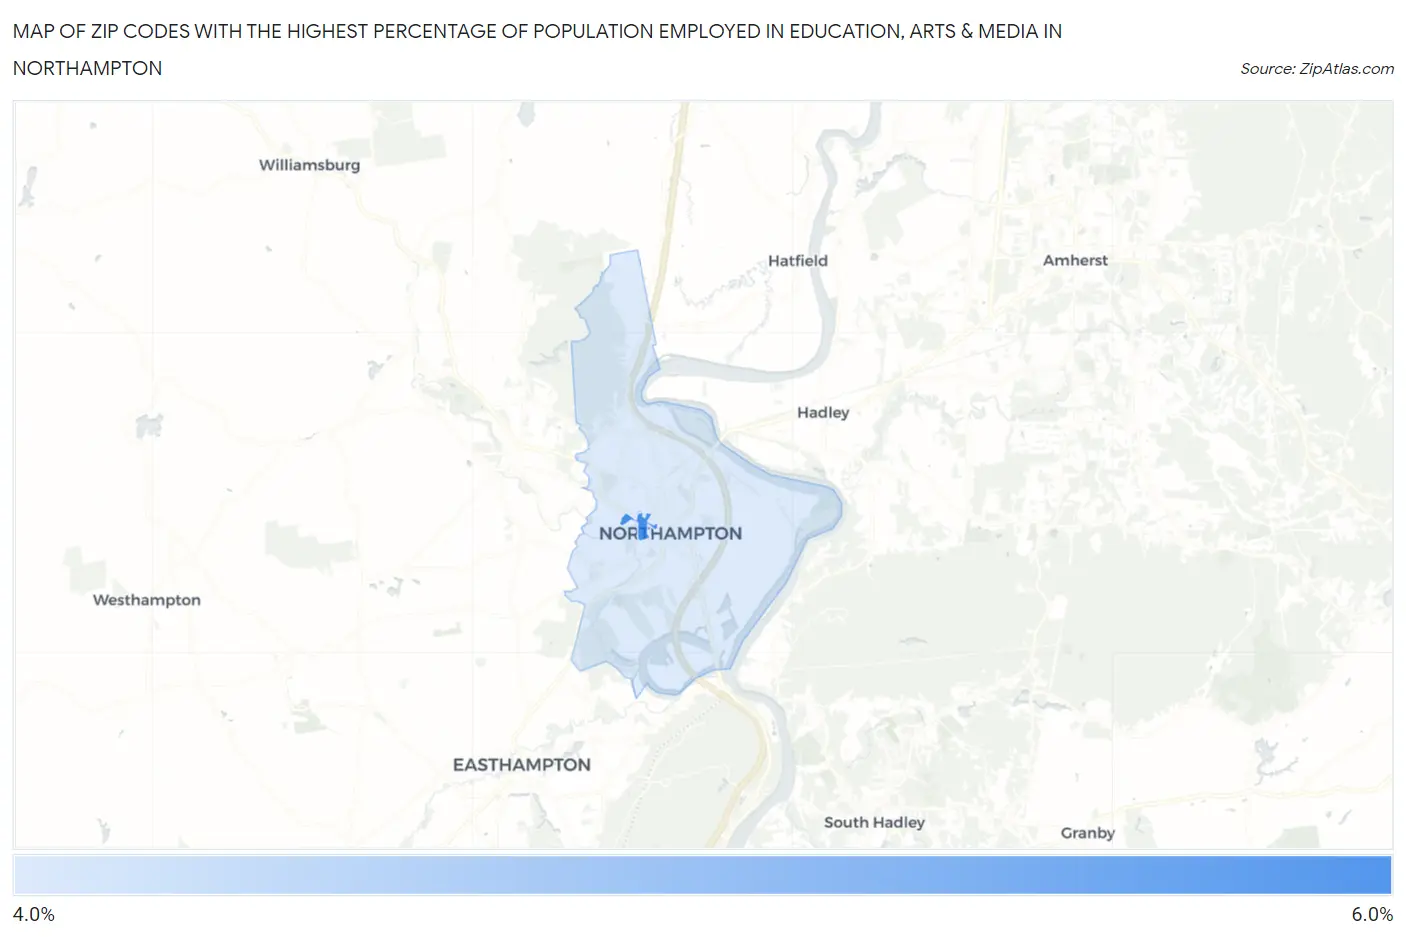
Map of Zip Codes with the Highest Percentage of Population Employed in Education, Arts & Media in Northampton
4.2%
5.3%
Zip Codes with the Highest Percentage of Population Employed in Education, Arts & Media in Northampton, MA
| Zip Code | % Employed | vs State | vs National | |
| 1. | 01063 | 5.3% | 2.1%(+3.12)#23 | 1.8%(+3.47)#1,372 |
| 2. | 01060 | 4.2% | 2.1%(+2.02)#45 | 1.8%(+2.37)#2,268 |
1
Common Questions
What are the Top Zip Codes with the Highest Percentage of Population Employed in Education, Arts & Media in Northampton, MA?
Top Zip Codes with the Highest Percentage of Population Employed in Education, Arts & Media in Northampton, MA are:
What zip code has the Highest Percentage of Population Employed in Education, Arts & Media in Northampton, MA?
01063 has the Highest Percentage of Population Employed in Education, Arts & Media in Northampton, MA with 5.3%.
What is the Percentage of Population Employed in Education, Arts & Media in Northampton, MA?
Percentage of Population Employed in Education, Arts & Media in Northampton is 4.1%.
What is the Percentage of Population Employed in Education, Arts & Media in Massachusetts?
Percentage of Population Employed in Education, Arts & Media in Massachusetts is 2.1%.
What is the Percentage of Population Employed in Education, Arts & Media in the United States?
Percentage of Population Employed in Education, Arts & Media in the United States is 1.8%.