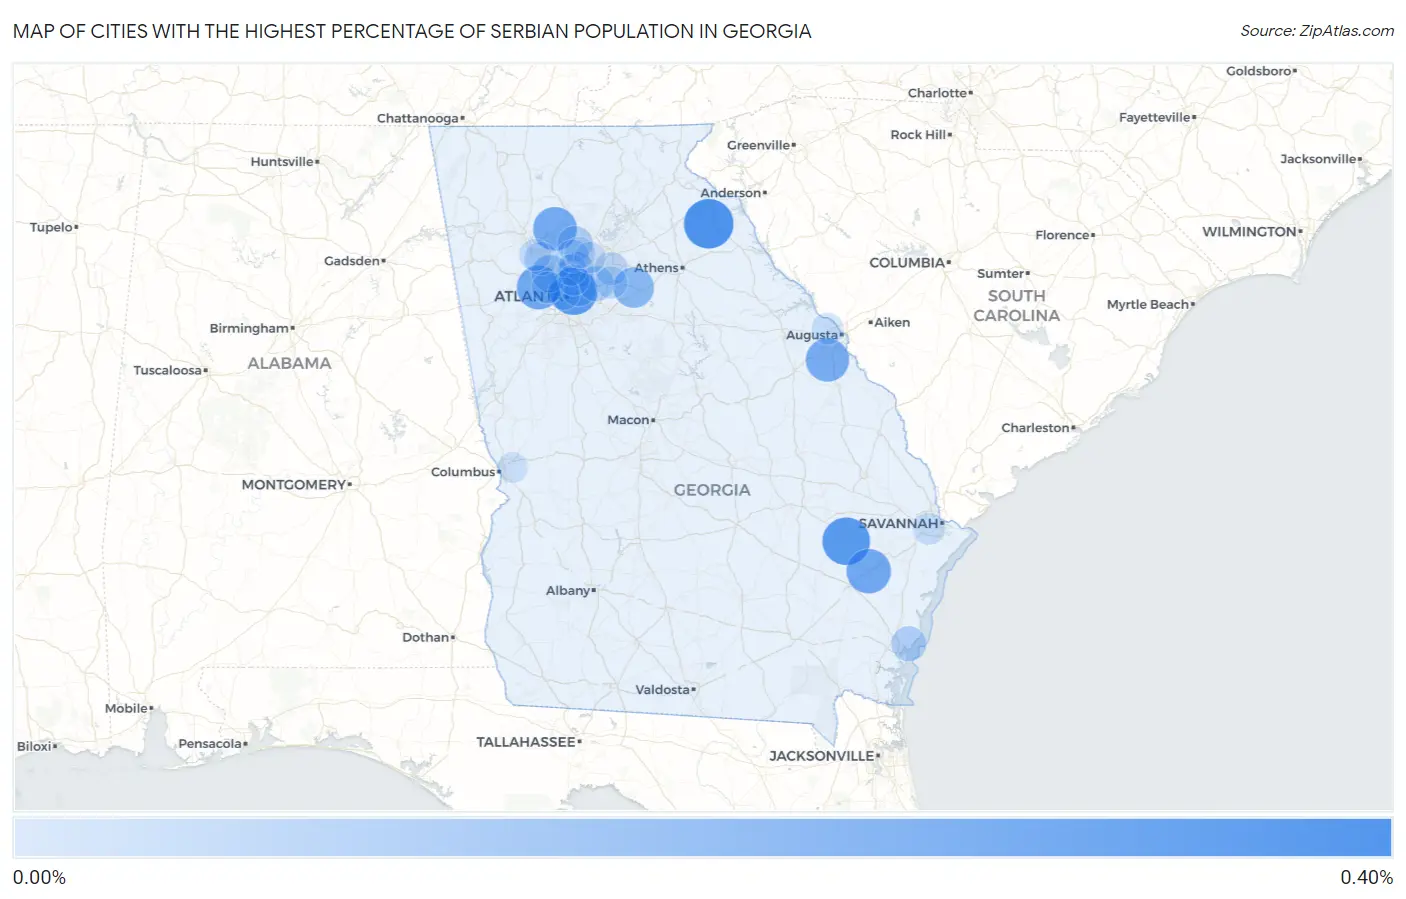
Cities with the Highest Percentage of Serbian Population in Georgia
RELATED REPORTS & OPTIONS
Serbian
Georgia
Compare Cities
Map of Cities with the Highest Percentage of Serbian Population in Georgia
0.00%
0.40%
Cities with the Highest Percentage of Serbian Population in Georgia
| City | Serbian | vs State | vs National | |
| 1. | Franklin Springs | 0.38% | 0.015%(+0.370)#1 | 0.059%(+0.326)#766 |
| 2. | Glennville | 0.35% | 0.015%(+0.331)#2 | 0.059%(+0.287)#829 |
| 3. | Druid Hills | 0.34% | 0.015%(+0.328)#3 | 0.059%(+0.284)#839 |
| 4. | Ludowici | 0.28% | 0.015%(+0.266)#4 | 0.059%(+0.222)#989 |
| 5. | Austell | 0.27% | 0.015%(+0.256)#5 | 0.059%(+0.213)#1,011 |
| 6. | Canton | 0.27% | 0.015%(+0.251)#6 | 0.059%(+0.207)#1,025 |
| 7. | Hephzibah | 0.26% | 0.015%(+0.244)#7 | 0.059%(+0.200)#1,053 |
| 8. | Between | 0.20% | 0.015%(+0.189)#8 | 0.059%(+0.145)#1,267 |
| 9. | Fair Oaks | 0.14% | 0.015%(+0.120)#9 | 0.059%(+0.076)#1,580 |
| 10. | Dunwoody | 0.10% | 0.015%(+0.086)#10 | 0.059%(+0.042)#1,811 |
| 11. | Milton | 0.100% | 0.015%(+0.085)#11 | 0.059%(+0.041)#1,821 |
| 12. | North Decatur | 0.099% | 0.015%(+0.084)#12 | 0.059%(+0.040)#1,830 |
| 13. | Mountain Park | 0.097% | 0.015%(+0.083)#13 | 0.059%(+0.039)#1,841 |
| 14. | St Simons | 0.094% | 0.015%(+0.079)#14 | 0.059%(+0.035)#1,870 |
| 15. | Kennesaw | 0.060% | 0.015%(+0.045)#15 | 0.059%(+0.001)#2,168 |
| 16. | Roswell | 0.057% | 0.015%(+0.042)#16 | 0.059%(-0.002)#2,192 |
| 17. | Lawrenceville | 0.056% | 0.015%(+0.041)#17 | 0.059%(-0.003)#2,202 |
| 18. | Atlanta | 0.042% | 0.015%(+0.027)#18 | 0.059%(-0.017)#2,346 |
| 19. | Snellville | 0.038% | 0.015%(+0.023)#19 | 0.059%(-0.020)#2,391 |
| 20. | Acworth | 0.031% | 0.015%(+0.016)#20 | 0.059%(-0.027)#2,486 |
| 21. | Savannah | 0.031% | 0.015%(+0.016)#21 | 0.059%(-0.028)#2,488 |
| 22. | Martinez | 0.030% | 0.015%(+0.015)#22 | 0.059%(-0.029)#2,511 |
| 23. | Mableton | 0.029% | 0.015%(+0.014)#23 | 0.059%(-0.030)#2,520 |
| 24. | Sandy Springs | 0.026% | 0.015%(+0.011)#24 | 0.059%(-0.033)#2,552 |
| 25. | Johns Creek | 0.024% | 0.015%(+0.009)#25 | 0.059%(-0.034)#2,582 |
| 26. | Brookhaven | 0.021% | 0.015%(+0.006)#26 | 0.059%(-0.038)#2,629 |
| 27. | Alpharetta | 0.020% | 0.015%(+0.005)#27 | 0.059%(-0.039)#2,645 |
| 28. | Columbus | 0.013% | 0.015%(-0.002)#28 | 0.059%(-0.046)#2,719 |
| 29. | Athens-Clarke County Unified Government (Balance) | 0.013% | 0.015%(-0.002)#29 | 0.059%(-0.046)#2,725 |
Common Questions
What are the Top 10 Cities with the Highest Percentage of Serbian Population in Georgia?
Top 10 Cities with the Highest Percentage of Serbian Population in Georgia are:
#1
0.38%
#2
0.35%
#3
0.34%
#4
0.28%
#5
0.27%
#6
0.27%
#7
0.26%
#8
0.20%
#9
0.14%
#10
0.10%
What city has the Highest Percentage of Serbian Population in Georgia?
Franklin Springs has the Highest Percentage of Serbian Population in Georgia with 0.38%.
What is the Percentage of Serbian Population in the State of Georgia?
Percentage of Serbian Population in Georgia is 0.015%.
What is the Percentage of Serbian Population in the United States?
Percentage of Serbian Population in the United States is 0.059%.