Cities with the Highest Percentage of Serbian Population in the United States
RELATED REPORTS & OPTIONS
Serbian
United States
Compare Cities
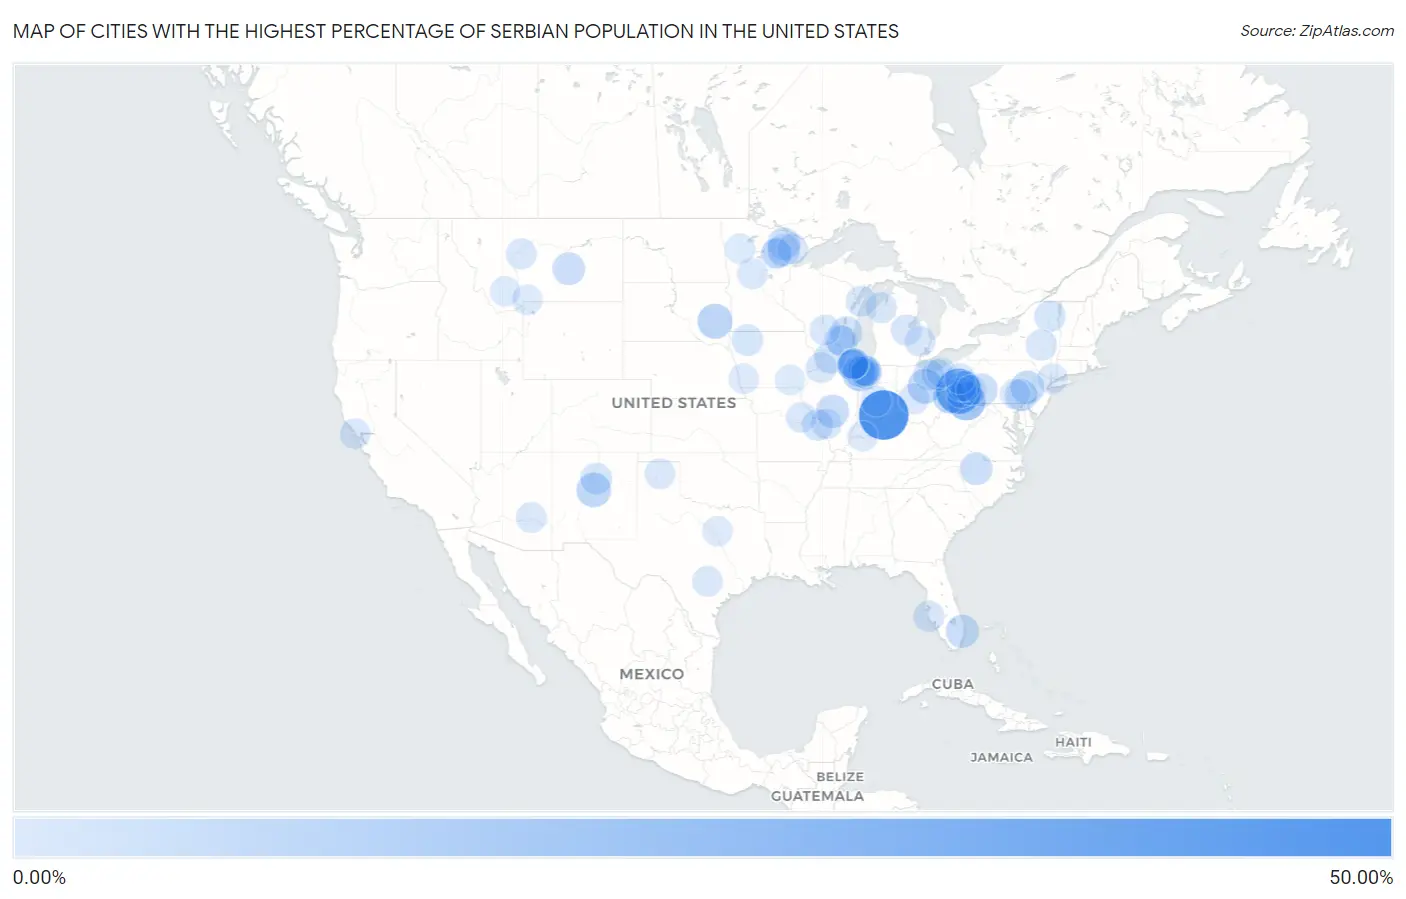
Map of Cities with the Highest Percentage of Serbian Population in the United States
0.00%
50.00%
Cities with the Highest Percentage of Serbian Population in the United States
| City | Serbian | vs State | vs National | |
| 1. | Scipio | 48.14% | 0.15%(+48.0)#1 | 0.059%(+48.1)#1 |
| 2. | Hazen | 37.21% | 0.13%(+37.1)#1 | 0.059%(+37.2)#2 |
| 3. | Slovan | 37.02% | 0.13%(+36.9)#2 | 0.059%(+37.0)#3 |
| 4. | Glasgow Borough | 26.09% | 0.13%(+26.0)#3 | 0.059%(+26.0)#4 |
| 5. | Ronco | 20.51% | 0.13%(+20.4)#4 | 0.059%(+20.5)#5 |
| 6. | Penn Borough | 14.71% | 0.13%(+14.6)#5 | 0.059%(+14.7)#6 |
| 7. | Lake Dalecarlia | 13.33% | 0.15%(+13.2)#2 | 0.059%(+13.3)#7 |
| 8. | Lake Holiday Hideaway | 12.92% | 0.15%(+12.8)#3 | 0.059%(+12.9)#8 |
| 9. | Vilas | 12.50% | 0.028%(+12.5)#1 | 0.059%(+12.4)#9 |
| 10. | Ora | 12.24% | 0.15%(+12.1)#4 | 0.059%(+12.2)#10 |
| 11. | Candlewood Lake | 11.77% | 0.14%(+11.6)#1 | 0.059%(+11.7)#11 |
| 12. | Mcintosh | 11.55% | 0.035%(+11.5)#1 | 0.059%(+11.5)#12 |
| 13. | Lafferty | 11.11% | 0.14%(+11.0)#2 | 0.059%(+11.1)#13 |
| 14. | Trexlertown | 9.44% | 0.13%(+9.31)#6 | 0.059%(+9.38)#14 |
| 15. | Mccook | 8.70% | 0.20%(+8.50)#1 | 0.059%(+8.64)#15 |
| 16. | Nokomis | 8.58% | 0.20%(+8.38)#2 | 0.059%(+8.52)#16 |
| 17. | Hillsboro Pines | 8.38% | 0.052%(+8.33)#1 | 0.059%(+8.32)#17 |
| 18. | Mundys Corner | 7.68% | 0.13%(+7.55)#7 | 0.059%(+7.62)#18 |
| 19. | Efland | 7.39% | 0.021%(+7.37)#1 | 0.059%(+7.34)#19 |
| 20. | Melstone | 7.35% | 0.088%(+7.26)#1 | 0.059%(+7.29)#20 |
| 21. | Lockport Heights | 7.02% | 0.20%(+6.82)#3 | 0.059%(+6.96)#21 |
| 22. | Kinney | 6.99% | 0.066%(+6.93)#1 | 0.059%(+6.93)#22 |
| 23. | Cook | 6.97% | 0.066%(+6.91)#2 | 0.059%(+6.91)#23 |
| 24. | Export Borough | 6.82% | 0.13%(+6.68)#8 | 0.059%(+6.76)#24 |
| 25. | Fivepointville | 6.34% | 0.13%(+6.20)#9 | 0.059%(+6.28)#25 |
| 26. | Allenton | 5.99% | 0.14%(+5.85)#1 | 0.059%(+5.93)#26 |
| 27. | Blooming Valley Borough | 5.88% | 0.13%(+5.75)#10 | 0.059%(+5.82)#27 |
| 28. | Ramey Borough | 5.74% | 0.13%(+5.61)#11 | 0.059%(+5.69)#28 |
| 29. | Ohioville Borough | 5.53% | 0.13%(+5.40)#12 | 0.059%(+5.47)#29 |
| 30. | Adamsburg Borough | 5.15% | 0.13%(+5.02)#13 | 0.059%(+5.10)#30 |
| 31. | Eldorado At Santa Fe | 5.10% | 0.035%(+5.07)#2 | 0.059%(+5.04)#31 |
| 32. | Aberdeen | 4.90% | 0.15%(+4.75)#5 | 0.059%(+4.84)#32 |
| 33. | Adeline | 4.82% | 0.20%(+4.62)#4 | 0.059%(+4.76)#33 |
| 34. | Indian Head Park | 4.77% | 0.20%(+4.57)#5 | 0.059%(+4.71)#34 |
| 35. | Royal | 4.51% | 0.027%(+4.48)#1 | 0.059%(+4.45)#35 |
| 36. | Bergland | 4.50% | 0.092%(+4.41)#1 | 0.059%(+4.45)#36 |
| 37. | St George | 4.32% | 0.032%(+4.29)#1 | 0.059%(+4.26)#37 |
| 38. | Hookstown Borough | 4.30% | 0.13%(+4.17)#14 | 0.059%(+4.24)#38 |
| 39. | Valley City | 4.28% | 0.14%(+4.14)#3 | 0.059%(+4.22)#39 |
| 40. | Midland Borough | 4.21% | 0.13%(+4.08)#15 | 0.059%(+4.15)#40 |
| 41. | Schererville | 4.04% | 0.15%(+3.89)#6 | 0.059%(+3.98)#41 |
| 42. | Lake Placid | 4.04% | 0.049%(+3.99)#1 | 0.059%(+3.98)#42 |
| 43. | Ridge Wood Heights | 3.91% | 0.052%(+3.86)#2 | 0.059%(+3.85)#43 |
| 44. | Collins | 3.85% | 0.14%(+3.71)#4 | 0.059%(+3.79)#44 |
| 45. | Wall Borough | 3.80% | 0.13%(+3.67)#16 | 0.059%(+3.74)#45 |
| 46. | Rome | 3.78% | 0.14%(+3.64)#2 | 0.059%(+3.72)#46 |
| 47. | Salt Creek Commons | 3.78% | 0.15%(+3.63)#7 | 0.059%(+3.72)#47 |
| 48. | Ames | 3.61% | 0.049%(+3.57)#2 | 0.059%(+3.56)#48 |
| 49. | Hardwood Acres | 3.57% | 0.092%(+3.47)#2 | 0.059%(+3.51)#49 |
| 50. | Thayer | 3.55% | 0.15%(+3.41)#8 | 0.059%(+3.50)#50 |
| 51. | Muse | 3.52% | 0.13%(+3.39)#17 | 0.059%(+3.46)#51 |
| 52. | Winfield | 3.38% | 0.15%(+3.23)#9 | 0.059%(+3.32)#52 |
| 53. | La Crosse | 3.35% | 0.15%(+3.20)#10 | 0.059%(+3.29)#53 |
| 54. | Johnson Creek | 3.33% | 0.14%(+3.19)#3 | 0.059%(+3.27)#54 |
| 55. | Auburn | 3.28% | 0.092%(+3.19)#3 | 0.059%(+3.22)#55 |
| 56. | Liberty Borough Allegheny County | 3.24% | 0.13%(+3.10)#18 | 0.059%(+3.18)#56 |
| 57. | Erie | 3.23% | 0.20%(+3.03)#6 | 0.059%(+3.17)#57 |
| 58. | Aliquippa | 3.19% | 0.13%(+3.05)#19 | 0.059%(+3.13)#58 |
| 59. | Bakerstown | 3.18% | 0.13%(+3.05)#20 | 0.059%(+3.12)#59 |
| 60. | Birmingham Borough | 3.17% | 0.13%(+3.04)#21 | 0.059%(+3.12)#60 |
| 61. | Egg Harbor | 3.15% | 0.14%(+3.02)#4 | 0.059%(+3.10)#61 |
| 62. | Catawba | 3.14% | 0.14%(+3.00)#5 | 0.059%(+3.08)#62 |
| 63. | New Brighton Borough | 3.14% | 0.13%(+3.00)#22 | 0.059%(+3.08)#63 |
| 64. | Nashwauk | 3.12% | 0.066%(+3.05)#3 | 0.059%(+3.06)#64 |
| 65. | Lake Delton | 3.11% | 0.14%(+2.97)#5 | 0.059%(+3.05)#65 |
| 66. | Oakwood | 3.02% | 0.13%(+2.89)#23 | 0.059%(+2.97)#66 |
| 67. | Rochester Borough | 3.01% | 0.13%(+2.87)#24 | 0.059%(+2.95)#67 |
| 68. | Stinnett | 2.98% | 0.025%(+2.95)#1 | 0.059%(+2.92)#68 |
| 69. | Attica | 2.97% | 0.092%(+2.88)#4 | 0.059%(+2.91)#69 |
| 70. | East Mckeesport Borough | 2.94% | 0.13%(+2.81)#25 | 0.059%(+2.88)#70 |
| 71. | Summerfield | 2.94% | 0.20%(+2.74)#7 | 0.059%(+2.88)#71 |
| 72. | Peridot | 2.94% | 0.099%(+2.84)#1 | 0.059%(+2.88)#72 |
| 73. | Lyons | 2.82% | 0.20%(+2.62)#8 | 0.059%(+2.76)#73 |
| 74. | Hoyt Lakes | 2.82% | 0.066%(+2.75)#4 | 0.059%(+2.76)#74 |
| 75. | Spring Hill | 2.78% | 0.15%(+2.63)#11 | 0.059%(+2.72)#75 |
| 76. | Youngwood Borough | 2.71% | 0.13%(+2.57)#26 | 0.059%(+2.65)#76 |
| 77. | Stockett | 2.67% | 0.088%(+2.58)#2 | 0.059%(+2.61)#77 |
| 78. | Aldrich | 2.63% | 0.066%(+2.57)#5 | 0.059%(+2.57)#78 |
| 79. | Wanatah | 2.55% | 0.15%(+2.40)#12 | 0.059%(+2.49)#79 |
| 80. | Montgomery City | 2.52% | 0.032%(+2.49)#2 | 0.059%(+2.46)#80 |
| 81. | Inverness | 2.52% | 0.047%(+2.47)#1 | 0.059%(+2.46)#81 |
| 82. | New Berlin | 2.49% | 0.025%(+2.46)#2 | 0.059%(+2.43)#82 |
| 83. | Brookfield | 2.48% | 0.20%(+2.28)#9 | 0.059%(+2.42)#83 |
| 84. | Hastings | 2.36% | 0.027%(+2.33)#2 | 0.059%(+2.30)#84 |
| 85. | Slickville | 2.36% | 0.13%(+2.22)#27 | 0.059%(+2.30)#85 |
| 86. | Marble | 2.28% | 0.066%(+2.21)#6 | 0.059%(+2.22)#86 |
| 87. | Hatfield | 2.27% | 0.15%(+2.12)#13 | 0.059%(+2.21)#87 |
| 88. | Joshua | 2.26% | 0.025%(+2.24)#3 | 0.059%(+2.20)#88 |
| 89. | Plum Valley | 2.22% | 0.20%(+2.02)#10 | 0.059%(+2.16)#89 |
| 90. | Guilford Lake | 2.20% | 0.14%(+2.06)#6 | 0.059%(+2.14)#90 |
| 91. | Agency | 2.16% | 0.027%(+2.13)#3 | 0.059%(+2.10)#91 |
| 92. | Gardiner | 2.15% | 0.088%(+2.06)#3 | 0.059%(+2.09)#92 |
| 93. | Marianna Borough | 2.15% | 0.13%(+2.02)#28 | 0.059%(+2.09)#93 |
| 94. | Twin Bridges | 2.11% | 0.088%(+2.02)#4 | 0.059%(+2.05)#94 |
| 95. | Countryside | 2.10% | 0.20%(+1.90)#11 | 0.059%(+2.05)#95 |
| 96. | Valley View | 2.09% | 0.14%(+1.95)#7 | 0.059%(+2.03)#96 |
| 97. | Irvington | 2.08% | 0.049%(+2.03)#3 | 0.059%(+2.02)#97 |
| 98. | Fosston | 2.08% | 0.066%(+2.01)#7 | 0.059%(+2.02)#98 |
| 99. | Timber Hills | 2.07% | 0.13%(+1.94)#29 | 0.059%(+2.02)#99 |
| 100. | Rices Landing Borough | 2.07% | 0.13%(+1.94)#30 | 0.059%(+2.01)#100 |
Common Questions
What are the Top 10 Cities with the Highest Percentage of Serbian Population in the United States?
Top 10 Cities with the Highest Percentage of Serbian Population in the United States are:
What city has the Highest Percentage of Serbian Population in the United States?
Scipio has the Highest Percentage of Serbian Population in the United States with 48.14%.
What is the Percentage of Serbian Population in the United States?
Percentage of Serbian Population in the United States is 0.059%.