Mashantucket, CT Map & Demographics
Mashantucket Map
Mashantucket Overview
$29,723
PER CAPITA INCOME
$109,375
AVG FAMILY INCOME
$103,750
AVG HOUSEHOLD INCOME
0.37
INEQUALITY / GINI INDEX
104
TOTAL POPULATION
58
MALE POPULATION
46
FEMALE POPULATION
126.09
MALES / 100 FEMALES
79.31
FEMALES / 100 MALES
34.5
MEDIAN AGE
3.9
AVG FAMILY SIZE
3.7
AVG HOUSEHOLD SIZE
44
LABOR FORCE [ PEOPLE ]
62.9%
PERCENT IN LABOR FORCE
4.5%
UNEMPLOYMENT RATE
Mashantucket Zip Codes
Mashantucket Area Codes
Income in Mashantucket
Income Overview in Mashantucket
Per Capita Income in Mashantucket is $29,723, while median incomes of families and households are $109,375 and $103,750 respectively.
| Characteristic | Number | Measure |
| Per Capita Income | 104 | $29,723 |
| Median Family Income | 25 | $109,375 |
| Mean Family Income | 25 | $136,356 |
| Median Household Income | 28 | $103,750 |
| Mean Household Income | 28 | $127,625 |
| Income Deficit | 25 | $0 |
| Wage / Income Gap (%) | 104 | 0.00% |
| Wage / Income Gap ($) | 104 | 100.00¢ per $1 |
| Gini / Inequality Index | 104 | 0.37 |
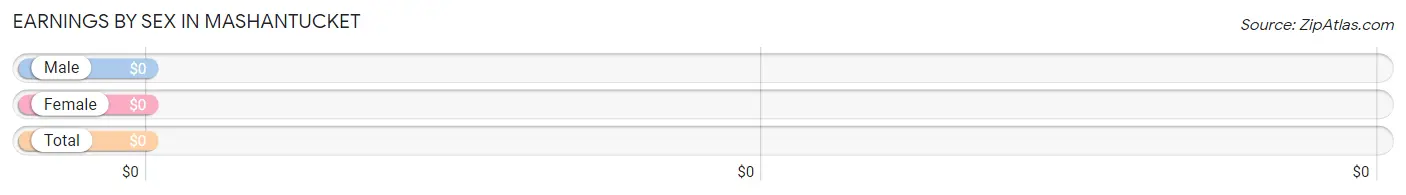
Earnings by Sex in Mashantucket
| Sex | Number | Average Earnings |
| Male | 25 (50.0%) | $0 |
| Female | 25 (50.0%) | $0 |
| Total | 50 (100.0%) | $0 |
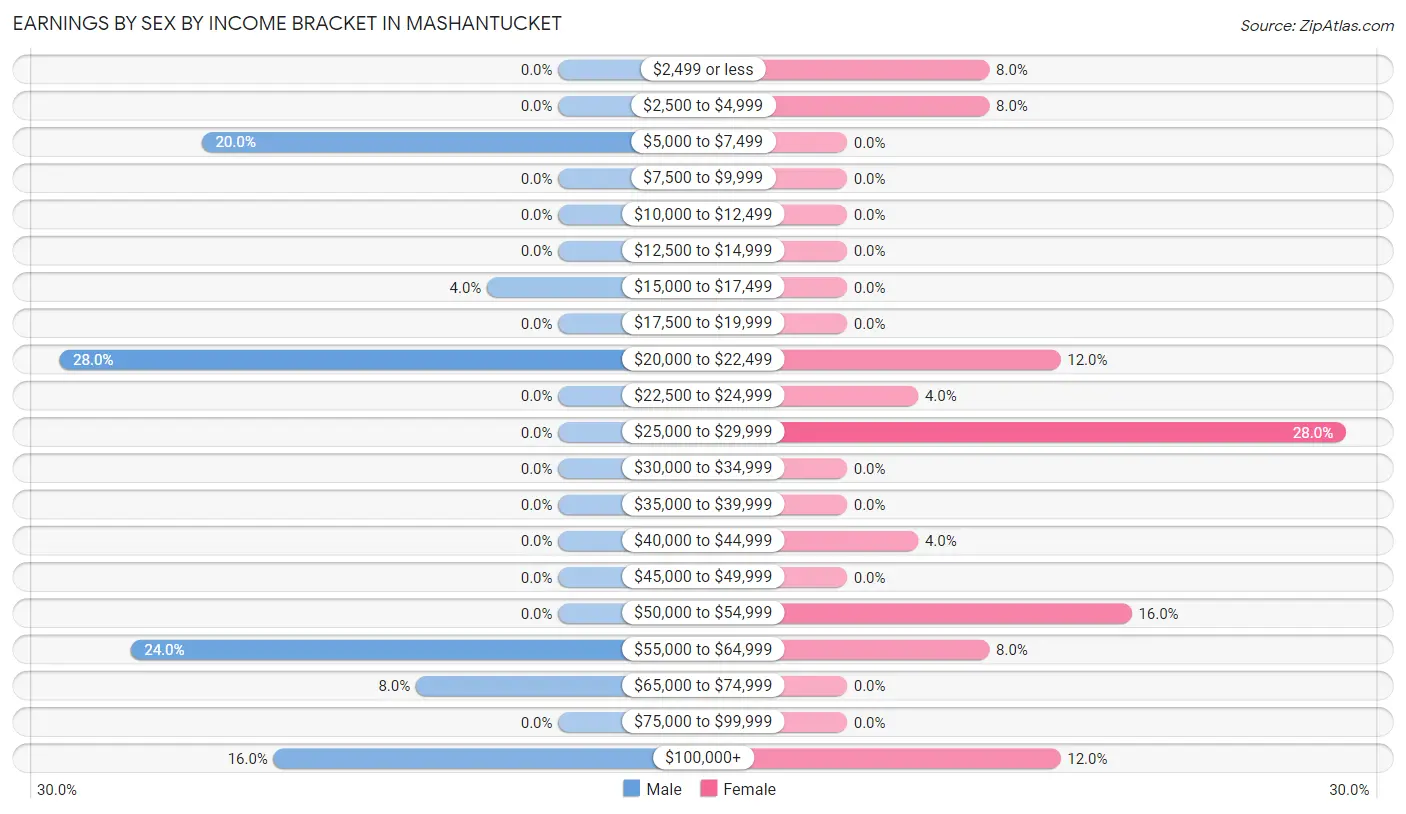
Earnings by Sex by Income Bracket in Mashantucket
The most common earnings brackets in Mashantucket are $20,000 to $22,499 for men (7 | 28.0%) and $25,000 to $29,999 for women (7 | 28.0%).
| Income | Male | Female |
| $2,499 or less | 0 (0.0%) | 2 (8.0%) |
| $2,500 to $4,999 | 0 (0.0%) | 2 (8.0%) |
| $5,000 to $7,499 | 5 (20.0%) | 0 (0.0%) |
| $7,500 to $9,999 | 0 (0.0%) | 0 (0.0%) |
| $10,000 to $12,499 | 0 (0.0%) | 0 (0.0%) |
| $12,500 to $14,999 | 0 (0.0%) | 0 (0.0%) |
| $15,000 to $17,499 | 1 (4.0%) | 0 (0.0%) |
| $17,500 to $19,999 | 0 (0.0%) | 0 (0.0%) |
| $20,000 to $22,499 | 7 (28.0%) | 3 (12.0%) |
| $22,500 to $24,999 | 0 (0.0%) | 1 (4.0%) |
| $25,000 to $29,999 | 0 (0.0%) | 7 (28.0%) |
| $30,000 to $34,999 | 0 (0.0%) | 0 (0.0%) |
| $35,000 to $39,999 | 0 (0.0%) | 0 (0.0%) |
| $40,000 to $44,999 | 0 (0.0%) | 1 (4.0%) |
| $45,000 to $49,999 | 0 (0.0%) | 0 (0.0%) |
| $50,000 to $54,999 | 0 (0.0%) | 4 (16.0%) |
| $55,000 to $64,999 | 6 (24.0%) | 2 (8.0%) |
| $65,000 to $74,999 | 2 (8.0%) | 0 (0.0%) |
| $75,000 to $99,999 | 0 (0.0%) | 0 (0.0%) |
| $100,000+ | 4 (16.0%) | 3 (12.0%) |
| Total | 25 (100.0%) | 25 (100.0%) |
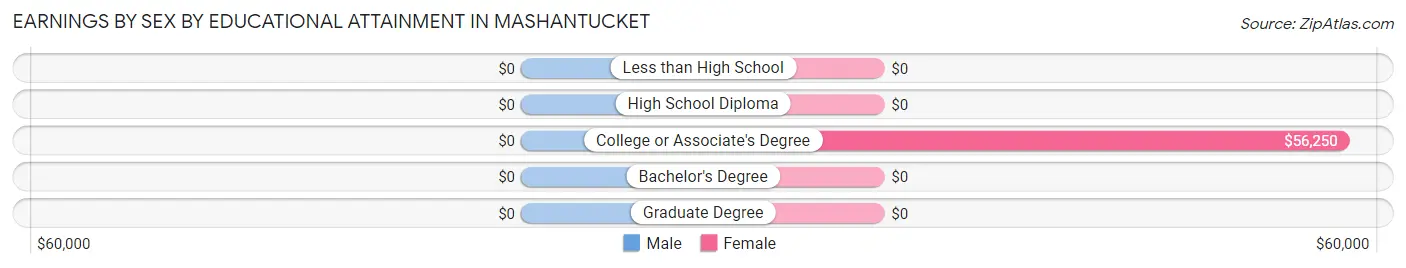
Earnings by Sex by Educational Attainment in Mashantucket
| Educational Attainment | Male Income | Female Income |
| Less than High School | - | - |
| High School Diploma | - | - |
| College or Associate's Degree | - | - |
| Bachelor's Degree | - | - |
| Graduate Degree | - | - |
| Total | $58,333 | $0 |
Family Income in Mashantucket
Family Income Brackets in Mashantucket
According to the Mashantucket family income data, there are 6 families falling into the $75,000 to $99,999 income range, which is the most common income bracket and makes up 24.0% of all families.
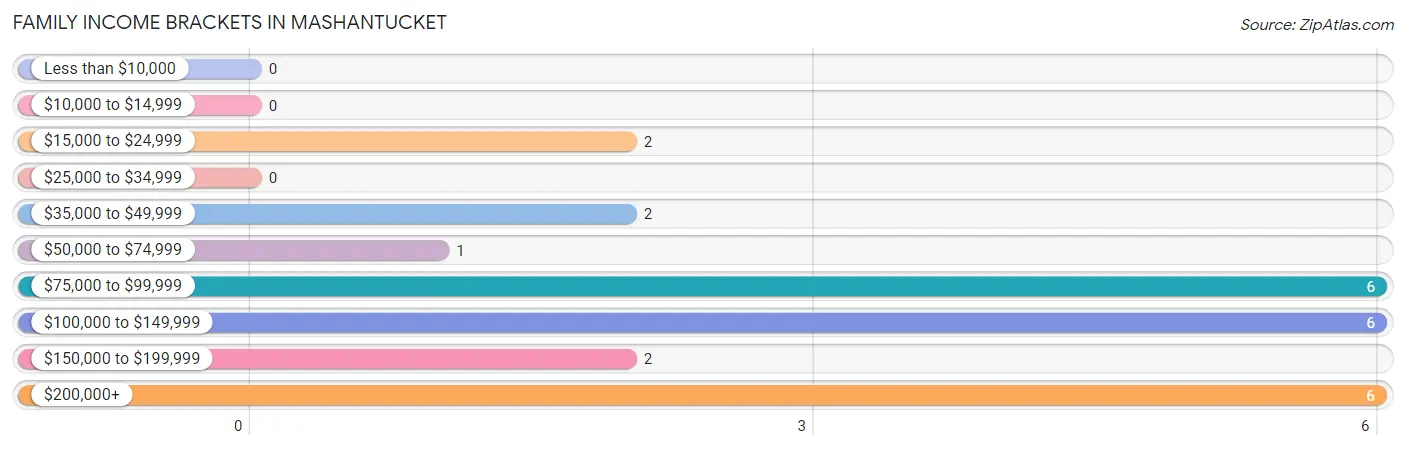
| Income Bracket | # Families | % Families |
| Less than $10,000 | 0 | 0.0% |
| $10,000 to $14,999 | 0 | 0.0% |
| $15,000 to $24,999 | 2 | 8.0% |
| $25,000 to $34,999 | 0 | 0.0% |
| $35,000 to $49,999 | 2 | 8.0% |
| $50,000 to $74,999 | 1 | 4.0% |
| $75,000 to $99,999 | 6 | 24.0% |
| $100,000 to $149,999 | 6 | 24.0% |
| $150,000 to $199,999 | 2 | 8.0% |
| $200,000+ | 6 | 24.0% |
Family Income by Famaliy Size in Mashantucket
4-person families (6 | 24.0%) account for the highest median family income in Mashantucket with $195,000 per family, while 4-person families (6 | 24.0%) have the highest median income of $48,750 per family member.
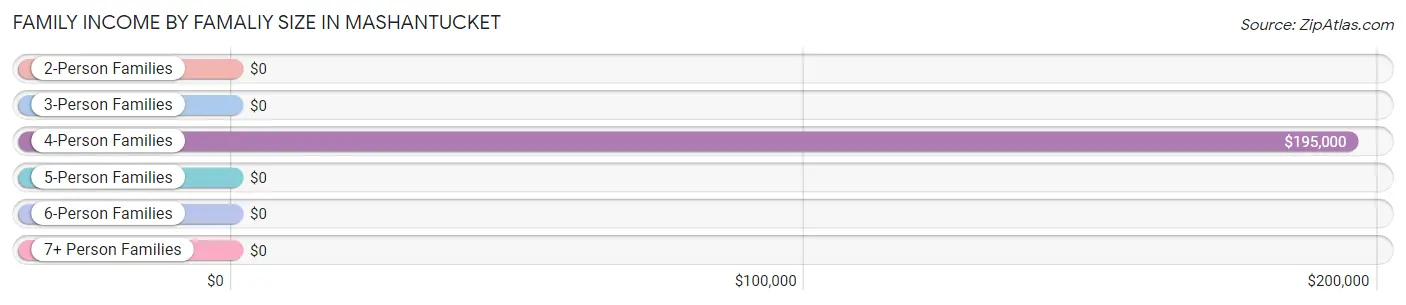
| Income Bracket | # Families | Median Income |
| 2-Person Families | 7 (28.0%) | $0 |
| 3-Person Families | 9 (36.0%) | $0 |
| 4-Person Families | 6 (24.0%) | $195,000 |
| 5-Person Families | 0 (0.0%) | $0 |
| 6-Person Families | 0 (0.0%) | $0 |
| 7+ Person Families | 3 (12.0%) | $0 |
| Total | 25 (100.0%) | $109,375 |
Family Income by Number of Earners in Mashantucket
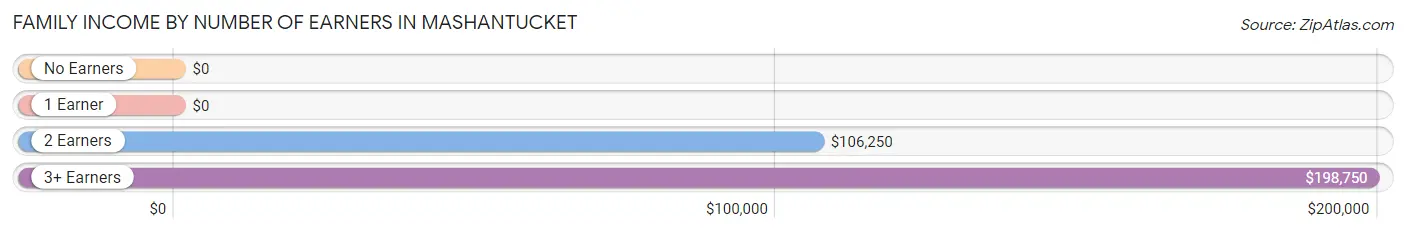
| Number of Earners | # Families | Median Income |
| No Earners | 6 (24.0%) | $0 |
| 1 Earner | 1 (4.0%) | $0 |
| 2 Earners | 12 (48.0%) | $106,250 |
| 3+ Earners | 6 (24.0%) | $198,750 |
| Total | 25 (100.0%) | $109,375 |
Household Income in Mashantucket
Household Income Brackets in Mashantucket
With 7 households falling in the category, the $75,000 to $99,999 income range is the most frequent in Mashantucket, accounting for 25.0% of all households.
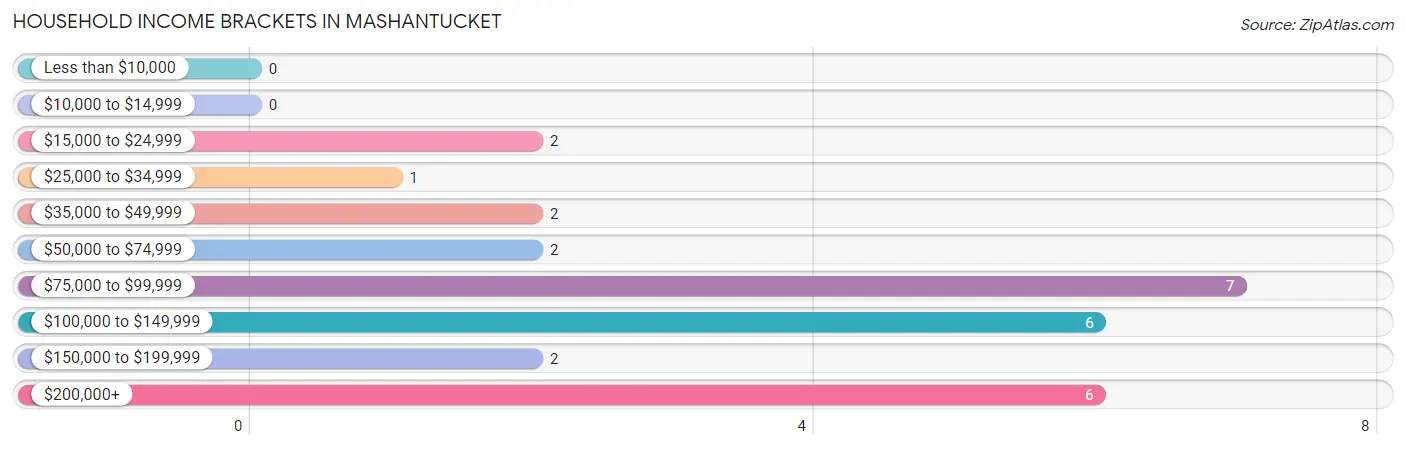
| Income Bracket | # Households | % Households |
| Less than $10,000 | 0 | 0.0% |
| $10,000 to $14,999 | 0 | 0.0% |
| $15,000 to $24,999 | 2 | 7.1% |
| $25,000 to $34,999 | 1 | 3.6% |
| $35,000 to $49,999 | 2 | 7.1% |
| $50,000 to $74,999 | 2 | 7.1% |
| $75,000 to $99,999 | 7 | 25.0% |
| $100,000 to $149,999 | 6 | 21.4% |
| $150,000 to $199,999 | 2 | 7.1% |
| $200,000+ | 6 | 21.4% |
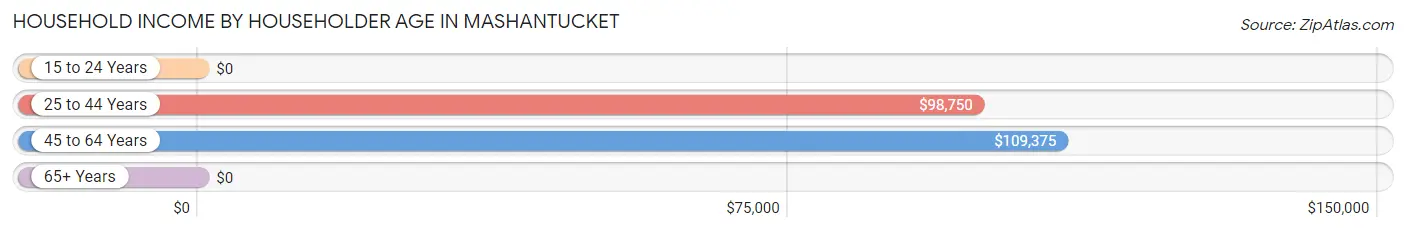
Household Income by Householder Age in Mashantucket
The median household income in Mashantucket is $103,750, with the highest median household income of $109,375 found in the 45 to 64 years age bracket for the primary householder. A total of 13 households (46.4%) fall into this category.
| Income Bracket | # Households | Median Income |
| 15 to 24 Years | 0 (0.0%) | $0 |
| 25 to 44 Years | 8 (28.6%) | $98,750 |
| 45 to 64 Years | 13 (46.4%) | $109,375 |
| 65+ Years | 7 (25.0%) | $0 |
| Total | 28 (100.0%) | $103,750 |
Poverty in Mashantucket
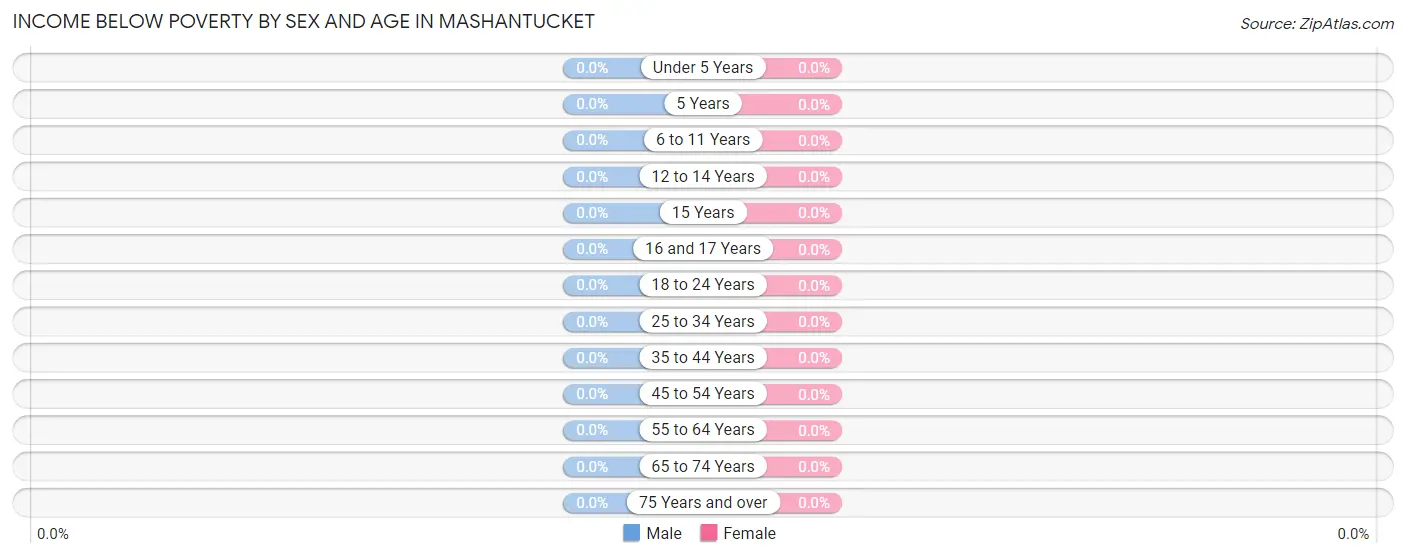
Income Below Poverty by Sex and Age in Mashantucket
| Age Bracket | Male | Female |
| Under 5 Years | 0 (0.0%) | 0 (0.0%) |
| 5 Years | 0 (0.0%) | 0 (0.0%) |
| 6 to 11 Years | 0 (0.0%) | 0 (0.0%) |
| 12 to 14 Years | 0 (0.0%) | 0 (0.0%) |
| 15 Years | 0 (0.0%) | 0 (0.0%) |
| 16 and 17 Years | 0 (0.0%) | 0 (0.0%) |
| 18 to 24 Years | 0 (0.0%) | 0 (0.0%) |
| 25 to 34 Years | 0 (0.0%) | 0 (0.0%) |
| 35 to 44 Years | 0 (0.0%) | 0 (0.0%) |
| 45 to 54 Years | 0 (0.0%) | 0 (0.0%) |
| 55 to 64 Years | 0 (0.0%) | 0 (0.0%) |
| 65 to 74 Years | 0 (0.0%) | 0 (0.0%) |
| 75 Years and over | 0 (0.0%) | 0 (0.0%) |
| Total | 0 (0.0%) | 0 (0.0%) |
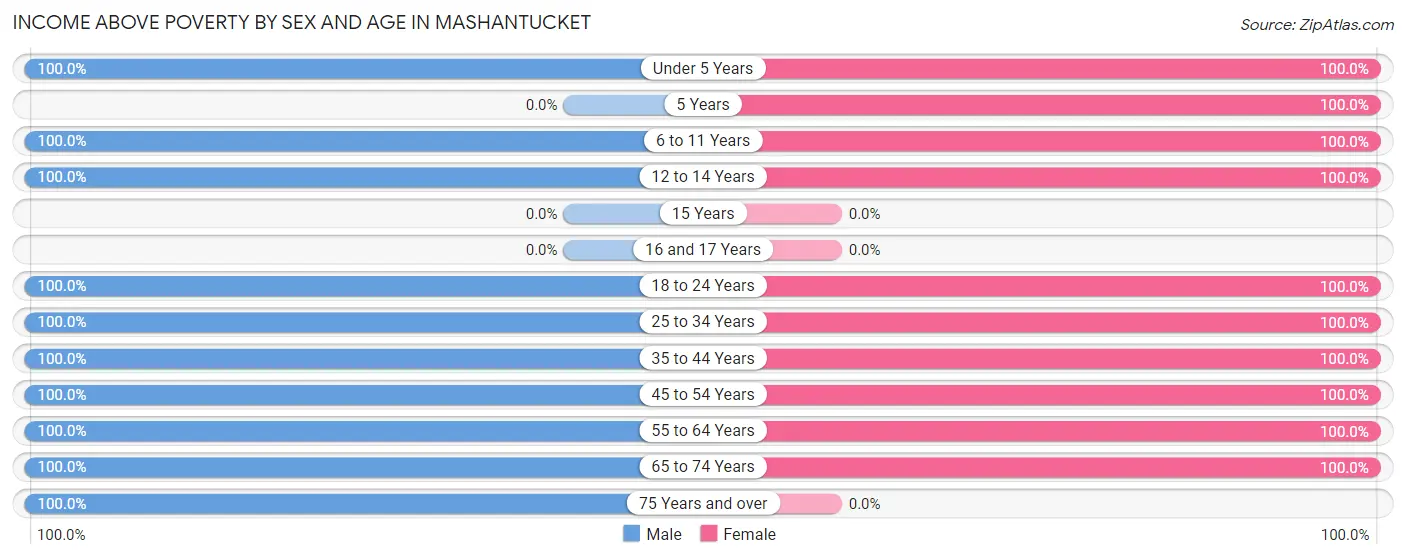
Income Above Poverty by Sex and Age in Mashantucket
According to the poverty statistics in Mashantucket, males aged under 5 years and females aged under 5 years are the age groups that are most secure financially, with 100.0% of males and 100.0% of females in these age groups living above the poverty line.
| Age Bracket | Male | Female |
| Under 5 Years | 18 (100.0%) | 1 (100.0%) |
| 5 Years | 0 (0.0%) | 3 (100.0%) |
| 6 to 11 Years | 1 (100.0%) | 6 (100.0%) |
| 12 to 14 Years | 2 (100.0%) | 2 (100.0%) |
| 15 Years | 0 (0.0%) | 0 (0.0%) |
| 16 and 17 Years | 0 (0.0%) | 0 (0.0%) |
| 18 to 24 Years | 5 (100.0%) | 5 (100.0%) |
| 25 to 34 Years | 3 (100.0%) | 5 (100.0%) |
| 35 to 44 Years | 9 (100.0%) | 4 (100.0%) |
| 45 to 54 Years | 6 (100.0%) | 10 (100.0%) |
| 55 to 64 Years | 7 (100.0%) | 3 (100.0%) |
| 65 to 74 Years | 5 (100.0%) | 7 (100.0%) |
| 75 Years and over | 1 (100.0%) | 0 (0.0%) |
| Total | 57 (100.0%) | 46 (100.0%) |
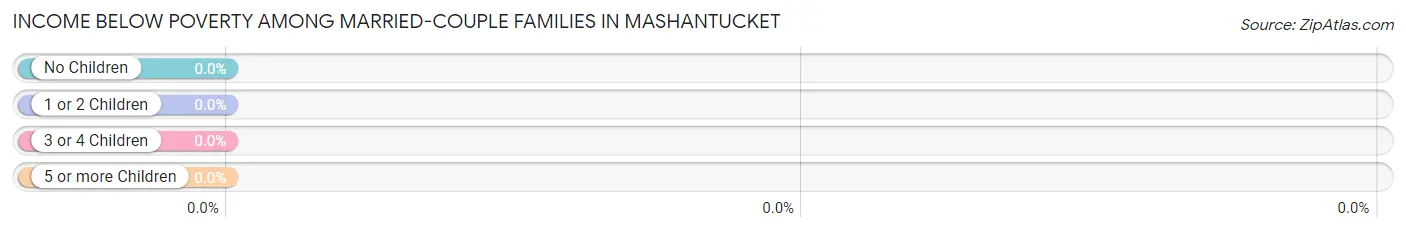
Income Below Poverty Among Married-Couple Families in Mashantucket
| Children | Above Poverty | Below Poverty |
| No Children | 13 (100.0%) | 0 (0.0%) |
| 1 or 2 Children | 7 (100.0%) | 0 (0.0%) |
| 3 or 4 Children | 3 (100.0%) | 0 (0.0%) |
| 5 or more Children | 0 (0.0%) | 0 (0.0%) |
| Total | 23 (100.0%) | 0 (0.0%) |
Income Below Poverty Among Single-Parent Households in Mashantucket
| Children | Single Father | Single Mother |
| No Children | 0 (0.0%) | 0 (0.0%) |
| 1 or 2 Children | 0 (0.0%) | 0 (0.0%) |
| 3 or 4 Children | 0 (0.0%) | 0 (0.0%) |
| 5 or more Children | 0 (0.0%) | 0 (0.0%) |
| Total | 0 (0.0%) | 0 (0.0%) |
Income Below Poverty Among Married-Couple vs Single-Parent Households in Mashantucket
| Children | Married-Couple Families | Single-Parent Households |
| No Children | 0 (0.0%) | 0 (0.0%) |
| 1 or 2 Children | 0 (0.0%) | 0 (0.0%) |
| 3 or 4 Children | 0 (0.0%) | 0 (0.0%) |
| 5 or more Children | 0 (0.0%) | 0 (0.0%) |
| Total | 0 (0.0%) | 0 (0.0%) |
Race in Mashantucket
The most populous races in Mashantucket are Native / Alaskan (46 | 44.2%), Two or more Races (34 | 32.7%), and White / Caucasian (20 | 19.2%).
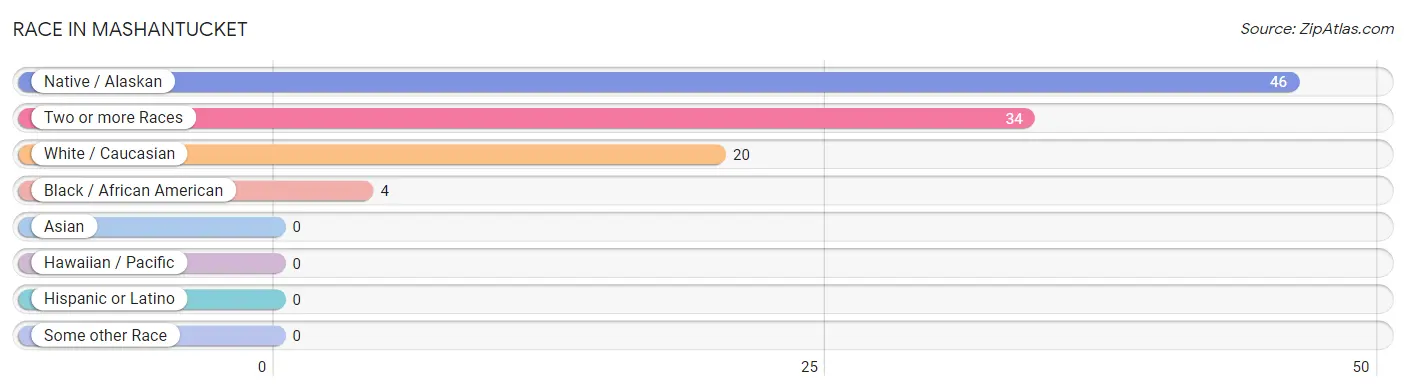
| Race | # Population | % Population |
| Asian | 0 | 0.0% |
| Black / African American | 4 | 3.8% |
| Hawaiian / Pacific | 0 | 0.0% |
| Hispanic or Latino | 0 | 0.0% |
| Native / Alaskan | 46 | 44.2% |
| White / Caucasian | 20 | 19.2% |
| Two or more Races | 34 | 32.7% |
| Some other Race | 0 | 0.0% |
| Total | 104 | 100.0% |
Ancestry in Mashantucket
The most populous ancestries reported in Mashantucket are Italian (19 | 18.3%), Irish (8 | 7.7%), American (5 | 4.8%), French (2 | 1.9%), and African (1 | 1.0%), together accounting for 33.6% of all Mashantucket residents.
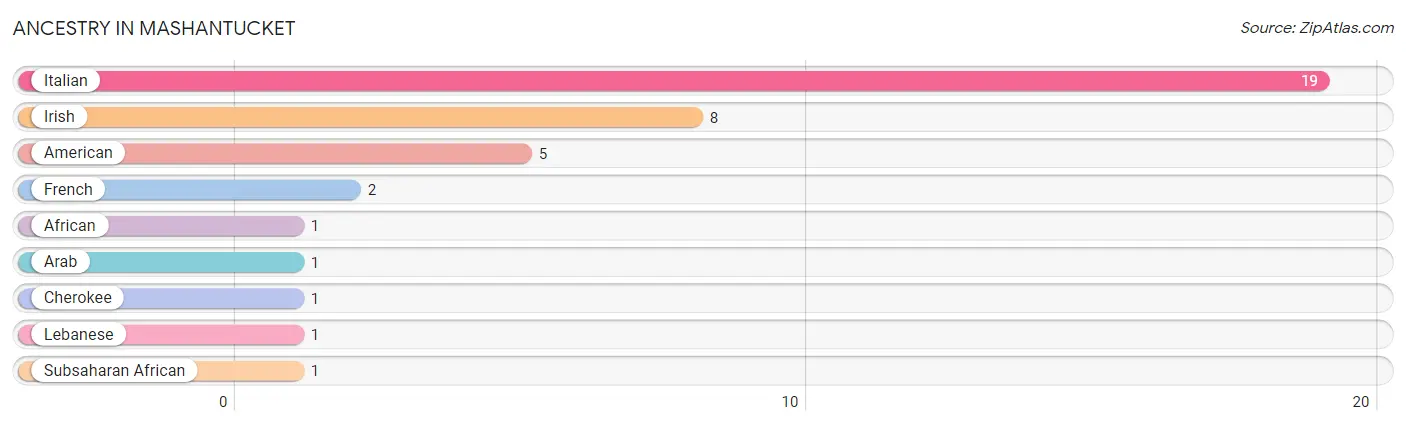
| Ancestry | # Population | % Population |
| African | 1 | 1.0% |
| American | 5 | 4.8% |
| Arab | 1 | 1.0% |
| Cherokee | 1 | 1.0% |
| French | 2 | 1.9% |
| Irish | 8 | 7.7% |
| Italian | 19 | 18.3% |
| Lebanese | 1 | 1.0% |
| Subsaharan African | 1 | 1.0% | View All 9 Rows |
Immigrants in Mashantucket

| Immigration Origin | # Population | % Population | View All 0 Rows |
Sex and Age in Mashantucket
Sex and Age in Mashantucket
The most populous age groups in Mashantucket are Under 5 Years (18 | 31.0%) for men and 45 to 49 Years (10 | 21.7%) for women.
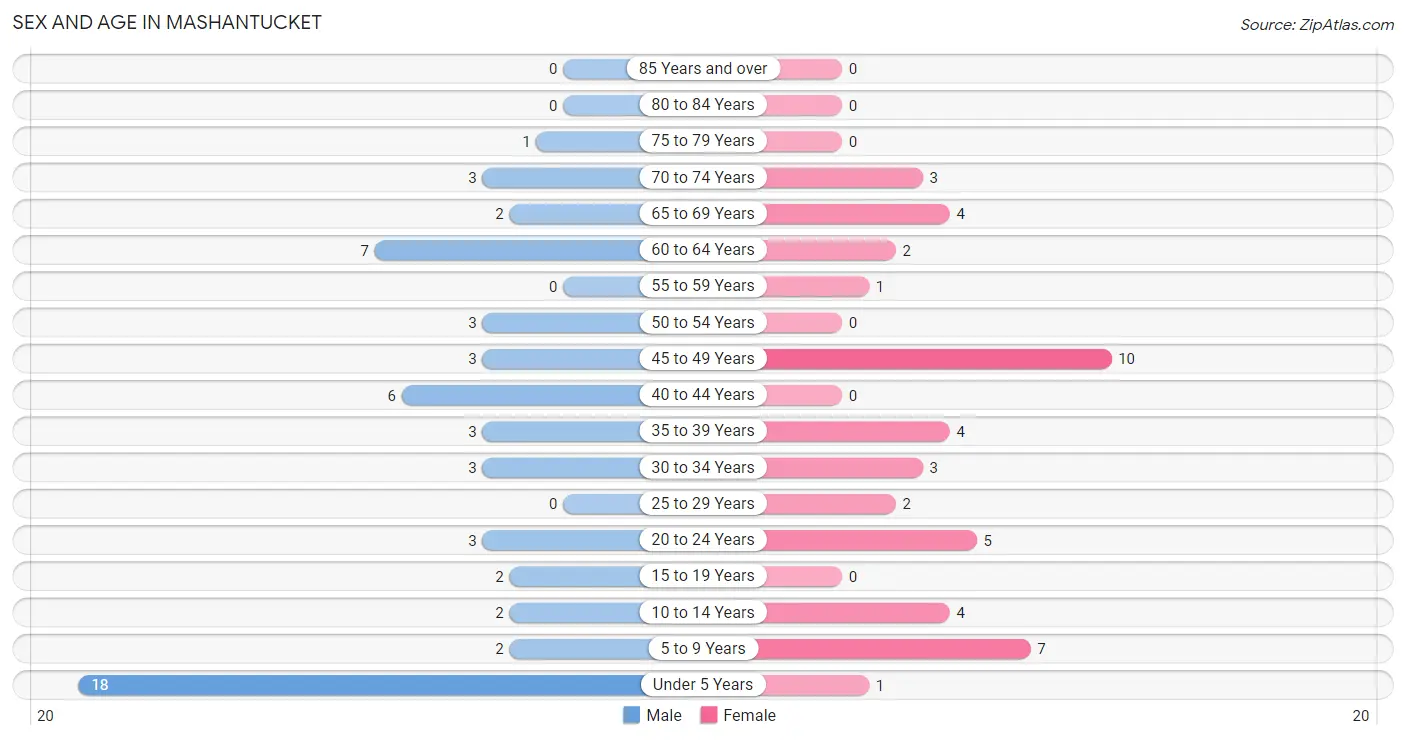
| Age Bracket | Male | Female |
| Under 5 Years | 18 (31.0%) | 1 (2.2%) |
| 5 to 9 Years | 2 (3.5%) | 7 (15.2%) |
| 10 to 14 Years | 2 (3.5%) | 4 (8.7%) |
| 15 to 19 Years | 2 (3.5%) | 0 (0.0%) |
| 20 to 24 Years | 3 (5.2%) | 5 (10.9%) |
| 25 to 29 Years | 0 (0.0%) | 2 (4.3%) |
| 30 to 34 Years | 3 (5.2%) | 3 (6.5%) |
| 35 to 39 Years | 3 (5.2%) | 4 (8.7%) |
| 40 to 44 Years | 6 (10.3%) | 0 (0.0%) |
| 45 to 49 Years | 3 (5.2%) | 10 (21.7%) |
| 50 to 54 Years | 3 (5.2%) | 0 (0.0%) |
| 55 to 59 Years | 0 (0.0%) | 1 (2.2%) |
| 60 to 64 Years | 7 (12.1%) | 2 (4.3%) |
| 65 to 69 Years | 2 (3.5%) | 4 (8.7%) |
| 70 to 74 Years | 3 (5.2%) | 3 (6.5%) |
| 75 to 79 Years | 1 (1.7%) | 0 (0.0%) |
| 80 to 84 Years | 0 (0.0%) | 0 (0.0%) |
| 85 Years and over | 0 (0.0%) | 0 (0.0%) |
| Total | 58 (100.0%) | 46 (100.0%) |
Families and Households in Mashantucket
Median Family Size in Mashantucket
The median family size in Mashantucket is 3.88 persons per family, with married-couple families (23 | 92.0%) accounting for the largest median family size of 3.96 persons per family. On the other hand, single male/father families (1 | 4.0%) represent the smallest median family size with 3.00 persons per family.
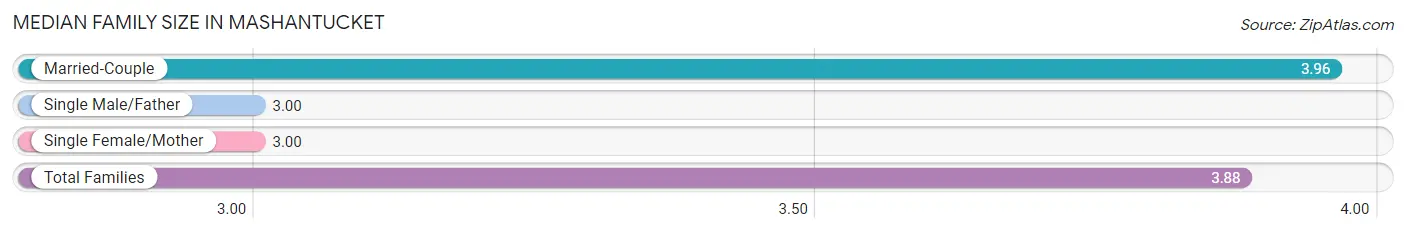
| Family Type | # Families | Family Size |
| Married-Couple | 23 (92.0%) | 3.96 |
| Single Male/Father | 1 (4.0%) | 3.00 |
| Single Female/Mother | 1 (4.0%) | 3.00 |
| Total Families | 25 (100.0%) | 3.88 |
Median Household Size in Mashantucket
The median household size in Mashantucket is 3.71 persons per household, with married-couple households (23 | 82.1%) accounting for the largest median household size of 4 persons per household. non-family households (3 | 10.7%) represent the smallest median household size with 2.00 persons per household.
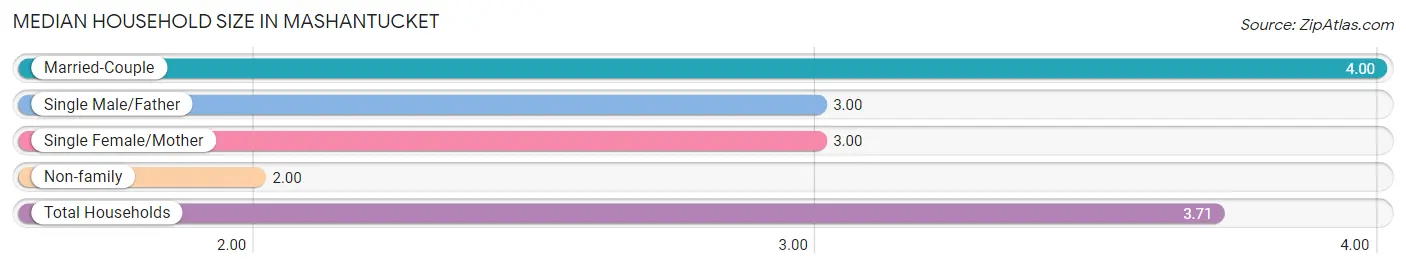
| Household Type | # Households | Household Size |
| Married-Couple | 23 (82.1%) | 4.00 |
| Single Male/Father | 1 (3.6%) | 3.00 |
| Single Female/Mother | 1 (3.6%) | 3.00 |
| Non-family | 3 (10.7%) | 2.00 |
| Total Households | 28 (100.0%) | 3.71 |
Household Size by Marriage Status in Mashantucket
Out of a total of 28 households in Mashantucket, 25 (89.3%) are family households, while 3 (10.7%) are nonfamily households. The most numerous type of family households are 4-person households, comprising 8, and the most common type of nonfamily households are 1-person households, comprising 2.
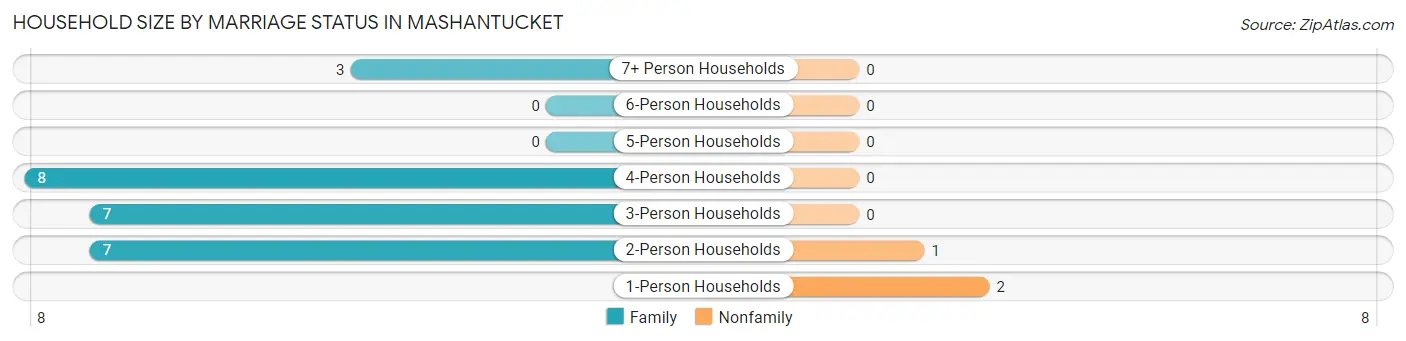
| Household Size | Family Households | Nonfamily Households |
| 1-Person Households | - | 2 (7.1%) |
| 2-Person Households | 7 (25.0%) | 1 (3.6%) |
| 3-Person Households | 7 (25.0%) | 0 (0.0%) |
| 4-Person Households | 8 (28.6%) | 0 (0.0%) |
| 5-Person Households | 0 (0.0%) | 0 (0.0%) |
| 6-Person Households | 0 (0.0%) | 0 (0.0%) |
| 7+ Person Households | 3 (10.7%) | 0 (0.0%) |
| Total | 25 (89.3%) | 3 (10.7%) |
Female Fertility in Mashantucket
Fertility by Age in Mashantucket
Average fertility rate in Mashantucket is 167.0 births per 1,000 women. Women in the age bracket of 20 to 34 years have the highest fertility rate with 200.0 births per 1,000 women. Women in the age bracket of 20 to 34 years acount for 50.0% of all women with births.
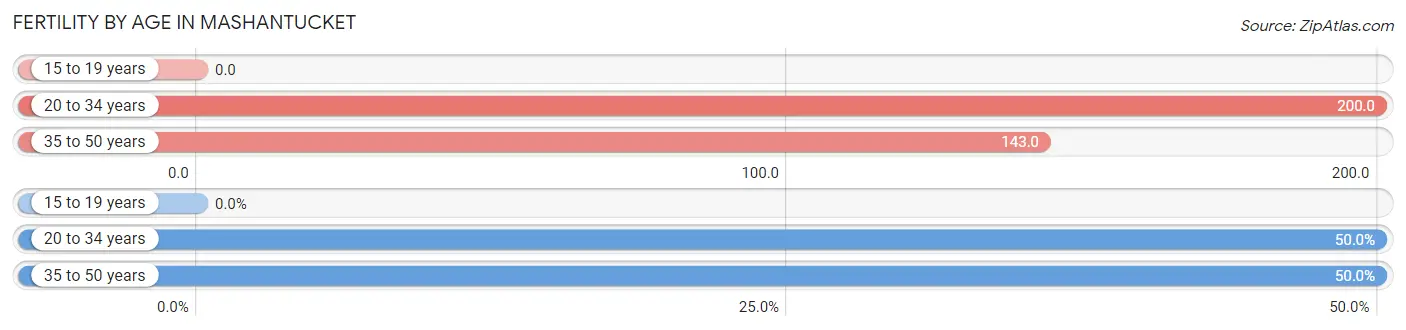
| Age Bracket | Women with Births | Births / 1,000 Women |
| 15 to 19 years | 0 (0.0%) | 0.0 |
| 20 to 34 years | 2 (50.0%) | 200.0 |
| 35 to 50 years | 2 (50.0%) | 143.0 |
| Total | 4 (100.0%) | 167.0 |
Fertility by Age by Marriage Status in Mashantucket
50.0% of women with births (4) in Mashantucket are married. The highest percentage of unmarried women with births falls into 20 to 34 years age bracket with 100.0% of them unmarried at the time of birth, while the lowest percentage of unmarried women with births belong to 35 to 50 years age bracket with 0.0% of them unmarried.
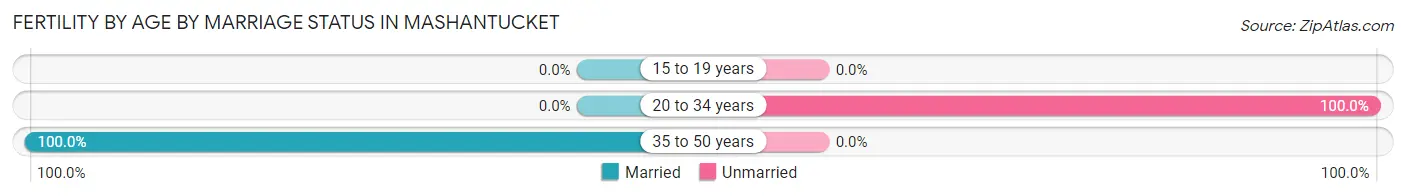
| Age Bracket | Married | Unmarried |
| 15 to 19 years | 0 (0.0%) | 0 (0.0%) |
| 20 to 34 years | 0 (0.0%) | 2 (100.0%) |
| 35 to 50 years | 2 (100.0%) | 0 (0.0%) |
| Total | 2 (50.0%) | 2 (50.0%) |
Fertility by Education in Mashantucket
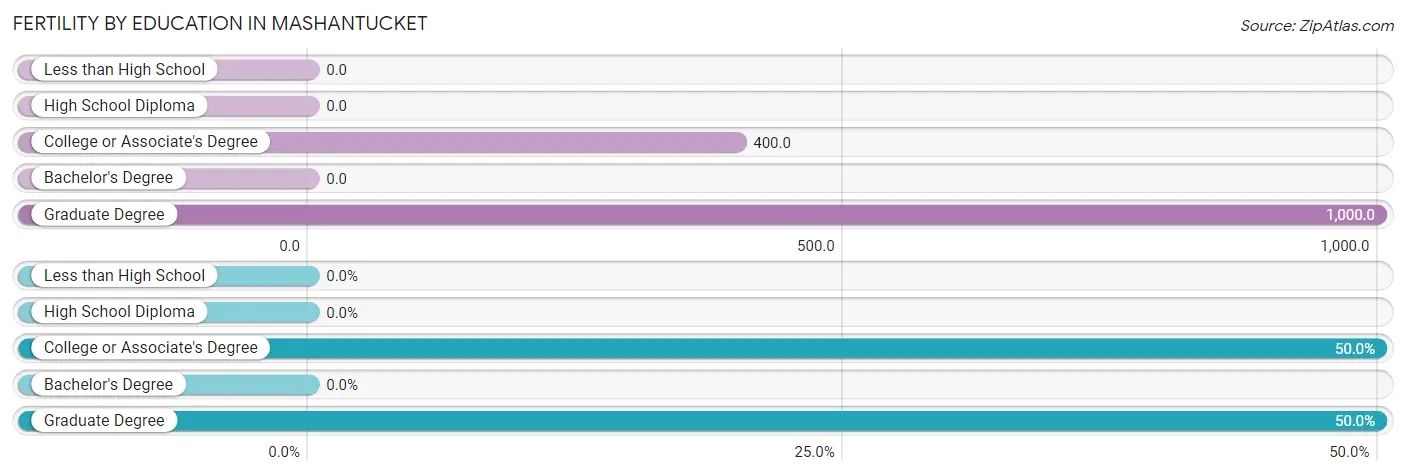
| Educational Attainment | Women with Births | Births / 1,000 Women |
| Less than High School | 0 (0.0%) | 0.0 |
| High School Diploma | 0 (0.0%) | 0.0 |
| College or Associate's Degree | 2 (50.0%) | 400.0 |
| Bachelor's Degree | 0 (0.0%) | 0.0 |
| Graduate Degree | 2 (50.0%) | 1,000.0 |
| Total | 4 (100.0%) | 167.0 |
Fertility by Education by Marriage Status in Mashantucket
50.0% of women with births in Mashantucket are unmarried. Women with the educational attainment of college or associate's degree are most likely to be married with 100.0% of them married at childbirth, while women with the educational attainment of graduate degree are least likely to be married with 100.0% of them unmarried at childbirth.
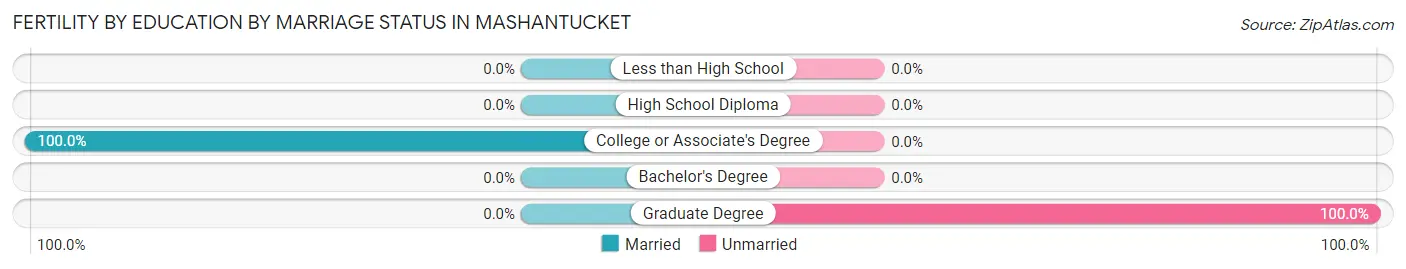
| Educational Attainment | Married | Unmarried |
| Less than High School | 0 (0.0%) | 0 (0.0%) |
| High School Diploma | 0 (0.0%) | 0 (0.0%) |
| College or Associate's Degree | 2 (100.0%) | 0 (0.0%) |
| Bachelor's Degree | 0 (0.0%) | 0 (0.0%) |
| Graduate Degree | 0 (0.0%) | 2 (100.0%) |
| Total | 2 (50.0%) | 2 (50.0%) |
Employment Characteristics in Mashantucket
Employment by Class of Employer in Mashantucket
Among the 40 employed individuals in Mashantucket, private company employees (18 | 45.0%), local government employees (14 | 35.0%), and state government employees (3 | 7.5%) make up the most common classes of employment.
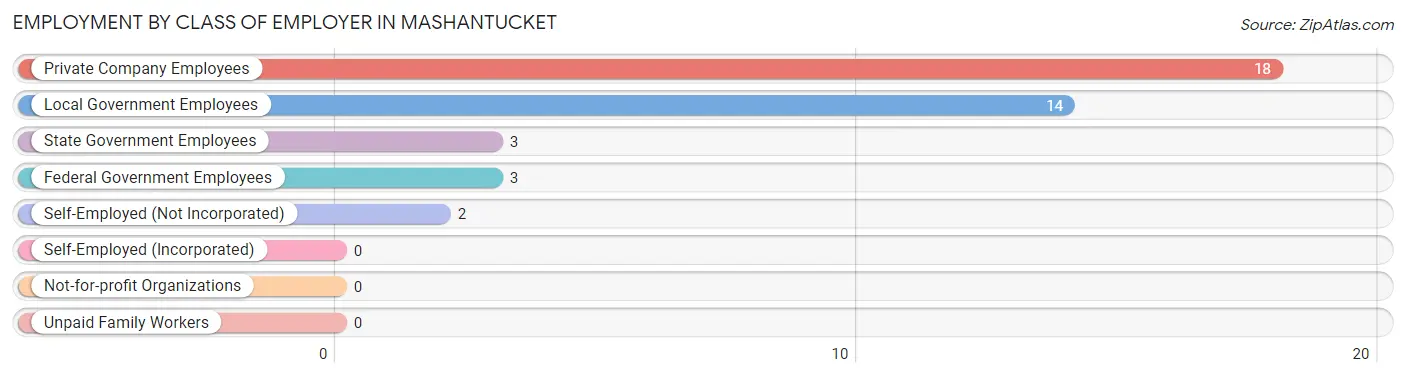
| Employer Class | # Employees | % Employees |
| Private Company Employees | 18 | 45.0% |
| Self-Employed (Incorporated) | 0 | 0.0% |
| Self-Employed (Not Incorporated) | 2 | 5.0% |
| Not-for-profit Organizations | 0 | 0.0% |
| Local Government Employees | 14 | 35.0% |
| State Government Employees | 3 | 7.5% |
| Federal Government Employees | 3 | 7.5% |
| Unpaid Family Workers | 0 | 0.0% |
| Total | 40 | 100.0% |
Employment Status by Age in Mashantucket
According to the labor force statistics for Mashantucket, out of the total population over 16 years of age (70), 62.9% or 44 individuals are in the labor force, with 4.5% or 2 of them unemployed. The age group with the highest labor force participation rate is 16 to 19 years, with 100.0% or 2 individuals in the labor force. Within the labor force, the 16 to 19 years age range has the highest percentage of unemployed individuals, with 100.0% or 2 of them being unemployed.
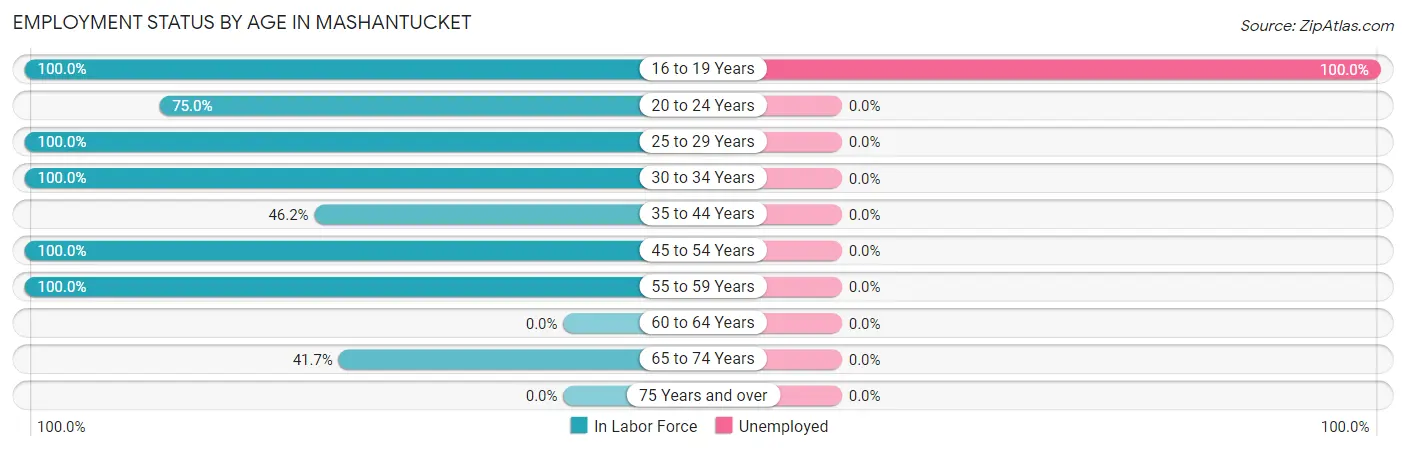
| Age Bracket | In Labor Force | Unemployed |
| 16 to 19 Years | 2 (100.0%) | 2 (100.0%) |
| 20 to 24 Years | 6 (75.0%) | 0 (0.0%) |
| 25 to 29 Years | 2 (100.0%) | 0 (0.0%) |
| 30 to 34 Years | 6 (100.0%) | 0 (0.0%) |
| 35 to 44 Years | 6 (46.2%) | 0 (0.0%) |
| 45 to 54 Years | 16 (100.0%) | 0 (0.0%) |
| 55 to 59 Years | 1 (100.0%) | 0 (0.0%) |
| 60 to 64 Years | 0 (0.0%) | 0 (0.0%) |
| 65 to 74 Years | 5 (41.7%) | 0 (0.0%) |
| 75 Years and over | 0 (0.0%) | 0 (0.0%) |
| Total | 44 (62.9%) | 2 (4.5%) |
Employment Status by Educational Attainment in Mashantucket
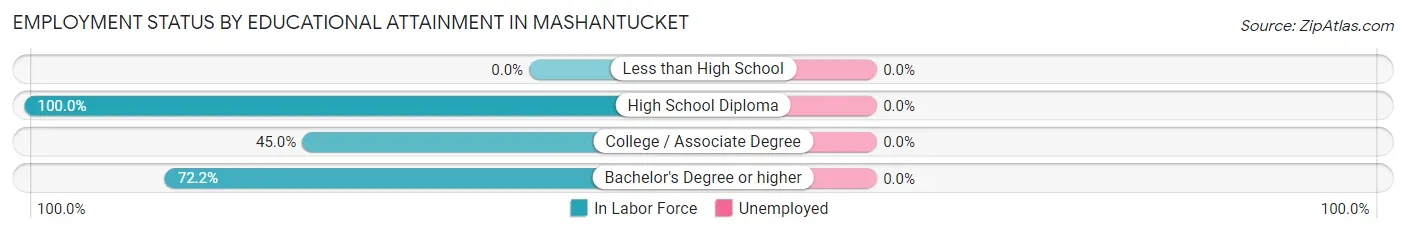
| Educational Attainment | In Labor Force | Unemployed |
| Less than High School | 0 (0.0%) | 0 (0.0%) |
| High School Diploma | 9 (100.0%) | 0 (0.0%) |
| College / Associate Degree | 9 (45.0%) | 0 (0.0%) |
| Bachelor's Degree or higher | 13 (72.2%) | 0 (0.0%) |
| Total | 31 (66.0%) | 0 (0.0%) |
Employment Occupations by Sex in Mashantucket
Management, Business, Science and Arts Occupations
The most common Management, Business, Science and Arts occupations in Mashantucket are Management (13 | 30.9%), Computers, Engineering & Science (2 | 4.8%), Computers & Mathematics (2 | 4.8%), Community & Social Service (2 | 4.8%), and Arts, Media & Entertainment (2 | 4.8%).
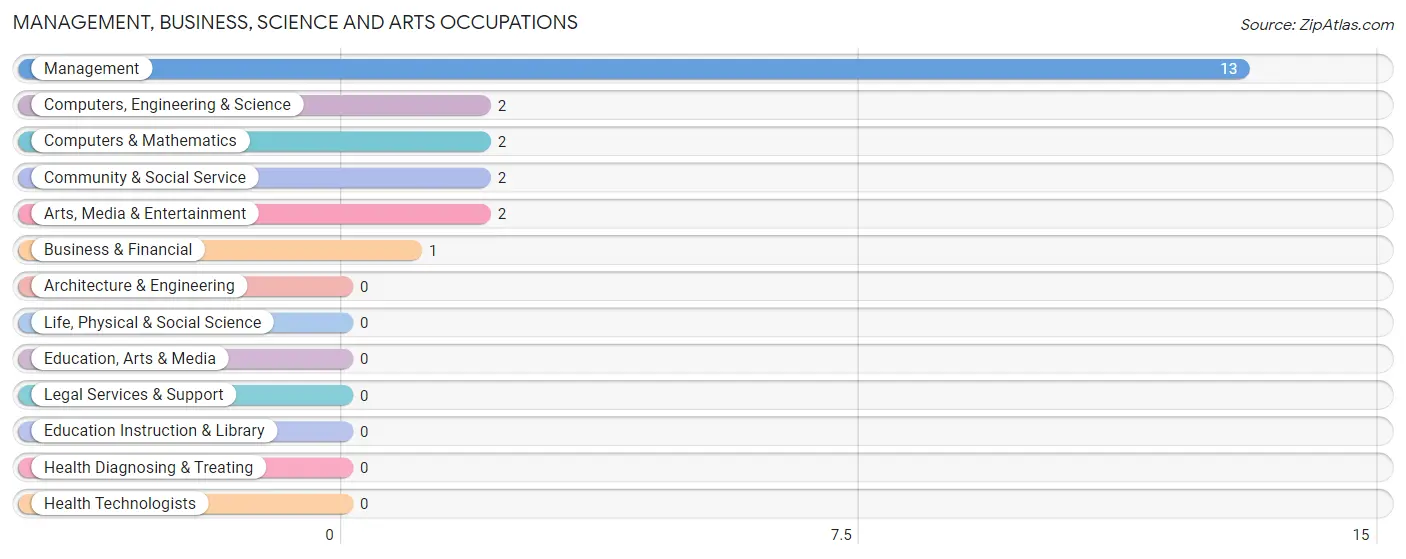
Management, Business, Science and Arts Occupations by Sex
Within the Management, Business, Science and Arts occupations in Mashantucket, the most male-oriented occupations are Computers, Engineering & Science (100.0%), Computers & Mathematics (100.0%), and Community & Social Service (100.0%), while the most female-oriented occupations are Business & Financial (100.0%), and Management (53.8%).
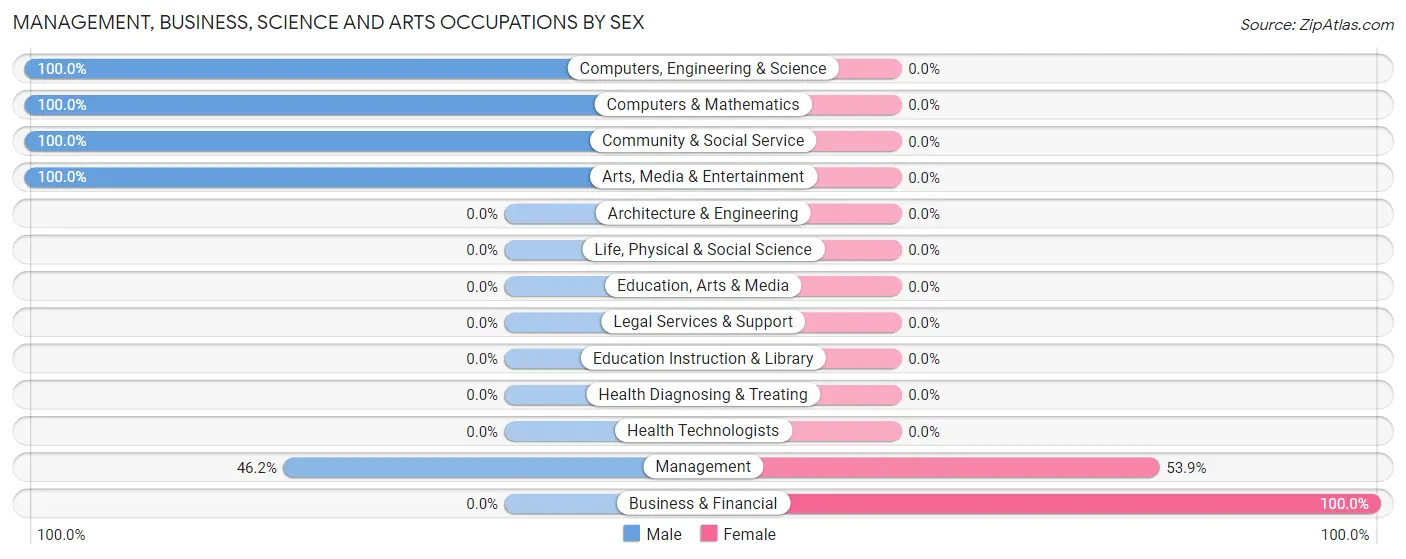
| Occupation | Male | Female |
| Management | 6 (46.2%) | 7 (53.8%) |
| Business & Financial | 0 (0.0%) | 1 (100.0%) |
| Computers, Engineering & Science | 2 (100.0%) | 0 (0.0%) |
| Computers & Mathematics | 2 (100.0%) | 0 (0.0%) |
| Architecture & Engineering | 0 (0.0%) | 0 (0.0%) |
| Life, Physical & Social Science | 0 (0.0%) | 0 (0.0%) |
| Community & Social Service | 2 (100.0%) | 0 (0.0%) |
| Education, Arts & Media | 0 (0.0%) | 0 (0.0%) |
| Legal Services & Support | 0 (0.0%) | 0 (0.0%) |
| Education Instruction & Library | 0 (0.0%) | 0 (0.0%) |
| Arts, Media & Entertainment | 2 (100.0%) | 0 (0.0%) |
| Health Diagnosing & Treating | 0 (0.0%) | 0 (0.0%) |
| Health Technologists | 0 (0.0%) | 0 (0.0%) |
| Total (Category) | 10 (55.6%) | 8 (44.4%) |
| Total (Overall) | 19 (45.2%) | 23 (54.8%) |
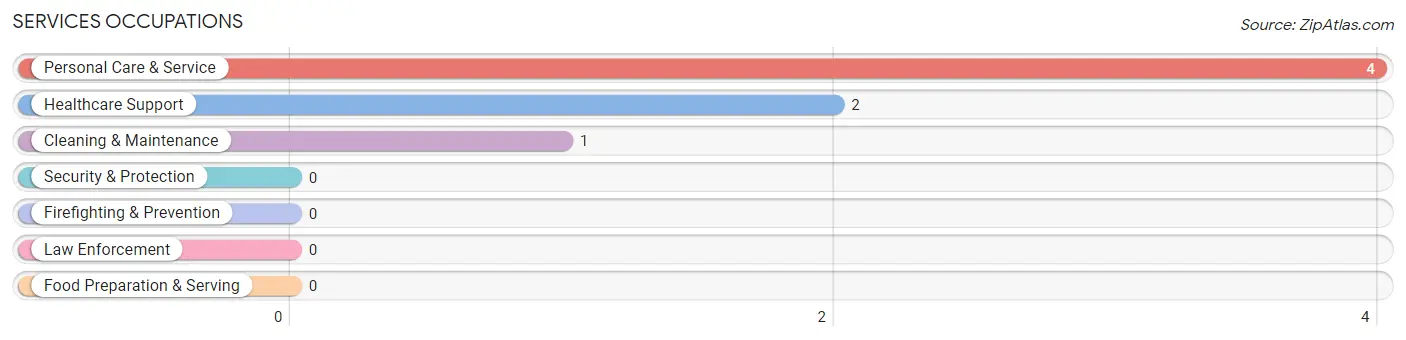
Services Occupations
The most common Services occupations in Mashantucket are Personal Care & Service (4 | 9.5%), Healthcare Support (2 | 4.8%), and Cleaning & Maintenance (1 | 2.4%).
Services Occupations by Sex
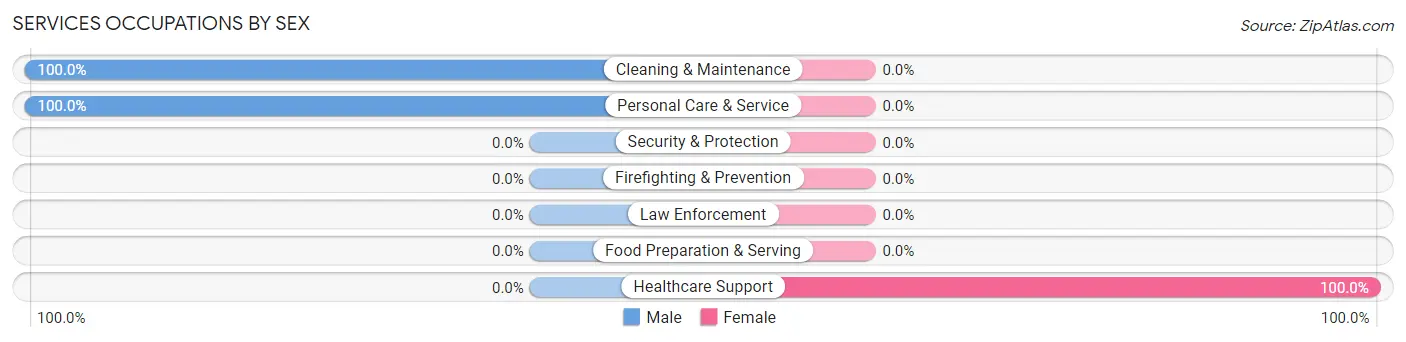
| Occupation | Male | Female |
| Healthcare Support | 0 (0.0%) | 2 (100.0%) |
| Security & Protection | 0 (0.0%) | 0 (0.0%) |
| Firefighting & Prevention | 0 (0.0%) | 0 (0.0%) |
| Law Enforcement | 0 (0.0%) | 0 (0.0%) |
| Food Preparation & Serving | 0 (0.0%) | 0 (0.0%) |
| Cleaning & Maintenance | 1 (100.0%) | 0 (0.0%) |
| Personal Care & Service | 4 (100.0%) | 0 (0.0%) |
| Total (Category) | 5 (71.4%) | 2 (28.6%) |
| Total (Overall) | 19 (45.2%) | 23 (54.8%) |
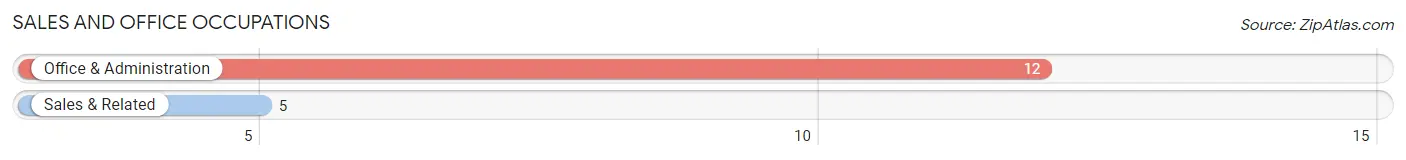
Sales and Office Occupations
The most common Sales and Office occupations in Mashantucket are Office & Administration (12 | 28.6%), and Sales & Related (5 | 11.9%).
Sales and Office Occupations by Sex
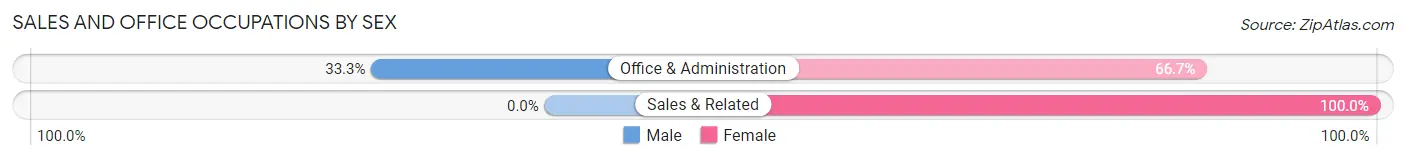
| Occupation | Male | Female |
| Sales & Related | 0 (0.0%) | 5 (100.0%) |
| Office & Administration | 4 (33.3%) | 8 (66.7%) |
| Total (Category) | 4 (23.5%) | 13 (76.5%) |
| Total (Overall) | 19 (45.2%) | 23 (54.8%) |
Natural Resources, Construction and Maintenance Occupations
Natural Resources, Construction and Maintenance Occupations by Sex
| Occupation | Male | Female |
| Farming, Fishing & Forestry | 0 (0.0%) | 0 (0.0%) |
| Construction & Extraction | 0 (0.0%) | 0 (0.0%) |
| Installation, Maintenance & Repair | 0 (0.0%) | 0 (0.0%) |
| Total (Category) | 0 (0.0%) | 0 (0.0%) |
| Total (Overall) | 19 (45.2%) | 23 (54.8%) |
Production, Transportation and Moving Occupations
Production, Transportation and Moving Occupations by Sex
| Occupation | Male | Female |
| Production | 0 (0.0%) | 0 (0.0%) |
| Transportation | 0 (0.0%) | 0 (0.0%) |
| Material Moving | 0 (0.0%) | 0 (0.0%) |
| Total (Category) | 0 (0.0%) | 0 (0.0%) |
| Total (Overall) | 19 (45.2%) | 23 (54.8%) |
Employment Industries by Sex in Mashantucket
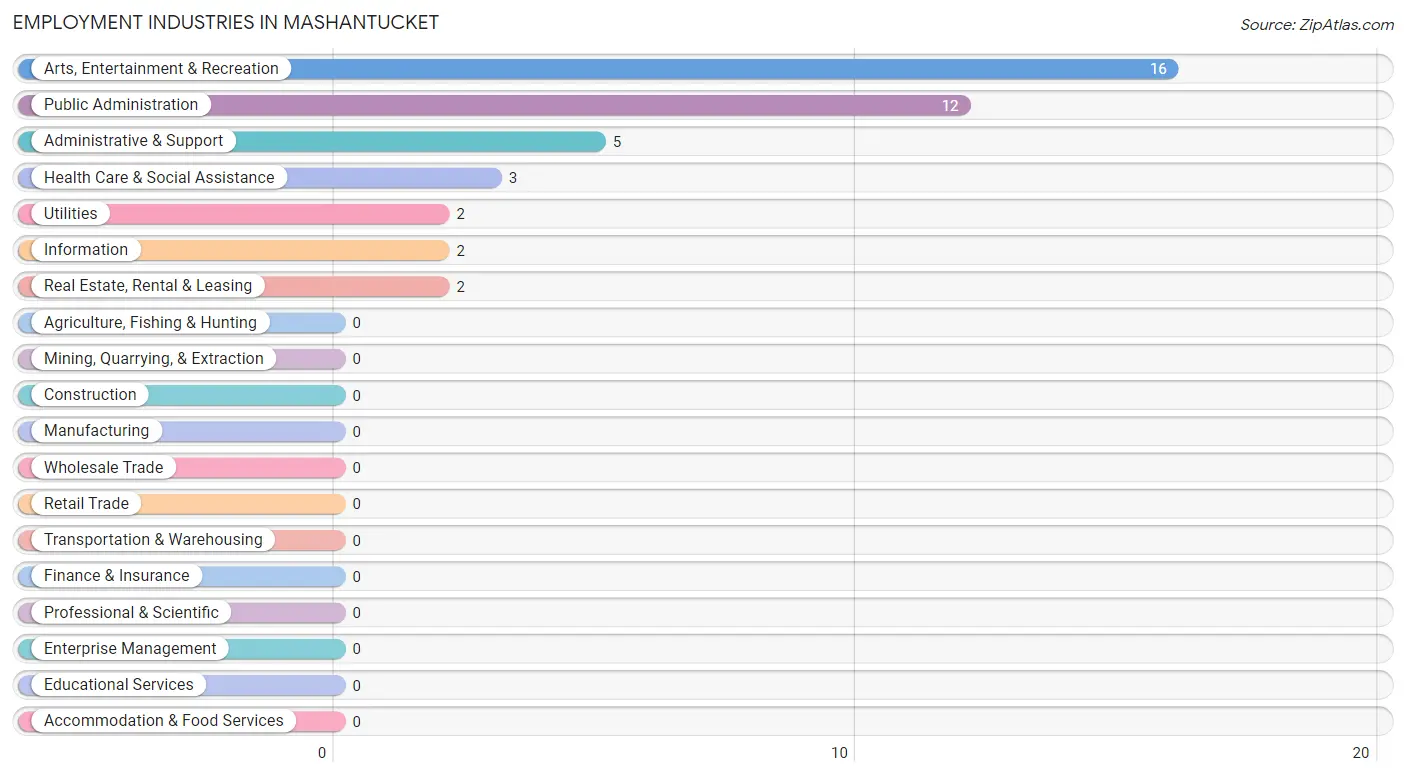
Employment Industries in Mashantucket
The major employment industries in Mashantucket include Arts, Entertainment & Recreation (16 | 38.1%), Public Administration (12 | 28.6%), Administrative & Support (5 | 11.9%), Health Care & Social Assistance (3 | 7.1%), and Utilities (2 | 4.8%).
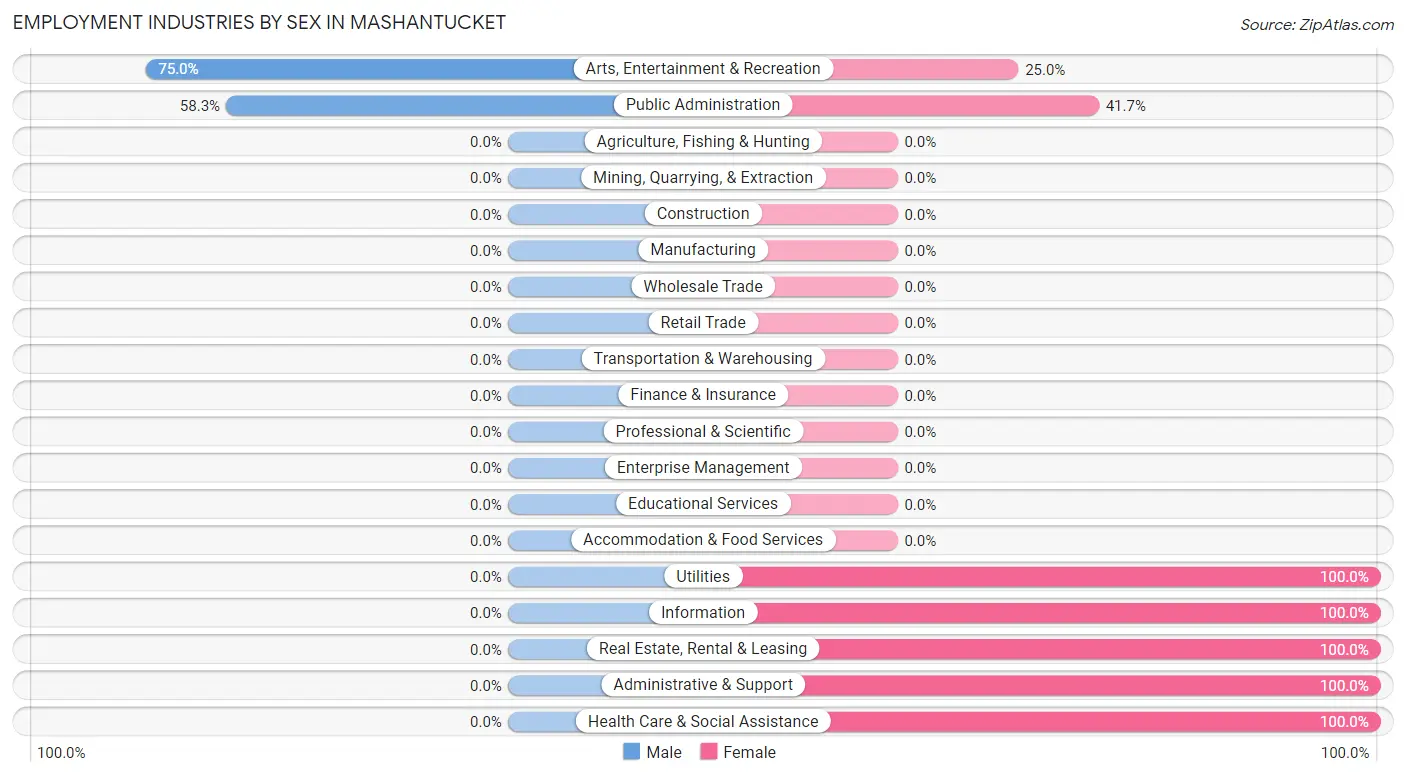
Employment Industries by Sex in Mashantucket
The Mashantucket industries that see more men than women are Arts, Entertainment & Recreation (75.0%), and Public Administration (58.3%), whereas the industries that tend to have a higher number of women are Utilities (100.0%), Information (100.0%), and Real Estate, Rental & Leasing (100.0%).
| Industry | Male | Female |
| Agriculture, Fishing & Hunting | 0 (0.0%) | 0 (0.0%) |
| Mining, Quarrying, & Extraction | 0 (0.0%) | 0 (0.0%) |
| Construction | 0 (0.0%) | 0 (0.0%) |
| Manufacturing | 0 (0.0%) | 0 (0.0%) |
| Wholesale Trade | 0 (0.0%) | 0 (0.0%) |
| Retail Trade | 0 (0.0%) | 0 (0.0%) |
| Transportation & Warehousing | 0 (0.0%) | 0 (0.0%) |
| Utilities | 0 (0.0%) | 2 (100.0%) |
| Information | 0 (0.0%) | 2 (100.0%) |
| Finance & Insurance | 0 (0.0%) | 0 (0.0%) |
| Real Estate, Rental & Leasing | 0 (0.0%) | 2 (100.0%) |
| Professional & Scientific | 0 (0.0%) | 0 (0.0%) |
| Enterprise Management | 0 (0.0%) | 0 (0.0%) |
| Administrative & Support | 0 (0.0%) | 5 (100.0%) |
| Educational Services | 0 (0.0%) | 0 (0.0%) |
| Health Care & Social Assistance | 0 (0.0%) | 3 (100.0%) |
| Arts, Entertainment & Recreation | 12 (75.0%) | 4 (25.0%) |
| Accommodation & Food Services | 0 (0.0%) | 0 (0.0%) |
| Public Administration | 7 (58.3%) | 5 (41.7%) |
| Total | 19 (45.2%) | 23 (54.8%) |
Education in Mashantucket
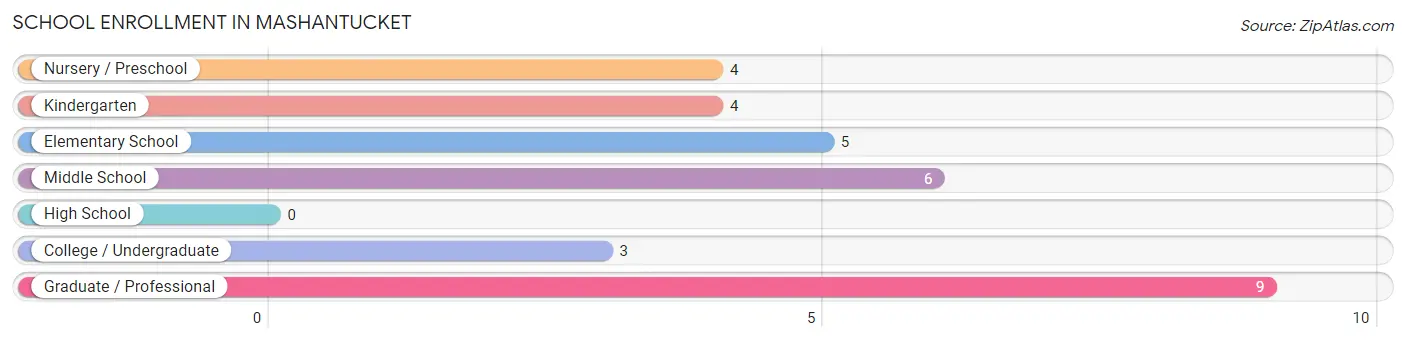
School Enrollment in Mashantucket
The most common levels of schooling among the 31 students in Mashantucket are graduate / professional (9 | 29.0%), middle school (6 | 19.4%), and elementary school (5 | 16.1%).
| School Level | # Students | % Students |
| Nursery / Preschool | 4 | 12.9% |
| Kindergarten | 4 | 12.9% |
| Elementary School | 5 | 16.1% |
| Middle School | 6 | 19.4% |
| High School | 0 | 0.0% |
| College / Undergraduate | 3 | 9.7% |
| Graduate / Professional | 9 | 29.0% |
| Total | 31 | 100.0% |
School Enrollment by Age by Funding Source in Mashantucket
Out of a total of 31 students who are enrolled in schools in Mashantucket, 14 (45.2%) attend a private institution, while the remaining 17 (54.8%) are enrolled in public schools. The age group of 20 to 24 year olds has the highest likelihood of being enrolled in private schools, with 2 (100.0% in the age bracket) enrolled. Conversely, the age group of 3 to 4 year olds has the lowest likelihood of being enrolled in a private school, with 4 (100.0% in the age bracket) attending a public institution.
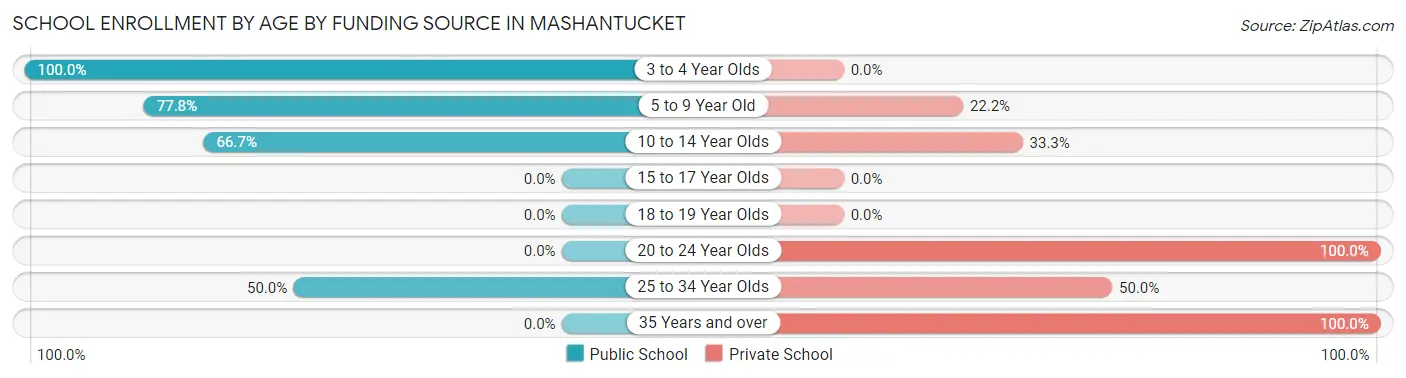
| Age Bracket | Public School | Private School |
| 3 to 4 Year Olds | 4 (100.0%) | 0 (0.0%) |
| 5 to 9 Year Old | 7 (77.8%) | 2 (22.2%) |
| 10 to 14 Year Olds | 4 (66.7%) | 2 (33.3%) |
| 15 to 17 Year Olds | 0 (0.0%) | 0 (0.0%) |
| 18 to 19 Year Olds | 0 (0.0%) | 0 (0.0%) |
| 20 to 24 Year Olds | 0 (0.0%) | 2 (100.0%) |
| 25 to 34 Year Olds | 2 (50.0%) | 2 (50.0%) |
| 35 Years and over | 0 (0.0%) | 6 (100.0%) |
| Total | 17 (54.8%) | 14 (45.2%) |
Educational Attainment by Field of Study in Mashantucket
Literature & languages (7 | 33.3%), social sciences (3 | 14.3%), business (3 | 14.3%), bio, nature & agricultural (2 | 9.5%), and science & technology (2 | 9.5%) are the most common fields of study among 21 individuals in Mashantucket who have obtained a bachelor's degree or higher.
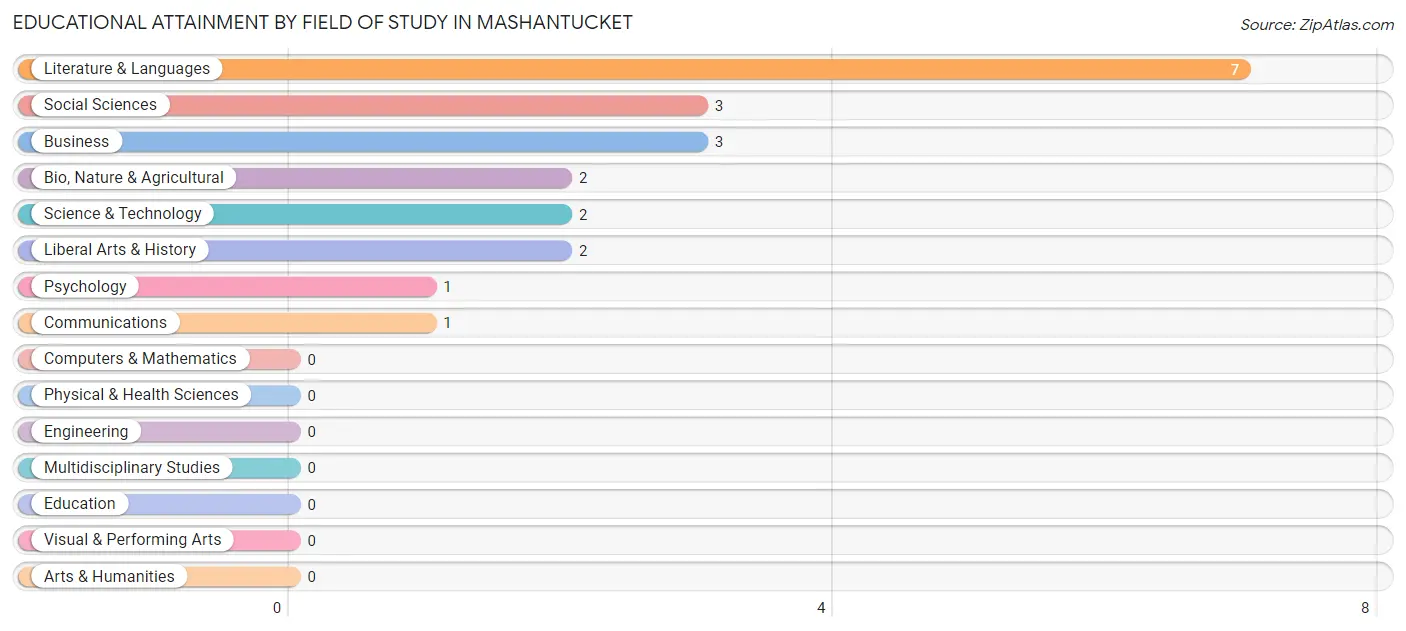
| Field of Study | # Graduates | % Graduates |
| Computers & Mathematics | 0 | 0.0% |
| Bio, Nature & Agricultural | 2 | 9.5% |
| Physical & Health Sciences | 0 | 0.0% |
| Psychology | 1 | 4.8% |
| Social Sciences | 3 | 14.3% |
| Engineering | 0 | 0.0% |
| Multidisciplinary Studies | 0 | 0.0% |
| Science & Technology | 2 | 9.5% |
| Business | 3 | 14.3% |
| Education | 0 | 0.0% |
| Literature & Languages | 7 | 33.3% |
| Liberal Arts & History | 2 | 9.5% |
| Visual & Performing Arts | 0 | 0.0% |
| Communications | 1 | 4.8% |
| Arts & Humanities | 0 | 0.0% |
| Total | 21 | 100.0% |
Transportation & Commute in Mashantucket
Vehicle Availability by Sex in Mashantucket
The most prevalent vehicle ownership categories in Mashantucket are males with 4 vehicles (7, accounting for 41.2%) and females with 4 vehicles (6, making up 30.4%).
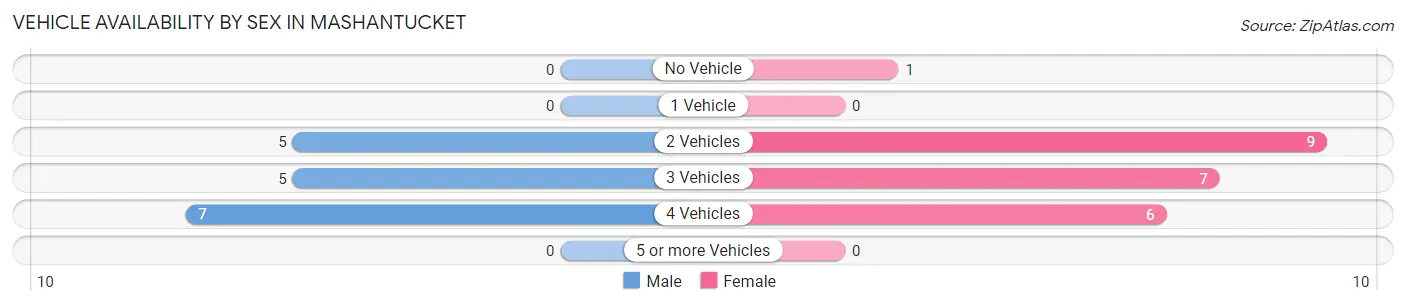
| Vehicles Available | Male | Female |
| No Vehicle | 0 (0.0%) | 1 (4.3%) |
| 1 Vehicle | 0 (0.0%) | 0 (0.0%) |
| 2 Vehicles | 5 (29.4%) | 9 (39.1%) |
| 3 Vehicles | 5 (29.4%) | 7 (30.4%) |
| 4 Vehicles | 7 (41.2%) | 6 (26.1%) |
| 5 or more Vehicles | 0 (0.0%) | 0 (0.0%) |
| Total | 17 (100.0%) | 23 (100.0%) |
Commute Time in Mashantucket
The most frequently occuring commute durations in Mashantucket are 5 to 9 minutes (26 commuters, 70.3%), 10 to 14 minutes (5 commuters, 13.5%), and 30 to 34 minutes (4 commuters, 10.8%).
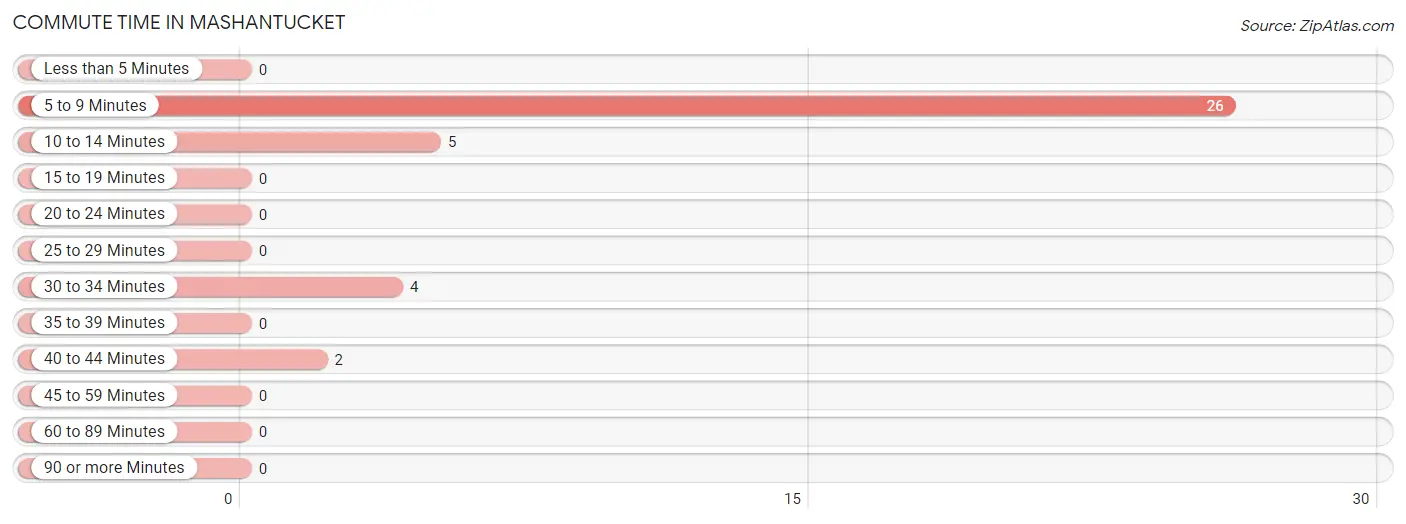
| Commute Time | # Commuters | % Commuters |
| Less than 5 Minutes | 0 | 0.0% |
| 5 to 9 Minutes | 26 | 70.3% |
| 10 to 14 Minutes | 5 | 13.5% |
| 15 to 19 Minutes | 0 | 0.0% |
| 20 to 24 Minutes | 0 | 0.0% |
| 25 to 29 Minutes | 0 | 0.0% |
| 30 to 34 Minutes | 4 | 10.8% |
| 35 to 39 Minutes | 0 | 0.0% |
| 40 to 44 Minutes | 2 | 5.4% |
| 45 to 59 Minutes | 0 | 0.0% |
| 60 to 89 Minutes | 0 | 0.0% |
| 90 or more Minutes | 0 | 0.0% |
Commute Time by Sex in Mashantucket
The most common commute times in Mashantucket are 5 to 9 minutes (11 commuters, 78.6%) for males and 5 to 9 minutes (15 commuters, 65.2%) for females.
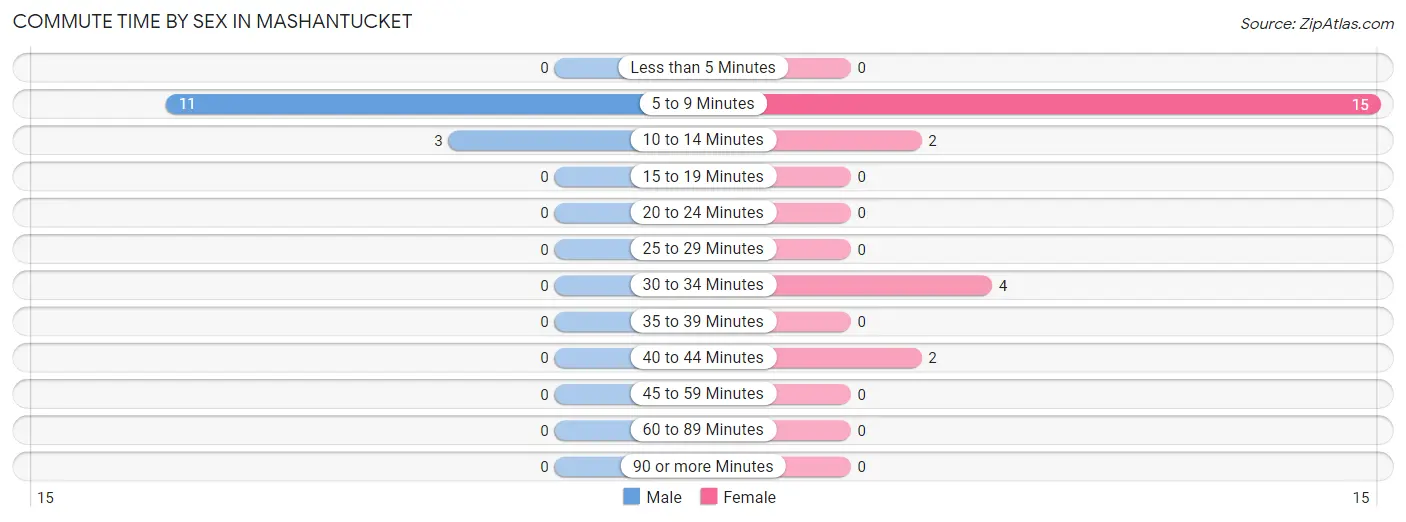
| Commute Time | Male | Female |
| Less than 5 Minutes | 0 (0.0%) | 0 (0.0%) |
| 5 to 9 Minutes | 11 (78.6%) | 15 (65.2%) |
| 10 to 14 Minutes | 3 (21.4%) | 2 (8.7%) |
| 15 to 19 Minutes | 0 (0.0%) | 0 (0.0%) |
| 20 to 24 Minutes | 0 (0.0%) | 0 (0.0%) |
| 25 to 29 Minutes | 0 (0.0%) | 0 (0.0%) |
| 30 to 34 Minutes | 0 (0.0%) | 4 (17.4%) |
| 35 to 39 Minutes | 0 (0.0%) | 0 (0.0%) |
| 40 to 44 Minutes | 0 (0.0%) | 2 (8.7%) |
| 45 to 59 Minutes | 0 (0.0%) | 0 (0.0%) |
| 60 to 89 Minutes | 0 (0.0%) | 0 (0.0%) |
| 90 or more Minutes | 0 (0.0%) | 0 (0.0%) |
Time of Departure to Work by Sex in Mashantucket
The most frequent times of departure to work in Mashantucket are 8:00 AM to 8:29 AM (5, 35.7%) for males and 7:30 AM to 7:59 AM (8, 34.8%) for females.
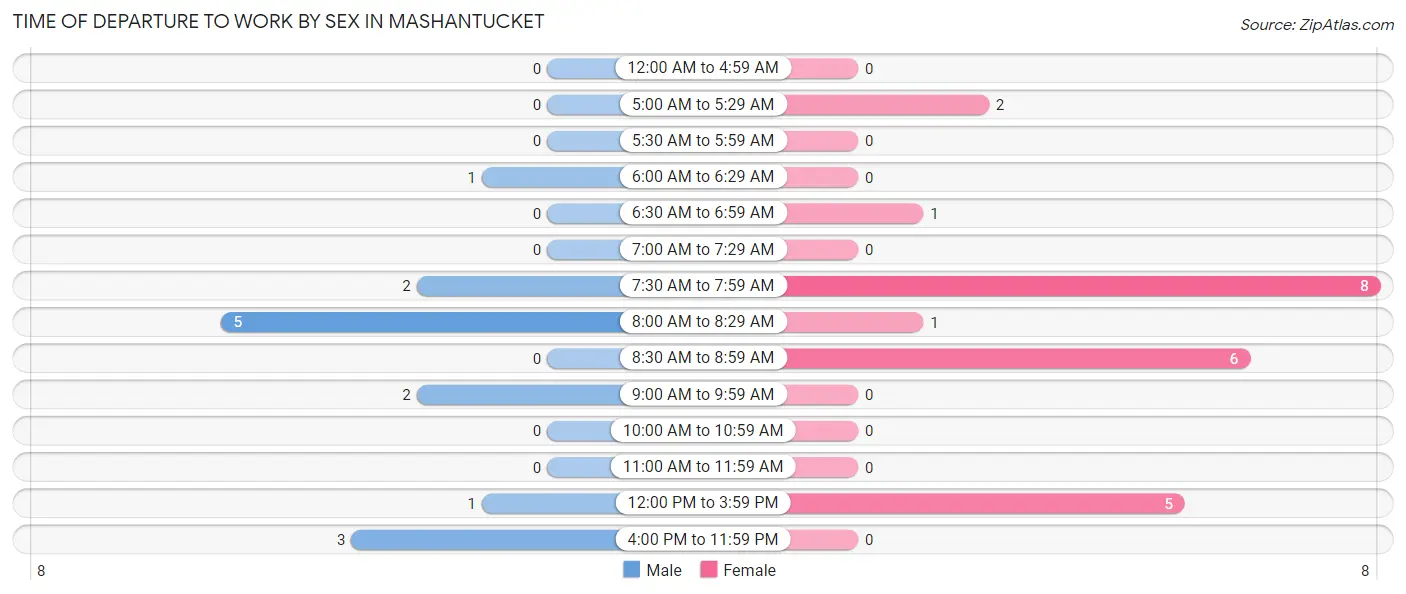
| Time of Departure | Male | Female |
| 12:00 AM to 4:59 AM | 0 (0.0%) | 0 (0.0%) |
| 5:00 AM to 5:29 AM | 0 (0.0%) | 2 (8.7%) |
| 5:30 AM to 5:59 AM | 0 (0.0%) | 0 (0.0%) |
| 6:00 AM to 6:29 AM | 1 (7.1%) | 0 (0.0%) |
| 6:30 AM to 6:59 AM | 0 (0.0%) | 1 (4.3%) |
| 7:00 AM to 7:29 AM | 0 (0.0%) | 0 (0.0%) |
| 7:30 AM to 7:59 AM | 2 (14.3%) | 8 (34.8%) |
| 8:00 AM to 8:29 AM | 5 (35.7%) | 1 (4.3%) |
| 8:30 AM to 8:59 AM | 0 (0.0%) | 6 (26.1%) |
| 9:00 AM to 9:59 AM | 2 (14.3%) | 0 (0.0%) |
| 10:00 AM to 10:59 AM | 0 (0.0%) | 0 (0.0%) |
| 11:00 AM to 11:59 AM | 0 (0.0%) | 0 (0.0%) |
| 12:00 PM to 3:59 PM | 1 (7.1%) | 5 (21.7%) |
| 4:00 PM to 11:59 PM | 3 (21.4%) | 0 (0.0%) |
| Total | 14 (100.0%) | 23 (100.0%) |
Housing Occupancy in Mashantucket
Occupancy by Ownership in Mashantucket
Of the total 28 dwellings in Mashantucket, owner-occupied units account for 24 (85.7%), while renter-occupied units make up 4 (14.3%).
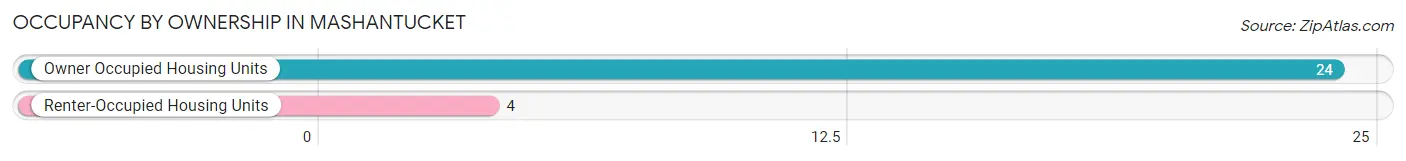
| Occupancy | # Housing Units | % Housing Units |
| Owner Occupied Housing Units | 24 | 85.7% |
| Renter-Occupied Housing Units | 4 | 14.3% |
| Total Occupied Housing Units | 28 | 100.0% |
Occupancy by Household Size in Mashantucket
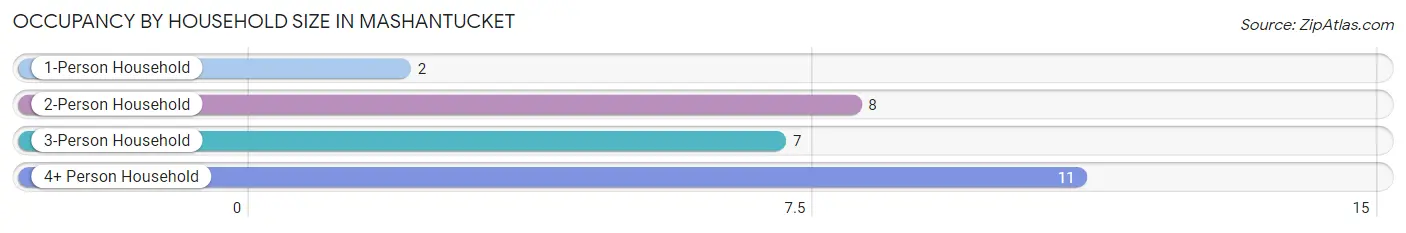
| Household Size | # Housing Units | % Housing Units |
| 1-Person Household | 2 | 7.1% |
| 2-Person Household | 8 | 28.6% |
| 3-Person Household | 7 | 25.0% |
| 4+ Person Household | 11 | 39.3% |
| Total Housing Units | 28 | 100.0% |
Occupancy by Ownership by Household Size in Mashantucket
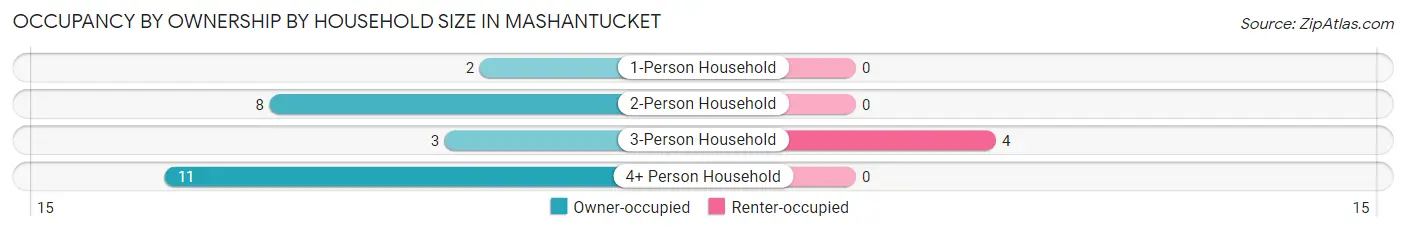
| Household Size | Owner-occupied | Renter-occupied |
| 1-Person Household | 2 (100.0%) | 0 (0.0%) |
| 2-Person Household | 8 (100.0%) | 0 (0.0%) |
| 3-Person Household | 3 (42.9%) | 4 (57.1%) |
| 4+ Person Household | 11 (100.0%) | 0 (0.0%) |
| Total Housing Units | 24 (85.7%) | 4 (14.3%) |
Occupancy by Educational Attainment in Mashantucket
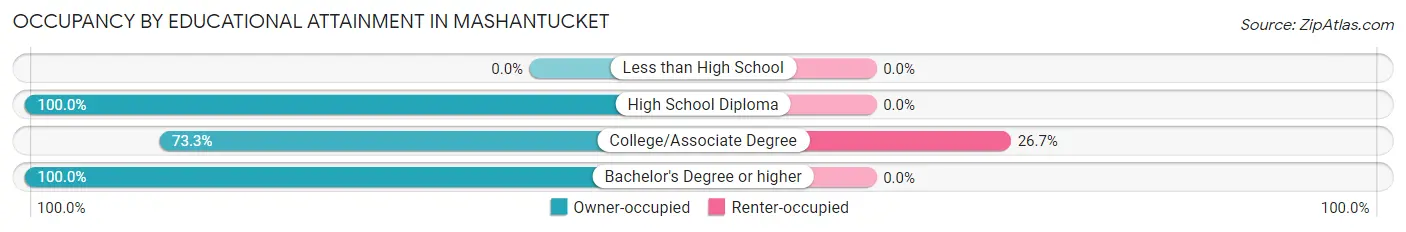
| Household Size | Owner-occupied | Renter-occupied |
| Less than High School | 0 (0.0%) | 0 (0.0%) |
| High School Diploma | 7 (100.0%) | 0 (0.0%) |
| College/Associate Degree | 11 (73.3%) | 4 (26.7%) |
| Bachelor's Degree or higher | 6 (100.0%) | 0 (0.0%) |
Occupancy by Age of Householder in Mashantucket
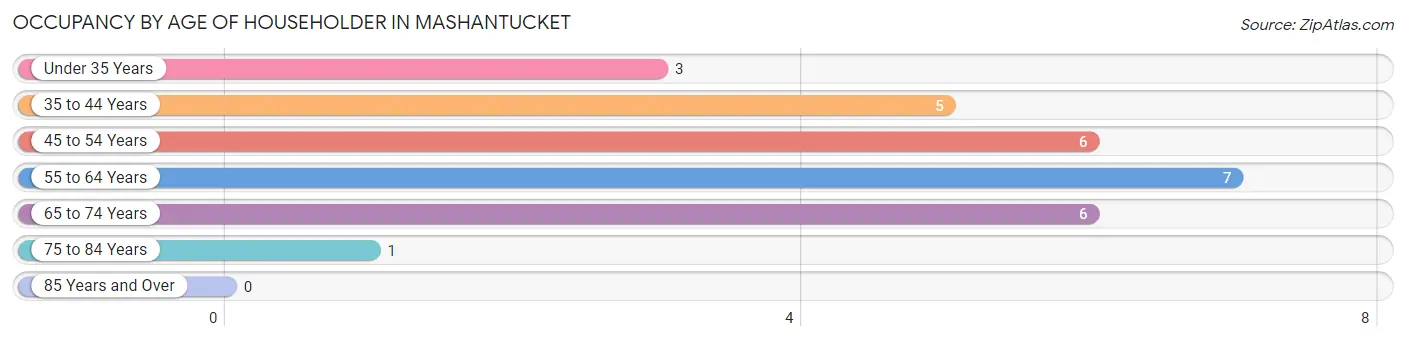
| Age Bracket | # Households | % Households |
| Under 35 Years | 3 | 10.7% |
| 35 to 44 Years | 5 | 17.9% |
| 45 to 54 Years | 6 | 21.4% |
| 55 to 64 Years | 7 | 25.0% |
| 65 to 74 Years | 6 | 21.4% |
| 75 to 84 Years | 1 | 3.6% |
| 85 Years and Over | 0 | 0.0% |
| Total | 28 | 100.0% |
Housing Finances in Mashantucket
Median Income by Occupancy in Mashantucket
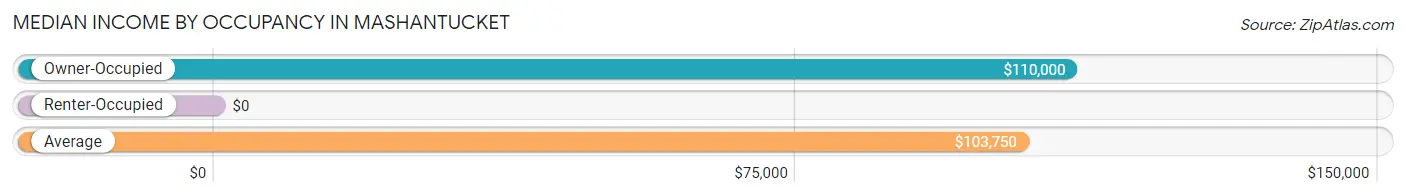
| Occupancy Type | # Households | Median Income |
| Owner-Occupied | 24 (85.7%) | $110,000 |
| Renter-Occupied | 4 (14.3%) | $0 |
| Average | 28 (100.0%) | $103,750 |
Occupancy by Householder Income Bracket in Mashantucket
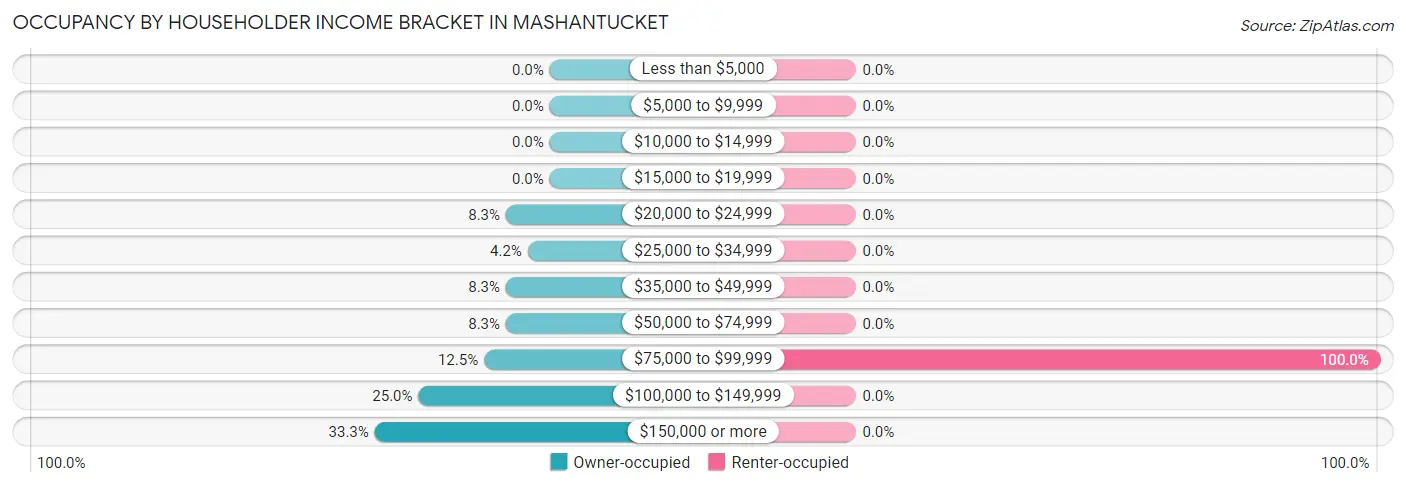
| Income Bracket | Owner-occupied | Renter-occupied |
| Less than $5,000 | 0 (0.0%) | 0 (0.0%) |
| $5,000 to $9,999 | 0 (0.0%) | 0 (0.0%) |
| $10,000 to $14,999 | 0 (0.0%) | 0 (0.0%) |
| $15,000 to $19,999 | 0 (0.0%) | 0 (0.0%) |
| $20,000 to $24,999 | 2 (8.3%) | 0 (0.0%) |
| $25,000 to $34,999 | 1 (4.2%) | 0 (0.0%) |
| $35,000 to $49,999 | 2 (8.3%) | 0 (0.0%) |
| $50,000 to $74,999 | 2 (8.3%) | 0 (0.0%) |
| $75,000 to $99,999 | 3 (12.5%) | 4 (100.0%) |
| $100,000 to $149,999 | 6 (25.0%) | 0 (0.0%) |
| $150,000 or more | 8 (33.3%) | 0 (0.0%) |
| Total | 24 (100.0%) | 4 (100.0%) |
Monthly Housing Cost Tiers in Mashantucket
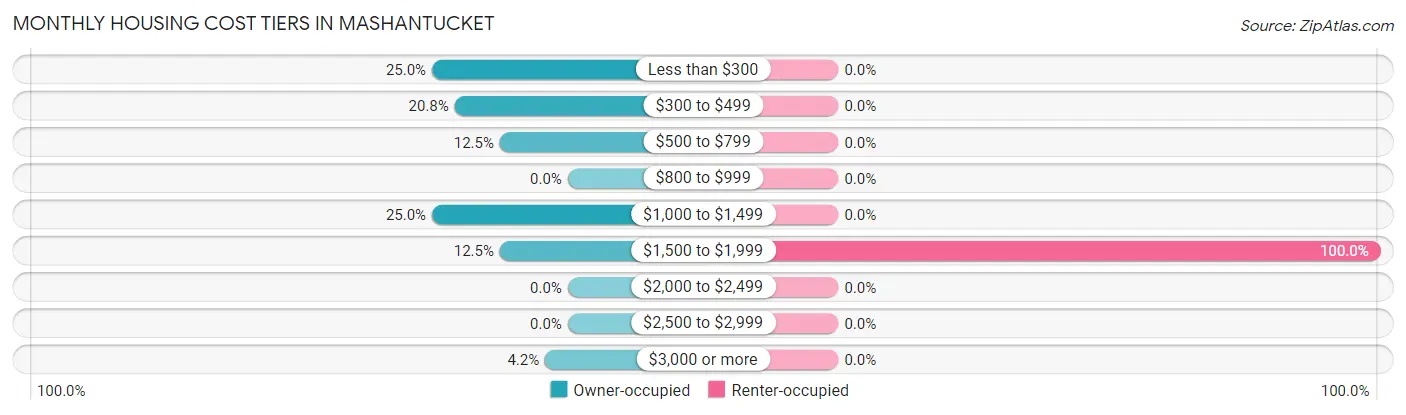
| Monthly Cost | Owner-occupied | Renter-occupied |
| Less than $300 | 6 (25.0%) | 0 (0.0%) |
| $300 to $499 | 5 (20.8%) | 0 (0.0%) |
| $500 to $799 | 3 (12.5%) | 0 (0.0%) |
| $800 to $999 | 0 (0.0%) | 0 (0.0%) |
| $1,000 to $1,499 | 6 (25.0%) | 0 (0.0%) |
| $1,500 to $1,999 | 3 (12.5%) | 4 (100.0%) |
| $2,000 to $2,499 | 0 (0.0%) | 0 (0.0%) |
| $2,500 to $2,999 | 0 (0.0%) | 0 (0.0%) |
| $3,000 or more | 1 (4.2%) | 0 (0.0%) |
| Total | 24 (100.0%) | 4 (100.0%) |
Physical Housing Characteristics in Mashantucket
Housing Structures in Mashantucket
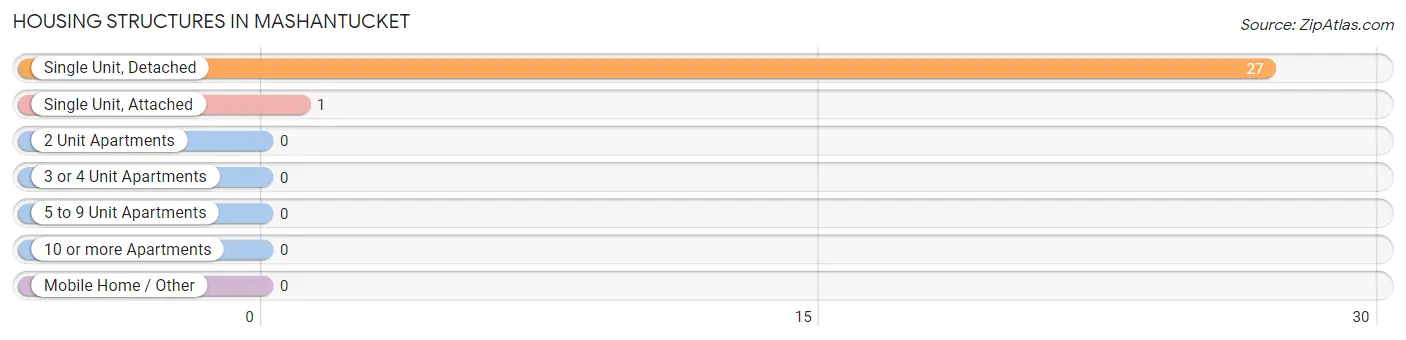
| Structure Type | # Housing Units | % Housing Units |
| Single Unit, Detached | 27 | 96.4% |
| Single Unit, Attached | 1 | 3.6% |
| 2 Unit Apartments | 0 | 0.0% |
| 3 or 4 Unit Apartments | 0 | 0.0% |
| 5 to 9 Unit Apartments | 0 | 0.0% |
| 10 or more Apartments | 0 | 0.0% |
| Mobile Home / Other | 0 | 0.0% |
| Total | 28 | 100.0% |
Housing Structures by Occupancy in Mashantucket
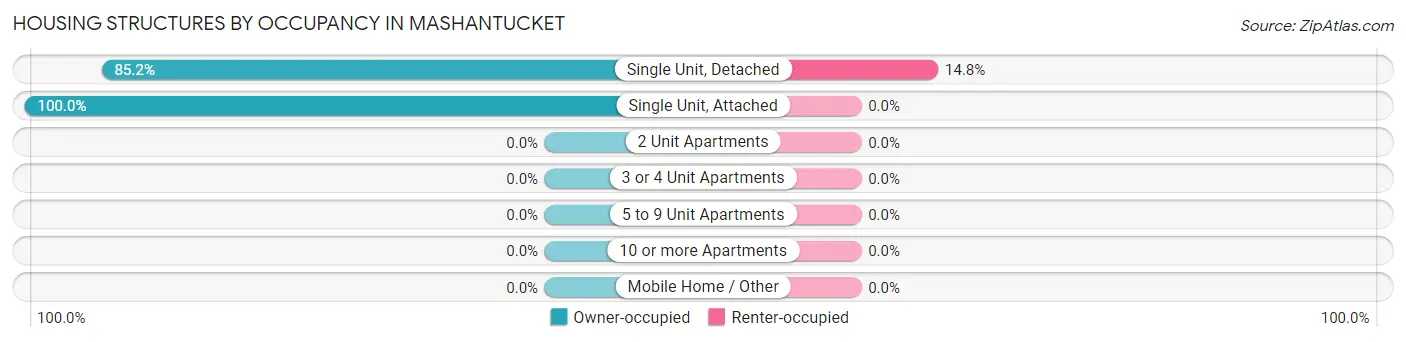
| Structure Type | Owner-occupied | Renter-occupied |
| Single Unit, Detached | 23 (85.2%) | 4 (14.8%) |
| Single Unit, Attached | 1 (100.0%) | 0 (0.0%) |
| 2 Unit Apartments | 0 (0.0%) | 0 (0.0%) |
| 3 or 4 Unit Apartments | 0 (0.0%) | 0 (0.0%) |
| 5 to 9 Unit Apartments | 0 (0.0%) | 0 (0.0%) |
| 10 or more Apartments | 0 (0.0%) | 0 (0.0%) |
| Mobile Home / Other | 0 (0.0%) | 0 (0.0%) |
| Total | 24 (85.7%) | 4 (14.3%) |
Housing Structures by Number of Rooms in Mashantucket
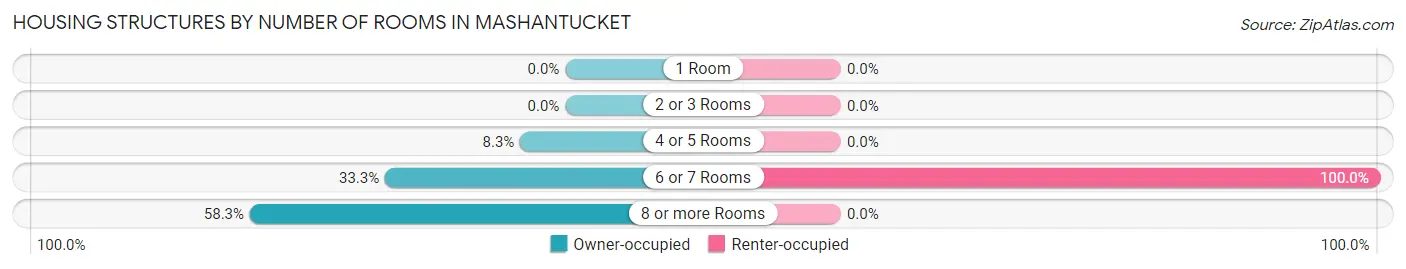
| Number of Rooms | Owner-occupied | Renter-occupied |
| 1 Room | 0 (0.0%) | 0 (0.0%) |
| 2 or 3 Rooms | 0 (0.0%) | 0 (0.0%) |
| 4 or 5 Rooms | 2 (8.3%) | 0 (0.0%) |
| 6 or 7 Rooms | 8 (33.3%) | 4 (100.0%) |
| 8 or more Rooms | 14 (58.3%) | 0 (0.0%) |
| Total | 24 (100.0%) | 4 (100.0%) |
Housing Structure by Heating Type in Mashantucket
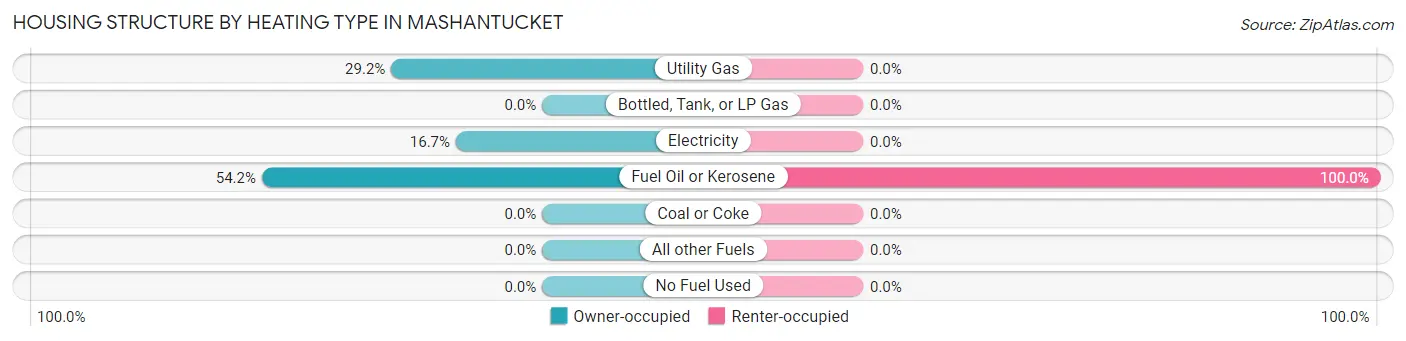
| Heating Type | Owner-occupied | Renter-occupied |
| Utility Gas | 7 (29.2%) | 0 (0.0%) |
| Bottled, Tank, or LP Gas | 0 (0.0%) | 0 (0.0%) |
| Electricity | 4 (16.7%) | 0 (0.0%) |
| Fuel Oil or Kerosene | 13 (54.2%) | 4 (100.0%) |
| Coal or Coke | 0 (0.0%) | 0 (0.0%) |
| All other Fuels | 0 (0.0%) | 0 (0.0%) |
| No Fuel Used | 0 (0.0%) | 0 (0.0%) |
| Total | 24 (100.0%) | 4 (100.0%) |
Household Vehicle Usage in Mashantucket
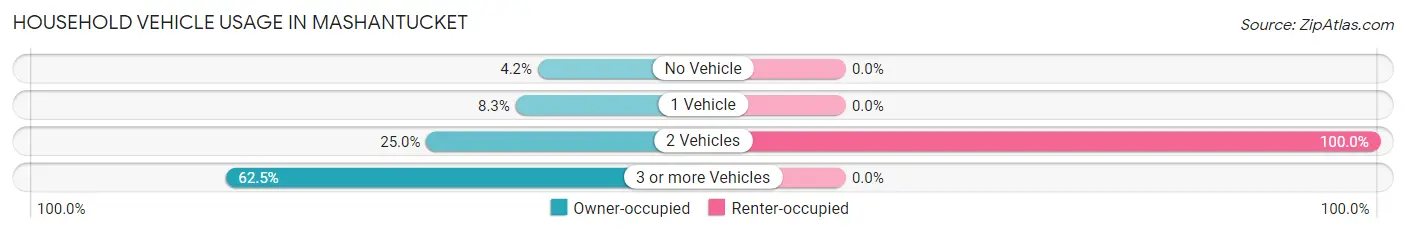
| Vehicles per Household | Owner-occupied | Renter-occupied |
| No Vehicle | 1 (4.2%) | 0 (0.0%) |
| 1 Vehicle | 2 (8.3%) | 0 (0.0%) |
| 2 Vehicles | 6 (25.0%) | 4 (100.0%) |
| 3 or more Vehicles | 15 (62.5%) | 0 (0.0%) |
| Total | 24 (100.0%) | 4 (100.0%) |
Real Estate & Mortgages in Mashantucket
Real Estate and Mortgage Overview in Mashantucket
| Characteristic | Without Mortgage | With Mortgage |
| Housing Units | 10 | 14 |
| Median Property Value | - | - |
| Median Household Income | $240,833 | $2 |
| Monthly Housing Costs | $288 | $1 |
| Real Estate Taxes | - | - |
Property Value by Mortgage Status in Mashantucket
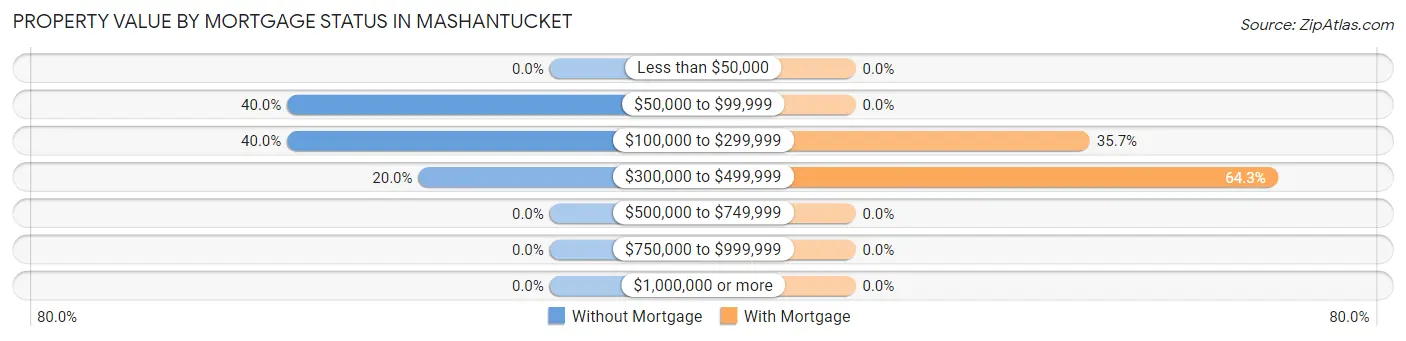
| Property Value | Without Mortgage | With Mortgage |
| Less than $50,000 | 0 (0.0%) | 0 (0.0%) |
| $50,000 to $99,999 | 4 (40.0%) | 0 (0.0%) |
| $100,000 to $299,999 | 4 (40.0%) | 5 (35.7%) |
| $300,000 to $499,999 | 2 (20.0%) | 9 (64.3%) |
| $500,000 to $749,999 | 0 (0.0%) | 0 (0.0%) |
| $750,000 to $999,999 | 0 (0.0%) | 0 (0.0%) |
| $1,000,000 or more | 0 (0.0%) | 0 (0.0%) |
| Total | 10 (100.0%) | 14 (100.0%) |
Household Income by Mortgage Status in Mashantucket
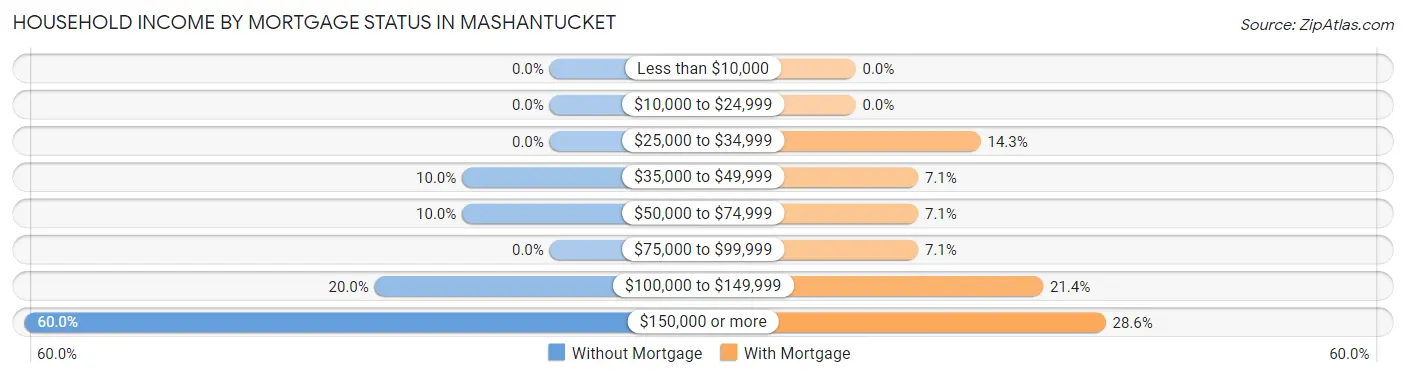
| Household Income | Without Mortgage | With Mortgage |
| Less than $10,000 | 0 (0.0%) | 0 (0.0%) |
| $10,000 to $24,999 | 0 (0.0%) | 0 (0.0%) |
| $25,000 to $34,999 | 0 (0.0%) | 2 (14.3%) |
| $35,000 to $49,999 | 1 (10.0%) | 1 (7.1%) |
| $50,000 to $74,999 | 1 (10.0%) | 1 (7.1%) |
| $75,000 to $99,999 | 0 (0.0%) | 1 (7.1%) |
| $100,000 to $149,999 | 2 (20.0%) | 3 (21.4%) |
| $150,000 or more | 6 (60.0%) | 4 (28.6%) |
| Total | 10 (100.0%) | 14 (100.0%) |
Property Value to Household Income Ratio in Mashantucket
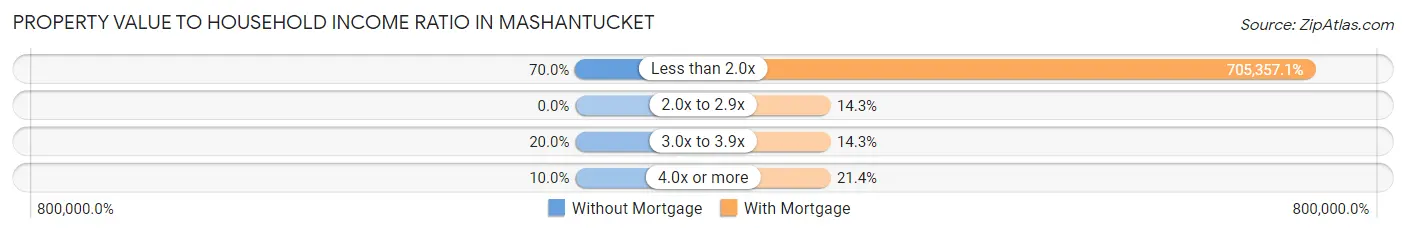
| Value-to-Income Ratio | Without Mortgage | With Mortgage |
| Less than 2.0x | 7 (70.0%) | 98,750 (705,357.1%) |
| 2.0x to 2.9x | 0 (0.0%) | 2 (14.3%) |
| 3.0x to 3.9x | 2 (20.0%) | 2 (14.3%) |
| 4.0x or more | 1 (10.0%) | 3 (21.4%) |
| Total | 10 (100.0%) | 14 (100.0%) |
Real Estate Taxes by Mortgage Status in Mashantucket
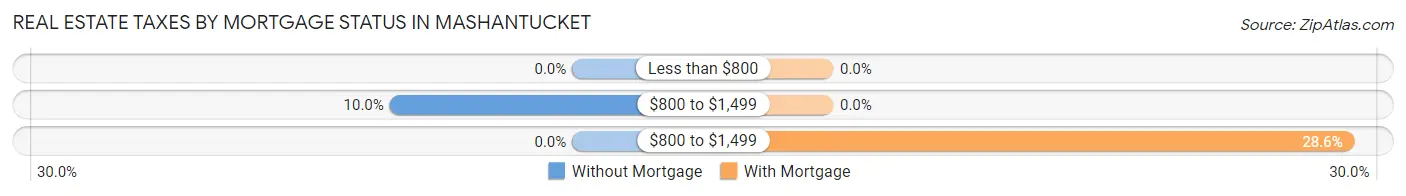
| Property Taxes | Without Mortgage | With Mortgage |
| Less than $800 | 0 (0.0%) | 0 (0.0%) |
| $800 to $1,499 | 1 (10.0%) | 0 (0.0%) |
| $800 to $1,499 | 0 (0.0%) | 4 (28.6%) |
| Total | 10 (100.0%) | 14 (100.0%) |
Health & Disability in Mashantucket
Health Insurance Coverage by Age in Mashantucket
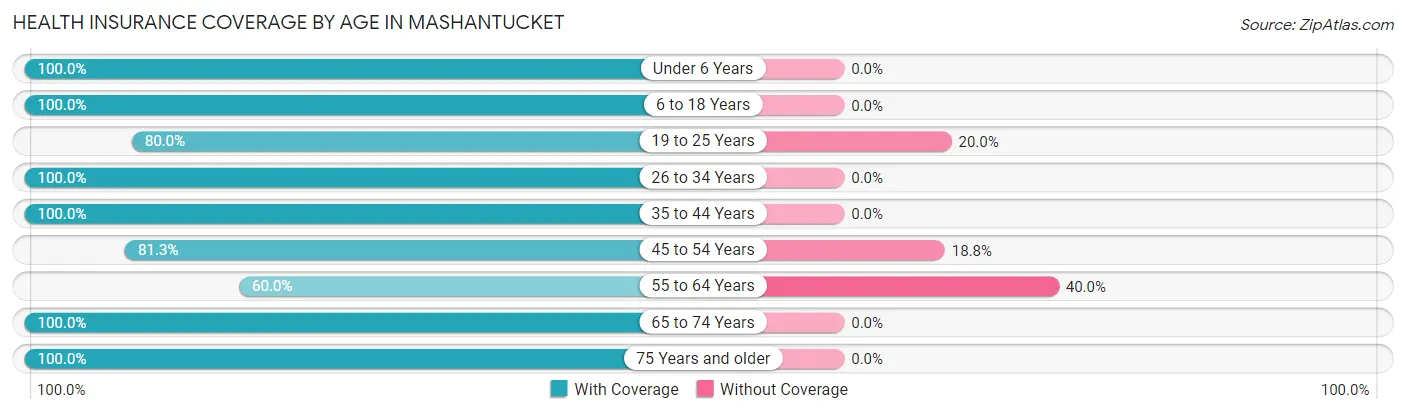
| Age Bracket | With Coverage | Without Coverage |
| Under 6 Years | 23 (100.0%) | 0 (0.0%) |
| 6 to 18 Years | 11 (100.0%) | 0 (0.0%) |
| 19 to 25 Years | 8 (80.0%) | 2 (20.0%) |
| 26 to 34 Years | 8 (100.0%) | 0 (0.0%) |
| 35 to 44 Years | 13 (100.0%) | 0 (0.0%) |
| 45 to 54 Years | 13 (81.2%) | 3 (18.8%) |
| 55 to 64 Years | 6 (60.0%) | 4 (40.0%) |
| 65 to 74 Years | 12 (100.0%) | 0 (0.0%) |
| 75 Years and older | 1 (100.0%) | 0 (0.0%) |
| Total | 95 (91.3%) | 9 (8.6%) |
Health Insurance Coverage by Citizenship Status in Mashantucket
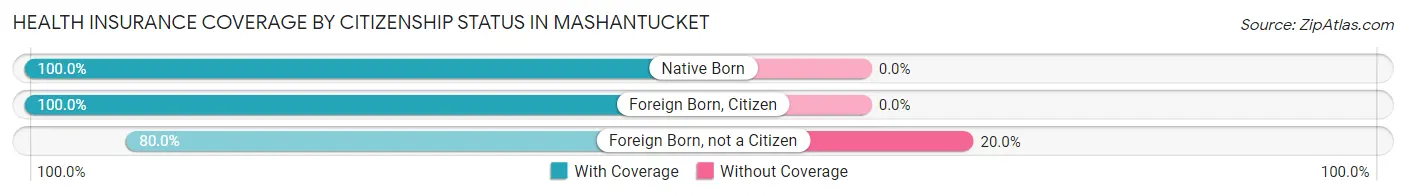
| Citizenship Status | With Coverage | Without Coverage |
| Native Born | 23 (100.0%) | 0 (0.0%) |
| Foreign Born, Citizen | 11 (100.0%) | 0 (0.0%) |
| Foreign Born, not a Citizen | 8 (80.0%) | 2 (20.0%) |
Health Insurance Coverage by Household Income in Mashantucket
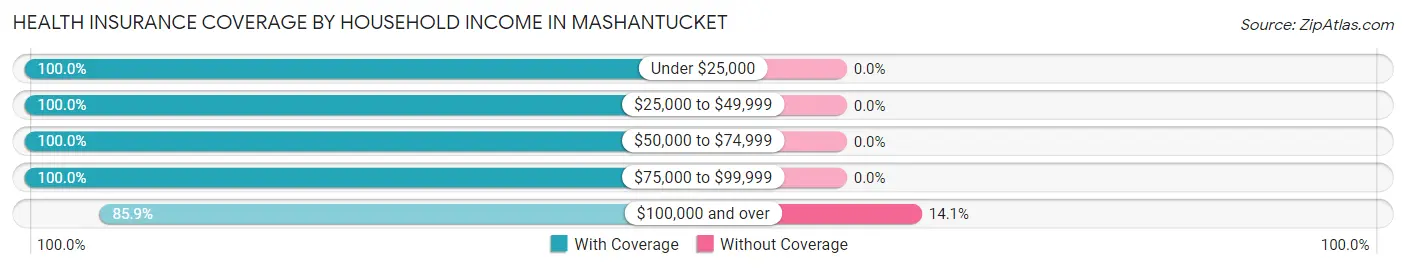
| Household Income | With Coverage | Without Coverage |
| Under $25,000 | 4 (100.0%) | 0 (0.0%) |
| $25,000 to $49,999 | 6 (100.0%) | 0 (0.0%) |
| $50,000 to $74,999 | 4 (100.0%) | 0 (0.0%) |
| $75,000 to $99,999 | 26 (100.0%) | 0 (0.0%) |
| $100,000 and over | 55 (85.9%) | 9 (14.1%) |
Public vs Private Health Insurance Coverage by Age in Mashantucket
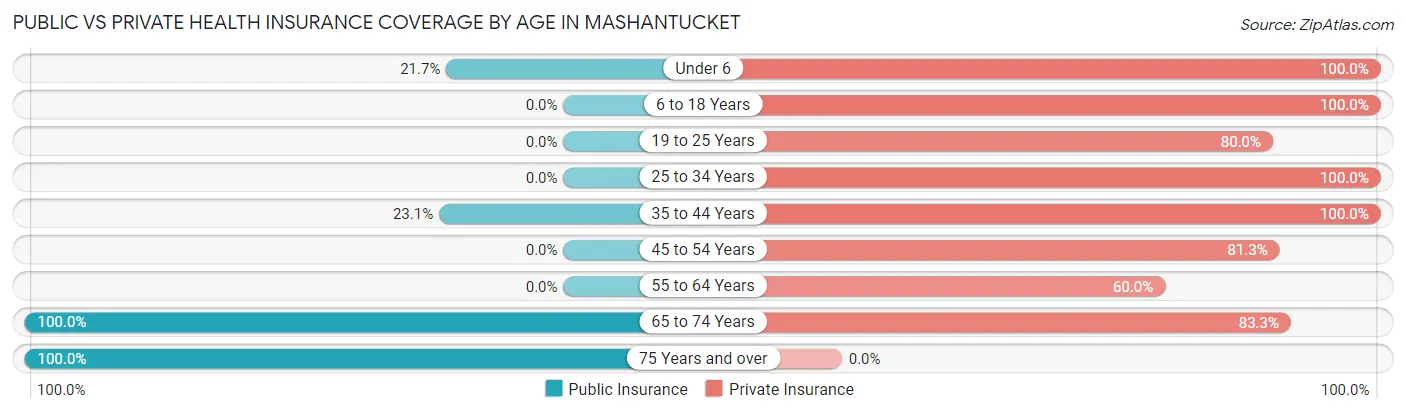
| Age Bracket | Public Insurance | Private Insurance |
| Under 6 | 5 (21.7%) | 23 (100.0%) |
| 6 to 18 Years | 0 (0.0%) | 11 (100.0%) |
| 19 to 25 Years | 0 (0.0%) | 8 (80.0%) |
| 25 to 34 Years | 0 (0.0%) | 8 (100.0%) |
| 35 to 44 Years | 3 (23.1%) | 13 (100.0%) |
| 45 to 54 Years | 0 (0.0%) | 13 (81.2%) |
| 55 to 64 Years | 0 (0.0%) | 6 (60.0%) |
| 65 to 74 Years | 12 (100.0%) | 10 (83.3%) |
| 75 Years and over | 1 (100.0%) | 0 (0.0%) |
| Total | 21 (20.2%) | 92 (88.5%) |
Disability Status by Sex by Age in Mashantucket
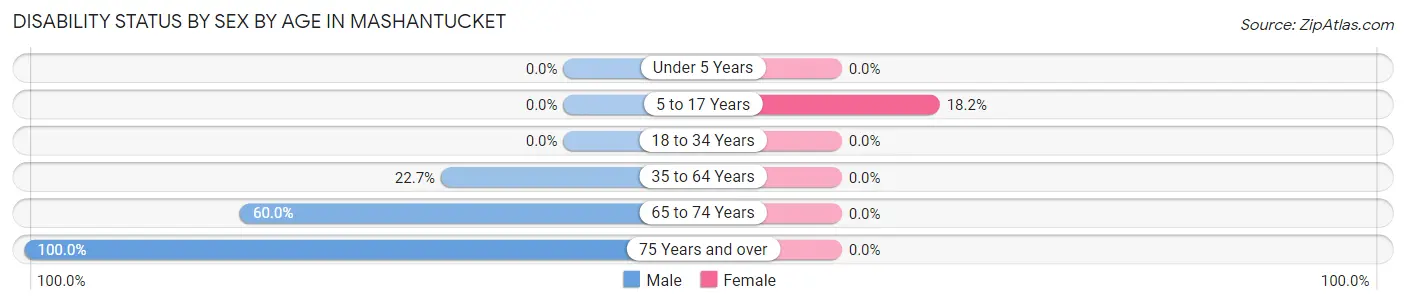
| Age Bracket | Male | Female |
| Under 5 Years | 0 (0.0%) | 0 (0.0%) |
| 5 to 17 Years | 0 (0.0%) | 2 (18.2%) |
| 18 to 34 Years | 0 (0.0%) | 0 (0.0%) |
| 35 to 64 Years | 5 (22.7%) | 0 (0.0%) |
| 65 to 74 Years | 3 (60.0%) | 0 (0.0%) |
| 75 Years and over | 1 (100.0%) | 0 (0.0%) |
Disability Class by Sex by Age in Mashantucket
Disability Class: Hearing Difficulty
| Age Bracket | Male | Female |
| Under 5 Years | 0 (0.0%) | 0 (0.0%) |
| 5 to 17 Years | 0 (0.0%) | 0 (0.0%) |
| 18 to 34 Years | 0 (0.0%) | 0 (0.0%) |
| 35 to 64 Years | 0 (0.0%) | 0 (0.0%) |
| 65 to 74 Years | 0 (0.0%) | 0 (0.0%) |
| 75 Years and over | 0 (0.0%) | 0 (0.0%) |
Disability Class: Vision Difficulty
| Age Bracket | Male | Female |
| Under 5 Years | 0 (0.0%) | 0 (0.0%) |
| 5 to 17 Years | 0 (0.0%) | 0 (0.0%) |
| 18 to 34 Years | 0 (0.0%) | 0 (0.0%) |
| 35 to 64 Years | 0 (0.0%) | 0 (0.0%) |
| 65 to 74 Years | 0 (0.0%) | 0 (0.0%) |
| 75 Years and over | 0 (0.0%) | 0 (0.0%) |
Disability Class: Cognitive Difficulty
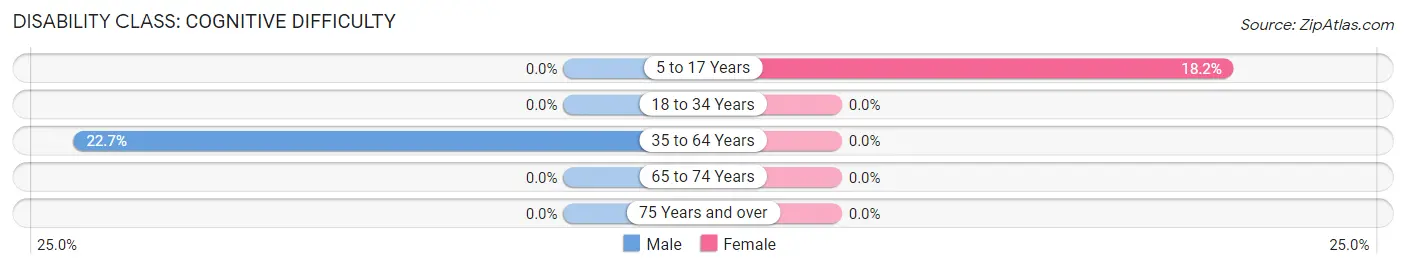
| Age Bracket | Male | Female |
| 5 to 17 Years | 0 (0.0%) | 2 (18.2%) |
| 18 to 34 Years | 0 (0.0%) | 0 (0.0%) |
| 35 to 64 Years | 5 (22.7%) | 0 (0.0%) |
| 65 to 74 Years | 0 (0.0%) | 0 (0.0%) |
| 75 Years and over | 0 (0.0%) | 0 (0.0%) |
Disability Class: Ambulatory Difficulty
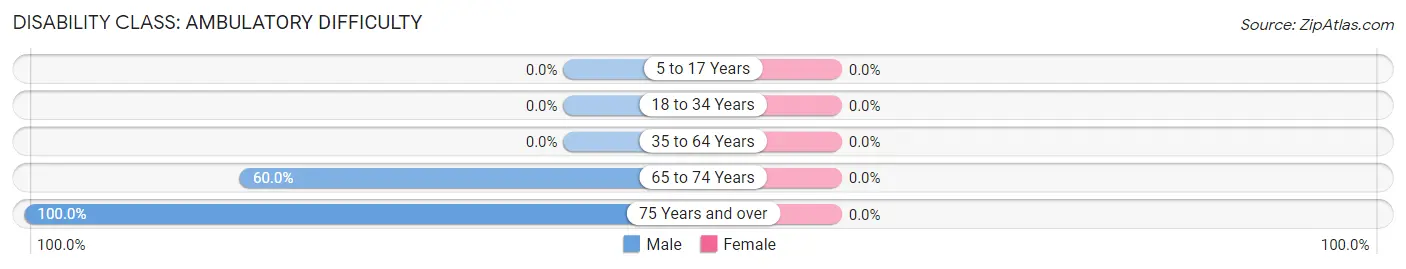
| Age Bracket | Male | Female |
| 5 to 17 Years | 0 (0.0%) | 0 (0.0%) |
| 18 to 34 Years | 0 (0.0%) | 0 (0.0%) |
| 35 to 64 Years | 0 (0.0%) | 0 (0.0%) |
| 65 to 74 Years | 3 (60.0%) | 0 (0.0%) |
| 75 Years and over | 1 (100.0%) | 0 (0.0%) |
Disability Class: Self-Care Difficulty
| Age Bracket | Male | Female |
| 5 to 17 Years | 0 (0.0%) | 0 (0.0%) |
| 18 to 34 Years | 0 (0.0%) | 0 (0.0%) |
| 35 to 64 Years | 0 (0.0%) | 0 (0.0%) |
| 65 to 74 Years | 0 (0.0%) | 0 (0.0%) |
| 75 Years and over | 0 (0.0%) | 0 (0.0%) |
Technology Access in Mashantucket
Computing Device Access in Mashantucket
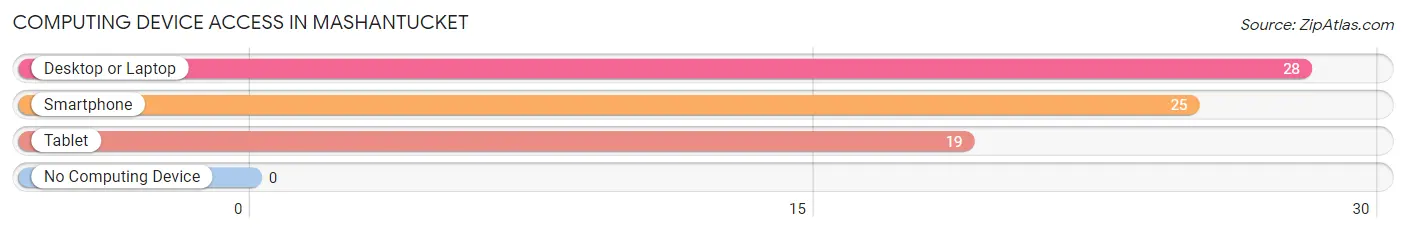
| Device Type | # Households | % Households |
| Desktop or Laptop | 28 | 100.0% |
| Smartphone | 25 | 89.3% |
| Tablet | 19 | 67.9% |
| No Computing Device | 0 | 0.0% |
| Total | 28 | 100.0% |
Internet Access in Mashantucket
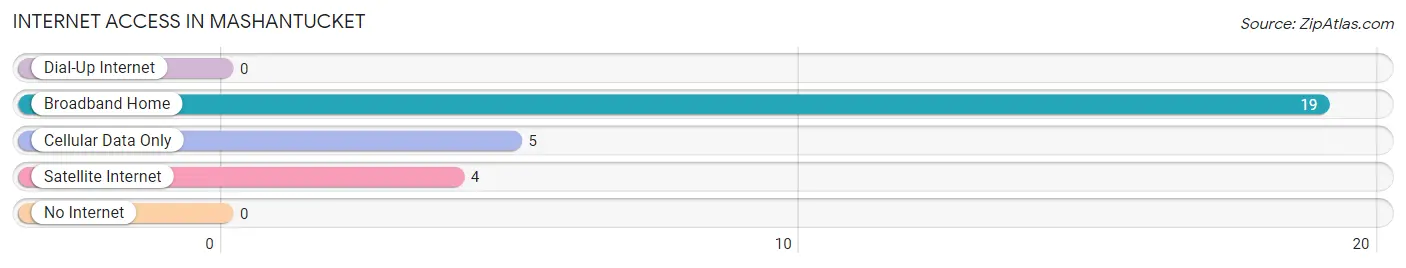
| Internet Type | # Households | % Households |
| Dial-Up Internet | 0 | 0.0% |
| Broadband Home | 19 | 67.9% |
| Cellular Data Only | 5 | 17.9% |
| Satellite Internet | 4 | 14.3% |
| No Internet | 0 | 0.0% |
| Total | 28 | 100.0% |
Mashantucket Summary
Mashantucket, Connecticut is a small town located in New London County, Connecticut. It is situated in the southeastern corner of the state, near the Rhode Island border. The town is home to the Mashantucket Pequot Tribal Nation, a federally recognized Native American tribe. The population of Mashantucket was estimated to be 1,817 in 2019.
History
Mashantucket was originally inhabited by the Pequot people, a Native American tribe. The Pequot people were a powerful tribe in the region, and they were known for their trading and fishing. The Pequot War of 1637-1638 was fought between the Pequot people and the English colonists. The Pequot people were defeated and their population was decimated. In 1666, the surviving Pequot people were granted a reservation in Mashantucket.
The town of Mashantucket was officially incorporated in 1785. In the 19th century, the town was a rural farming community. In the late 19th century, the Mashantucket Pequot Tribe began to develop a casino and resort on their reservation. The Foxwoods Resort Casino opened in 1992 and has become one of the largest casinos in the world.
Geography
Mashantucket is located in southeastern Connecticut, near the Rhode Island border. The town is situated in the Thames River Valley, and is bordered by the towns of Ledyard, North Stonington, and Preston. The town has a total area of 8.3 square miles, of which 8.2 square miles is land and 0.1 square miles is water.
The terrain of Mashantucket is mostly flat, with some rolling hills. The town is located in a temperate climate zone, with warm summers and cold winters. The average annual temperature is around 50 degrees Fahrenheit.
Economy
Mashantucket’s economy is largely driven by the Foxwoods Resort Casino. The casino is the largest employer in the town, and it is estimated to generate over $2 billion in revenue each year. The casino also provides jobs for over 10,000 people.
In addition to the casino, Mashantucket is home to several other businesses. These include a hotel, a golf course, a spa, and several restaurants. The town also has a small retail sector, with several stores and shops.
Demographics
Mashantucket has a population of 1,817, according to the 2019 census. The population is predominantly Native American, with the Mashantucket Pequot Tribe making up the majority of the population. The median age of the population is 40.7 years, and the median household income is $50,000.
The town has a high rate of poverty, with over 20% of the population living below the poverty line. The town also has a high rate of unemployment, with over 10% of the population unemployed.
Conclusion
Mashantucket, Connecticut is a small town located in New London County, Connecticut. It is home to the Mashantucket Pequot Tribal Nation, a federally recognized Native American tribe. The town’s economy is largely driven by the Foxwoods Resort Casino, which is the largest employer in the town. The population of Mashantucket is predominantly Native American, with the Mashantucket Pequot Tribe making up the majority of the population. The town has a high rate of poverty and unemployment.
Common Questions
What is Per Capita Income in Mashantucket?
Per Capita income in Mashantucket is $29,723.
What is the Median Family Income in Mashantucket?
Median Family Income in Mashantucket is $109,375.
What is the Median Household income in Mashantucket?
Median Household Income in Mashantucket is $103,750.
What is Inequality or Gini Index in Mashantucket?
Inequality or Gini Index in Mashantucket is 0.37.
What is the Total Population of Mashantucket?
Total Population of Mashantucket is 104.
What is the Total Male Population of Mashantucket?
Total Male Population of Mashantucket is 58.
What is the Total Female Population of Mashantucket?
Total Female Population of Mashantucket is 46.
What is the Ratio of Males per 100 Females in Mashantucket?
There are 126.09 Males per 100 Females in Mashantucket.
What is the Ratio of Females per 100 Males in Mashantucket?
There are 79.31 Females per 100 Males in Mashantucket.
What is the Median Population Age in Mashantucket?
Median Population Age in Mashantucket is 34.5 Years.
What is the Average Family Size in Mashantucket
Average Family Size in Mashantucket is 3.9 People.
What is the Average Household Size in Mashantucket
Average Household Size in Mashantucket is 3.7 People.
How Large is the Labor Force in Mashantucket?
There are 44 People in the Labor Forcein in Mashantucket.
What is the Percentage of People in the Labor Force in Mashantucket?
62.9% of People are in the Labor Force in Mashantucket.
What is the Unemployment Rate in Mashantucket?
Unemployment Rate in Mashantucket is 4.5%.