Slippery Rock borough, PA Map & Demographics
Slippery Rock borough Overview
$24,967
PER CAPITA INCOME
$93,224
AVG FAMILY INCOME
$44,447
AVG HOUSEHOLD INCOME
41.8%
WAGE / INCOME GAP [ % ]
58.2¢/ $1
WAGE / INCOME GAP [ $ ]
0.53
INEQUALITY / GINI INDEX
3,367
TOTAL POPULATION
1,582
MALE POPULATION
1,785
FEMALE POPULATION
88.63
MALES / 100 FEMALES
112.83
FEMALES / 100 MALES
23.2
MEDIAN AGE
2.9
AVG FAMILY SIZE
2.4
AVG HOUSEHOLD SIZE
1,601
LABOR FORCE [ PEOPLE ]
52.0%
PERCENT IN LABOR FORCE
4.9%
UNEMPLOYMENT RATE
Income in Slippery Rock borough
Income Overview in Slippery Rock borough
Per Capita Income in Slippery Rock borough is $24,967, while median incomes of families and households are $93,224 and $44,447 respectively.
| Characteristic | Number | Measure |
| Per Capita Income | 3,367 | $24,967 |
| Median Family Income | 507 | $93,224 |
| Mean Family Income | 507 | $102,360 |
| Median Household Income | 1,195 | $44,447 |
| Mean Household Income | 1,195 | $64,718 |
| Income Deficit | 507 | $0 |
| Wage / Income Gap (%) | 3,367 | 41.76% |
| Wage / Income Gap ($) | 3,367 | 58.24¢ per $1 |
| Gini / Inequality Index | 3,367 | 0.53 |
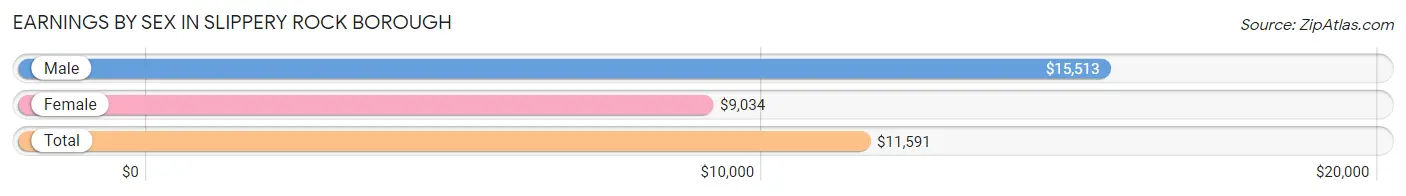
Earnings by Sex in Slippery Rock borough
Average Earnings in Slippery Rock borough are $11,591, $15,513 for men and $9,034 for women, a difference of 41.8%.
| Sex | Number | Average Earnings |
| Male | 994 (46.4%) | $15,513 |
| Female | 1,150 (53.6%) | $9,034 |
| Total | 2,144 (100.0%) | $11,591 |
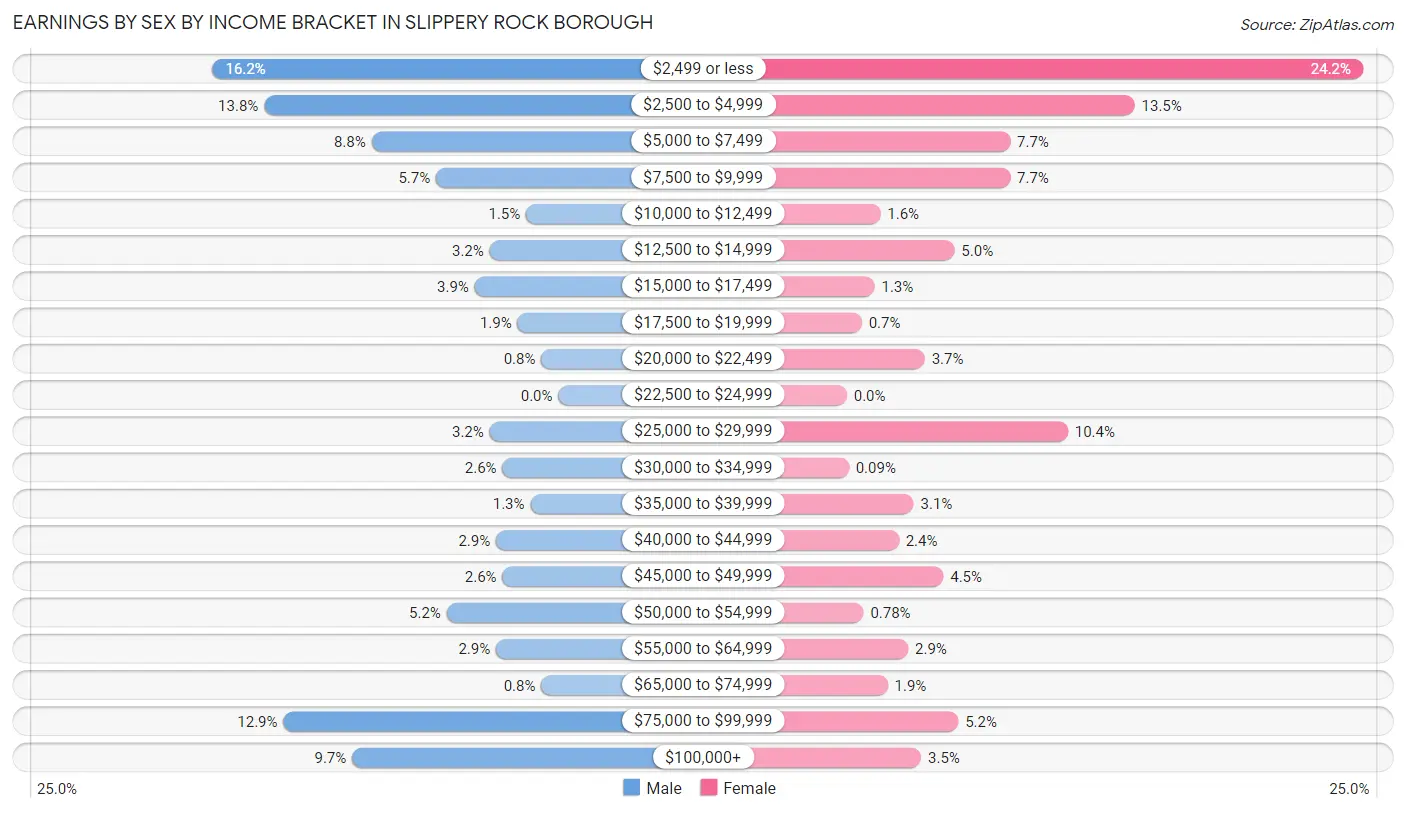
Earnings by Sex by Income Bracket in Slippery Rock borough
The most common earnings brackets in Slippery Rock borough are $2,499 or less for men (161 | 16.2%) and $2,499 or less for women (278 | 24.2%).
| Income | Male | Female |
| $2,499 or less | 161 (16.2%) | 278 (24.2%) |
| $2,500 to $4,999 | 137 (13.8%) | 155 (13.5%) |
| $5,000 to $7,499 | 87 (8.7%) | 88 (7.6%) |
| $7,500 to $9,999 | 57 (5.7%) | 88 (7.6%) |
| $10,000 to $12,499 | 15 (1.5%) | 18 (1.6%) |
| $12,500 to $14,999 | 32 (3.2%) | 58 (5.0%) |
| $15,000 to $17,499 | 39 (3.9%) | 15 (1.3%) |
| $17,500 to $19,999 | 19 (1.9%) | 8 (0.7%) |
| $20,000 to $22,499 | 8 (0.8%) | 42 (3.6%) |
| $22,500 to $24,999 | 0 (0.0%) | 0 (0.0%) |
| $25,000 to $29,999 | 32 (3.2%) | 119 (10.3%) |
| $30,000 to $34,999 | 26 (2.6%) | 1 (0.1%) |
| $35,000 to $39,999 | 13 (1.3%) | 36 (3.1%) |
| $40,000 to $44,999 | 29 (2.9%) | 28 (2.4%) |
| $45,000 to $49,999 | 26 (2.6%) | 52 (4.5%) |
| $50,000 to $54,999 | 52 (5.2%) | 9 (0.8%) |
| $55,000 to $64,999 | 29 (2.9%) | 33 (2.9%) |
| $65,000 to $74,999 | 8 (0.8%) | 22 (1.9%) |
| $75,000 to $99,999 | 128 (12.9%) | 60 (5.2%) |
| $100,000+ | 96 (9.7%) | 40 (3.5%) |
| Total | 994 (100.0%) | 1,150 (100.0%) |
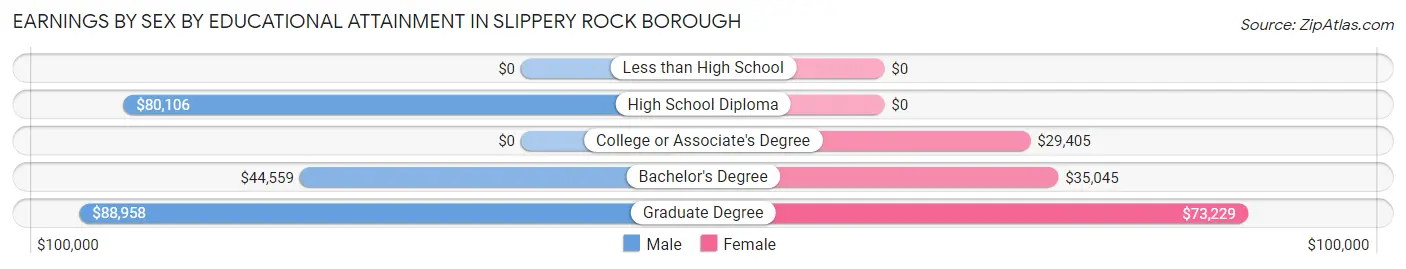
Earnings by Sex by Educational Attainment in Slippery Rock borough
Average earnings in Slippery Rock borough are $62,273 for men and $35,313 for women, a difference of 43.3%. Men with an educational attainment of graduate degree enjoy the highest average annual earnings of $88,958, while those with bachelor's degree education earn the least with $44,559. Women with an educational attainment of graduate degree earn the most with the average annual earnings of $73,229, while those with college or associate's degree education have the smallest earnings of $29,405.
| Educational Attainment | Male Income | Female Income |
| Less than High School | - | - |
| High School Diploma | $80,106 | $0 |
| College or Associate's Degree | - | - |
| Bachelor's Degree | $44,559 | $35,045 |
| Graduate Degree | $88,958 | $73,229 |
| Total | $62,273 | $35,313 |
Family Income in Slippery Rock borough
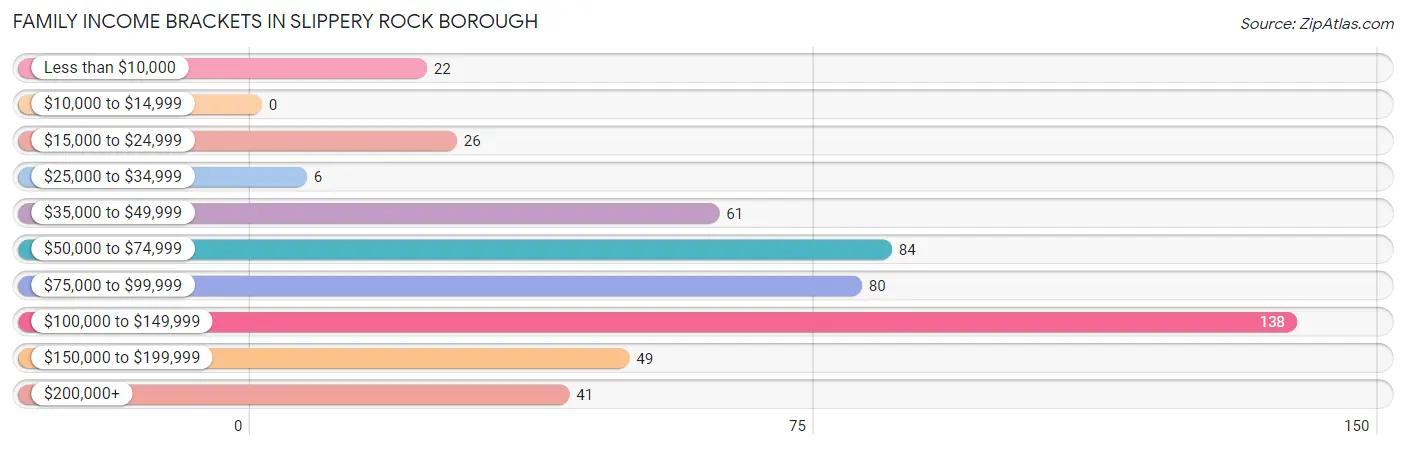
Family Income Brackets in Slippery Rock borough
According to the Slippery Rock borough family income data, there are 138 families falling into the $100,000 to $149,999 income range, which is the most common income bracket and makes up 27.2% of all families.
| Income Bracket | # Families | % Families |
| Less than $10,000 | 22 | 4.3% |
| $10,000 to $14,999 | 0 | 0.0% |
| $15,000 to $24,999 | 26 | 5.1% |
| $25,000 to $34,999 | 6 | 1.2% |
| $35,000 to $49,999 | 61 | 12.0% |
| $50,000 to $74,999 | 84 | 16.6% |
| $75,000 to $99,999 | 80 | 15.8% |
| $100,000 to $149,999 | 138 | 27.2% |
| $150,000 to $199,999 | 49 | 9.7% |
| $200,000+ | 41 | 8.1% |
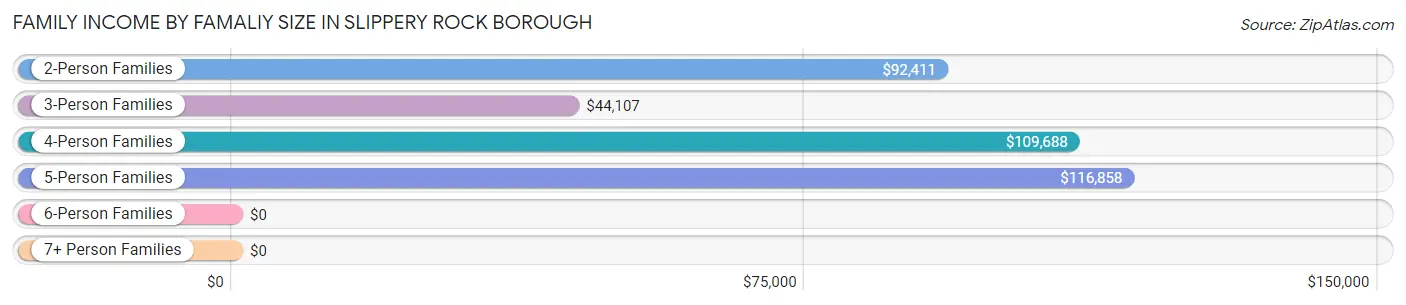
Family Income by Famaliy Size in Slippery Rock borough
5-person families (55 | 10.8%) account for the highest median family income in Slippery Rock borough with $116,858 per family, while 2-person families (289 | 57.0%) have the highest median income of $46,206 per family member.
| Income Bracket | # Families | Median Income |
| 2-Person Families | 289 (57.0%) | $92,411 |
| 3-Person Families | 104 (20.5%) | $44,107 |
| 4-Person Families | 59 (11.6%) | $109,688 |
| 5-Person Families | 55 (10.8%) | $116,858 |
| 6-Person Families | 0 (0.0%) | $0 |
| 7+ Person Families | 0 (0.0%) | $0 |
| Total | 507 (100.0%) | $93,224 |
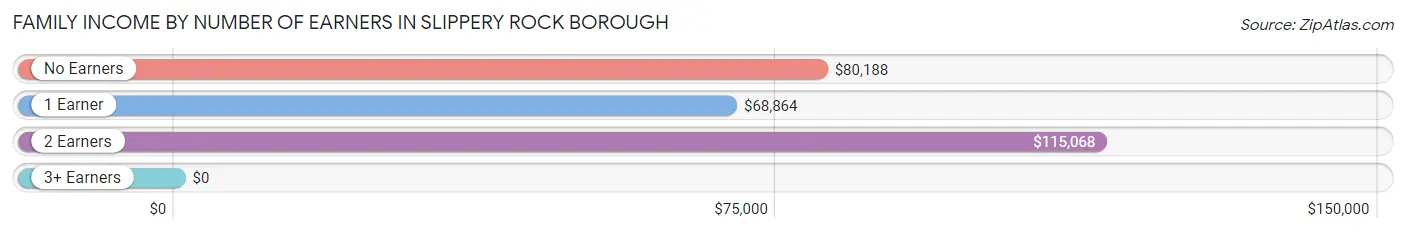
Family Income by Number of Earners in Slippery Rock borough
| Number of Earners | # Families | Median Income |
| No Earners | 59 (11.6%) | $80,188 |
| 1 Earner | 244 (48.1%) | $68,864 |
| 2 Earners | 184 (36.3%) | $115,068 |
| 3+ Earners | 20 (3.9%) | $0 |
| Total | 507 (100.0%) | $93,224 |
Household Income in Slippery Rock borough
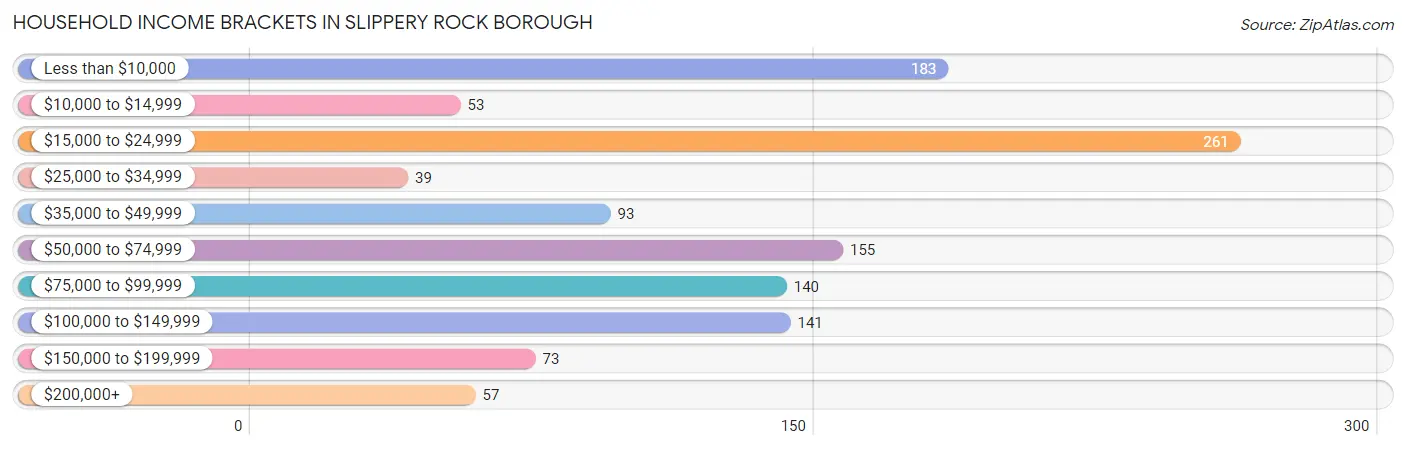
Household Income Brackets in Slippery Rock borough
With 261 households falling in the category, the $15,000 to $24,999 income range is the most frequent in Slippery Rock borough, accounting for 21.8% of all households. In contrast, only 39 households (3.3%) fall into the $25,000 to $34,999 income bracket, making it the least populous group.
| Income Bracket | # Households | % Households |
| Less than $10,000 | 183 | 15.3% |
| $10,000 to $14,999 | 53 | 4.4% |
| $15,000 to $24,999 | 261 | 21.8% |
| $25,000 to $34,999 | 39 | 3.3% |
| $35,000 to $49,999 | 93 | 7.8% |
| $50,000 to $74,999 | 155 | 13.0% |
| $75,000 to $99,999 | 140 | 11.7% |
| $100,000 to $149,999 | 141 | 11.8% |
| $150,000 to $199,999 | 73 | 6.1% |
| $200,000+ | 57 | 4.8% |
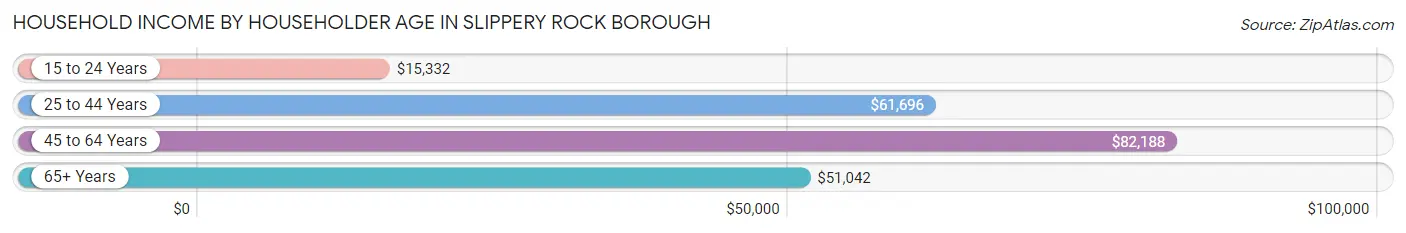
Household Income by Householder Age in Slippery Rock borough
The median household income in Slippery Rock borough is $44,447, with the highest median household income of $82,188 found in the 45 to 64 years age bracket for the primary householder. A total of 347 households (29.0%) fall into this category. Meanwhile, the 15 to 24 years age bracket for the primary householder has the lowest median household income of $15,332, with 349 households (29.2%) in this group.
| Income Bracket | # Households | Median Income |
| 15 to 24 Years | 349 (29.2%) | $15,332 |
| 25 to 44 Years | 282 (23.6%) | $61,696 |
| 45 to 64 Years | 347 (29.0%) | $82,188 |
| 65+ Years | 217 (18.2%) | $51,042 |
| Total | 1,195 (100.0%) | $44,447 |
Poverty in Slippery Rock borough
Income Below Poverty by Sex and Age in Slippery Rock borough
With 32.1% poverty level for males and 35.3% for females among the residents of Slippery Rock borough, 5 year old males and under 5 year old females are the most vulnerable to poverty, with 28 males (100.0%) and 41 females (100.0%) in their respective age groups living below the poverty level.
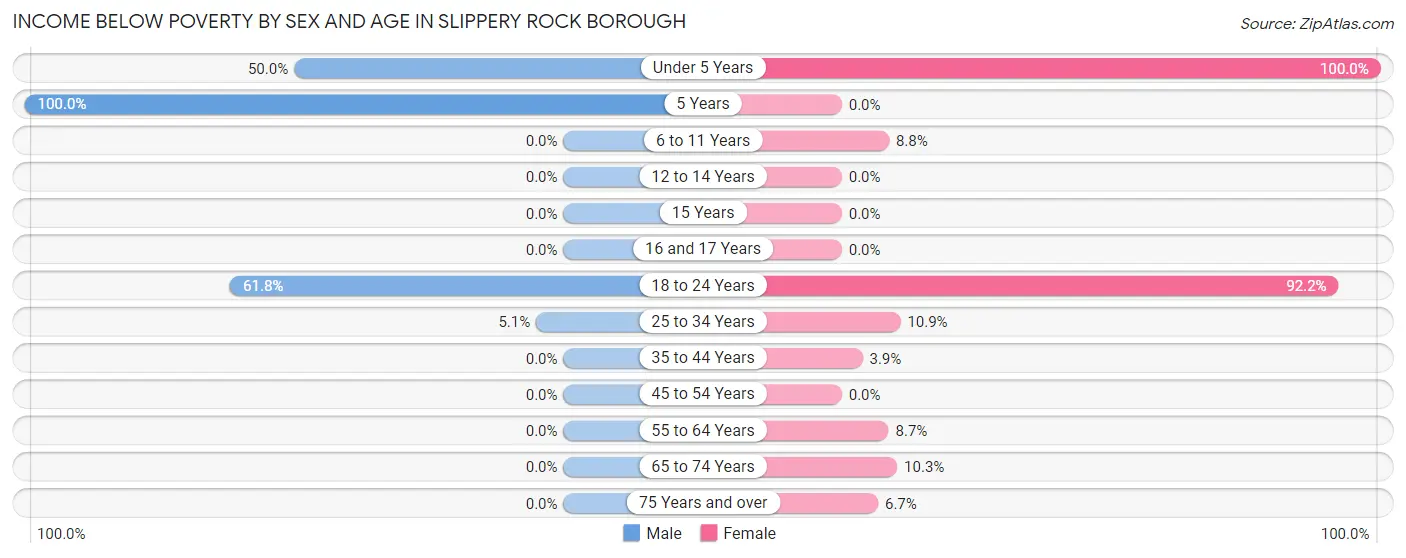
| Age Bracket | Male | Female |
| Under 5 Years | 15 (50.0%) | 41 (100.0%) |
| 5 Years | 28 (100.0%) | 0 (0.0%) |
| 6 to 11 Years | 0 (0.0%) | 7 (8.7%) |
| 12 to 14 Years | 0 (0.0%) | 0 (0.0%) |
| 15 Years | 0 (0.0%) | 0 (0.0%) |
| 16 and 17 Years | 0 (0.0%) | 0 (0.0%) |
| 18 to 24 Years | 397 (61.8%) | 389 (92.2%) |
| 25 to 34 Years | 7 (5.1%) | 33 (10.9%) |
| 35 to 44 Years | 0 (0.0%) | 2 (3.8%) |
| 45 to 54 Years | 0 (0.0%) | 0 (0.0%) |
| 55 to 64 Years | 0 (0.0%) | 23 (8.7%) |
| 65 to 74 Years | 0 (0.0%) | 11 (10.3%) |
| 75 Years and over | 0 (0.0%) | 7 (6.7%) |
| Total | 447 (32.1%) | 513 (35.3%) |
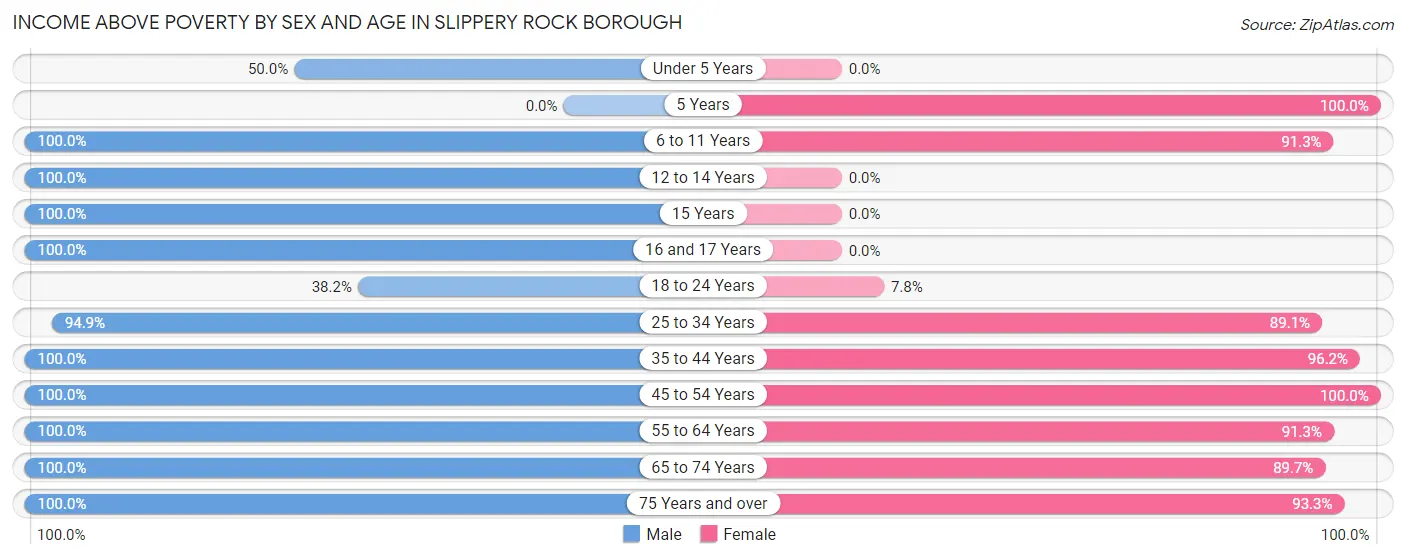
Income Above Poverty by Sex and Age in Slippery Rock borough
According to the poverty statistics in Slippery Rock borough, males aged 6 to 11 years and females aged 5 years are the age groups that are most secure financially, with 100.0% of males and 100.0% of females in these age groups living above the poverty line.
| Age Bracket | Male | Female |
| Under 5 Years | 15 (50.0%) | 0 (0.0%) |
| 5 Years | 0 (0.0%) | 11 (100.0%) |
| 6 to 11 Years | 19 (100.0%) | 73 (91.2%) |
| 12 to 14 Years | 58 (100.0%) | 0 (0.0%) |
| 15 Years | 22 (100.0%) | 0 (0.0%) |
| 16 and 17 Years | 20 (100.0%) | 0 (0.0%) |
| 18 to 24 Years | 245 (38.2%) | 33 (7.8%) |
| 25 to 34 Years | 131 (94.9%) | 270 (89.1%) |
| 35 to 44 Years | 75 (100.0%) | 50 (96.2%) |
| 45 to 54 Years | 109 (100.0%) | 69 (100.0%) |
| 55 to 64 Years | 113 (100.0%) | 242 (91.3%) |
| 65 to 74 Years | 108 (100.0%) | 96 (89.7%) |
| 75 Years and over | 30 (100.0%) | 97 (93.3%) |
| Total | 945 (67.9%) | 941 (64.7%) |
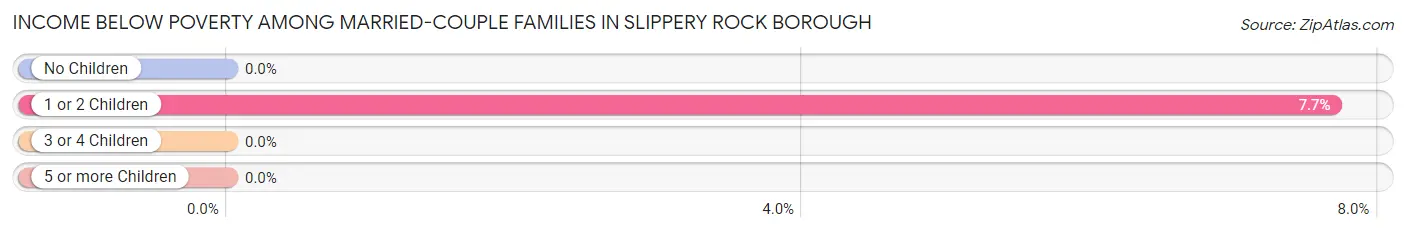
Income Below Poverty Among Married-Couple Families in Slippery Rock borough
The poverty statistics for married-couple families in Slippery Rock borough show that 1.9% or 7 of the total 375 families live below the poverty line. Families with 1 or 2 children have the highest poverty rate of 7.7%, comprising of 7 families. On the other hand, families with no children have the lowest poverty rate of 0.0%, which includes 0 families.
| Children | Above Poverty | Below Poverty |
| No Children | 274 (100.0%) | 0 (0.0%) |
| 1 or 2 Children | 84 (92.3%) | 7 (7.7%) |
| 3 or 4 Children | 10 (100.0%) | 0 (0.0%) |
| 5 or more Children | 0 (0.0%) | 0 (0.0%) |
| Total | 368 (98.1%) | 7 (1.9%) |
Income Below Poverty Among Single-Parent Households in Slippery Rock borough
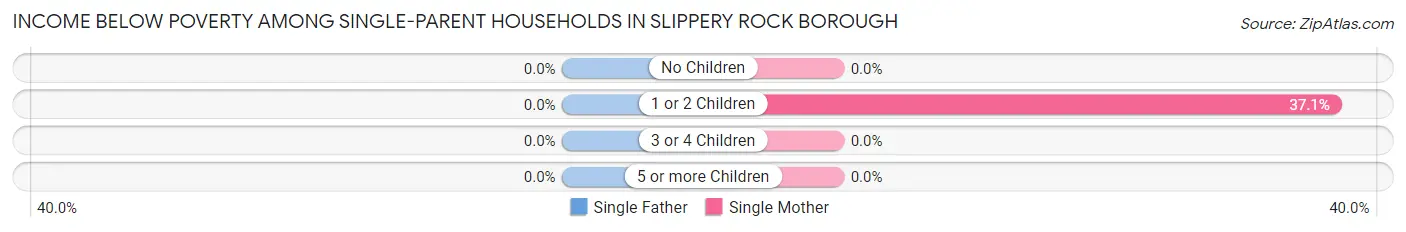
| Children | Single Father | Single Mother |
| No Children | 0 (0.0%) | 0 (0.0%) |
| 1 or 2 Children | 0 (0.0%) | 23 (37.1%) |
| 3 or 4 Children | 0 (0.0%) | 0 (0.0%) |
| 5 or more Children | 0 (0.0%) | 0 (0.0%) |
| Total | 0 (0.0%) | 23 (25.3%) |
Income Below Poverty Among Married-Couple vs Single-Parent Households in Slippery Rock borough
The poverty data for Slippery Rock borough shows that 7 of the married-couple family households (1.9%) and 23 of the single-parent households (17.4%) are living below the poverty level. Within the married-couple family households, those with 1 or 2 children have the highest poverty rate, with 7 households (7.7%) falling below the poverty line. Among the single-parent households, those with 1 or 2 children have the highest poverty rate, with 23 household (26.7%) living below poverty.
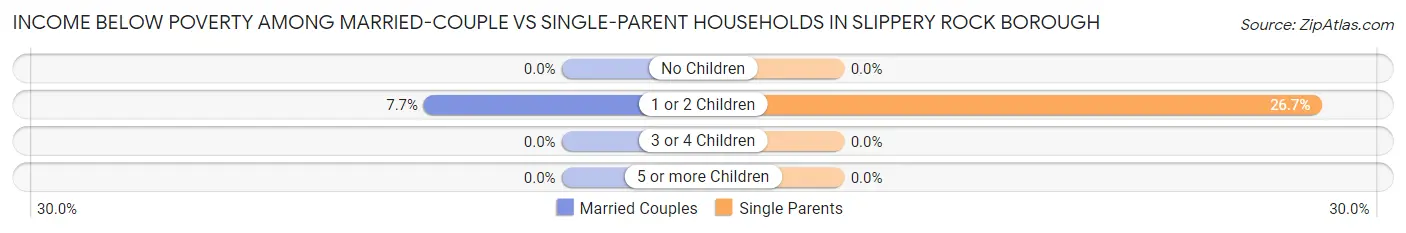
| Children | Married-Couple Families | Single-Parent Households |
| No Children | 0 (0.0%) | 0 (0.0%) |
| 1 or 2 Children | 7 (7.7%) | 23 (26.7%) |
| 3 or 4 Children | 0 (0.0%) | 0 (0.0%) |
| 5 or more Children | 0 (0.0%) | 0 (0.0%) |
| Total | 7 (1.9%) | 23 (17.4%) |
Race in Slippery Rock borough
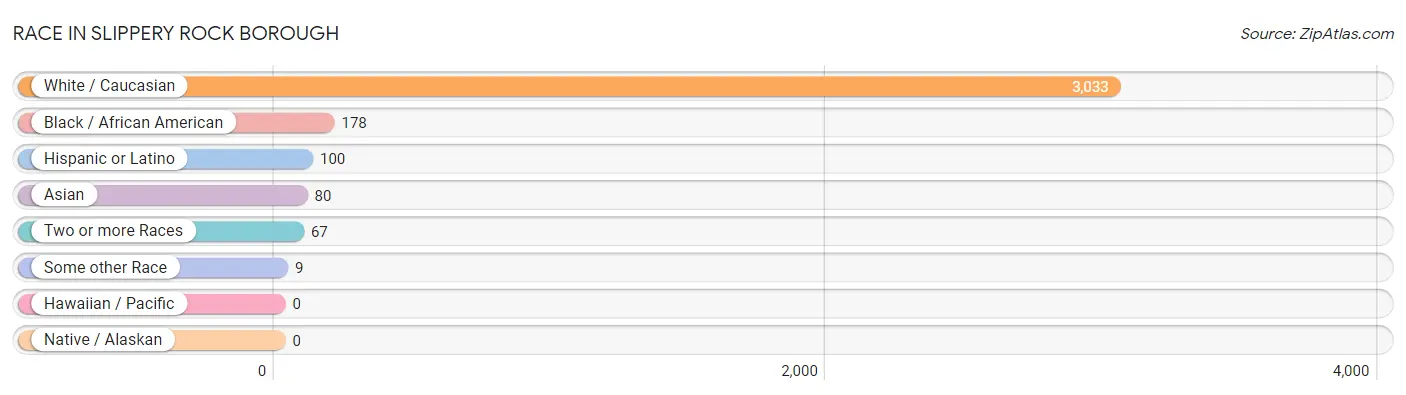
The most populous races in Slippery Rock borough are White / Caucasian (3,033 | 90.1%), Black / African American (178 | 5.3%), and Hispanic or Latino (100 | 3.0%).
| Race | # Population | % Population |
| Asian | 80 | 2.4% |
| Black / African American | 178 | 5.3% |
| Hawaiian / Pacific | 0 | 0.0% |
| Hispanic or Latino | 100 | 3.0% |
| Native / Alaskan | 0 | 0.0% |
| White / Caucasian | 3,033 | 90.1% |
| Two or more Races | 67 | 2.0% |
| Some other Race | 9 | 0.3% |
| Total | 3,367 | 100.0% |
Ancestry in Slippery Rock borough
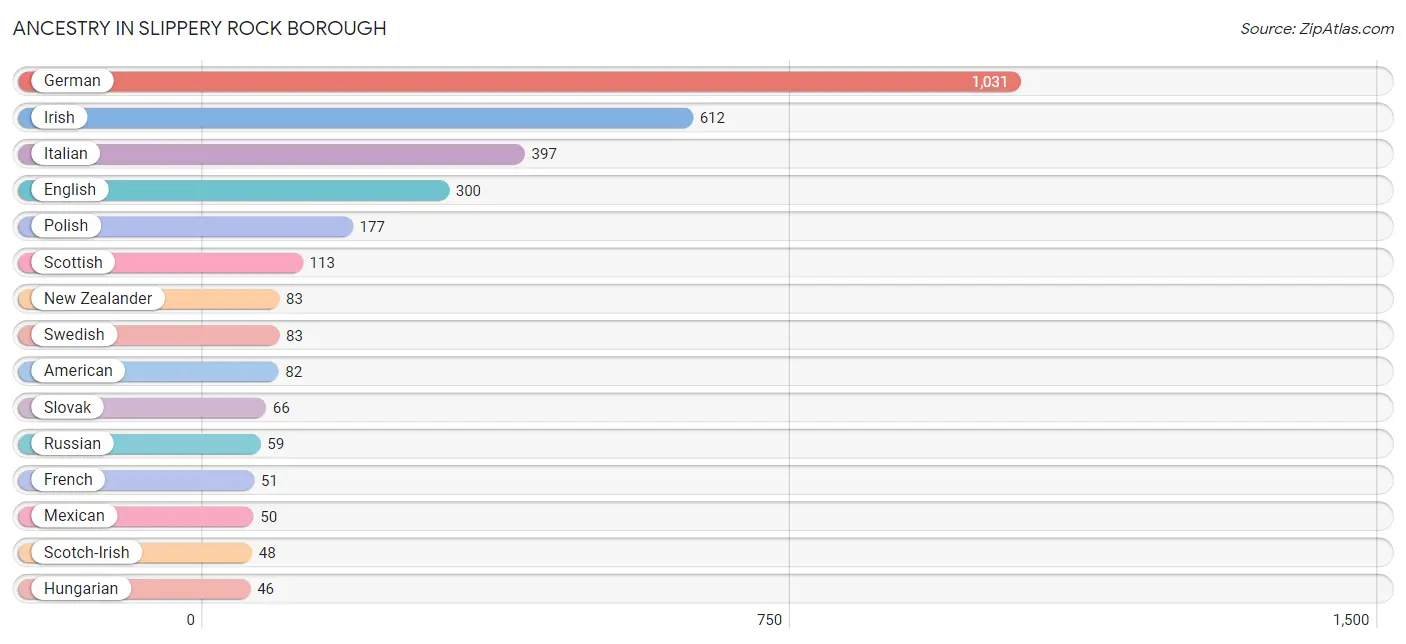
The most populous ancestries reported in Slippery Rock borough are German (1,031 | 30.6%), Irish (612 | 18.2%), Italian (397 | 11.8%), English (300 | 8.9%), and Polish (177 | 5.3%), together accounting for 74.8% of all Slippery Rock borough residents.
| Ancestry | # Population | % Population |
| African | 15 | 0.4% |
| American | 82 | 2.4% |
| Arab | 7 | 0.2% |
| Austrian | 41 | 1.2% |
| British | 22 | 0.6% |
| British West Indian | 21 | 0.6% |
| Burmese | 9 | 0.3% |
| Central American | 3 | 0.1% |
| Cherokee | 6 | 0.2% |
| Cuban | 29 | 0.9% |
| Czech | 14 | 0.4% |
| Czechoslovakian | 12 | 0.4% |
| Danish | 8 | 0.2% |
| Dutch | 37 | 1.1% |
| English | 300 | 8.9% |
| European | 24 | 0.7% |
| Filipino | 9 | 0.3% |
| French | 51 | 1.5% |
| German | 1,031 | 30.6% |
| Greek | 23 | 0.7% |
| Guatemalan | 3 | 0.1% |
| Hungarian | 46 | 1.4% |
| Indian (Asian) | 28 | 0.8% |
| Irish | 612 | 18.2% |
| Italian | 397 | 11.8% |
| Kenyan | 10 | 0.3% |
| Lebanese | 7 | 0.2% |
| Mexican | 50 | 1.5% |
| New Zealander | 83 | 2.5% |
| Norwegian | 5 | 0.2% |
| Polish | 177 | 5.3% |
| Puerto Rican | 12 | 0.4% |
| Russian | 59 | 1.8% |
| Scandinavian | 35 | 1.0% |
| Scotch-Irish | 48 | 1.4% |
| Scottish | 113 | 3.4% |
| Slovak | 66 | 2.0% |
| Slovene | 8 | 0.2% |
| Subsaharan African | 25 | 0.7% |
| Swedish | 83 | 2.5% |
| Thai | 34 | 1.0% |
| Welsh | 19 | 0.6% | View All 42 Rows |
Immigrants in Slippery Rock borough
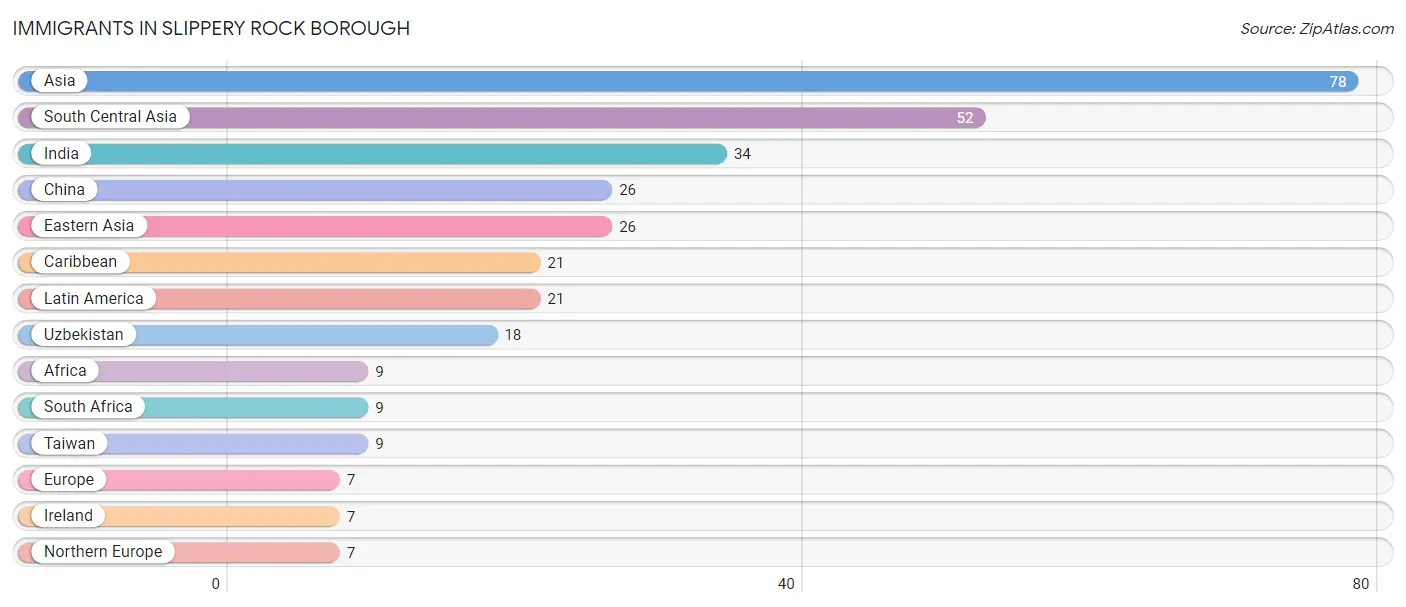
The most numerous immigrant groups reported in Slippery Rock borough came from Asia (78 | 2.3%), South Central Asia (52 | 1.5%), India (34 | 1.0%), China (26 | 0.8%), and Eastern Asia (26 | 0.8%), together accounting for 6.4% of all Slippery Rock borough residents.
| Immigration Origin | # Population | % Population |
| Africa | 9 | 0.3% |
| Asia | 78 | 2.3% |
| Caribbean | 21 | 0.6% |
| China | 26 | 0.8% |
| Eastern Asia | 26 | 0.8% |
| Europe | 7 | 0.2% |
| India | 34 | 1.0% |
| Ireland | 7 | 0.2% |
| Latin America | 21 | 0.6% |
| Northern Europe | 7 | 0.2% |
| South Africa | 9 | 0.3% |
| South Central Asia | 52 | 1.5% |
| Taiwan | 9 | 0.3% |
| Uzbekistan | 18 | 0.5% | View All 14 Rows |
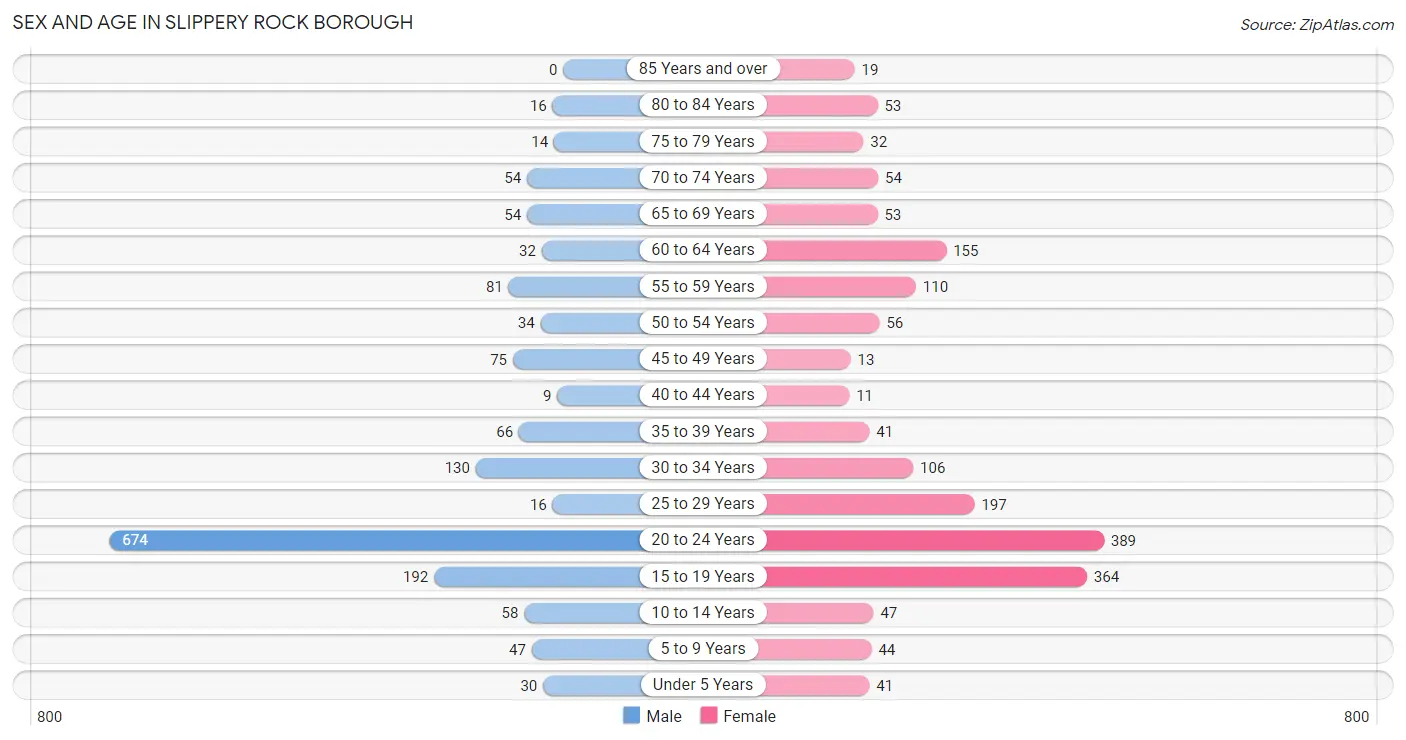
Sex and Age in Slippery Rock borough
Sex and Age in Slippery Rock borough
The most populous age groups in Slippery Rock borough are 20 to 24 Years (674 | 42.6%) for men and 20 to 24 Years (389 | 21.8%) for women.
| Age Bracket | Male | Female |
| Under 5 Years | 30 (1.9%) | 41 (2.3%) |
| 5 to 9 Years | 47 (3.0%) | 44 (2.5%) |
| 10 to 14 Years | 58 (3.7%) | 47 (2.6%) |
| 15 to 19 Years | 192 (12.1%) | 364 (20.4%) |
| 20 to 24 Years | 674 (42.6%) | 389 (21.8%) |
| 25 to 29 Years | 16 (1.0%) | 197 (11.0%) |
| 30 to 34 Years | 130 (8.2%) | 106 (5.9%) |
| 35 to 39 Years | 66 (4.2%) | 41 (2.3%) |
| 40 to 44 Years | 9 (0.6%) | 11 (0.6%) |
| 45 to 49 Years | 75 (4.7%) | 13 (0.7%) |
| 50 to 54 Years | 34 (2.1%) | 56 (3.1%) |
| 55 to 59 Years | 81 (5.1%) | 110 (6.2%) |
| 60 to 64 Years | 32 (2.0%) | 155 (8.7%) |
| 65 to 69 Years | 54 (3.4%) | 53 (3.0%) |
| 70 to 74 Years | 54 (3.4%) | 54 (3.0%) |
| 75 to 79 Years | 14 (0.9%) | 32 (1.8%) |
| 80 to 84 Years | 16 (1.0%) | 53 (3.0%) |
| 85 Years and over | 0 (0.0%) | 19 (1.1%) |
| Total | 1,582 (100.0%) | 1,785 (100.0%) |
Families and Households in Slippery Rock borough
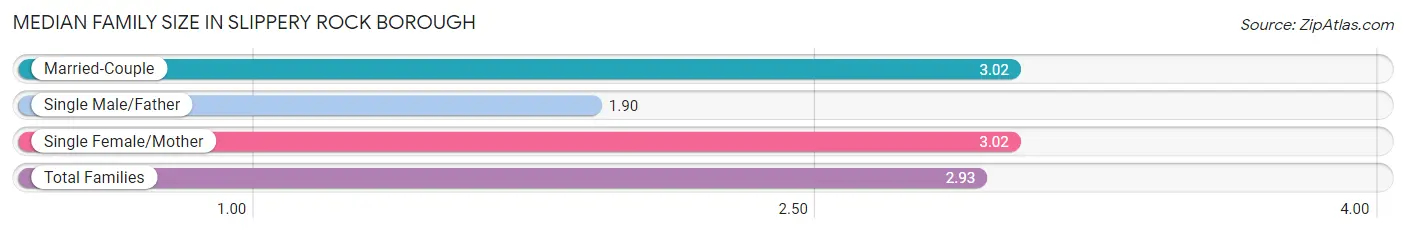
Median Family Size in Slippery Rock borough
The median family size in Slippery Rock borough is 2.93 persons per family, with married-couple families (375 | 74.0%) accounting for the largest median family size of 3.02 persons per family. On the other hand, single male/father families (41 | 8.1%) represent the smallest median family size with 1.90 persons per family.
| Family Type | # Families | Family Size |
| Married-Couple | 375 (74.0%) | 3.02 |
| Single Male/Father | 41 (8.1%) | 1.90 |
| Single Female/Mother | 91 (17.9%) | 3.02 |
| Total Families | 507 (100.0%) | 2.93 |
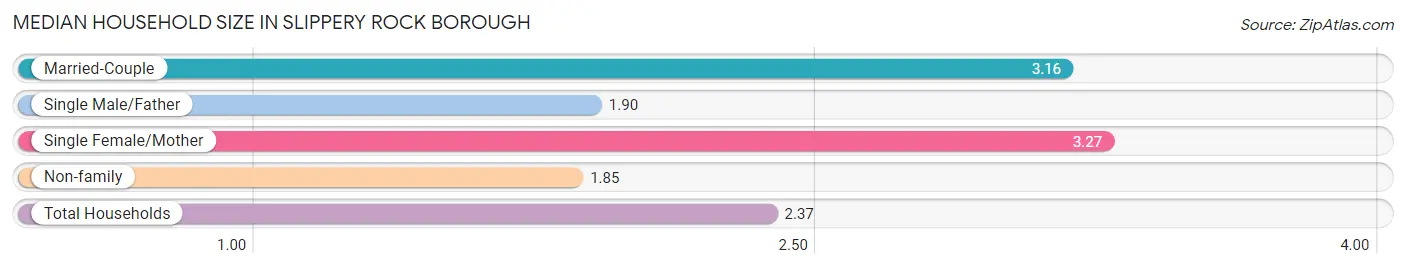
Median Household Size in Slippery Rock borough
The median household size in Slippery Rock borough is 2.37 persons per household, with single female/mother households (91 | 7.6%) accounting for the largest median household size of 3.27 persons per household. non-family households (688 | 57.6%) represent the smallest median household size with 1.85 persons per household.
| Household Type | # Households | Household Size |
| Married-Couple | 375 (31.4%) | 3.16 |
| Single Male/Father | 41 (3.4%) | 1.90 |
| Single Female/Mother | 91 (7.6%) | 3.27 |
| Non-family | 688 (57.6%) | 1.85 |
| Total Households | 1,195 (100.0%) | 2.37 |
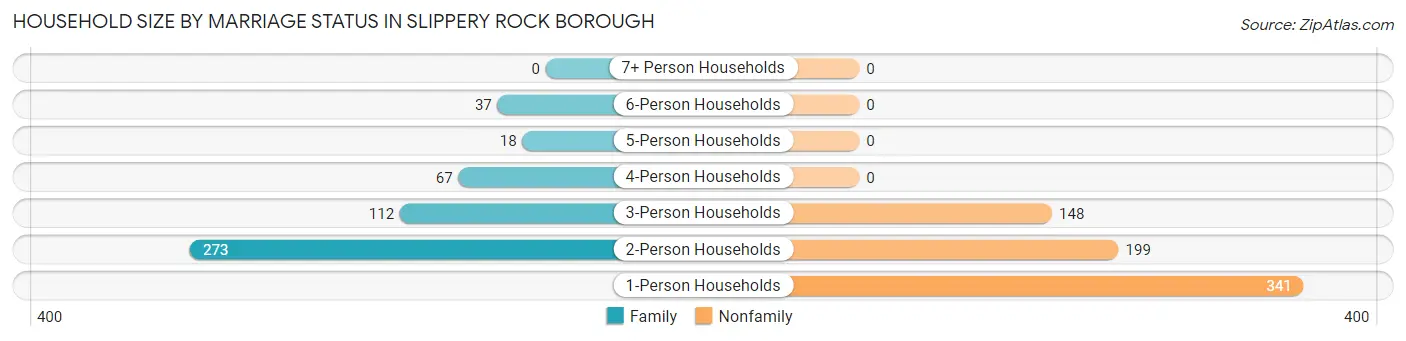
Household Size by Marriage Status in Slippery Rock borough
Out of a total of 1,195 households in Slippery Rock borough, 507 (42.4%) are family households, while 688 (57.6%) are nonfamily households. The most numerous type of family households are 2-person households, comprising 273, and the most common type of nonfamily households are 1-person households, comprising 341.
| Household Size | Family Households | Nonfamily Households |
| 1-Person Households | - | 341 (28.5%) |
| 2-Person Households | 273 (22.9%) | 199 (16.7%) |
| 3-Person Households | 112 (9.4%) | 148 (12.4%) |
| 4-Person Households | 67 (5.6%) | 0 (0.0%) |
| 5-Person Households | 18 (1.5%) | 0 (0.0%) |
| 6-Person Households | 37 (3.1%) | 0 (0.0%) |
| 7+ Person Households | 0 (0.0%) | 0 (0.0%) |
| Total | 507 (42.4%) | 688 (57.6%) |
Female Fertility in Slippery Rock borough
Fertility by Age in Slippery Rock borough
Average fertility rate in Slippery Rock borough is 6.0 births per 1,000 women. Women in the age bracket of 20 to 34 years have the highest fertility rate with 10.0 births per 1,000 women. Women in the age bracket of 20 to 34 years acount for 100.0% of all women with births.
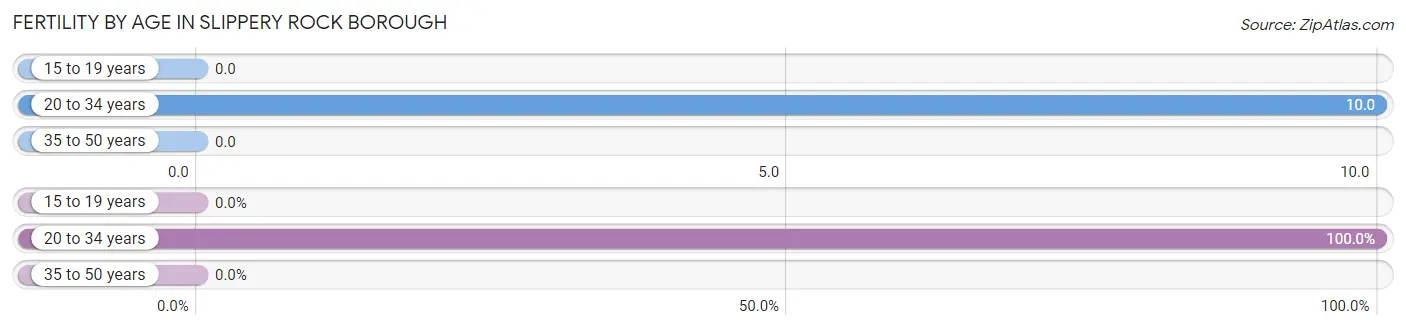
| Age Bracket | Women with Births | Births / 1,000 Women |
| 15 to 19 years | 0 (0.0%) | 0.0 |
| 20 to 34 years | 7 (100.0%) | 10.0 |
| 35 to 50 years | 0 (0.0%) | 0.0 |
| Total | 7 (100.0%) | 6.0 |
Fertility by Age by Marriage Status in Slippery Rock borough
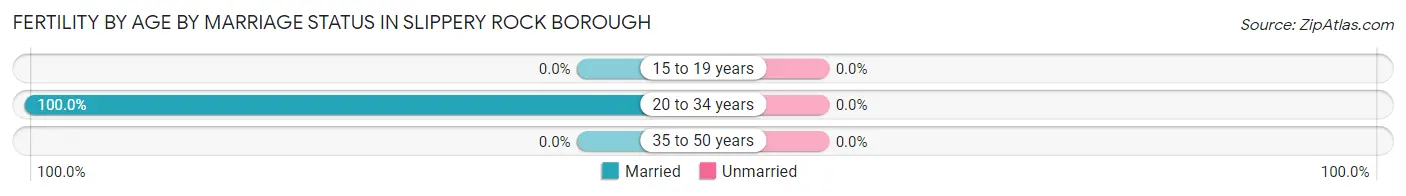
| Age Bracket | Married | Unmarried |
| 15 to 19 years | 0 (0.0%) | 0 (0.0%) |
| 20 to 34 years | 7 (100.0%) | 0 (0.0%) |
| 35 to 50 years | 0 (0.0%) | 0 (0.0%) |
| Total | 7 (100.0%) | 0 (0.0%) |
Fertility by Education in Slippery Rock borough
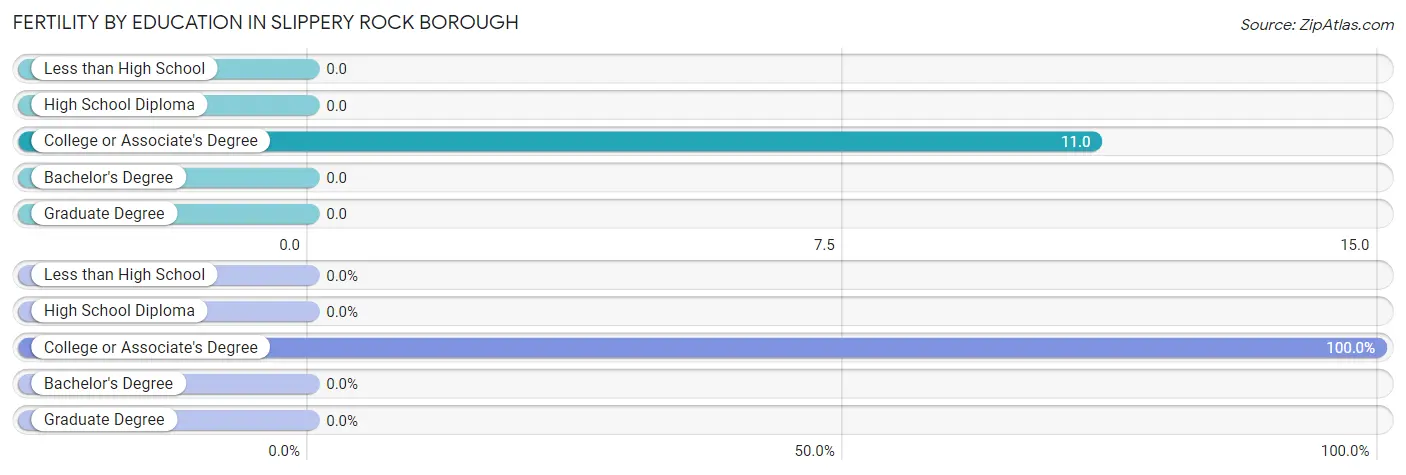
| Educational Attainment | Women with Births | Births / 1,000 Women |
| Less than High School | 0 (0.0%) | 0.0 |
| High School Diploma | 0 (0.0%) | 0.0 |
| College or Associate's Degree | 7 (100.0%) | 11.0 |
| Bachelor's Degree | 0 (0.0%) | 0.0 |
| Graduate Degree | 0 (0.0%) | 0.0 |
| Total | 7 (100.0%) | 6.0 |
Fertility by Education by Marriage Status in Slippery Rock borough
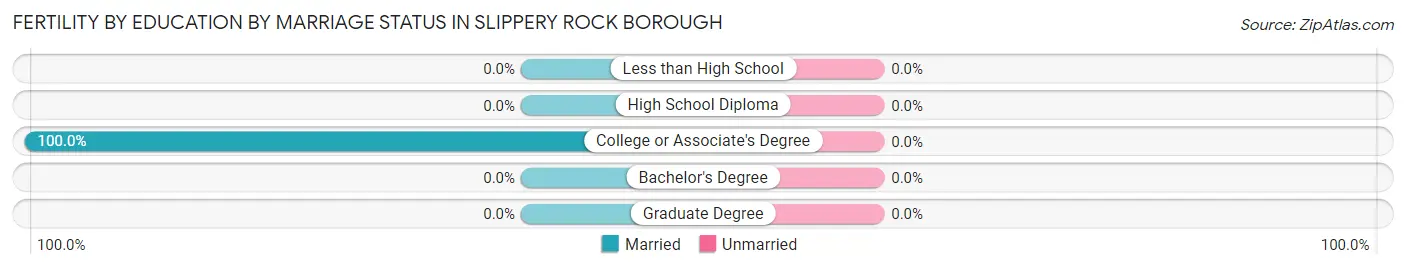
| Educational Attainment | Married | Unmarried |
| Less than High School | 0 (0.0%) | 0 (0.0%) |
| High School Diploma | 0 (0.0%) | 0 (0.0%) |
| College or Associate's Degree | 7 (100.0%) | 0 (0.0%) |
| Bachelor's Degree | 0 (0.0%) | 0 (0.0%) |
| Graduate Degree | 0 (0.0%) | 0 (0.0%) |
| Total | 7 (100.0%) | 0 (0.0%) |
Employment Characteristics in Slippery Rock borough
Employment by Class of Employer in Slippery Rock borough
Among the 1,440 employed individuals in Slippery Rock borough, private company employees (903 | 62.7%), not-for-profit organizations (127 | 8.8%), and state government employees (116 | 8.1%) make up the most common classes of employment.
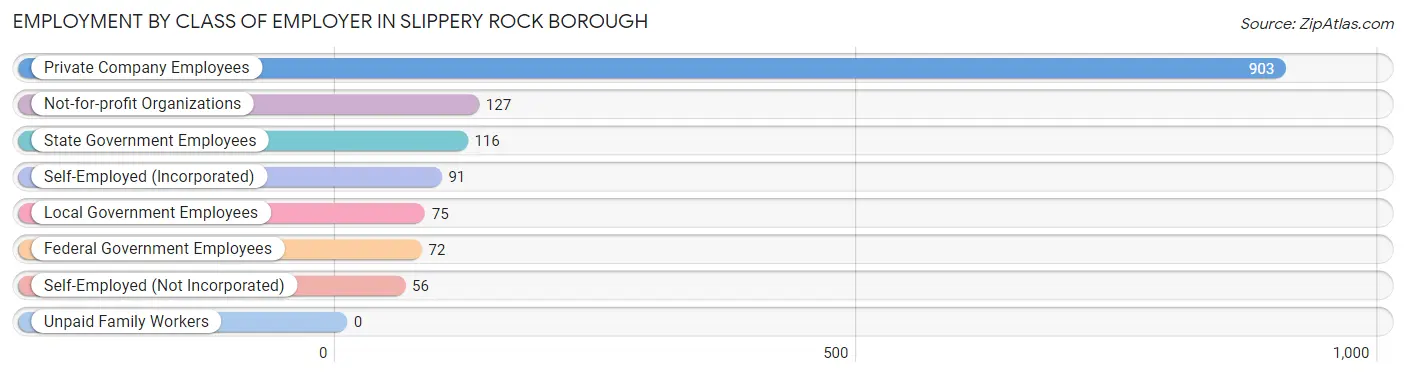
| Employer Class | # Employees | % Employees |
| Private Company Employees | 903 | 62.7% |
| Self-Employed (Incorporated) | 91 | 6.3% |
| Self-Employed (Not Incorporated) | 56 | 3.9% |
| Not-for-profit Organizations | 127 | 8.8% |
| Local Government Employees | 75 | 5.2% |
| State Government Employees | 116 | 8.1% |
| Federal Government Employees | 72 | 5.0% |
| Unpaid Family Workers | 0 | 0.0% |
| Total | 1,440 | 100.0% |
Employment Status by Age in Slippery Rock borough
According to the labor force statistics for Slippery Rock borough, out of the total population over 16 years of age (3,078), 52.0% or 1,601 individuals are in the labor force, with 4.9% or 78 of them unemployed. The age group with the highest labor force participation rate is 45 to 54 years, with 89.3% or 159 individuals in the labor force. Within the labor force, the 16 to 19 years age range has the highest percentage of unemployed individuals, with 9.4% or 22 of them being unemployed.
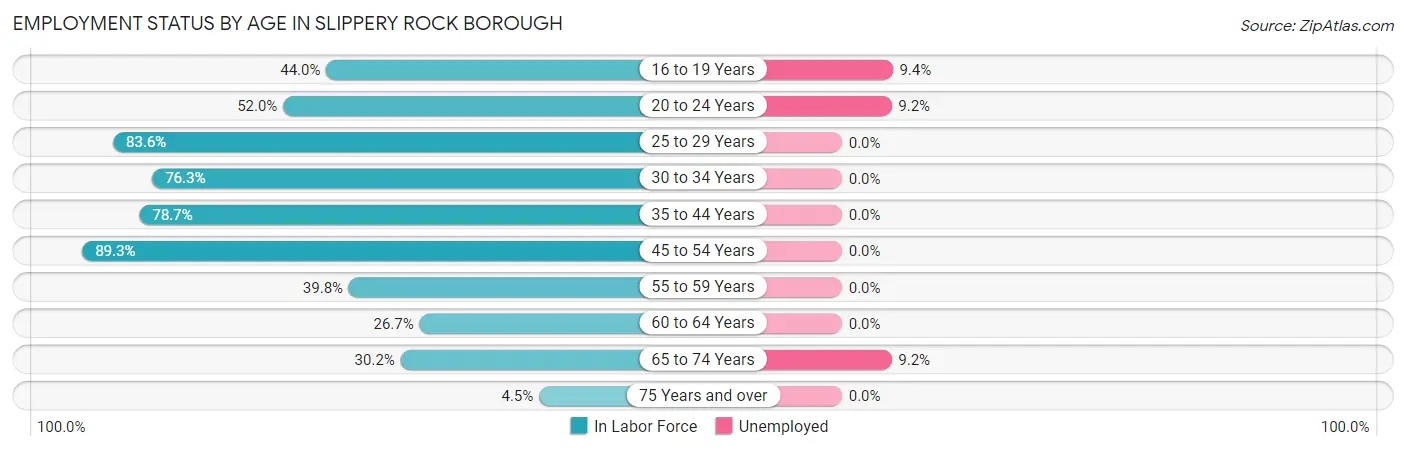
| Age Bracket | In Labor Force | Unemployed |
| 16 to 19 Years | 235 (44.0%) | 22 (9.4%) |
| 20 to 24 Years | 553 (52.0%) | 51 (9.2%) |
| 25 to 29 Years | 178 (83.6%) | 0 (0.0%) |
| 30 to 34 Years | 180 (76.3%) | 0 (0.0%) |
| 35 to 44 Years | 100 (78.7%) | 0 (0.0%) |
| 45 to 54 Years | 159 (89.3%) | 0 (0.0%) |
| 55 to 59 Years | 76 (39.8%) | 0 (0.0%) |
| 60 to 64 Years | 50 (26.7%) | 0 (0.0%) |
| 65 to 74 Years | 65 (30.2%) | 6 (9.2%) |
| 75 Years and over | 6 (4.5%) | 0 (0.0%) |
| Total | 1,601 (52.0%) | 78 (4.9%) |
Employment Status by Educational Attainment in Slippery Rock borough
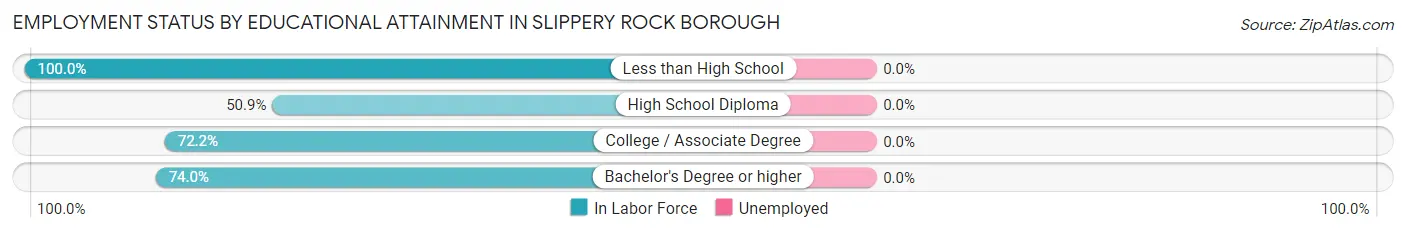
| Educational Attainment | In Labor Force | Unemployed |
| Less than High School | 40 (100.0%) | 0 (0.0%) |
| High School Diploma | 223 (50.9%) | 0 (0.0%) |
| College / Associate Degree | 161 (72.2%) | 0 (0.0%) |
| Bachelor's Degree or higher | 319 (74.0%) | 0 (0.0%) |
| Total | 743 (65.6%) | 0 (0.0%) |
Employment Occupations by Sex in Slippery Rock borough
Management, Business, Science and Arts Occupations
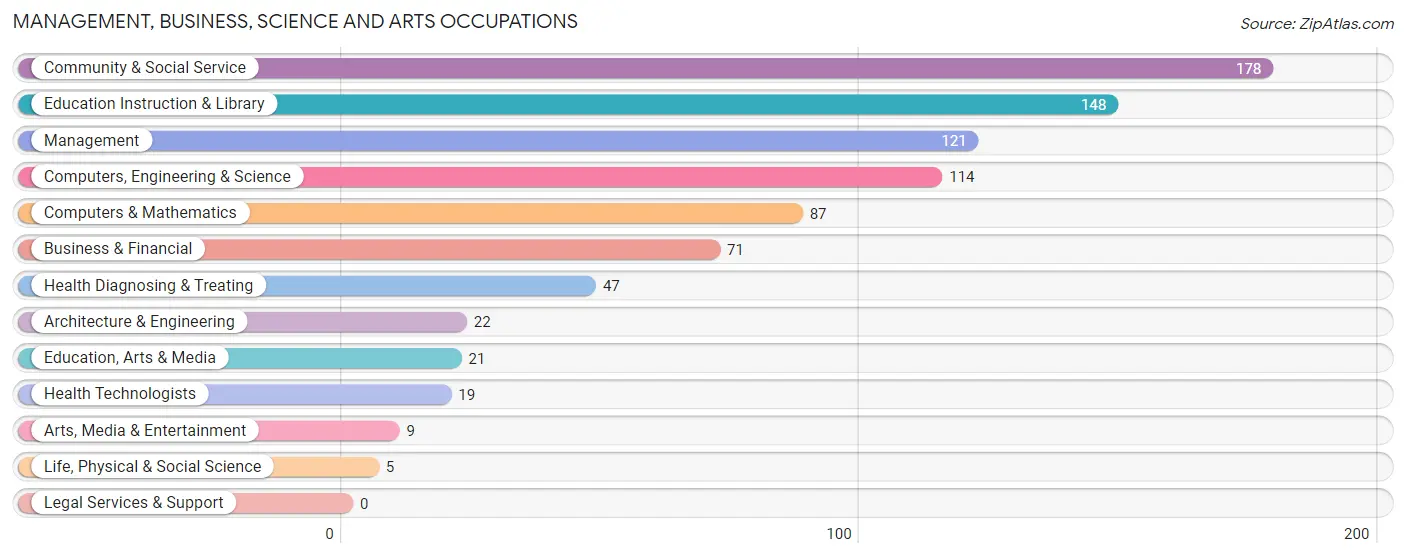
The most common Management, Business, Science and Arts occupations in Slippery Rock borough are Community & Social Service (178 | 11.7%), Education Instruction & Library (148 | 9.7%), Management (121 | 7.9%), Computers, Engineering & Science (114 | 7.5%), and Computers & Mathematics (87 | 5.7%).
Management, Business, Science and Arts Occupations by Sex
Within the Management, Business, Science and Arts occupations in Slippery Rock borough, the most male-oriented occupations are Computers & Mathematics (100.0%), Life, Physical & Social Science (100.0%), and Arts, Media & Entertainment (100.0%), while the most female-oriented occupations are Architecture & Engineering (72.7%), Education Instruction & Library (66.2%), and Management (61.2%).
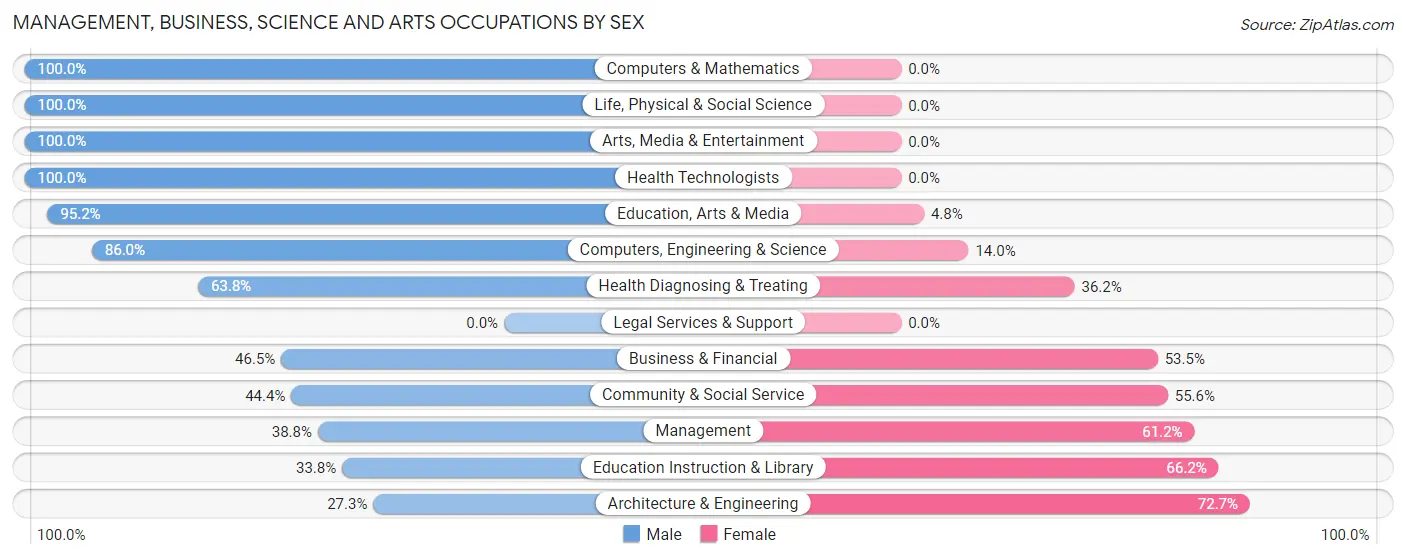
| Occupation | Male | Female |
| Management | 47 (38.8%) | 74 (61.2%) |
| Business & Financial | 33 (46.5%) | 38 (53.5%) |
| Computers, Engineering & Science | 98 (86.0%) | 16 (14.0%) |
| Computers & Mathematics | 87 (100.0%) | 0 (0.0%) |
| Architecture & Engineering | 6 (27.3%) | 16 (72.7%) |
| Life, Physical & Social Science | 5 (100.0%) | 0 (0.0%) |
| Community & Social Service | 79 (44.4%) | 99 (55.6%) |
| Education, Arts & Media | 20 (95.2%) | 1 (4.8%) |
| Legal Services & Support | 0 (0.0%) | 0 (0.0%) |
| Education Instruction & Library | 50 (33.8%) | 98 (66.2%) |
| Arts, Media & Entertainment | 9 (100.0%) | 0 (0.0%) |
| Health Diagnosing & Treating | 30 (63.8%) | 17 (36.2%) |
| Health Technologists | 19 (100.0%) | 0 (0.0%) |
| Total (Category) | 287 (54.0%) | 244 (46.0%) |
| Total (Overall) | 721 (47.3%) | 802 (52.7%) |
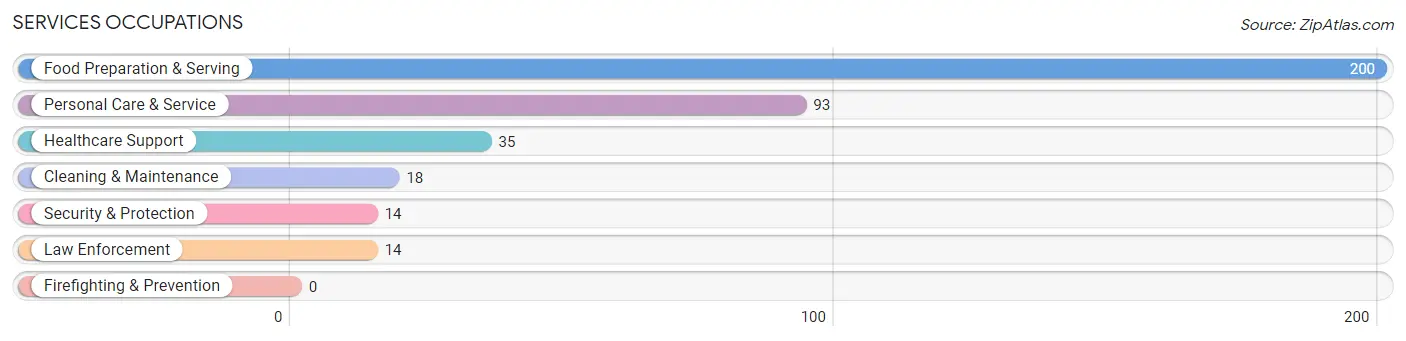
Services Occupations
The most common Services occupations in Slippery Rock borough are Food Preparation & Serving (200 | 13.1%), Personal Care & Service (93 | 6.1%), Healthcare Support (35 | 2.3%), Cleaning & Maintenance (18 | 1.2%), and Security & Protection (14 | 0.9%).
Services Occupations by Sex
Within the Services occupations in Slippery Rock borough, the most male-oriented occupations are Security & Protection (100.0%), Law Enforcement (100.0%), and Food Preparation & Serving (50.5%), while the most female-oriented occupations are Healthcare Support (100.0%), Cleaning & Maintenance (100.0%), and Personal Care & Service (66.7%).
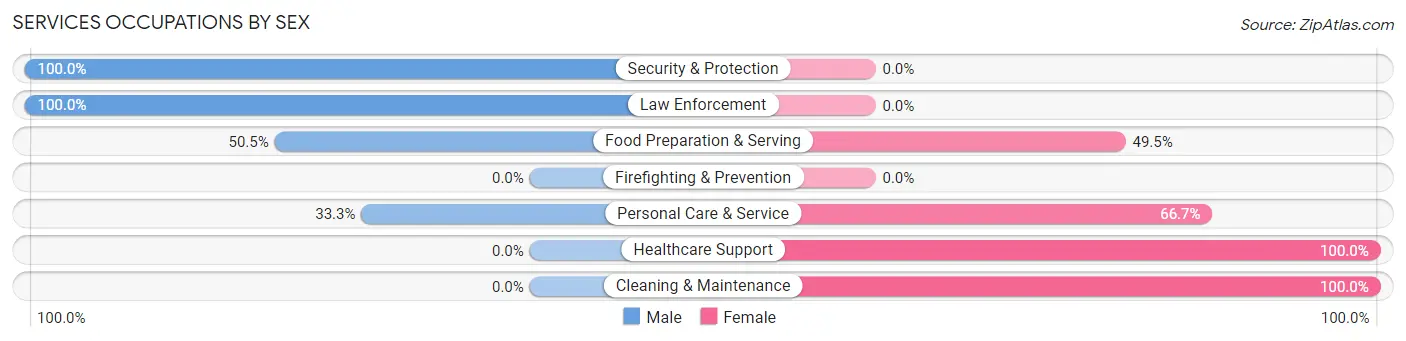
| Occupation | Male | Female |
| Healthcare Support | 0 (0.0%) | 35 (100.0%) |
| Security & Protection | 14 (100.0%) | 0 (0.0%) |
| Firefighting & Prevention | 0 (0.0%) | 0 (0.0%) |
| Law Enforcement | 14 (100.0%) | 0 (0.0%) |
| Food Preparation & Serving | 101 (50.5%) | 99 (49.5%) |
| Cleaning & Maintenance | 0 (0.0%) | 18 (100.0%) |
| Personal Care & Service | 31 (33.3%) | 62 (66.7%) |
| Total (Category) | 146 (40.6%) | 214 (59.4%) |
| Total (Overall) | 721 (47.3%) | 802 (52.7%) |
Sales and Office Occupations
The most common Sales and Office occupations in Slippery Rock borough are Sales & Related (344 | 22.6%), and Office & Administration (134 | 8.8%).

Sales and Office Occupations by Sex

| Occupation | Male | Female |
| Sales & Related | 135 (39.2%) | 209 (60.8%) |
| Office & Administration | 13 (9.7%) | 121 (90.3%) |
| Total (Category) | 148 (31.0%) | 330 (69.0%) |
| Total (Overall) | 721 (47.3%) | 802 (52.7%) |
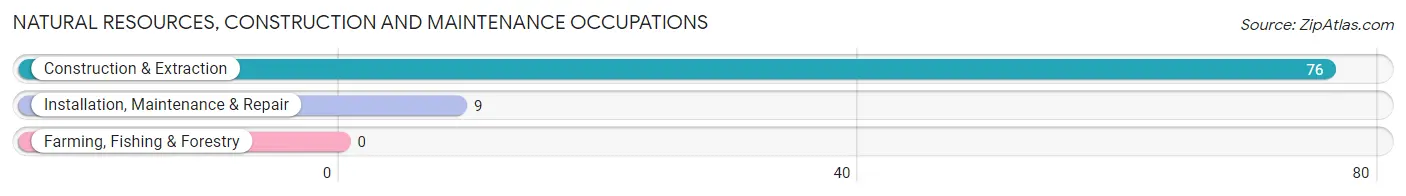
Natural Resources, Construction and Maintenance Occupations
The most common Natural Resources, Construction and Maintenance occupations in Slippery Rock borough are Construction & Extraction (76 | 5.0%), and Installation, Maintenance & Repair (9 | 0.6%).
Natural Resources, Construction and Maintenance Occupations by Sex

| Occupation | Male | Female |
| Farming, Fishing & Forestry | 0 (0.0%) | 0 (0.0%) |
| Construction & Extraction | 62 (81.6%) | 14 (18.4%) |
| Installation, Maintenance & Repair | 9 (100.0%) | 0 (0.0%) |
| Total (Category) | 71 (83.5%) | 14 (16.5%) |
| Total (Overall) | 721 (47.3%) | 802 (52.7%) |
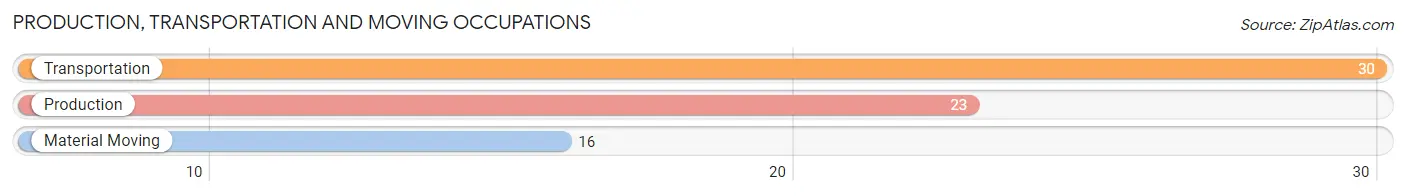
Production, Transportation and Moving Occupations
The most common Production, Transportation and Moving occupations in Slippery Rock borough are Transportation (30 | 2.0%), Production (23 | 1.5%), and Material Moving (16 | 1.1%).
Production, Transportation and Moving Occupations by Sex
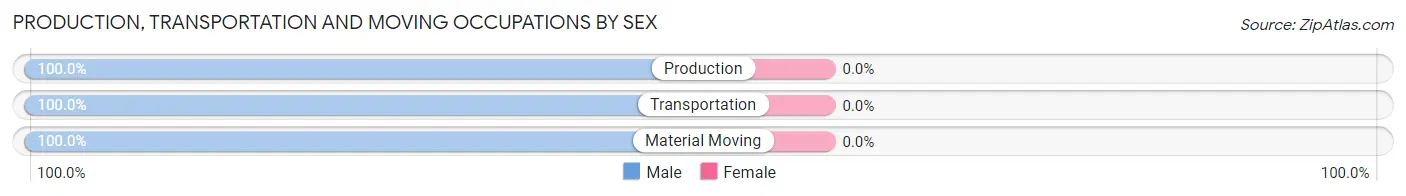
| Occupation | Male | Female |
| Production | 23 (100.0%) | 0 (0.0%) |
| Transportation | 30 (100.0%) | 0 (0.0%) |
| Material Moving | 16 (100.0%) | 0 (0.0%) |
| Total (Category) | 69 (100.0%) | 0 (0.0%) |
| Total (Overall) | 721 (47.3%) | 802 (52.7%) |
Employment Industries by Sex in Slippery Rock borough
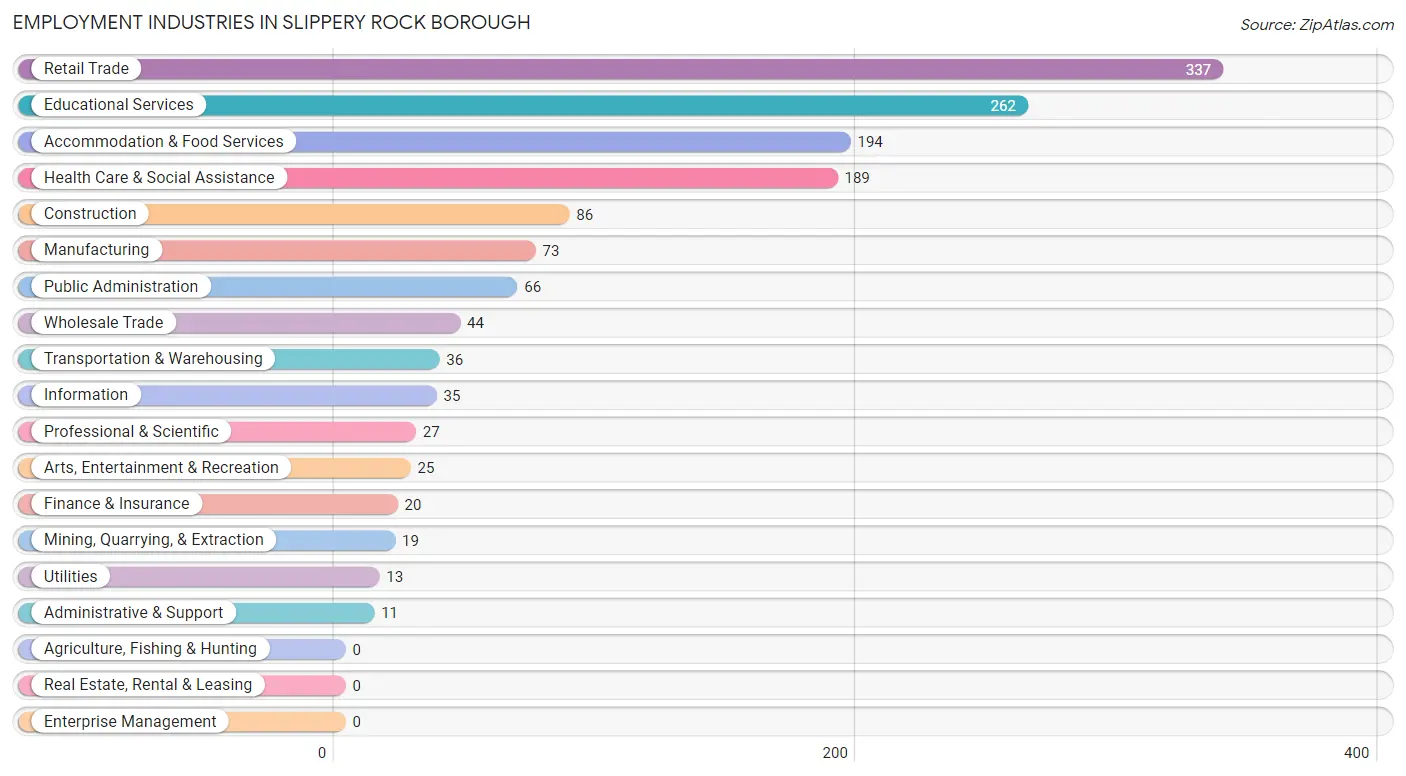
Employment Industries in Slippery Rock borough
The major employment industries in Slippery Rock borough include Retail Trade (337 | 22.1%), Educational Services (262 | 17.2%), Accommodation & Food Services (194 | 12.7%), Health Care & Social Assistance (189 | 12.4%), and Construction (86 | 5.7%).
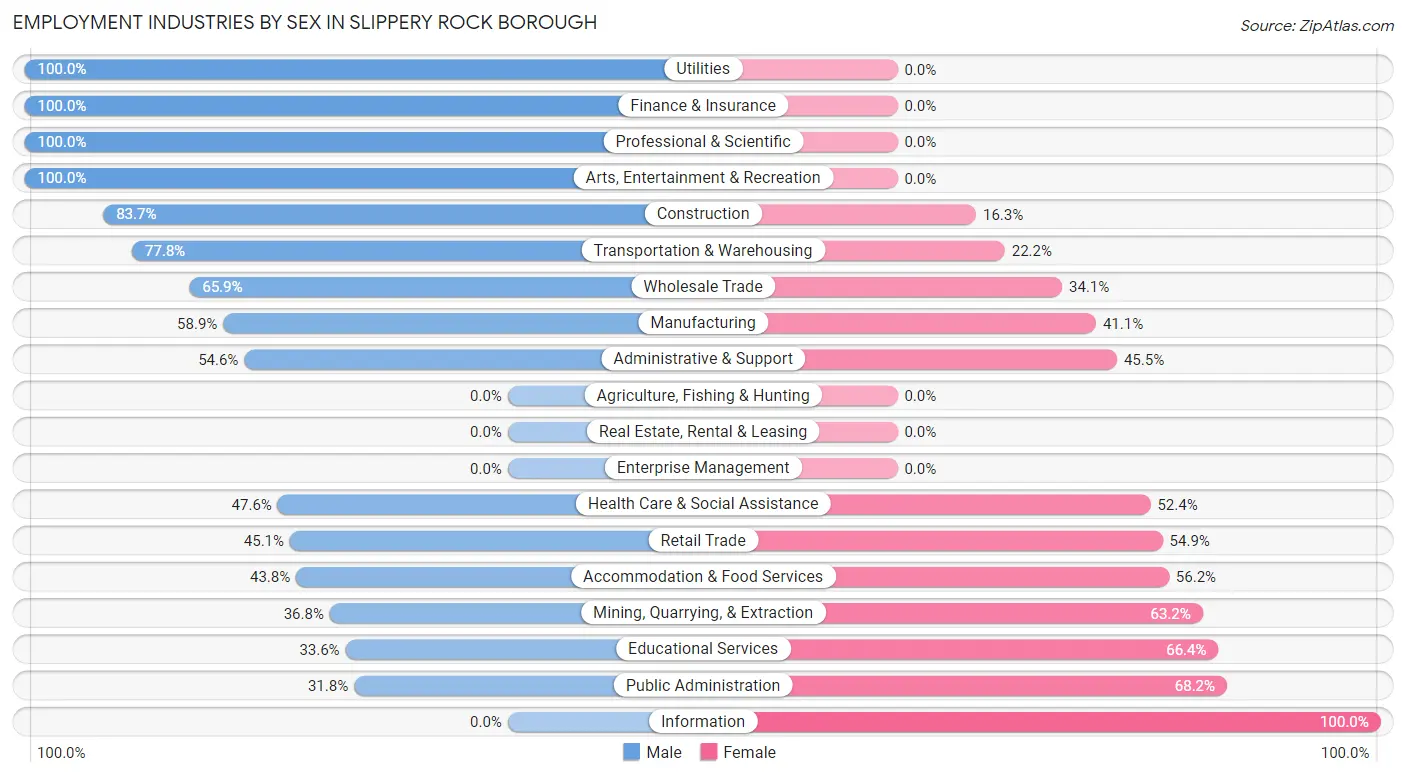
Employment Industries by Sex in Slippery Rock borough
The Slippery Rock borough industries that see more men than women are Utilities (100.0%), Finance & Insurance (100.0%), and Professional & Scientific (100.0%), whereas the industries that tend to have a higher number of women are Information (100.0%), Public Administration (68.2%), and Educational Services (66.4%).
| Industry | Male | Female |
| Agriculture, Fishing & Hunting | 0 (0.0%) | 0 (0.0%) |
| Mining, Quarrying, & Extraction | 7 (36.8%) | 12 (63.2%) |
| Construction | 72 (83.7%) | 14 (16.3%) |
| Manufacturing | 43 (58.9%) | 30 (41.1%) |
| Wholesale Trade | 29 (65.9%) | 15 (34.1%) |
| Retail Trade | 152 (45.1%) | 185 (54.9%) |
| Transportation & Warehousing | 28 (77.8%) | 8 (22.2%) |
| Utilities | 13 (100.0%) | 0 (0.0%) |
| Information | 0 (0.0%) | 35 (100.0%) |
| Finance & Insurance | 20 (100.0%) | 0 (0.0%) |
| Real Estate, Rental & Leasing | 0 (0.0%) | 0 (0.0%) |
| Professional & Scientific | 27 (100.0%) | 0 (0.0%) |
| Enterprise Management | 0 (0.0%) | 0 (0.0%) |
| Administrative & Support | 6 (54.5%) | 5 (45.5%) |
| Educational Services | 88 (33.6%) | 174 (66.4%) |
| Health Care & Social Assistance | 90 (47.6%) | 99 (52.4%) |
| Arts, Entertainment & Recreation | 25 (100.0%) | 0 (0.0%) |
| Accommodation & Food Services | 85 (43.8%) | 109 (56.2%) |
| Public Administration | 21 (31.8%) | 45 (68.2%) |
| Total | 721 (47.3%) | 802 (52.7%) |
Education in Slippery Rock borough
School Enrollment in Slippery Rock borough
The most common levels of schooling among the 1,657 students in Slippery Rock borough are college / undergraduate (1,225 | 73.9%), graduate / professional (175 | 10.6%), and middle school (89 | 5.4%).
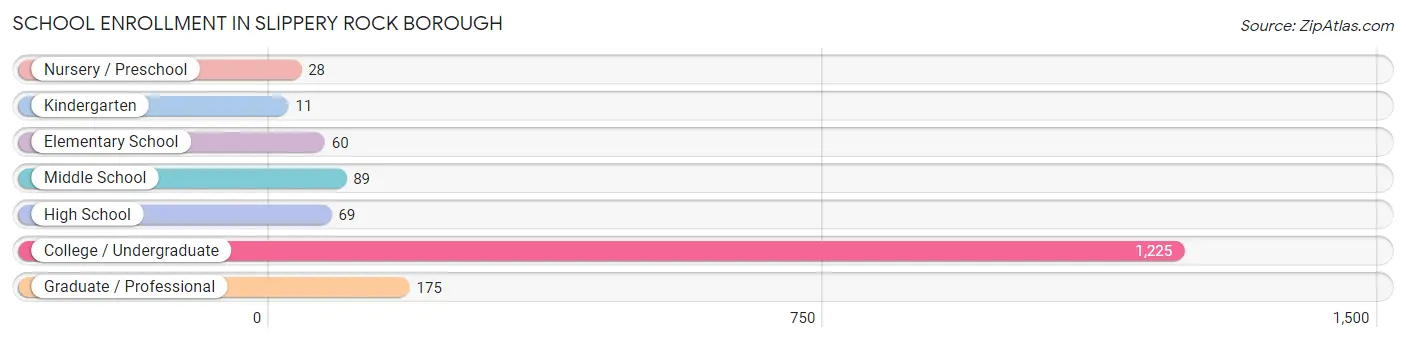
| School Level | # Students | % Students |
| Nursery / Preschool | 28 | 1.7% |
| Kindergarten | 11 | 0.7% |
| Elementary School | 60 | 3.6% |
| Middle School | 89 | 5.4% |
| High School | 69 | 4.2% |
| College / Undergraduate | 1,225 | 73.9% |
| Graduate / Professional | 175 | 10.6% |
| Total | 1,657 | 100.0% |
School Enrollment by Age by Funding Source in Slippery Rock borough
Out of a total of 1,657 students who are enrolled in schools in Slippery Rock borough, 80 (4.8%) attend a private institution, while the remaining 1,577 (95.2%) are enrolled in public schools. The age group of 5 to 9 year old has the highest likelihood of being enrolled in private schools, with 28 (30.8% in the age bracket) enrolled. Conversely, the age group of 15 to 17 year olds has the lowest likelihood of being enrolled in a private school, with 49 (100.0% in the age bracket) attending a public institution.
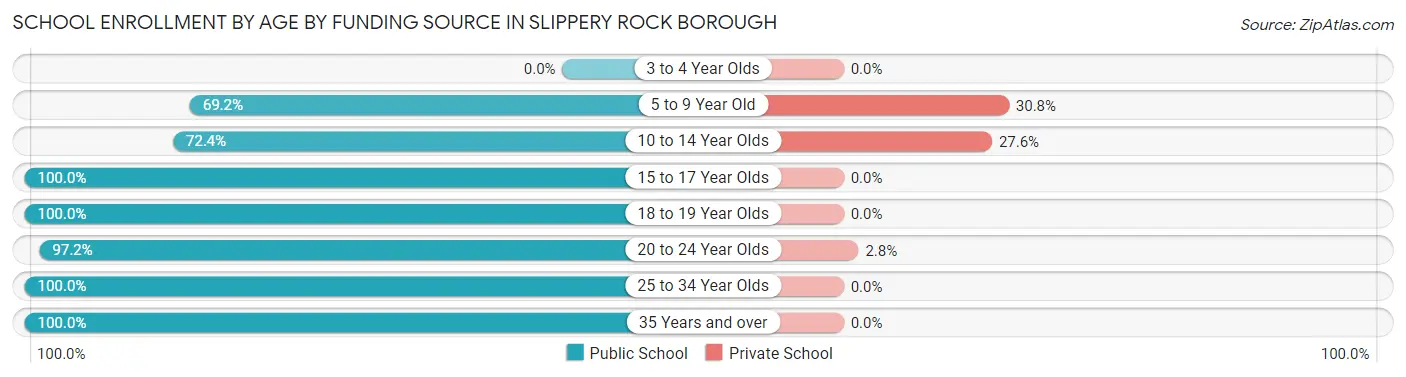
| Age Bracket | Public School | Private School |
| 3 to 4 Year Olds | 0 (0.0%) | 0 (0.0%) |
| 5 to 9 Year Old | 63 (69.2%) | 28 (30.8%) |
| 10 to 14 Year Olds | 76 (72.4%) | 29 (27.6%) |
| 15 to 17 Year Olds | 49 (100.0%) | 0 (0.0%) |
| 18 to 19 Year Olds | 507 (100.0%) | 0 (0.0%) |
| 20 to 24 Year Olds | 775 (97.2%) | 22 (2.8%) |
| 25 to 34 Year Olds | 89 (100.0%) | 0 (0.0%) |
| 35 Years and over | 19 (100.0%) | 0 (0.0%) |
| Total | 1,577 (95.2%) | 80 (4.8%) |
Educational Attainment by Field of Study in Slippery Rock borough
Education (131 | 23.4%), business (100 | 17.9%), science & technology (46 | 8.2%), psychology (41 | 7.3%), and literature & languages (41 | 7.3%) are the most common fields of study among 560 individuals in Slippery Rock borough who have obtained a bachelor's degree or higher.
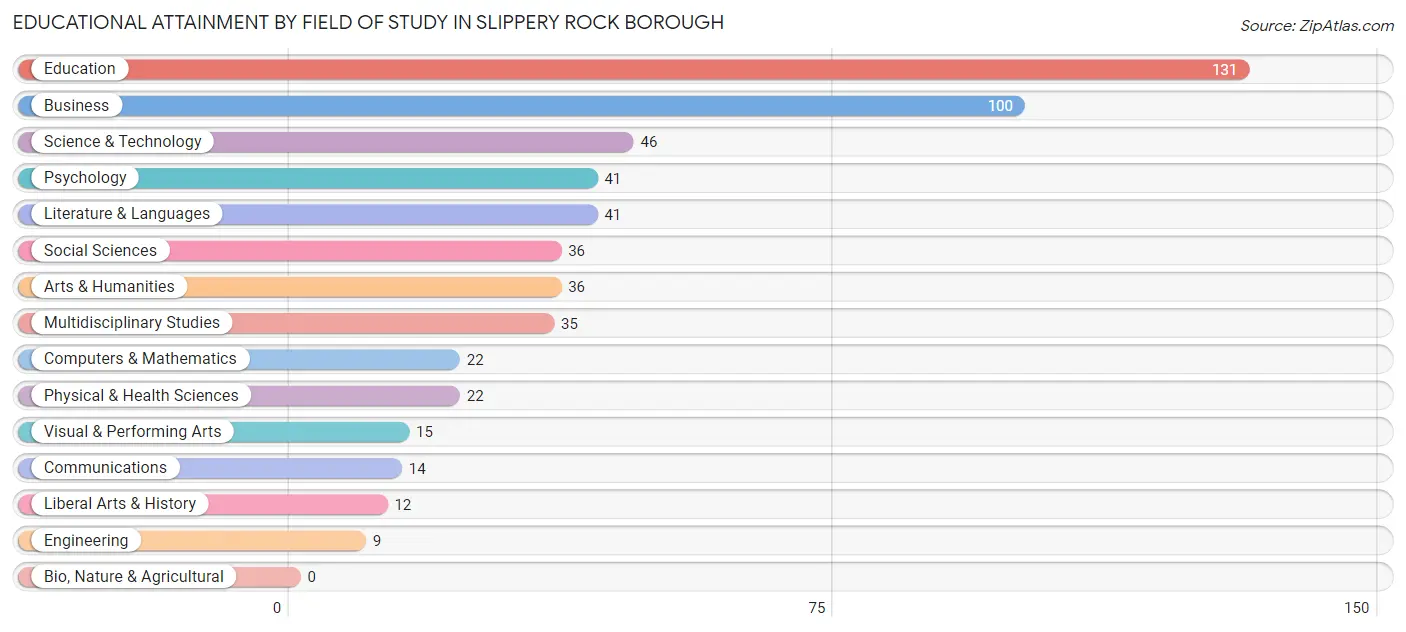
| Field of Study | # Graduates | % Graduates |
| Computers & Mathematics | 22 | 3.9% |
| Bio, Nature & Agricultural | 0 | 0.0% |
| Physical & Health Sciences | 22 | 3.9% |
| Psychology | 41 | 7.3% |
| Social Sciences | 36 | 6.4% |
| Engineering | 9 | 1.6% |
| Multidisciplinary Studies | 35 | 6.2% |
| Science & Technology | 46 | 8.2% |
| Business | 100 | 17.9% |
| Education | 131 | 23.4% |
| Literature & Languages | 41 | 7.3% |
| Liberal Arts & History | 12 | 2.1% |
| Visual & Performing Arts | 15 | 2.7% |
| Communications | 14 | 2.5% |
| Arts & Humanities | 36 | 6.4% |
| Total | 560 | 100.0% |
Transportation & Commute in Slippery Rock borough
Vehicle Availability by Sex in Slippery Rock borough
The most prevalent vehicle ownership categories in Slippery Rock borough are males with 3 vehicles (223, accounting for 35.4%) and females with 3 vehicles (110, making up 36.2%).
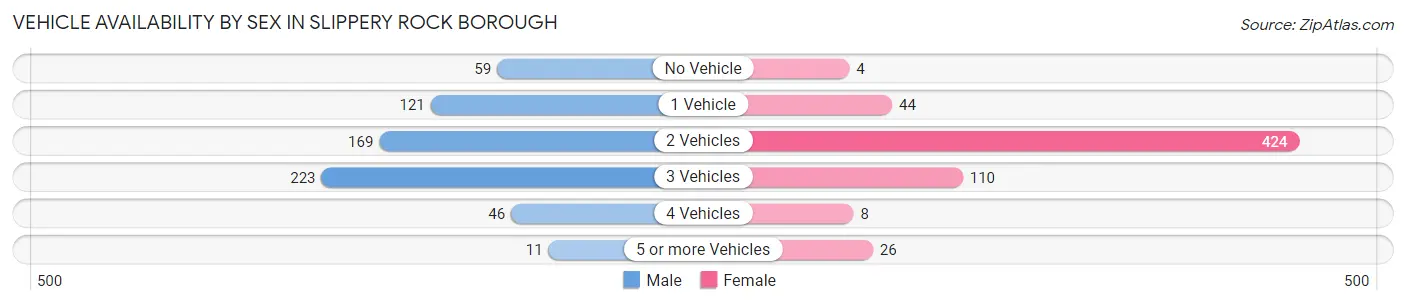
| Vehicles Available | Male | Female |
| No Vehicle | 59 (9.4%) | 4 (0.6%) |
| 1 Vehicle | 121 (19.2%) | 44 (7.1%) |
| 2 Vehicles | 169 (26.9%) | 424 (68.8%) |
| 3 Vehicles | 223 (35.4%) | 110 (17.9%) |
| 4 Vehicles | 46 (7.3%) | 8 (1.3%) |
| 5 or more Vehicles | 11 (1.8%) | 26 (4.2%) |
| Total | 629 (100.0%) | 616 (100.0%) |
Commute Time in Slippery Rock borough
The most frequently occuring commute durations in Slippery Rock borough are 5 to 9 minutes (294 commuters, 21.4%), 15 to 19 minutes (267 commuters, 19.4%), and 20 to 24 minutes (165 commuters, 12.0%).
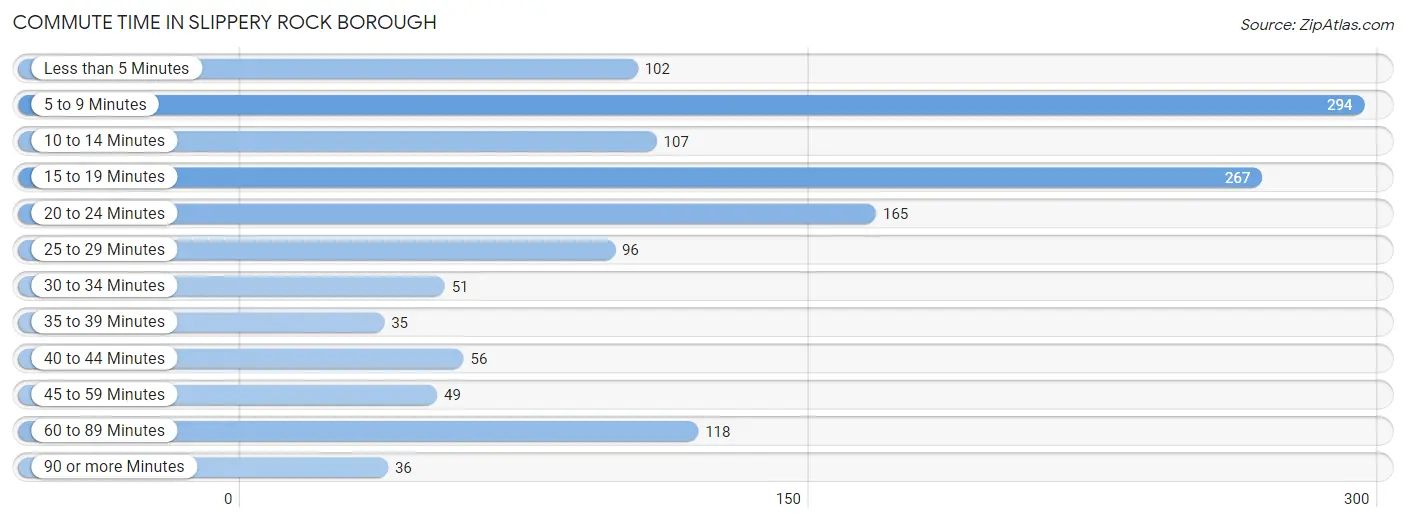
| Commute Time | # Commuters | % Commuters |
| Less than 5 Minutes | 102 | 7.4% |
| 5 to 9 Minutes | 294 | 21.4% |
| 10 to 14 Minutes | 107 | 7.8% |
| 15 to 19 Minutes | 267 | 19.4% |
| 20 to 24 Minutes | 165 | 12.0% |
| 25 to 29 Minutes | 96 | 7.0% |
| 30 to 34 Minutes | 51 | 3.7% |
| 35 to 39 Minutes | 35 | 2.5% |
| 40 to 44 Minutes | 56 | 4.1% |
| 45 to 59 Minutes | 49 | 3.6% |
| 60 to 89 Minutes | 118 | 8.6% |
| 90 or more Minutes | 36 | 2.6% |
Commute Time by Sex in Slippery Rock borough
The most common commute times in Slippery Rock borough are 5 to 9 minutes (176 commuters, 26.6%) for males and 15 to 19 minutes (184 commuters, 25.8%) for females.
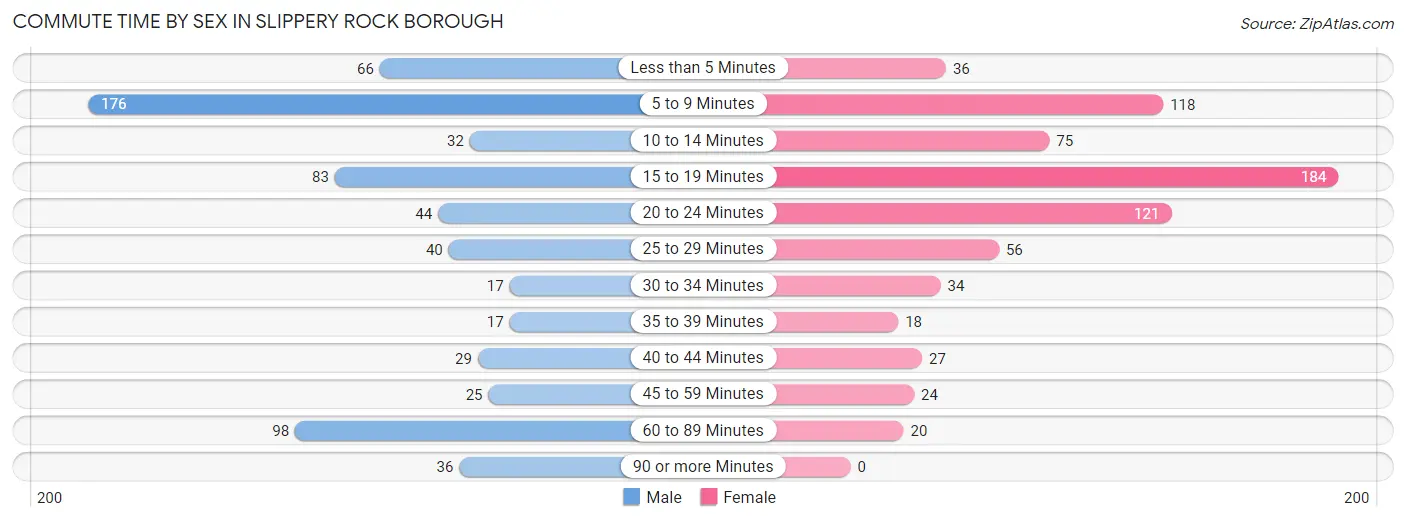
| Commute Time | Male | Female |
| Less than 5 Minutes | 66 (10.0%) | 36 (5.1%) |
| 5 to 9 Minutes | 176 (26.6%) | 118 (16.6%) |
| 10 to 14 Minutes | 32 (4.8%) | 75 (10.5%) |
| 15 to 19 Minutes | 83 (12.5%) | 184 (25.8%) |
| 20 to 24 Minutes | 44 (6.6%) | 121 (17.0%) |
| 25 to 29 Minutes | 40 (6.0%) | 56 (7.9%) |
| 30 to 34 Minutes | 17 (2.6%) | 34 (4.8%) |
| 35 to 39 Minutes | 17 (2.6%) | 18 (2.5%) |
| 40 to 44 Minutes | 29 (4.4%) | 27 (3.8%) |
| 45 to 59 Minutes | 25 (3.8%) | 24 (3.4%) |
| 60 to 89 Minutes | 98 (14.8%) | 20 (2.8%) |
| 90 or more Minutes | 36 (5.4%) | 0 (0.0%) |
Time of Departure to Work by Sex in Slippery Rock borough
The most frequent times of departure to work in Slippery Rock borough are 7:00 AM to 7:29 AM (175, 26.4%) for males and 12:00 PM to 3:59 PM (170, 23.8%) for females.
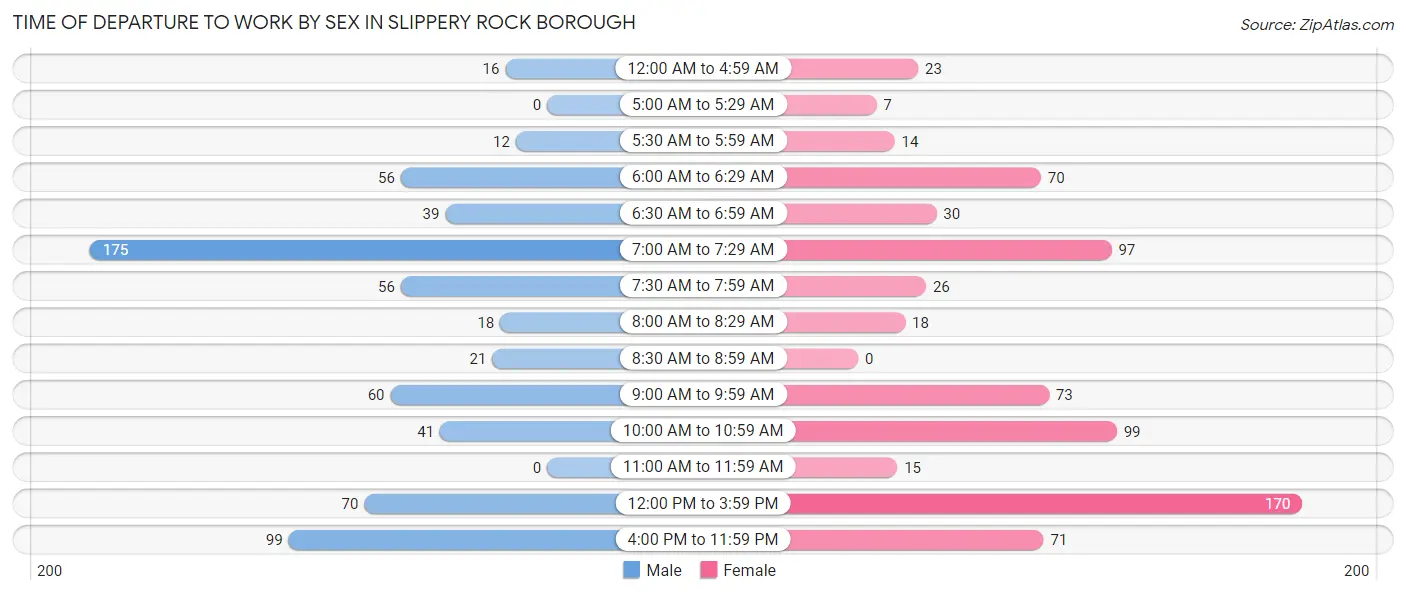
| Time of Departure | Male | Female |
| 12:00 AM to 4:59 AM | 16 (2.4%) | 23 (3.2%) |
| 5:00 AM to 5:29 AM | 0 (0.0%) | 7 (1.0%) |
| 5:30 AM to 5:59 AM | 12 (1.8%) | 14 (2.0%) |
| 6:00 AM to 6:29 AM | 56 (8.5%) | 70 (9.8%) |
| 6:30 AM to 6:59 AM | 39 (5.9%) | 30 (4.2%) |
| 7:00 AM to 7:29 AM | 175 (26.4%) | 97 (13.6%) |
| 7:30 AM to 7:59 AM | 56 (8.5%) | 26 (3.6%) |
| 8:00 AM to 8:29 AM | 18 (2.7%) | 18 (2.5%) |
| 8:30 AM to 8:59 AM | 21 (3.2%) | 0 (0.0%) |
| 9:00 AM to 9:59 AM | 60 (9.0%) | 73 (10.2%) |
| 10:00 AM to 10:59 AM | 41 (6.2%) | 99 (13.9%) |
| 11:00 AM to 11:59 AM | 0 (0.0%) | 15 (2.1%) |
| 12:00 PM to 3:59 PM | 70 (10.6%) | 170 (23.8%) |
| 4:00 PM to 11:59 PM | 99 (14.9%) | 71 (10.0%) |
| Total | 663 (100.0%) | 713 (100.0%) |
Housing Occupancy in Slippery Rock borough
Occupancy by Ownership in Slippery Rock borough
Of the total 1,195 dwellings in Slippery Rock borough, owner-occupied units account for 398 (33.3%), while renter-occupied units make up 797 (66.7%).
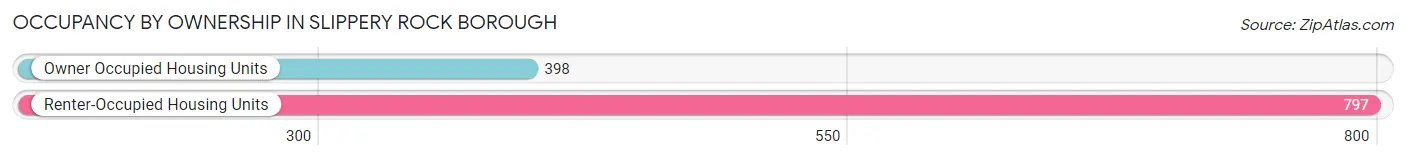
| Occupancy | # Housing Units | % Housing Units |
| Owner Occupied Housing Units | 398 | 33.3% |
| Renter-Occupied Housing Units | 797 | 66.7% |
| Total Occupied Housing Units | 1,195 | 100.0% |
Occupancy by Household Size in Slippery Rock borough
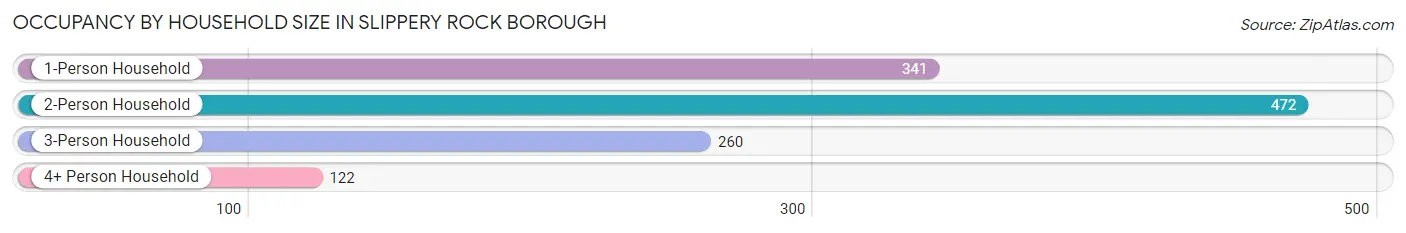
| Household Size | # Housing Units | % Housing Units |
| 1-Person Household | 341 | 28.5% |
| 2-Person Household | 472 | 39.5% |
| 3-Person Household | 260 | 21.8% |
| 4+ Person Household | 122 | 10.2% |
| Total Housing Units | 1,195 | 100.0% |
Occupancy by Ownership by Household Size in Slippery Rock borough
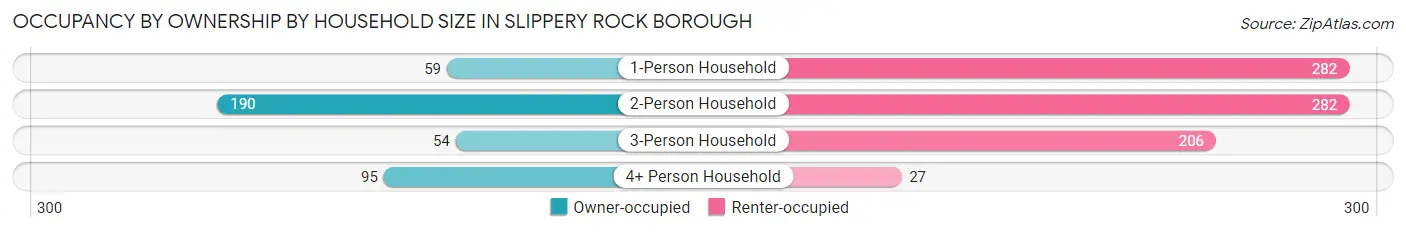
| Household Size | Owner-occupied | Renter-occupied |
| 1-Person Household | 59 (17.3%) | 282 (82.7%) |
| 2-Person Household | 190 (40.3%) | 282 (59.8%) |
| 3-Person Household | 54 (20.8%) | 206 (79.2%) |
| 4+ Person Household | 95 (77.9%) | 27 (22.1%) |
| Total Housing Units | 398 (33.3%) | 797 (66.7%) |
Occupancy by Educational Attainment in Slippery Rock borough
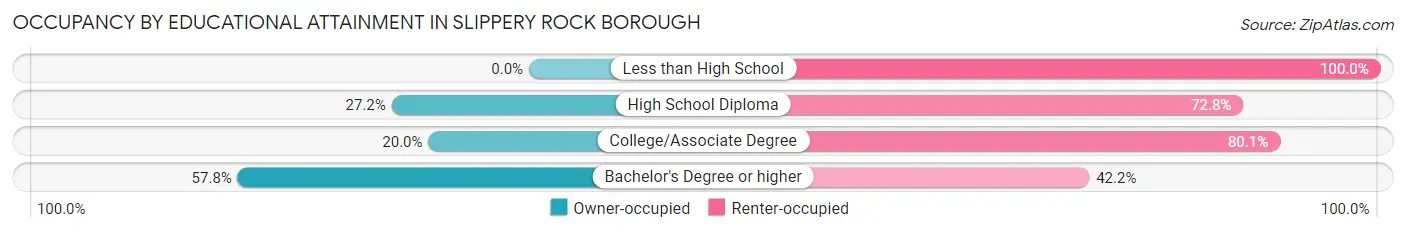
| Household Size | Owner-occupied | Renter-occupied |
| Less than High School | 0 (0.0%) | 59 (100.0%) |
| High School Diploma | 85 (27.2%) | 227 (72.8%) |
| College/Associate Degree | 86 (20.0%) | 345 (80.0%) |
| Bachelor's Degree or higher | 227 (57.8%) | 166 (42.2%) |
Occupancy by Age of Householder in Slippery Rock borough
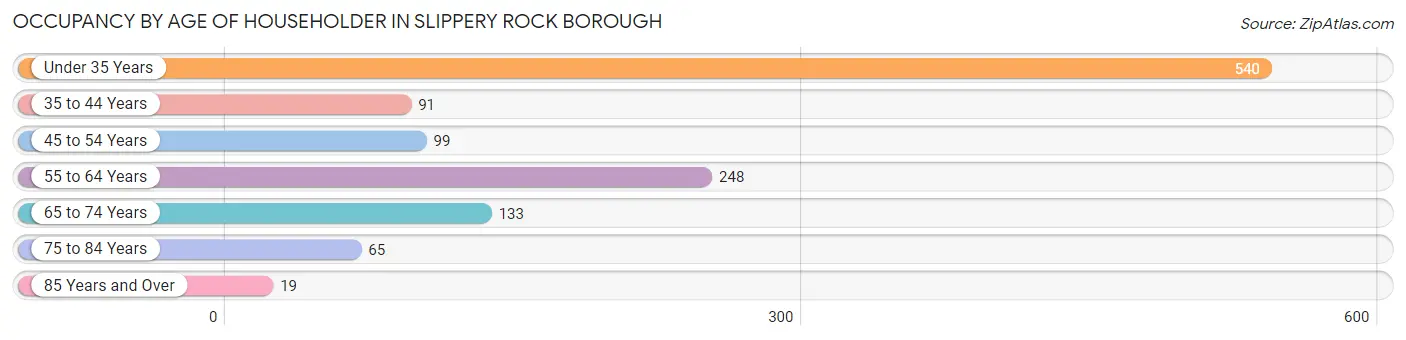
| Age Bracket | # Households | % Households |
| Under 35 Years | 540 | 45.2% |
| 35 to 44 Years | 91 | 7.6% |
| 45 to 54 Years | 99 | 8.3% |
| 55 to 64 Years | 248 | 20.7% |
| 65 to 74 Years | 133 | 11.1% |
| 75 to 84 Years | 65 | 5.4% |
| 85 Years and Over | 19 | 1.6% |
| Total | 1,195 | 100.0% |
Housing Finances in Slippery Rock borough
Median Income by Occupancy in Slippery Rock borough
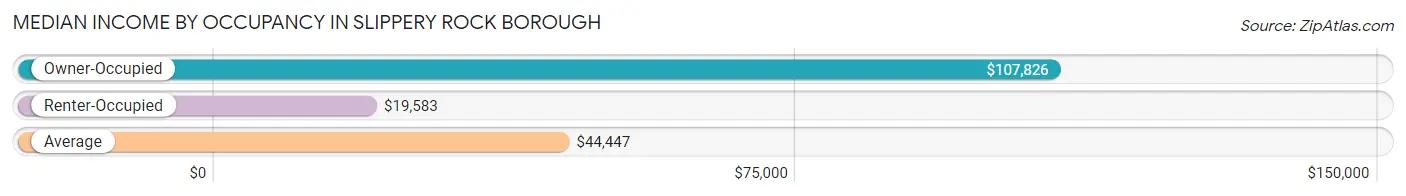
| Occupancy Type | # Households | Median Income |
| Owner-Occupied | 398 (33.3%) | $107,826 |
| Renter-Occupied | 797 (66.7%) | $19,583 |
| Average | 1,195 (100.0%) | $44,447 |
Occupancy by Householder Income Bracket in Slippery Rock borough
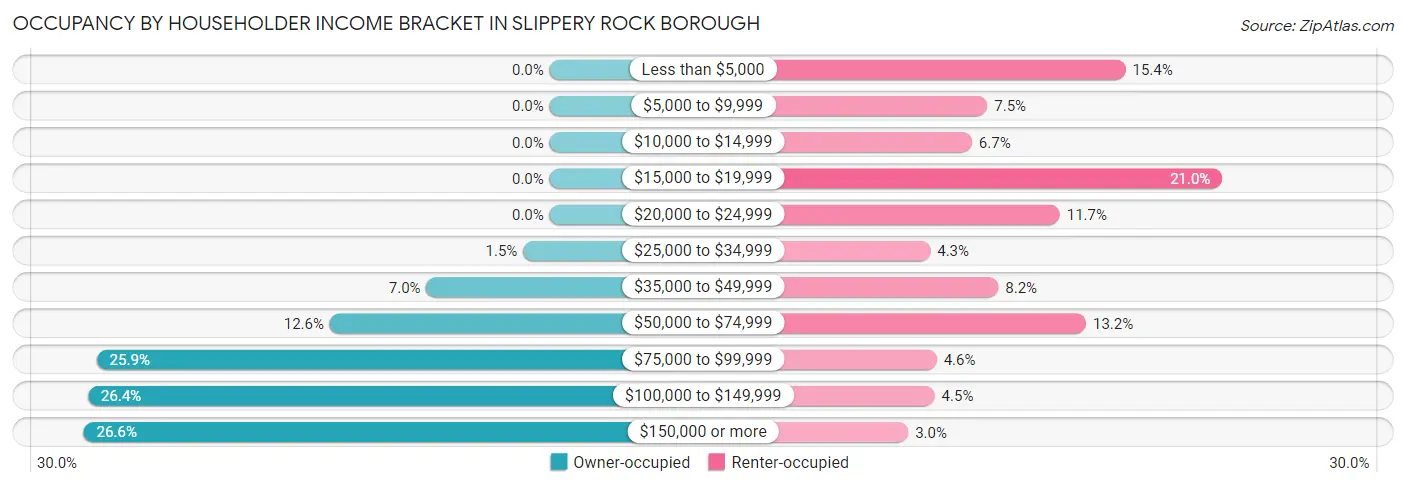
| Income Bracket | Owner-occupied | Renter-occupied |
| Less than $5,000 | 0 (0.0%) | 123 (15.4%) |
| $5,000 to $9,999 | 0 (0.0%) | 60 (7.5%) |
| $10,000 to $14,999 | 0 (0.0%) | 53 (6.7%) |
| $15,000 to $19,999 | 0 (0.0%) | 167 (20.9%) |
| $20,000 to $24,999 | 0 (0.0%) | 93 (11.7%) |
| $25,000 to $34,999 | 6 (1.5%) | 34 (4.3%) |
| $35,000 to $49,999 | 28 (7.0%) | 65 (8.2%) |
| $50,000 to $74,999 | 50 (12.6%) | 105 (13.2%) |
| $75,000 to $99,999 | 103 (25.9%) | 37 (4.6%) |
| $100,000 to $149,999 | 105 (26.4%) | 36 (4.5%) |
| $150,000 or more | 106 (26.6%) | 24 (3.0%) |
| Total | 398 (100.0%) | 797 (100.0%) |
Monthly Housing Cost Tiers in Slippery Rock borough
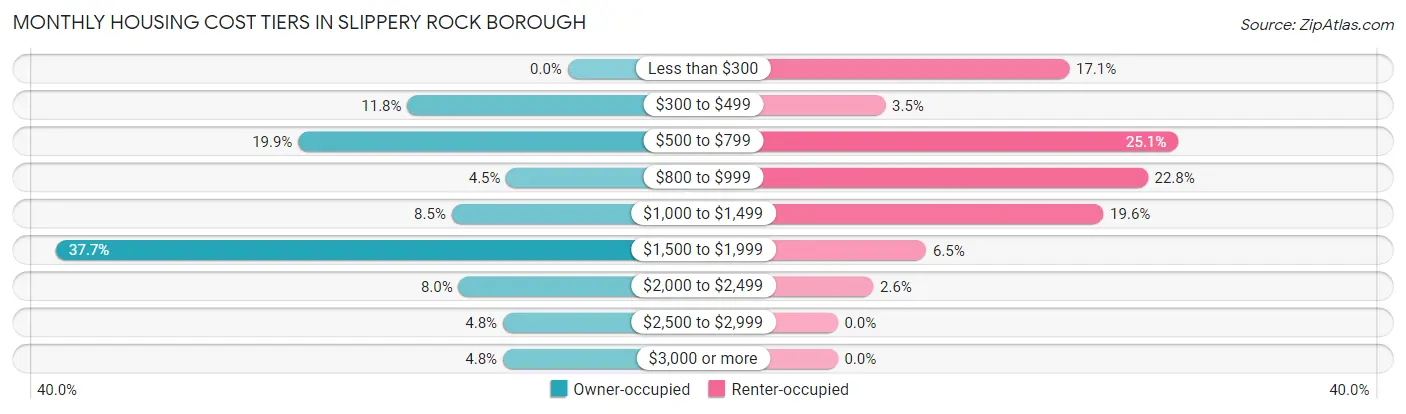
| Monthly Cost | Owner-occupied | Renter-occupied |
| Less than $300 | 0 (0.0%) | 136 (17.1%) |
| $300 to $499 | 47 (11.8%) | 28 (3.5%) |
| $500 to $799 | 79 (19.9%) | 200 (25.1%) |
| $800 to $999 | 18 (4.5%) | 182 (22.8%) |
| $1,000 to $1,499 | 34 (8.5%) | 156 (19.6%) |
| $1,500 to $1,999 | 150 (37.7%) | 52 (6.5%) |
| $2,000 to $2,499 | 32 (8.0%) | 21 (2.6%) |
| $2,500 to $2,999 | 19 (4.8%) | 0 (0.0%) |
| $3,000 or more | 19 (4.8%) | 0 (0.0%) |
| Total | 398 (100.0%) | 797 (100.0%) |
Physical Housing Characteristics in Slippery Rock borough
Housing Structures in Slippery Rock borough
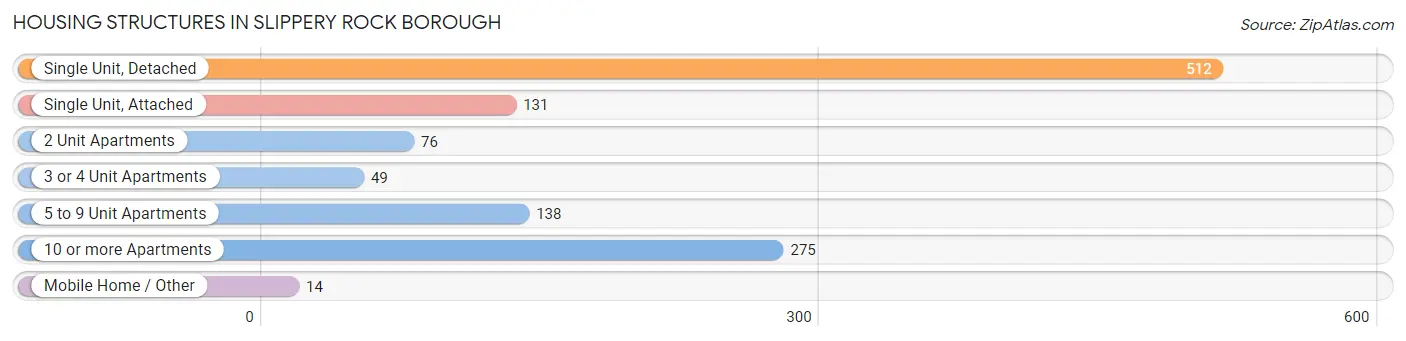
| Structure Type | # Housing Units | % Housing Units |
| Single Unit, Detached | 512 | 42.8% |
| Single Unit, Attached | 131 | 11.0% |
| 2 Unit Apartments | 76 | 6.4% |
| 3 or 4 Unit Apartments | 49 | 4.1% |
| 5 to 9 Unit Apartments | 138 | 11.6% |
| 10 or more Apartments | 275 | 23.0% |
| Mobile Home / Other | 14 | 1.2% |
| Total | 1,195 | 100.0% |
Housing Structures by Occupancy in Slippery Rock borough
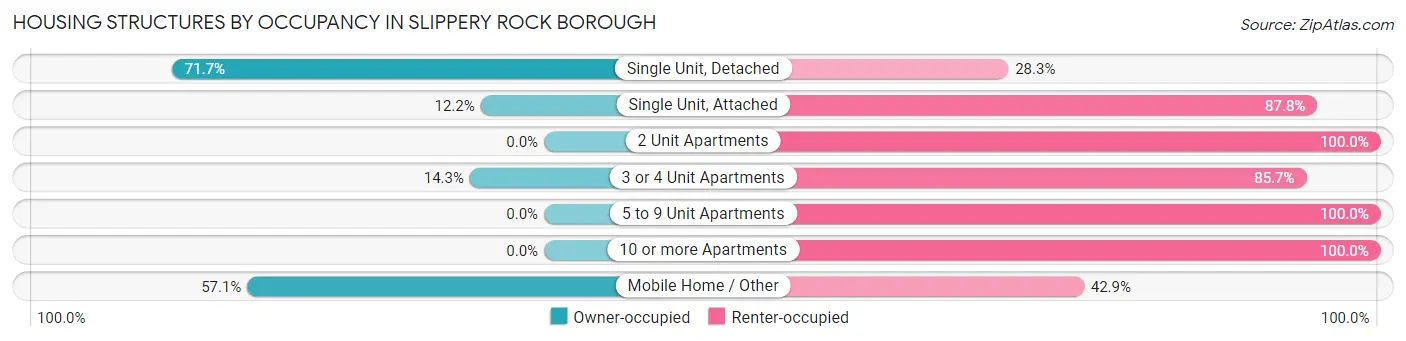
| Structure Type | Owner-occupied | Renter-occupied |
| Single Unit, Detached | 367 (71.7%) | 145 (28.3%) |
| Single Unit, Attached | 16 (12.2%) | 115 (87.8%) |
| 2 Unit Apartments | 0 (0.0%) | 76 (100.0%) |
| 3 or 4 Unit Apartments | 7 (14.3%) | 42 (85.7%) |
| 5 to 9 Unit Apartments | 0 (0.0%) | 138 (100.0%) |
| 10 or more Apartments | 0 (0.0%) | 275 (100.0%) |
| Mobile Home / Other | 8 (57.1%) | 6 (42.9%) |
| Total | 398 (33.3%) | 797 (66.7%) |
Housing Structures by Number of Rooms in Slippery Rock borough
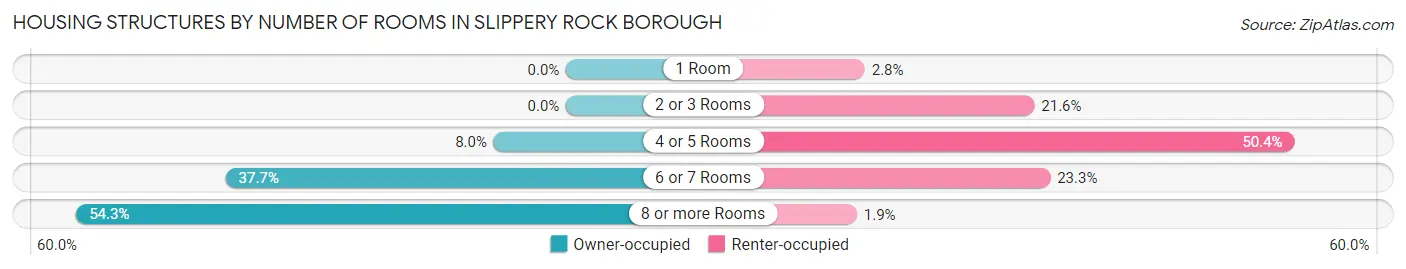
| Number of Rooms | Owner-occupied | Renter-occupied |
| 1 Room | 0 (0.0%) | 22 (2.8%) |
| 2 or 3 Rooms | 0 (0.0%) | 172 (21.6%) |
| 4 or 5 Rooms | 32 (8.0%) | 402 (50.4%) |
| 6 or 7 Rooms | 150 (37.7%) | 186 (23.3%) |
| 8 or more Rooms | 216 (54.3%) | 15 (1.9%) |
| Total | 398 (100.0%) | 797 (100.0%) |
Housing Structure by Heating Type in Slippery Rock borough
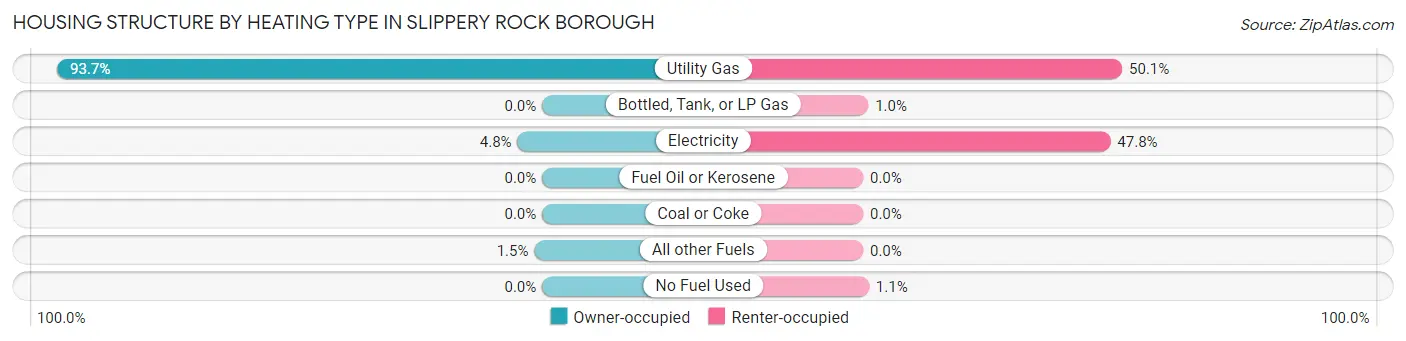
| Heating Type | Owner-occupied | Renter-occupied |
| Utility Gas | 373 (93.7%) | 399 (50.1%) |
| Bottled, Tank, or LP Gas | 0 (0.0%) | 8 (1.0%) |
| Electricity | 19 (4.8%) | 381 (47.8%) |
| Fuel Oil or Kerosene | 0 (0.0%) | 0 (0.0%) |
| Coal or Coke | 0 (0.0%) | 0 (0.0%) |
| All other Fuels | 6 (1.5%) | 0 (0.0%) |
| No Fuel Used | 0 (0.0%) | 9 (1.1%) |
| Total | 398 (100.0%) | 797 (100.0%) |
Household Vehicle Usage in Slippery Rock borough
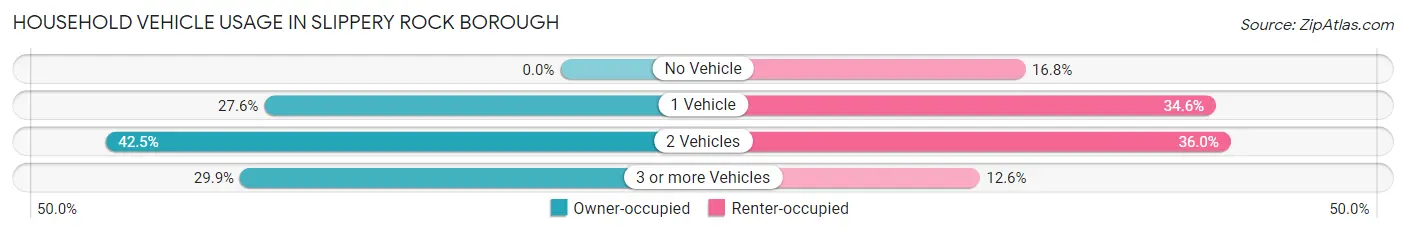
| Vehicles per Household | Owner-occupied | Renter-occupied |
| No Vehicle | 0 (0.0%) | 134 (16.8%) |
| 1 Vehicle | 110 (27.6%) | 276 (34.6%) |
| 2 Vehicles | 169 (42.5%) | 287 (36.0%) |
| 3 or more Vehicles | 119 (29.9%) | 100 (12.6%) |
| Total | 398 (100.0%) | 797 (100.0%) |
Real Estate & Mortgages in Slippery Rock borough
Real Estate and Mortgage Overview in Slippery Rock borough
| Characteristic | Without Mortgage | With Mortgage |
| Housing Units | 156 | 242 |
| Median Property Value | $192,500 | $231,300 |
| Median Household Income | $81,944 | $72 |
| Monthly Housing Costs | $633 | $19 |
| Real Estate Taxes | $2,915 | $0 |
Property Value by Mortgage Status in Slippery Rock borough
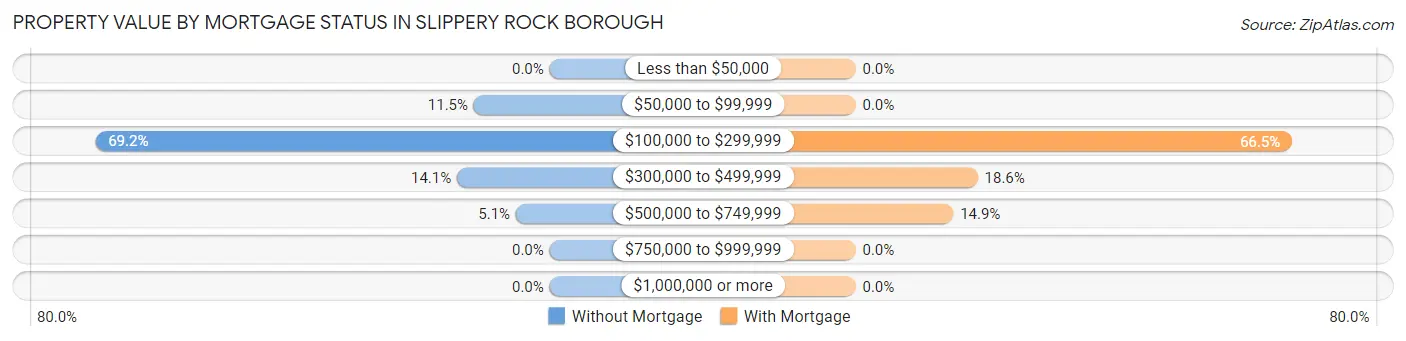
| Property Value | Without Mortgage | With Mortgage |
| Less than $50,000 | 0 (0.0%) | 0 (0.0%) |
| $50,000 to $99,999 | 18 (11.5%) | 0 (0.0%) |
| $100,000 to $299,999 | 108 (69.2%) | 161 (66.5%) |
| $300,000 to $499,999 | 22 (14.1%) | 45 (18.6%) |
| $500,000 to $749,999 | 8 (5.1%) | 36 (14.9%) |
| $750,000 to $999,999 | 0 (0.0%) | 0 (0.0%) |
| $1,000,000 or more | 0 (0.0%) | 0 (0.0%) |
| Total | 156 (100.0%) | 242 (100.0%) |
Household Income by Mortgage Status in Slippery Rock borough
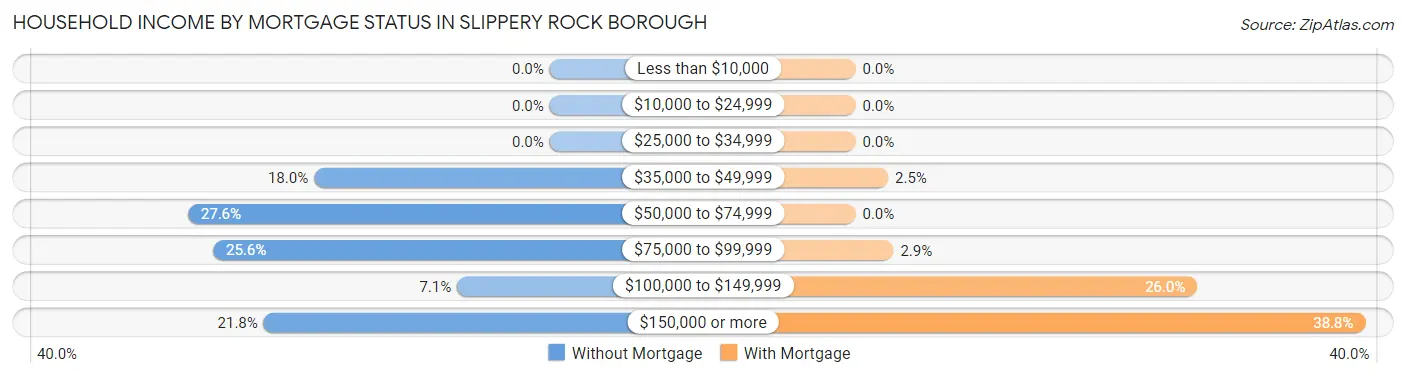
| Household Income | Without Mortgage | With Mortgage |
| Less than $10,000 | 0 (0.0%) | 0 (0.0%) |
| $10,000 to $24,999 | 0 (0.0%) | 0 (0.0%) |
| $25,000 to $34,999 | 0 (0.0%) | 0 (0.0%) |
| $35,000 to $49,999 | 28 (17.9%) | 6 (2.5%) |
| $50,000 to $74,999 | 43 (27.6%) | 0 (0.0%) |
| $75,000 to $99,999 | 40 (25.6%) | 7 (2.9%) |
| $100,000 to $149,999 | 11 (7.0%) | 63 (26.0%) |
| $150,000 or more | 34 (21.8%) | 94 (38.8%) |
| Total | 156 (100.0%) | 242 (100.0%) |
Property Value to Household Income Ratio in Slippery Rock borough
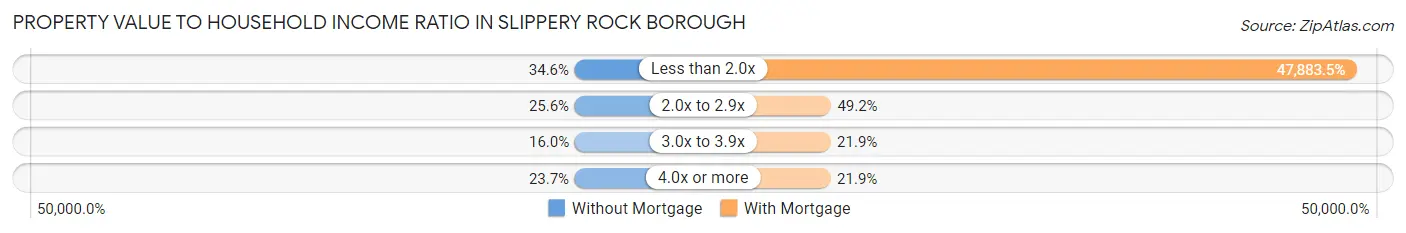
| Value-to-Income Ratio | Without Mortgage | With Mortgage |
| Less than 2.0x | 54 (34.6%) | 115,878 (47,883.5%) |
| 2.0x to 2.9x | 40 (25.6%) | 119 (49.2%) |
| 3.0x to 3.9x | 25 (16.0%) | 53 (21.9%) |
| 4.0x or more | 37 (23.7%) | 53 (21.9%) |
| Total | 156 (100.0%) | 242 (100.0%) |
Real Estate Taxes by Mortgage Status in Slippery Rock borough

| Property Taxes | Without Mortgage | With Mortgage |
| Less than $800 | 0 (0.0%) | 0 (0.0%) |
| $800 to $1,499 | 14 (9.0%) | 0 (0.0%) |
| $800 to $1,499 | 133 (85.3%) | 0 (0.0%) |
| Total | 156 (100.0%) | 242 (100.0%) |
Health & Disability in Slippery Rock borough
Health Insurance Coverage by Age in Slippery Rock borough
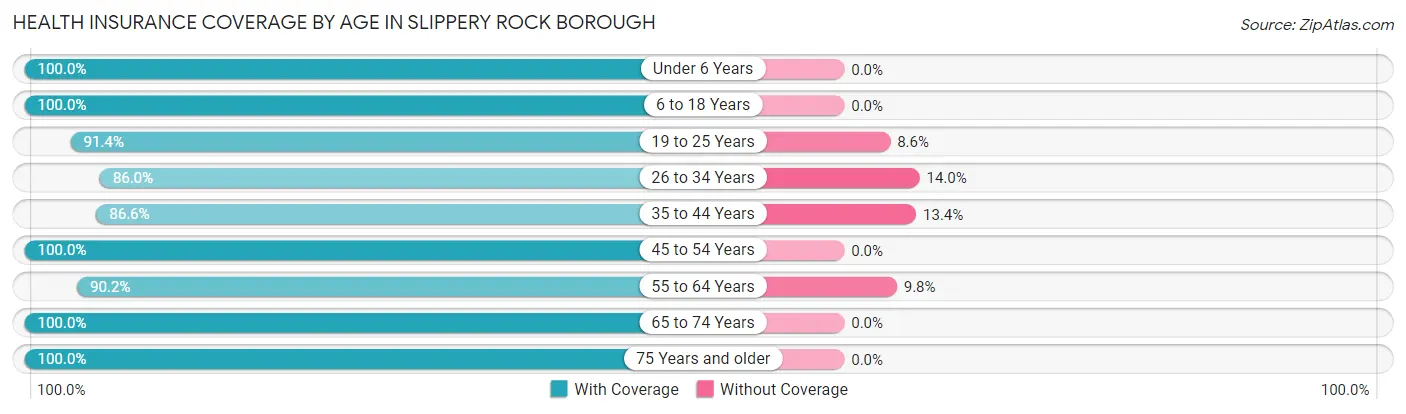
| Age Bracket | With Coverage | Without Coverage |
| Under 6 Years | 110 (100.0%) | 0 (0.0%) |
| 6 to 18 Years | 319 (100.0%) | 0 (0.0%) |
| 19 to 25 Years | 1,430 (91.4%) | 134 (8.6%) |
| 26 to 34 Years | 294 (86.0%) | 48 (14.0%) |
| 35 to 44 Years | 110 (86.6%) | 17 (13.4%) |
| 45 to 54 Years | 178 (100.0%) | 0 (0.0%) |
| 55 to 64 Years | 341 (90.2%) | 37 (9.8%) |
| 65 to 74 Years | 215 (100.0%) | 0 (0.0%) |
| 75 Years and older | 134 (100.0%) | 0 (0.0%) |
| Total | 3,131 (93.0%) | 236 (7.0%) |
Health Insurance Coverage by Citizenship Status in Slippery Rock borough

| Citizenship Status | With Coverage | Without Coverage |
| Native Born | 110 (100.0%) | 0 (0.0%) |
| Foreign Born, Citizen | 319 (100.0%) | 0 (0.0%) |
| Foreign Born, not a Citizen | 1,430 (91.4%) | 134 (8.6%) |
Health Insurance Coverage by Household Income in Slippery Rock borough
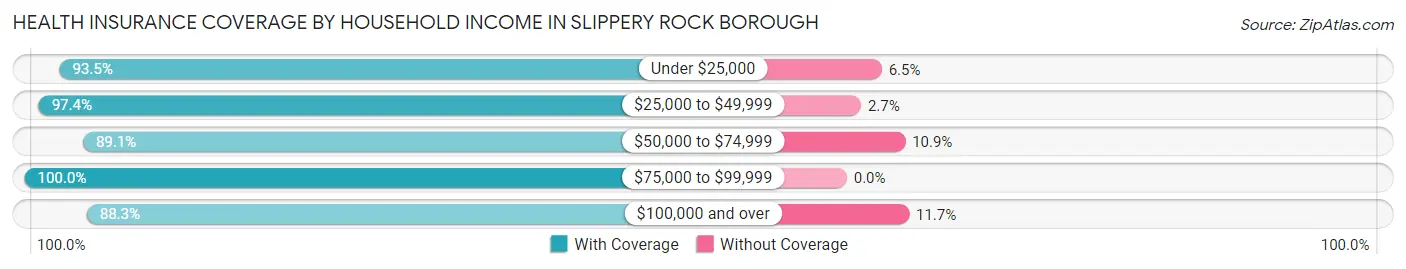
| Household Income | With Coverage | Without Coverage |
| Under $25,000 | 943 (93.5%) | 66 (6.5%) |
| $25,000 to $49,999 | 294 (97.4%) | 8 (2.6%) |
| $50,000 to $74,999 | 293 (89.1%) | 36 (10.9%) |
| $75,000 to $99,999 | 275 (100.0%) | 0 (0.0%) |
| $100,000 and over | 811 (88.3%) | 107 (11.7%) |
Public vs Private Health Insurance Coverage by Age in Slippery Rock borough
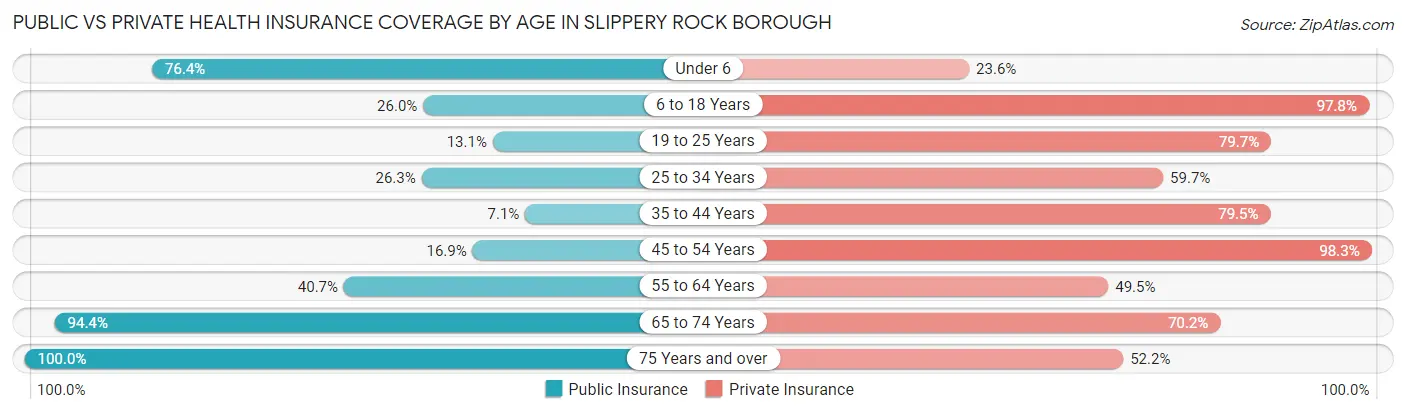
| Age Bracket | Public Insurance | Private Insurance |
| Under 6 | 84 (76.4%) | 26 (23.6%) |
| 6 to 18 Years | 83 (26.0%) | 312 (97.8%) |
| 19 to 25 Years | 205 (13.1%) | 1,246 (79.7%) |
| 25 to 34 Years | 90 (26.3%) | 204 (59.7%) |
| 35 to 44 Years | 9 (7.1%) | 101 (79.5%) |
| 45 to 54 Years | 30 (16.9%) | 175 (98.3%) |
| 55 to 64 Years | 154 (40.7%) | 187 (49.5%) |
| 65 to 74 Years | 203 (94.4%) | 151 (70.2%) |
| 75 Years and over | 134 (100.0%) | 70 (52.2%) |
| Total | 992 (29.5%) | 2,472 (73.4%) |
Disability Status by Sex by Age in Slippery Rock borough
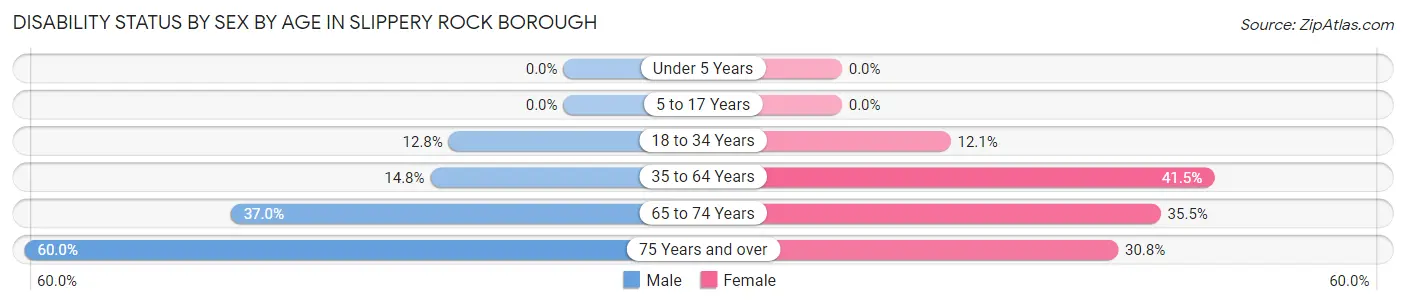
| Age Bracket | Male | Female |
| Under 5 Years | 0 (0.0%) | 0 (0.0%) |
| 5 to 17 Years | 0 (0.0%) | 0 (0.0%) |
| 18 to 34 Years | 124 (12.8%) | 127 (12.1%) |
| 35 to 64 Years | 44 (14.8%) | 160 (41.4%) |
| 65 to 74 Years | 40 (37.0%) | 38 (35.5%) |
| 75 Years and over | 18 (60.0%) | 32 (30.8%) |
Disability Class by Sex by Age in Slippery Rock borough
Disability Class: Hearing Difficulty
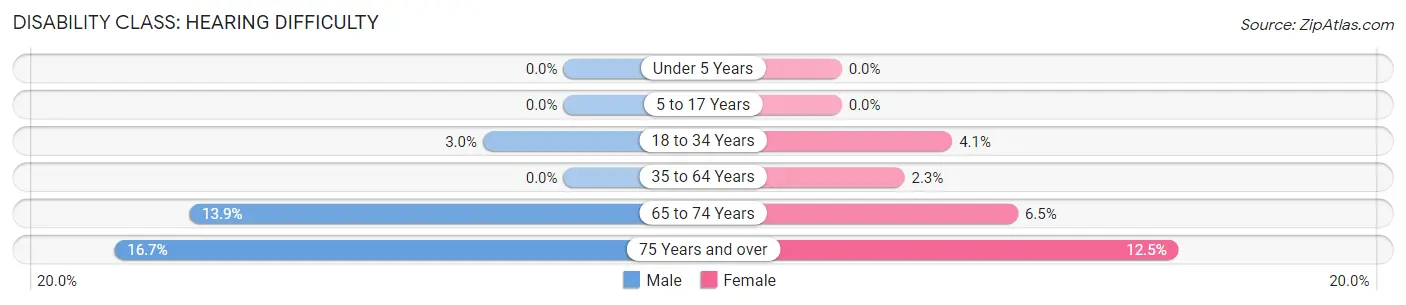
| Age Bracket | Male | Female |
| Under 5 Years | 0 (0.0%) | 0 (0.0%) |
| 5 to 17 Years | 0 (0.0%) | 0 (0.0%) |
| 18 to 34 Years | 29 (3.0%) | 43 (4.1%) |
| 35 to 64 Years | 0 (0.0%) | 9 (2.3%) |
| 65 to 74 Years | 15 (13.9%) | 7 (6.5%) |
| 75 Years and over | 5 (16.7%) | 13 (12.5%) |
Disability Class: Vision Difficulty
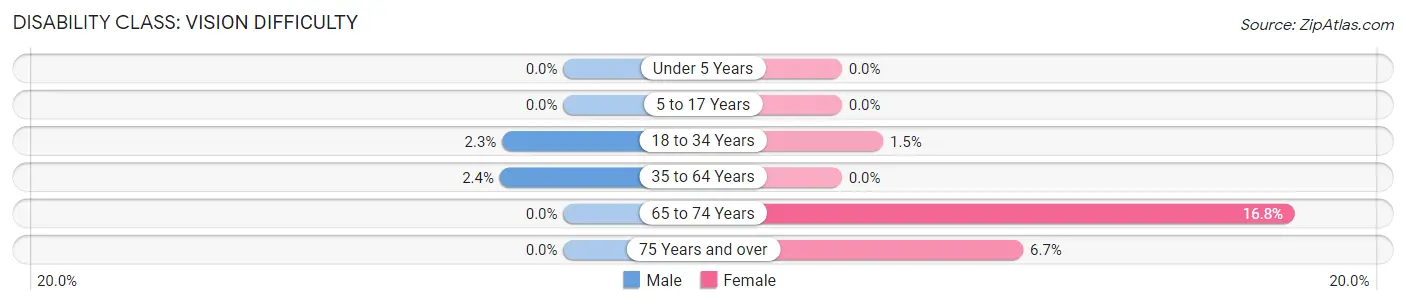
| Age Bracket | Male | Female |
| Under 5 Years | 0 (0.0%) | 0 (0.0%) |
| 5 to 17 Years | 0 (0.0%) | 0 (0.0%) |
| 18 to 34 Years | 22 (2.3%) | 16 (1.5%) |
| 35 to 64 Years | 7 (2.4%) | 0 (0.0%) |
| 65 to 74 Years | 0 (0.0%) | 18 (16.8%) |
| 75 Years and over | 0 (0.0%) | 7 (6.7%) |
Disability Class: Cognitive Difficulty
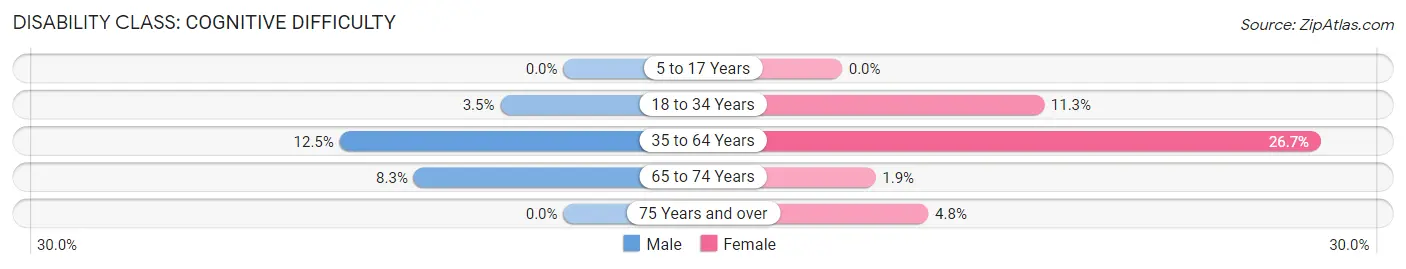
| Age Bracket | Male | Female |
| 5 to 17 Years | 0 (0.0%) | 0 (0.0%) |
| 18 to 34 Years | 34 (3.5%) | 118 (11.3%) |
| 35 to 64 Years | 37 (12.5%) | 103 (26.7%) |
| 65 to 74 Years | 9 (8.3%) | 2 (1.9%) |
| 75 Years and over | 0 (0.0%) | 5 (4.8%) |
Disability Class: Ambulatory Difficulty
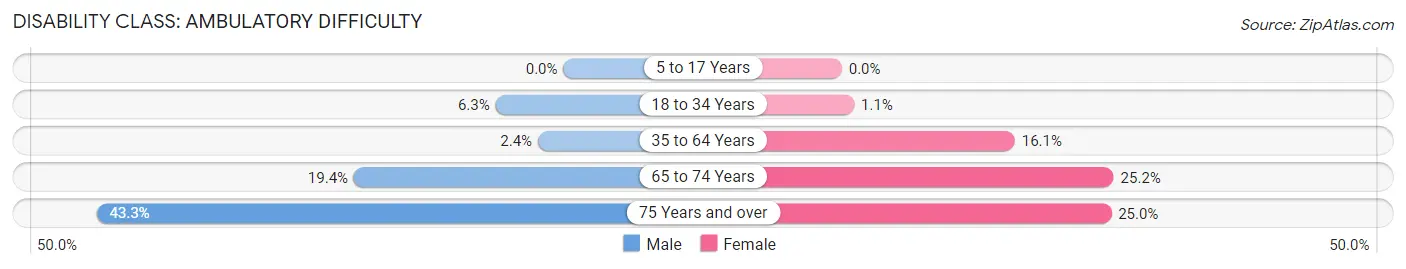
| Age Bracket | Male | Female |
| 5 to 17 Years | 0 (0.0%) | 0 (0.0%) |
| 18 to 34 Years | 61 (6.3%) | 12 (1.1%) |
| 35 to 64 Years | 7 (2.4%) | 62 (16.1%) |
| 65 to 74 Years | 21 (19.4%) | 27 (25.2%) |
| 75 Years and over | 13 (43.3%) | 26 (25.0%) |
Disability Class: Self-Care Difficulty
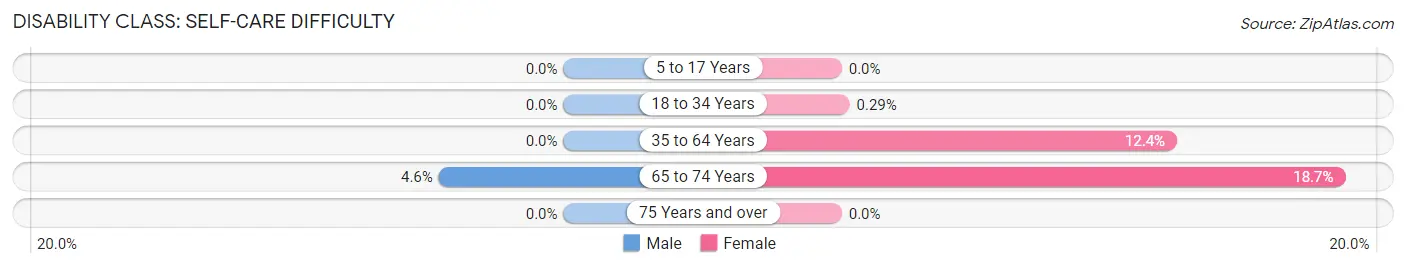
| Age Bracket | Male | Female |
| 5 to 17 Years | 0 (0.0%) | 0 (0.0%) |
| 18 to 34 Years | 0 (0.0%) | 3 (0.3%) |
| 35 to 64 Years | 0 (0.0%) | 48 (12.4%) |
| 65 to 74 Years | 5 (4.6%) | 20 (18.7%) |
| 75 Years and over | 0 (0.0%) | 0 (0.0%) |
Technology Access in Slippery Rock borough
Computing Device Access in Slippery Rock borough
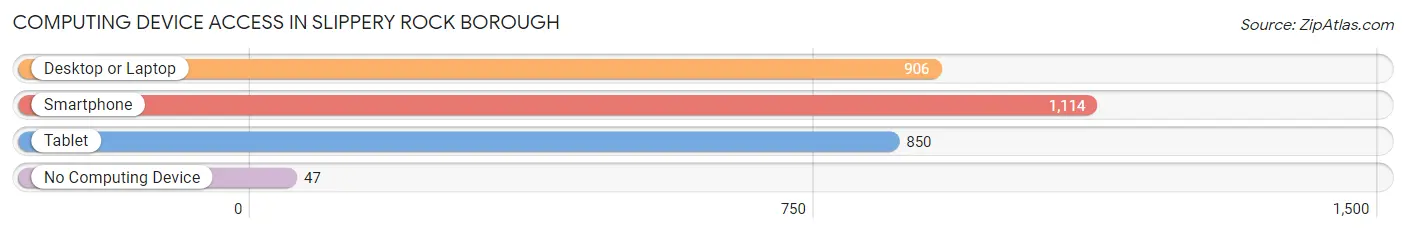
| Device Type | # Households | % Households |
| Desktop or Laptop | 906 | 75.8% |
| Smartphone | 1,114 | 93.2% |
| Tablet | 850 | 71.1% |
| No Computing Device | 47 | 3.9% |
| Total | 1,195 | 100.0% |
Internet Access in Slippery Rock borough
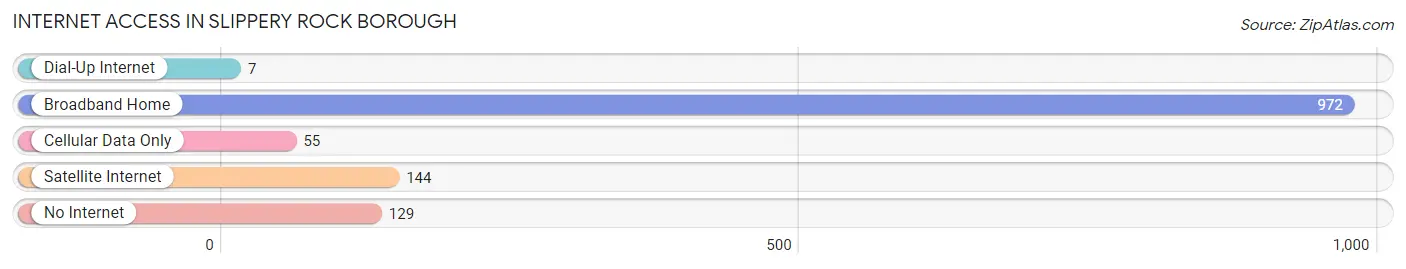
| Internet Type | # Households | % Households |
| Dial-Up Internet | 7 | 0.6% |
| Broadband Home | 972 | 81.3% |
| Cellular Data Only | 55 | 4.6% |
| Satellite Internet | 144 | 12.0% |
| No Internet | 129 | 10.8% |
| Total | 1,195 | 100.0% |
Slippery Rock borough Summary
Slippery Rock Borough is a small borough located in Butler County, Pennsylvania. It is situated in the foothills of the Allegheny Mountains, approximately 30 miles north of Pittsburgh. The borough is home to approximately 2,500 people and is part of the Slippery Rock Township.
History
The area that is now Slippery Rock Borough was first settled in the late 1700s by a group of Scots-Irish immigrants. The town was originally known as “Slippery Rock” due to the slippery rocks that were found in the nearby creek. The town was officially incorporated in 1836 and was named after the creek.
In the late 1800s, the town began to grow and prosper due to the development of the railroad. The railroad allowed for the transportation of goods and people to and from the town. This led to the development of several businesses, including a flour mill, a sawmill, and a tannery.
The town continued to grow and prosper throughout the early 1900s. In the 1920s, the town was home to several factories, including a glass factory, a brick factory, and a paper mill. The town also had several stores, a bank, and a post office.
Geography
Slippery Rock Borough is located in the foothills of the Allegheny Mountains. The borough is situated on the banks of Slippery Rock Creek, which is a tributary of the Beaver River. The borough is surrounded by Slippery Rock Township to the north, east, and south, and by the borough of Harmony to the west.
The borough has a total area of 1.2 square miles, all of which is land. The borough is located at an elevation of 1,068 feet above sea level. The climate in the area is classified as humid continental, with cold winters and warm summers.
Economy
The economy of Slippery Rock Borough is largely based on tourism and education. The borough is home to Slippery Rock University, which is a public university that enrolls over 8,000 students. The university is the largest employer in the borough and provides jobs for many of the residents.
The borough is also home to several small businesses, including restaurants, shops, and other services. The borough also has several parks and recreational areas, which attract visitors from all over the region.
Demographics
As of the 2010 census, the population of Slippery Rock Borough was 2,521. The racial makeup of the borough was 97.2% White, 0.9% African American, 0.3% Native American, 0.4% Asian, 0.1% Pacific Islander, 0.2% from other races, and 0.9% from two or more races. Hispanic or Latino of any race were 0.9% of the population.
The median household income in the borough was $41,944, and the median family income was $50,938. The per capita income for the borough was $20,845. About 8.3% of families and 11.2% of the population were below the poverty line, including 15.2% of those under age 18 and 5.2% of those age 65 or over.
Common Questions
What is Per Capita Income in Slippery Rock borough?
Per Capita income in Slippery Rock borough is $24,967.
What is the Median Family Income in Slippery Rock borough?
Median Family Income in Slippery Rock borough is $93,224.
What is the Median Household income in Slippery Rock borough?
Median Household Income in Slippery Rock borough is $44,447.
What is Income or Wage Gap in Slippery Rock borough?
Income or Wage Gap in Slippery Rock borough is 41.8%.
Women in Slippery Rock borough earn 58.2 cents for every dollar earned by a man.
What is Inequality or Gini Index in Slippery Rock borough?
Inequality or Gini Index in Slippery Rock borough is 0.53.
What is the Total Population of Slippery Rock borough?
Total Population of Slippery Rock borough is 3,367.
What is the Total Male Population of Slippery Rock borough?
Total Male Population of Slippery Rock borough is 1,582.
What is the Total Female Population of Slippery Rock borough?
Total Female Population of Slippery Rock borough is 1,785.
What is the Ratio of Males per 100 Females in Slippery Rock borough?
There are 88.63 Males per 100 Females in Slippery Rock borough.
What is the Ratio of Females per 100 Males in Slippery Rock borough?
There are 112.83 Females per 100 Males in Slippery Rock borough.
What is the Median Population Age in Slippery Rock borough?
Median Population Age in Slippery Rock borough is 23.2 Years.
What is the Average Family Size in Slippery Rock borough
Average Family Size in Slippery Rock borough is 2.9 People.
What is the Average Household Size in Slippery Rock borough
Average Household Size in Slippery Rock borough is 2.4 People.
How Large is the Labor Force in Slippery Rock borough?
There are 1,601 People in the Labor Forcein in Slippery Rock borough.
What is the Percentage of People in the Labor Force in Slippery Rock borough?
52.0% of People are in the Labor Force in Slippery Rock borough.
What is the Unemployment Rate in Slippery Rock borough?
Unemployment Rate in Slippery Rock borough is 4.9%.