Cities with the Highest Percentage of Population Employed in Utilities in Tennessee
RELATED REPORTS & OPTIONS
Utilities
Tennessee
Compare Cities
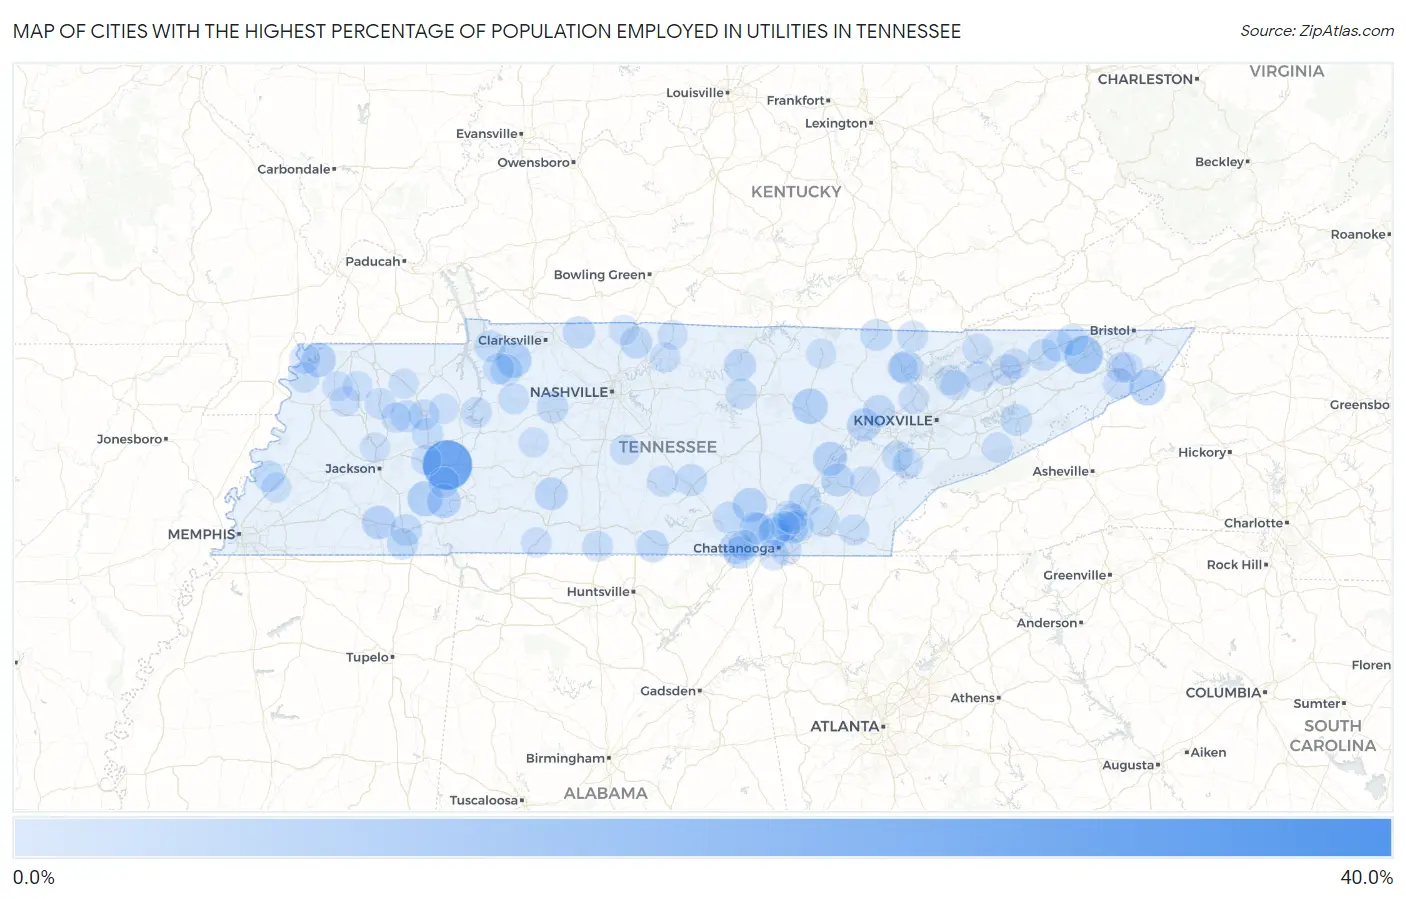
Map of Cities with the Highest Percentage of Population Employed in Utilities in Tennessee
0.0%
40.0%
Cities with the Highest Percentage of Population Employed in Utilities in Tennessee
| City | % Employed | vs State | vs National | |
| 1. | Belvidere | 37.5% | 0.91%(+36.6)#1 | 0.84%(+36.7)#57 |
| 2. | Darden | 27.3% | 0.91%(+26.4)#2 | 0.84%(+26.5)#99 |
| 3. | Dellrose | 21.6% | 0.91%(+20.7)#3 | 0.84%(+20.8)#149 |
| 4. | Fall Branch | 12.2% | 0.91%(+11.3)#4 | 0.84%(+11.4)#393 |
| 5. | Randolph | 9.6% | 0.91%(+8.70)#5 | 0.84%(+8.78)#562 |
| 6. | Roan Mountain | 9.2% | 0.91%(+8.27)#6 | 0.84%(+8.34)#594 |
| 7. | Cumberland City | 8.7% | 0.91%(+7.74)#7 | 0.84%(+7.82)#647 |
| 8. | Bowman | 8.6% | 0.91%(+7.71)#8 | 0.84%(+7.78)#652 |
| 9. | Enville | 8.3% | 0.91%(+7.42)#9 | 0.84%(+7.50)#686 |
| 10. | Samburg | 7.1% | 0.91%(+6.23)#10 | 0.84%(+6.31)#833 |
| 11. | Palmer | 7.1% | 0.91%(+6.19)#11 | 0.84%(+6.26)#844 |
| 12. | Spring City | 6.8% | 0.91%(+5.91)#12 | 0.84%(+5.98)#895 |
| 13. | Jacksboro | 6.8% | 0.91%(+5.87)#13 | 0.84%(+5.94)#903 |
| 14. | Saltillo | 6.7% | 0.91%(+5.75)#14 | 0.84%(+5.83)#932 |
| 15. | Hornsby | 6.6% | 0.91%(+5.65)#15 | 0.84%(+5.72)#965 |
| 16. | Hampton | 6.5% | 0.91%(+5.58)#16 | 0.84%(+5.65)#982 |
| 17. | Harriman | 5.8% | 0.91%(+4.92)#17 | 0.84%(+4.99)#1,154 |
| 18. | Decatur | 5.6% | 0.91%(+4.69)#18 | 0.84%(+4.77)#1,227 |
| 19. | Summertown | 5.2% | 0.91%(+4.31)#19 | 0.84%(+4.38)#1,362 |
| 20. | Kimball | 5.1% | 0.91%(+4.22)#20 | 0.84%(+4.29)#1,405 |
| 21. | Sale Creek | 5.1% | 0.91%(+4.20)#21 | 0.84%(+4.28)#1,414 |
| 22. | Norene | 4.9% | 0.91%(+4.03)#22 | 0.84%(+4.10)#1,496 |
| 23. | New Hope | 4.8% | 0.91%(+3.86)#23 | 0.84%(+3.94)#1,565 |
| 24. | Gainesboro | 4.7% | 0.91%(+3.81)#24 | 0.84%(+3.88)#1,595 |
| 25. | New Deal | 4.6% | 0.91%(+3.72)#25 | 0.84%(+3.79)#1,647 |
| 26. | Adams | 4.6% | 0.91%(+3.65)#26 | 0.84%(+3.72)#1,685 |
| 27. | Coalfield | 4.6% | 0.91%(+3.65)#27 | 0.84%(+3.72)#1,686 |
| 28. | Flintville | 4.5% | 0.91%(+3.63)#28 | 0.84%(+3.71)#1,698 |
| 29. | Lakesite | 4.5% | 0.91%(+3.62)#29 | 0.84%(+3.69)#1,711 |
| 30. | New Union | 4.5% | 0.91%(+3.54)#30 | 0.84%(+3.61)#1,759 |
| 31. | Rogersville | 4.4% | 0.91%(+3.52)#31 | 0.84%(+3.60)#1,766 |
| 32. | Fairmount | 4.4% | 0.91%(+3.47)#32 | 0.84%(+3.54)#1,800 |
| 33. | Middle Valley | 4.3% | 0.91%(+3.41)#33 | 0.84%(+3.48)#1,841 |
| 34. | Powells Crossroads | 4.3% | 0.91%(+3.36)#34 | 0.84%(+3.44)#1,862 |
| 35. | Signal Mountain | 4.2% | 0.91%(+3.28)#35 | 0.84%(+3.36)#1,906 |
| 36. | Winfield | 4.2% | 0.91%(+3.25)#36 | 0.84%(+3.32)#1,938 |
| 37. | Selmer | 4.1% | 0.91%(+3.23)#37 | 0.84%(+3.30)#1,949 |
| 38. | Mclemoresville | 4.1% | 0.91%(+3.23)#38 | 0.84%(+3.30)#1,950 |
| 39. | Burns | 4.0% | 0.91%(+3.07)#39 | 0.84%(+3.15)#2,053 |
| 40. | Dover | 3.9% | 0.91%(+2.95)#40 | 0.84%(+3.02)#2,144 |
| 41. | Newport | 3.9% | 0.91%(+2.95)#41 | 0.84%(+3.02)#2,145 |
| 42. | Erin | 3.8% | 0.91%(+2.93)#42 | 0.84%(+3.01)#2,152 |
| 43. | Tracy City | 3.8% | 0.91%(+2.90)#43 | 0.84%(+2.98)#2,180 |
| 44. | Whitwell | 3.8% | 0.91%(+2.90)#44 | 0.84%(+2.97)#2,182 |
| 45. | Ramer | 3.7% | 0.91%(+2.79)#45 | 0.84%(+2.87)#2,284 |
| 46. | Hopewell | 3.6% | 0.91%(+2.72)#46 | 0.84%(+2.80)#2,342 |
| 47. | Surgoinsville | 3.6% | 0.91%(+2.69)#47 | 0.84%(+2.77)#2,360 |
| 48. | Church Hill | 3.6% | 0.91%(+2.68)#48 | 0.84%(+2.76)#2,376 |
| 49. | Clarksburg | 3.6% | 0.91%(+2.66)#49 | 0.84%(+2.73)#2,387 |
| 50. | Tennessee Ridge | 3.5% | 0.91%(+2.62)#50 | 0.84%(+2.70)#2,417 |
| 51. | Tellico Village | 3.4% | 0.91%(+2.46)#51 | 0.84%(+2.53)#2,573 |
| 52. | Burlison | 3.3% | 0.91%(+2.42)#52 | 0.84%(+2.50)#2,607 |
| 53. | Bradford | 3.3% | 0.91%(+2.37)#53 | 0.84%(+2.45)#2,659 |
| 54. | Mowbray Mountain | 3.3% | 0.91%(+2.34)#54 | 0.84%(+2.41)#2,697 |
| 55. | Wartrace | 3.2% | 0.91%(+2.31)#55 | 0.84%(+2.39)#2,718 |
| 56. | Baxter | 3.1% | 0.91%(+2.21)#56 | 0.84%(+2.29)#2,807 |
| 57. | Bean Station | 3.0% | 0.91%(+2.13)#57 | 0.84%(+2.20)#2,901 |
| 58. | Benton | 3.0% | 0.91%(+2.06)#58 | 0.84%(+2.13)#2,990 |
| 59. | Unicoi | 2.9% | 0.91%(+2.00)#59 | 0.84%(+2.08)#3,050 |
| 60. | New Johnsonville | 2.9% | 0.91%(+1.99)#60 | 0.84%(+2.07)#3,065 |
| 61. | Mcewen | 2.9% | 0.91%(+1.98)#61 | 0.84%(+2.06)#3,080 |
| 62. | Huntingdon | 2.9% | 0.91%(+1.96)#62 | 0.84%(+2.03)#3,106 |
| 63. | Jellico | 2.8% | 0.91%(+1.93)#63 | 0.84%(+2.01)#3,143 |
| 64. | Greenback | 2.8% | 0.91%(+1.92)#64 | 0.84%(+2.00)#3,157 |
| 65. | Elkton | 2.8% | 0.91%(+1.87)#65 | 0.84%(+1.94)#3,228 |
| 66. | Ridgely | 2.8% | 0.91%(+1.86)#66 | 0.84%(+1.94)#3,241 |
| 67. | Jasper | 2.7% | 0.91%(+1.83)#67 | 0.84%(+1.91)#3,287 |
| 68. | Soddy Daisy | 2.7% | 0.91%(+1.81)#68 | 0.84%(+1.89)#3,312 |
| 69. | Scotts Hill | 2.7% | 0.91%(+1.77)#69 | 0.84%(+1.84)#3,374 |
| 70. | Castalian Springs | 2.6% | 0.91%(+1.69)#70 | 0.84%(+1.76)#3,499 |
| 71. | Ridgeside | 2.6% | 0.91%(+1.68)#71 | 0.84%(+1.75)#3,518 |
| 72. | Elizabethton | 2.6% | 0.91%(+1.68)#72 | 0.84%(+1.75)#3,521 |
| 73. | Lookout Mountain | 2.5% | 0.91%(+1.60)#73 | 0.84%(+1.68)#3,631 |
| 74. | Tiptonville | 2.5% | 0.91%(+1.54)#74 | 0.84%(+1.62)#3,730 |
| 75. | Yorkville | 2.4% | 0.91%(+1.53)#75 | 0.84%(+1.60)#3,753 |
| 76. | Central | 2.4% | 0.91%(+1.49)#76 | 0.84%(+1.57)#3,818 |
| 77. | Lexington | 2.4% | 0.91%(+1.49)#77 | 0.84%(+1.56)#3,829 |
| 78. | Atwood | 2.4% | 0.91%(+1.48)#78 | 0.84%(+1.55)#3,840 |
| 79. | Rutledge | 2.4% | 0.91%(+1.45)#79 | 0.84%(+1.53)#3,875 |
| 80. | Maynardville | 2.3% | 0.91%(+1.42)#80 | 0.84%(+1.50)#3,952 |
| 81. | Mooresburg | 2.3% | 0.91%(+1.41)#81 | 0.84%(+1.48)#3,976 |
| 82. | Niota | 2.3% | 0.91%(+1.34)#82 | 0.84%(+1.42)#4,090 |
| 83. | Clinton | 2.3% | 0.91%(+1.34)#83 | 0.84%(+1.42)#4,091 |
| 84. | Eagleville | 2.2% | 0.91%(+1.33)#84 | 0.84%(+1.41)#4,107 |
| 85. | Pittman Center | 2.2% | 0.91%(+1.32)#85 | 0.84%(+1.39)#4,137 |
| 86. | Loretto | 2.2% | 0.91%(+1.31)#86 | 0.84%(+1.38)#4,164 |
| 87. | Tazewell | 2.2% | 0.91%(+1.28)#87 | 0.84%(+1.35)#4,218 |
| 88. | Caryville | 2.1% | 0.91%(+1.22)#88 | 0.84%(+1.29)#4,356 |
| 89. | Orlinda | 2.1% | 0.91%(+1.19)#89 | 0.84%(+1.27)#4,408 |
| 90. | Centerville | 2.1% | 0.91%(+1.19)#90 | 0.84%(+1.26)#4,418 |
| 91. | Falling Water | 2.1% | 0.91%(+1.17)#91 | 0.84%(+1.25)#4,448 |
| 92. | Trimble | 2.1% | 0.91%(+1.17)#92 | 0.84%(+1.25)#4,452 |
| 93. | Three Way | 2.1% | 0.91%(+1.16)#93 | 0.84%(+1.23)#4,483 |
| 94. | Jamestown | 2.1% | 0.91%(+1.16)#94 | 0.84%(+1.23)#4,484 |
| 95. | Kenton | 2.1% | 0.91%(+1.15)#95 | 0.84%(+1.22)#4,503 |
| 96. | Gleason | 2.1% | 0.91%(+1.15)#96 | 0.84%(+1.22)#4,511 |
| 97. | Bruceton | 2.1% | 0.91%(+1.14)#97 | 0.84%(+1.21)#4,538 |
| 98. | Brighton | 2.0% | 0.91%(+1.05)#98 | 0.84%(+1.13)#4,732 |
| 99. | Luttrell | 1.9% | 0.91%(+0.940)#99 | 0.84%(+1.01)#5,020 |
| 100. | Westmoreland | 1.8% | 0.91%(+0.934)#100 | 0.84%(+1.01)#5,041 |
Common Questions
What are the Top 10 Cities with the Highest Percentage of Population Employed in Utilities in Tennessee?
Top 10 Cities with the Highest Percentage of Population Employed in Utilities in Tennessee are:
#1
27.3%
#2
12.2%
#3
9.2%
#4
8.7%
#5
8.6%
#6
8.3%
#7
7.1%
#8
7.1%
#9
6.8%
#10
6.8%
What city has the Highest Percentage of Population Employed in Utilities in Tennessee?
Darden has the Highest Percentage of Population Employed in Utilities in Tennessee with 27.3%.
What is the Percentage of Population Employed in Utilities in the State of Tennessee?
Percentage of Population Employed in Utilities in Tennessee is 0.91%.
What is the Percentage of Population Employed in Utilities in the United States?
Percentage of Population Employed in Utilities in the United States is 0.84%.