Cities with the Highest Percentage of Population Employed in Utilities in West Virginia
RELATED REPORTS & OPTIONS
Utilities
West Virginia
Compare Cities
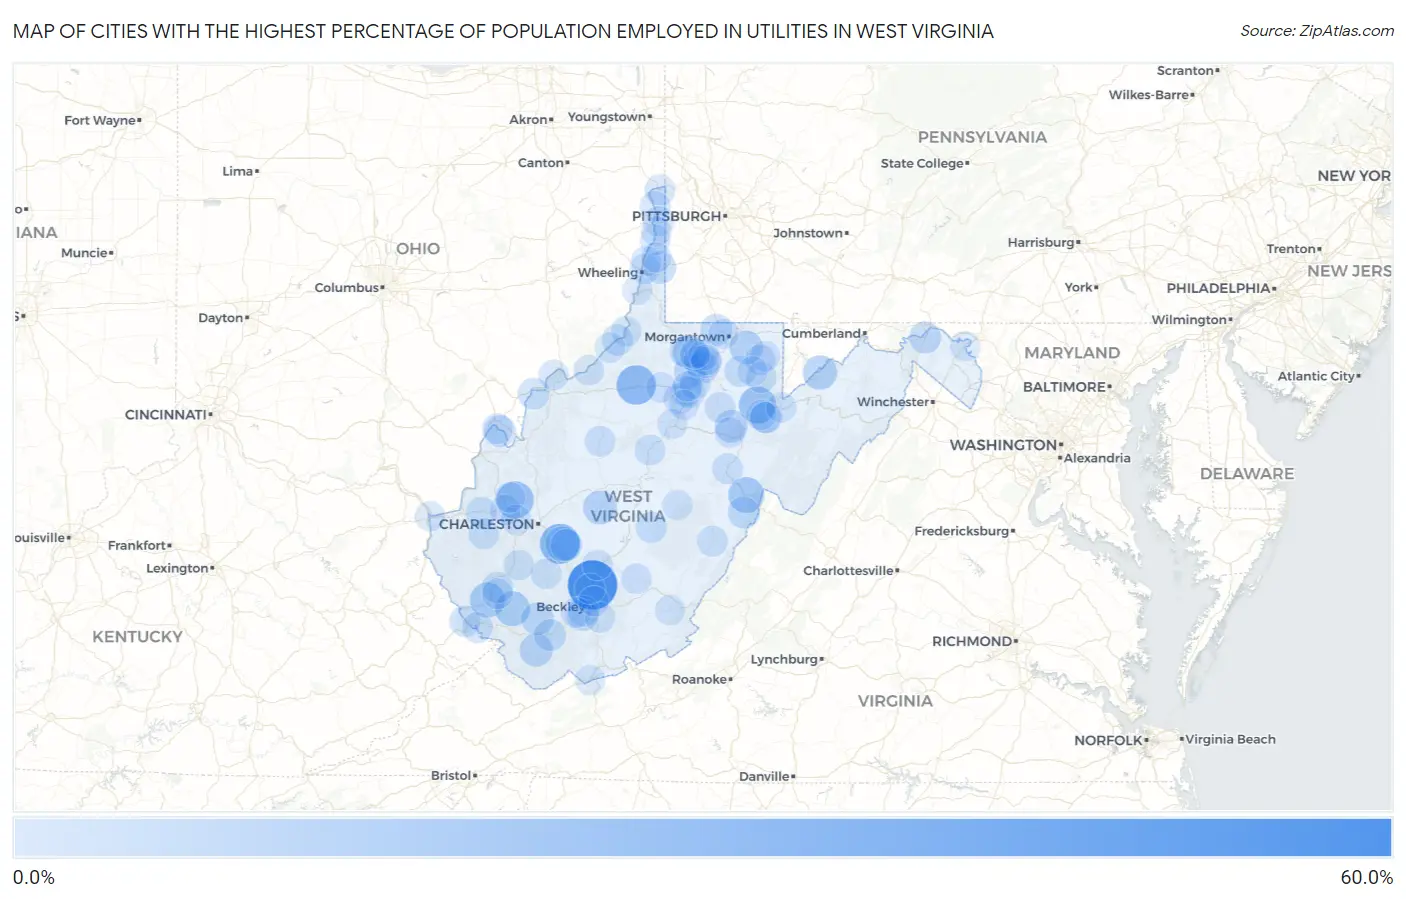
Map of Cities with the Highest Percentage of Population Employed in Utilities in West Virginia
0.0%
60.0%
Cities with the Highest Percentage of Population Employed in Utilities in West Virginia
| City | % Employed | vs State | vs National | |
| 1. | Glen Jean | 58.1% | 1.7%(+56.4)#1 | 0.84%(+57.2)#21 |
| 2. | East Bank | 29.8% | 1.7%(+28.1)#2 | 0.84%(+28.9)#84 |
| 3. | West Union | 27.5% | 1.7%(+25.8)#3 | 0.84%(+26.7)#98 |
| 4. | Bancroft | 21.6% | 1.7%(+19.9)#4 | 0.84%(+20.8)#148 |
| 5. | St George | 21.6% | 1.7%(+19.9)#5 | 0.84%(+20.7)#150 |
| 6. | Frank | 17.0% | 1.7%(+15.3)#6 | 0.84%(+16.2)#226 |
| 7. | Reynoldsville | 15.6% | 1.7%(+13.9)#7 | 0.84%(+14.7)#266 |
| 8. | Holden | 15.2% | 1.7%(+13.5)#8 | 0.84%(+14.4)#277 |
| 9. | Kistler | 14.9% | 1.7%(+13.2)#9 | 0.84%(+14.1)#290 |
| 10. | Glasgow | 13.8% | 1.7%(+12.1)#10 | 0.84%(+13.0)#332 |
| 11. | Rachel | 12.7% | 1.7%(+11.0)#11 | 0.84%(+11.8)#373 |
| 12. | Elk Garden | 12.7% | 1.7%(+11.0)#12 | 0.84%(+11.8)#374 |
| 13. | Clay | 11.5% | 1.7%(+9.87)#13 | 0.84%(+10.7)#434 |
| 14. | Masontown | 10.5% | 1.7%(+8.85)#14 | 0.84%(+9.69)#485 |
| 15. | Davy | 9.5% | 1.7%(+7.85)#15 | 0.84%(+8.69)#573 |
| 16. | Belington | 8.6% | 1.7%(+6.94)#16 | 0.84%(+7.77)#657 |
| 17. | Oceana | 8.1% | 1.7%(+6.43)#17 | 0.84%(+7.27)#708 |
| 18. | Clifton | 8.0% | 1.7%(+6.30)#18 | 0.84%(+7.13)#733 |
| 19. | Valley Grove | 7.4% | 1.7%(+5.75)#19 | 0.84%(+6.59)#806 |
| 20. | Shinnston | 7.2% | 1.7%(+5.51)#20 | 0.84%(+6.35)#831 |
| 21. | White Hall | 7.0% | 1.7%(+5.32)#21 | 0.84%(+6.15)#862 |
| 22. | Bath Berkeley Springs | 6.7% | 1.7%(+4.99)#22 | 0.84%(+5.83)#931 |
| 23. | Green Bank | 6.2% | 1.7%(+4.58)#23 | 0.84%(+5.41)#1,039 |
| 24. | Cassville | 6.2% | 1.7%(+4.53)#24 | 0.84%(+5.36)#1,052 |
| 25. | Pineville | 5.9% | 1.7%(+4.21)#25 | 0.84%(+5.05)#1,134 |
| 26. | Sophia | 5.8% | 1.7%(+4.17)#26 | 0.84%(+5.01)#1,145 |
| 27. | Pratt | 5.8% | 1.7%(+4.13)#27 | 0.84%(+4.97)#1,161 |
| 28. | New Haven | 5.7% | 1.7%(+4.06)#28 | 0.84%(+4.89)#1,191 |
| 29. | Hendricks | 5.7% | 1.7%(+4.01)#29 | 0.84%(+4.84)#1,206 |
| 30. | Washington | 5.4% | 1.7%(+3.68)#30 | 0.84%(+4.52)#1,302 |
| 31. | Booth | 4.7% | 1.7%(+3.06)#31 | 0.84%(+3.90)#1,590 |
| 32. | Mitchell Heights | 4.7% | 1.7%(+3.04)#32 | 0.84%(+3.87)#1,598 |
| 33. | Newburg | 4.4% | 1.7%(+2.71)#33 | 0.84%(+3.55)#1,794 |
| 34. | Craigsville | 4.2% | 1.7%(+2.56)#34 | 0.84%(+3.40)#1,882 |
| 35. | Crab Orchard | 3.9% | 1.7%(+2.23)#35 | 0.84%(+3.07)#2,113 |
| 36. | Williamson | 3.9% | 1.7%(+2.20)#36 | 0.84%(+3.04)#2,134 |
| 37. | Milton | 3.8% | 1.7%(+2.14)#37 | 0.84%(+2.98)#2,181 |
| 38. | Paden City | 3.8% | 1.7%(+2.09)#38 | 0.84%(+2.93)#2,221 |
| 39. | Idamay | 3.6% | 1.7%(+1.94)#39 | 0.84%(+2.77)#2,357 |
| 40. | Marlinton | 3.6% | 1.7%(+1.91)#40 | 0.84%(+2.74)#2,383 |
| 41. | Rowlesburg | 3.6% | 1.7%(+1.88)#41 | 0.84%(+2.72)#2,404 |
| 42. | Mannington | 3.5% | 1.7%(+1.82)#42 | 0.84%(+2.65)#2,453 |
| 43. | Hamlin | 3.5% | 1.7%(+1.80)#43 | 0.84%(+2.63)#2,480 |
| 44. | Monongah | 3.4% | 1.7%(+1.72)#44 | 0.84%(+2.55)#2,548 |
| 45. | Matewan | 3.3% | 1.7%(+1.66)#45 | 0.84%(+2.50)#2,606 |
| 46. | West Logan | 3.3% | 1.7%(+1.64)#46 | 0.84%(+2.47)#2,629 |
| 47. | Stonewood | 3.3% | 1.7%(+1.63)#47 | 0.84%(+2.47)#2,632 |
| 48. | Pleasant Valley | 3.3% | 1.7%(+1.61)#48 | 0.84%(+2.45)#2,652 |
| 49. | Mill Creek | 3.2% | 1.7%(+1.56)#49 | 0.84%(+2.40)#2,712 |
| 50. | Philippi | 3.2% | 1.7%(+1.51)#50 | 0.84%(+2.34)#2,762 |
| 51. | Burnsville | 3.1% | 1.7%(+1.40)#51 | 0.84%(+2.24)#2,863 |
| 52. | Hambleton | 3.0% | 1.7%(+1.36)#52 | 0.84%(+2.19)#2,917 |
| 53. | Nutter Fort | 3.0% | 1.7%(+1.34)#53 | 0.84%(+2.18)#2,933 |
| 54. | West Milford | 2.9% | 1.7%(+1.21)#54 | 0.84%(+2.05)#3,084 |
| 55. | Lester | 2.9% | 1.7%(+1.18)#55 | 0.84%(+2.02)#3,120 |
| 56. | Kingwood | 2.8% | 1.7%(+1.13)#56 | 0.84%(+1.97)#3,197 |
| 57. | Grantsville | 2.8% | 1.7%(+1.10)#57 | 0.84%(+1.94)#3,232 |
| 58. | Bridgeport | 2.7% | 1.7%(+1.02)#58 | 0.84%(+1.86)#3,358 |
| 59. | St Albans | 2.6% | 1.7%(+0.974)#59 | 0.84%(+1.81)#3,430 |
| 60. | Barrackville | 2.6% | 1.7%(+0.949)#60 | 0.84%(+1.79)#3,474 |
| 61. | Chester | 2.6% | 1.7%(+0.935)#61 | 0.84%(+1.77)#3,487 |
| 62. | Shady Spring | 2.6% | 1.7%(+0.916)#62 | 0.84%(+1.75)#3,515 |
| 63. | Rainelle | 2.6% | 1.7%(+0.901)#63 | 0.84%(+1.74)#3,543 |
| 64. | New Cumberland | 2.5% | 1.7%(+0.865)#64 | 0.84%(+1.70)#3,596 |
| 65. | Salem | 2.5% | 1.7%(+0.857)#65 | 0.84%(+1.69)#3,606 |
| 66. | Sylvester | 2.5% | 1.7%(+0.827)#66 | 0.84%(+1.66)#3,664 |
| 67. | Fairmont | 2.4% | 1.7%(+0.769)#67 | 0.84%(+1.61)#3,746 |
| 68. | Junior | 2.3% | 1.7%(+0.652)#68 | 0.84%(+1.49)#3,960 |
| 69. | Teays Valley | 2.3% | 1.7%(+0.647)#69 | 0.84%(+1.48)#3,974 |
| 70. | Mount Hope | 2.2% | 1.7%(+0.521)#70 | 0.84%(+1.36)#4,206 |
| 71. | Hartford City | 2.2% | 1.7%(+0.520)#71 | 0.84%(+1.36)#4,209 |
| 72. | Winfield | 2.1% | 1.7%(+0.447)#72 | 0.84%(+1.28)#4,378 |
| 73. | Stanaford | 2.0% | 1.7%(+0.347)#73 | 0.84%(+1.18)#4,611 |
| 74. | Wellsburg | 2.0% | 1.7%(+0.336)#74 | 0.84%(+1.17)#4,639 |
| 75. | Wheeling | 2.0% | 1.7%(+0.324)#75 | 0.84%(+1.16)#4,667 |
| 76. | Albright | 2.0% | 1.7%(+0.297)#76 | 0.84%(+1.13)#4,724 |
| 77. | Boaz | 2.0% | 1.7%(+0.277)#77 | 0.84%(+1.11)#4,770 |
| 78. | St Marys | 1.9% | 1.7%(+0.267)#78 | 0.84%(+1.10)#4,791 |
| 79. | New Martinsville | 1.9% | 1.7%(+0.246)#79 | 0.84%(+1.08)#4,846 |
| 80. | Madison | 1.9% | 1.7%(+0.233)#80 | 0.84%(+1.07)#4,879 |
| 81. | Weirton | 1.9% | 1.7%(+0.218)#81 | 0.84%(+1.05)#4,924 |
| 82. | Sistersville | 1.8% | 1.7%(+0.117)#82 | 0.84%(+0.953)#5,190 |
| 83. | Weston | 1.8% | 1.7%(+0.105)#83 | 0.84%(+0.942)#5,225 |
| 84. | Ronceverte | 1.7% | 1.7%(+0.024)#84 | 0.84%(+0.860)#5,462 |
| 85. | Fayetteville | 1.7% | 1.7%(+0.006)#85 | 0.84%(+0.842)#5,522 |
| 86. | Clearview | 1.7% | 1.7%(-0.007)#86 | 0.84%(+0.830)#5,575 |
| 87. | Thomas | 1.6% | 1.7%(-0.054)#87 | 0.84%(+0.782)#5,743 |
| 88. | Parsons | 1.6% | 1.7%(-0.058)#88 | 0.84%(+0.779)#5,750 |
| 89. | Addison Webster Springs | 1.6% | 1.7%(-0.061)#89 | 0.84%(+0.776)#5,765 |
| 90. | Follansbee | 1.6% | 1.7%(-0.101)#90 | 0.84%(+0.736)#5,905 |
| 91. | Lost Creek | 1.6% | 1.7%(-0.103)#91 | 0.84%(+0.734)#5,918 |
| 92. | Glen Dale | 1.6% | 1.7%(-0.109)#92 | 0.84%(+0.728)#5,938 |
| 93. | Tunnelton | 1.6% | 1.7%(-0.119)#93 | 0.84%(+0.717)#5,969 |
| 94. | Kenova | 1.5% | 1.7%(-0.146)#94 | 0.84%(+0.691)#6,065 |
| 95. | Falling Waters | 1.5% | 1.7%(-0.151)#95 | 0.84%(+0.686)#6,080 |
| 96. | Farmington | 1.4% | 1.7%(-0.224)#96 | 0.84%(+0.612)#6,355 |
| 97. | Granville | 1.4% | 1.7%(-0.226)#97 | 0.84%(+0.610)#6,368 |
| 98. | West Liberty | 1.4% | 1.7%(-0.294)#98 | 0.84%(+0.542)#6,608 |
| 99. | Bluefield | 1.3% | 1.7%(-0.342)#99 | 0.84%(+0.494)#6,800 |
| 100. | Clarksburg | 1.3% | 1.7%(-0.349)#100 | 0.84%(+0.488)#6,832 |
Common Questions
What are the Top 10 Cities with the Highest Percentage of Population Employed in Utilities in West Virginia?
Top 10 Cities with the Highest Percentage of Population Employed in Utilities in West Virginia are:
What city has the Highest Percentage of Population Employed in Utilities in West Virginia?
Glen Jean has the Highest Percentage of Population Employed in Utilities in West Virginia with 58.1%.
What is the Percentage of Population Employed in Utilities in the State of West Virginia?
Percentage of Population Employed in Utilities in West Virginia is 1.7%.
What is the Percentage of Population Employed in Utilities in the United States?
Percentage of Population Employed in Utilities in the United States is 0.84%.