Zip Codes with the Highest Percentage of Population with a Degree in Science and Engineering in Cincinnati, OH
RELATED REPORTS & OPTIONS
Science and Engineering
Cincinnati
Compare Zip Codes
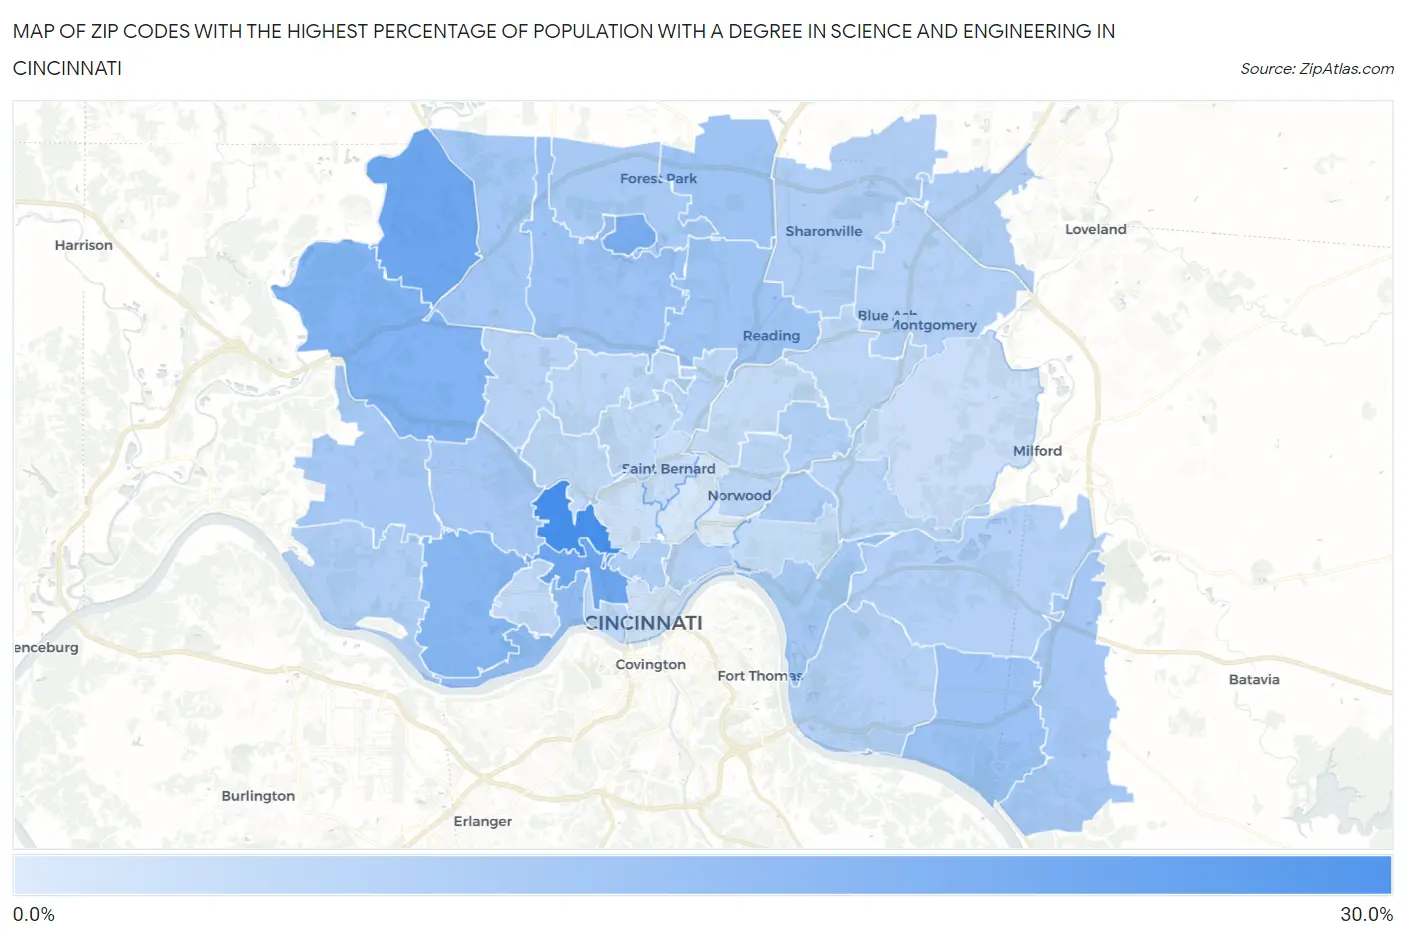
Map of Zip Codes with the Highest Percentage of Population with a Degree in Science and Engineering in Cincinnati
4.0%
27.5%
Zip Codes with the Highest Percentage of Population with a Degree in Science and Engineering in Cincinnati, OH
| Zip Code | % Graduates | vs State | vs National | |
| 1. | 45225 | 27.5% | 11.8%(+15.6)#85 | 9.8%(+17.7)#1,599 |
| 2. | 45214 | 21.0% | 11.8%(+9.23)#161 | 9.8%(+11.3)#2,951 |
| 3. | 45252 | 20.9% | 11.8%(+9.05)#164 | 9.8%(+11.1)#3,011 |
| 4. | 45218 | 18.9% | 11.8%(+7.10)#209 | 9.8%(+9.14)#3,834 |
| 5. | 45247 | 17.8% | 11.8%(+5.96)#239 | 9.8%(+7.99)#4,440 |
| 6. | 45238 | 16.8% | 11.8%(+5.01)#277 | 9.8%(+7.05)#5,090 |
| 7. | 45204 | 15.3% | 11.8%(+3.47)#352 | 9.8%(+5.50)#6,419 |
| 8. | 45231 | 13.8% | 11.8%(+2.01)#438 | 9.8%(+4.04)#8,101 |
| 9. | 45255 | 13.8% | 11.8%(+1.97)#446 | 9.8%(+4.00)#8,156 |
| 10. | 45246 | 13.3% | 11.8%(+1.52)#469 | 9.8%(+3.55)#8,713 |
| 11. | 45215 | 13.3% | 11.8%(+1.45)#473 | 9.8%(+3.48)#8,838 |
| 12. | 45251 | 12.4% | 11.8%(+0.588)#545 | 9.8%(+2.62)#10,197 |
| 13. | 45248 | 12.2% | 11.8%(+0.364)#564 | 9.8%(+2.40)#10,578 |
| 14. | 45211 | 12.1% | 11.8%(+0.242)#575 | 9.8%(+2.27)#10,797 |
| 15. | 45245 | 12.0% | 11.8%(+0.194)#577 | 9.8%(+2.23)#10,874 |
| 16. | 45226 | 11.8% | 11.8%(-0.056)#595 | 9.8%(+1.98)#11,367 |
| 17. | 45240 | 11.7% | 11.8%(-0.117)#600 | 9.8%(+1.92)#11,478 |
| 18. | 45209 | 11.1% | 11.8%(-0.666)#640 | 9.8%(+1.37)#12,529 |
| 19. | 45249 | 10.9% | 11.8%(-0.924)#659 | 9.8%(+1.11)#13,112 |
| 20. | 45241 | 10.8% | 11.8%(-0.977)#664 | 9.8%(+1.06)#13,226 |
| 21. | 45233 | 10.6% | 11.8%(-1.22)#687 | 9.8%(+0.809)#13,764 |
| 22. | 45219 | 10.5% | 11.8%(-1.34)#697 | 9.8%(+0.697)#14,014 |
| 23. | 45213 | 10.1% | 11.8%(-1.76)#734 | 9.8%(+0.276)#14,898 |
| 24. | 45242 | 9.9% | 11.8%(-1.87)#740 | 9.8%(+0.165)#15,144 |
| 25. | 45244 | 9.9% | 11.8%(-1.90)#742 | 9.8%(+0.133)#15,209 |
| 26. | 45230 | 9.9% | 11.8%(-1.90)#744 | 9.8%(+0.129)#15,221 |
| 27. | 45206 | 9.6% | 11.8%(-2.26)#767 | 9.8%(-0.226)#16,025 |
| 28. | 45239 | 9.4% | 11.8%(-2.41)#778 | 9.8%(-0.374)#16,379 |
| 29. | 45216 | 9.0% | 11.8%(-2.82)#798 | 9.8%(-0.788)#17,368 |
| 30. | 45227 | 8.9% | 11.8%(-2.89)#803 | 9.8%(-0.856)#17,505 |
| 31. | 45212 | 8.8% | 11.8%(-3.00)#807 | 9.8%(-0.970)#17,763 |
| 32. | 45236 | 8.8% | 11.8%(-3.03)#810 | 9.8%(-1.00)#17,843 |
| 33. | 45203 | 8.6% | 11.8%(-3.18)#814 | 9.8%(-1.15)#18,195 |
| 34. | 45224 | 8.6% | 11.8%(-3.25)#816 | 9.8%(-1.21)#18,316 |
| 35. | 45223 | 8.5% | 11.8%(-3.33)#823 | 9.8%(-1.29)#18,484 |
| 36. | 45205 | 8.0% | 11.8%(-3.77)#848 | 9.8%(-1.74)#19,533 |
| 37. | 45232 | 8.0% | 11.8%(-3.79)#849 | 9.8%(-1.76)#19,583 |
| 38. | 45237 | 7.6% | 11.8%(-4.24)#875 | 9.8%(-2.21)#20,588 |
| 39. | 45208 | 7.4% | 11.8%(-4.41)#885 | 9.8%(-2.38)#20,928 |
| 40. | 45217 | 6.8% | 11.8%(-4.97)#908 | 9.8%(-2.94)#22,001 |
| 41. | 45243 | 6.8% | 11.8%(-5.05)#911 | 9.8%(-3.02)#22,131 |
| 42. | 45202 | 6.5% | 11.8%(-5.36)#918 | 9.8%(-3.33)#22,654 |
| 43. | 45220 | 6.2% | 11.8%(-5.66)#932 | 9.8%(-3.63)#23,201 |
| 44. | 45229 | 5.0% | 11.8%(-6.86)#957 | 9.8%(-4.83)#24,800 |
| 45. | 45207 | 4.0% | 11.8%(-7.81)#980 | 9.8%(-5.78)#25,738 |
1
Common Questions
What are the Top 10 Zip Codes with the Highest Percentage of Population with a Degree in Science and Engineering in Cincinnati, OH?
Top 10 Zip Codes with the Highest Percentage of Population with a Degree in Science and Engineering in Cincinnati, OH are:
What zip code has the Highest Percentage of Population with a Degree in Science and Engineering in Cincinnati, OH?
45225 has the Highest Percentage of Population with a Degree in Science and Engineering in Cincinnati, OH with 27.5%.
What is the Percentage of Population with a Degree in Science and Engineering in Cincinnati, OH?
Percentage of Population with a Degree in Science and Engineering in Cincinnati is 9.1%.
What is the Percentage of Population with a Degree in Science and Engineering in Ohio?
Percentage of Population with a Degree in Science and Engineering in Ohio is 11.8%.
What is the Percentage of Population with a Degree in Science and Engineering in the United States?
Percentage of Population with a Degree in Science and Engineering in the United States is 9.8%.